
Abstract
Cytochrome P450 (CYP) enzymes are key players in drug metabolism. Therefore, it is essential to understand how these enzymes can be affected by xenobiotics with regards to induction and toxicity to avoid potential drug–drug interactions. Typically, information has been gathered by combining data from multiple experiments, which is time-consuming and labor intensive, and interassay variability may lead to misinterpretation. Monitoring CYP induction and cytotoxicity by xenobiotics using an automated, multiplexed format can decrease workload and increase data confidence. Here the authors demonstrate the ability to monitor CYP1A and CYP3A4 induction, combined with a cytotoxicity measurement, from a single microplate well using cryopreserved human hepatocytes. The assay procedure was automated in a 384-well format, including cell manipulations, compound titration and transfer, and reagent dispensing, using simple robotic instrumentation. EC50 and Emax values were derived for multiple known CYP1A and -3A4 inducers. Induction and toxicological responses in the triplex system were validated based on literature values from conventional single-parameter assays. Validation and pharmacology data confirm that multiplexed cell-based CYP assays can simplify workload, save time and effort, and generate biologically relevant data.
Keywords
Introduction
A
Here we demonstrate the ability to monitor CYP1A and CYP3A4 induction in human cryoplateable hepatocytes, combined with cytotoxicity measurements, from a single microplate well triplex format. The assay procedure was automated in a 384-well format, including cell manipulations, compound titration and transfer, and reagent dispensing, using robotic instrumentation. Four known CYP1A inducers and four known CYP3A4 inducers were used as control compounds to validate the triplex assay. Results show how measuring three critical responses from a single sample streamlines workflow, derives maximum value from human hepatocytes, and provides a means for reaching more biologically relevant interpretations.
Materials and Methods
Materials
P450-Glo CYP3A4 Assay with Luciferin-IPA and CellTiter-Glo Luminescent Cell Viability Assay were obtained from Promega Corporation (Madison, WI). Each P450-Glo CYP3A4 assay kit contains Luciferin-IPA substrate (3 mM), lyophilized Luciferin Detection Reagent, and Reconstitution Buffer with Esterase. Each CellTiter-Glo assay kit contains CellTiter-Glo buffer and lyophilized CellTiter-Glo substrate.
Female human cryoplateable hepatocytes (donors 1 and 2), male human cryoplateable hepatocytes (donor 3), InVitro GRO CP medium, InVitro GRO HI medium, InVitro GRO KHB, and Torpedo Antibiotic Mix were obtained from Celsis In Vitro Technologies (Baltimore, MD).
Resorufin ethyl ether, rifampicin, 3-methylcholanthrene, β-napthoflavone, phenylbutazone, salicylamide, and DMSO were purchased from Sigma-Aldrich (St. Louis, MO). Omeprazole, lansoprazole, SR12813, and dexamethasone were purchased from Tocris Bioscience (Ellisville, MO).
Liquid handling
An EL406 Combination Washer Dispenser from BioTek Instruments (Winooski, VT) was used to dispense cells and reagents, as well as perform media exchanges and media removal in the cell plates. The instrument contains a 96-tube wash manifold, a peristaltic pump, and two syringe pumps for dispensing. The peristaltic pump was used to dispense cells, media, and diluted Luciferin-IPA substrate to the 384-well cell plates; the wash manifold was used to aspirate media from the cell plates; and the two syringe pumps were used to dispense assay reagents to the same plates.
A Precision Microplate Sample Processor from BioTek Instruments was used to perform compound titrations and dispense compounds to the cell plate wells. The instrument was also used to transfer media containing Luciferin-IPA substrate from cell plates to white luminescent plates and dispense reconstituted Luciferin Detection Reagent to the plates. The instrument contains a single-channel pipetting head, an eight-channel bulk reagent dispenser, and an eight-channel pipetting head.
Luminescent and fluorescent signal detection
All assay plates were read using a Synergy H4 Hybrid Multi-Mode Microplate Reader from BioTek Instruments. The luminescence mode was used to measure the P450-Glo and CellTiter-Glo assay signals, using a 1.0-s integration time. Automatic sensitivity adjustment was used to detect the plate well containing the highest luminescent signal. The gain setting is automatically adjusted to the well’s signal. Fluorescent mode was used to measure the resorufin signal from the ethoxyresorufin-O-deethylase (EROD) assay, using a 530/20-nm excitation filter, a 590/35-nm emission filter, and a 550-nm cutoff dichroic mirror.
Methods
Cell preparation
Cryopreserved hepatocytes were thawed and resuspended in InVitro Gro CP medium as described in the Celsis IVT instructions. The cells were counted using Trypan blue exclusion and diluted to 4 × 10⁵ viable cells/mL for plating. A volume of 25 µL/well was dispensed into the 384-well collagen I cell culture microplates for a seeding density of approximately 180 000 viable cells per cm2. All cell plates were then incubated in a 37 °C/5% CO2 tissue culture incubator for 48 h before compound addition. After 24 h, medium was removed from the cell plates, and an equal volume of fresh InVitro Gro CP medium was added to each plate.
CYP assays and substrate preparation
The CYP3A4 assay uses the luminogenic CYP3A4 substrate Luciferin-IPA, which is very selective for CYP3A4 over other CYP enzymes.5,6 This pro-luciferin is converted by CYP3A4 to an active form of luciferin that is detected with a luciferin detection reagent that contains a luciferase enzyme that generates a signal proportional to the amount of CYP reaction product formed. The CYP1A assay uses the resorufin ethyl ether pro-fluorescent CYP1A substrate. This substrate is converted by CYP1A1 and CYP1A2 to a fluorescent resorufin product that produces a signal proportional to CYP1A activity. The assays are referred to here as CYP3A4 and CYP1A in deference to the substrate selectivities. The Luciferin-IPA and resorufin ethyl ether were incubated with the cells for 60 and 30 min, respectively ( Table 1 ). These incubation times have previously been shown to be within the linear range for the CYP3A4 and CYP1A reactions (data not shown). The 3-mM Luciferin-IPA stock solution was diluted 1:1000 in InVitro Gro HI medium to create a final working concentration of 3 µM. A 100% DMSO stock of salicylamide (an inhibitor of secondary resorufin metabolism) and resorufin ethyl ether was each created at 3 M and 1 mM, respectively. The salicylamide stock solution was then diluted in InVitro Gro KHB buffer to create a 3-mM working concentration. The resorufin ethyl ether stock solution was diluted in InVitro Gro KHB buffer containing 3 mM salicylamide to create a 2-µM working concentration.
Automated Triplexed 384-Well CYP Induction Protocol
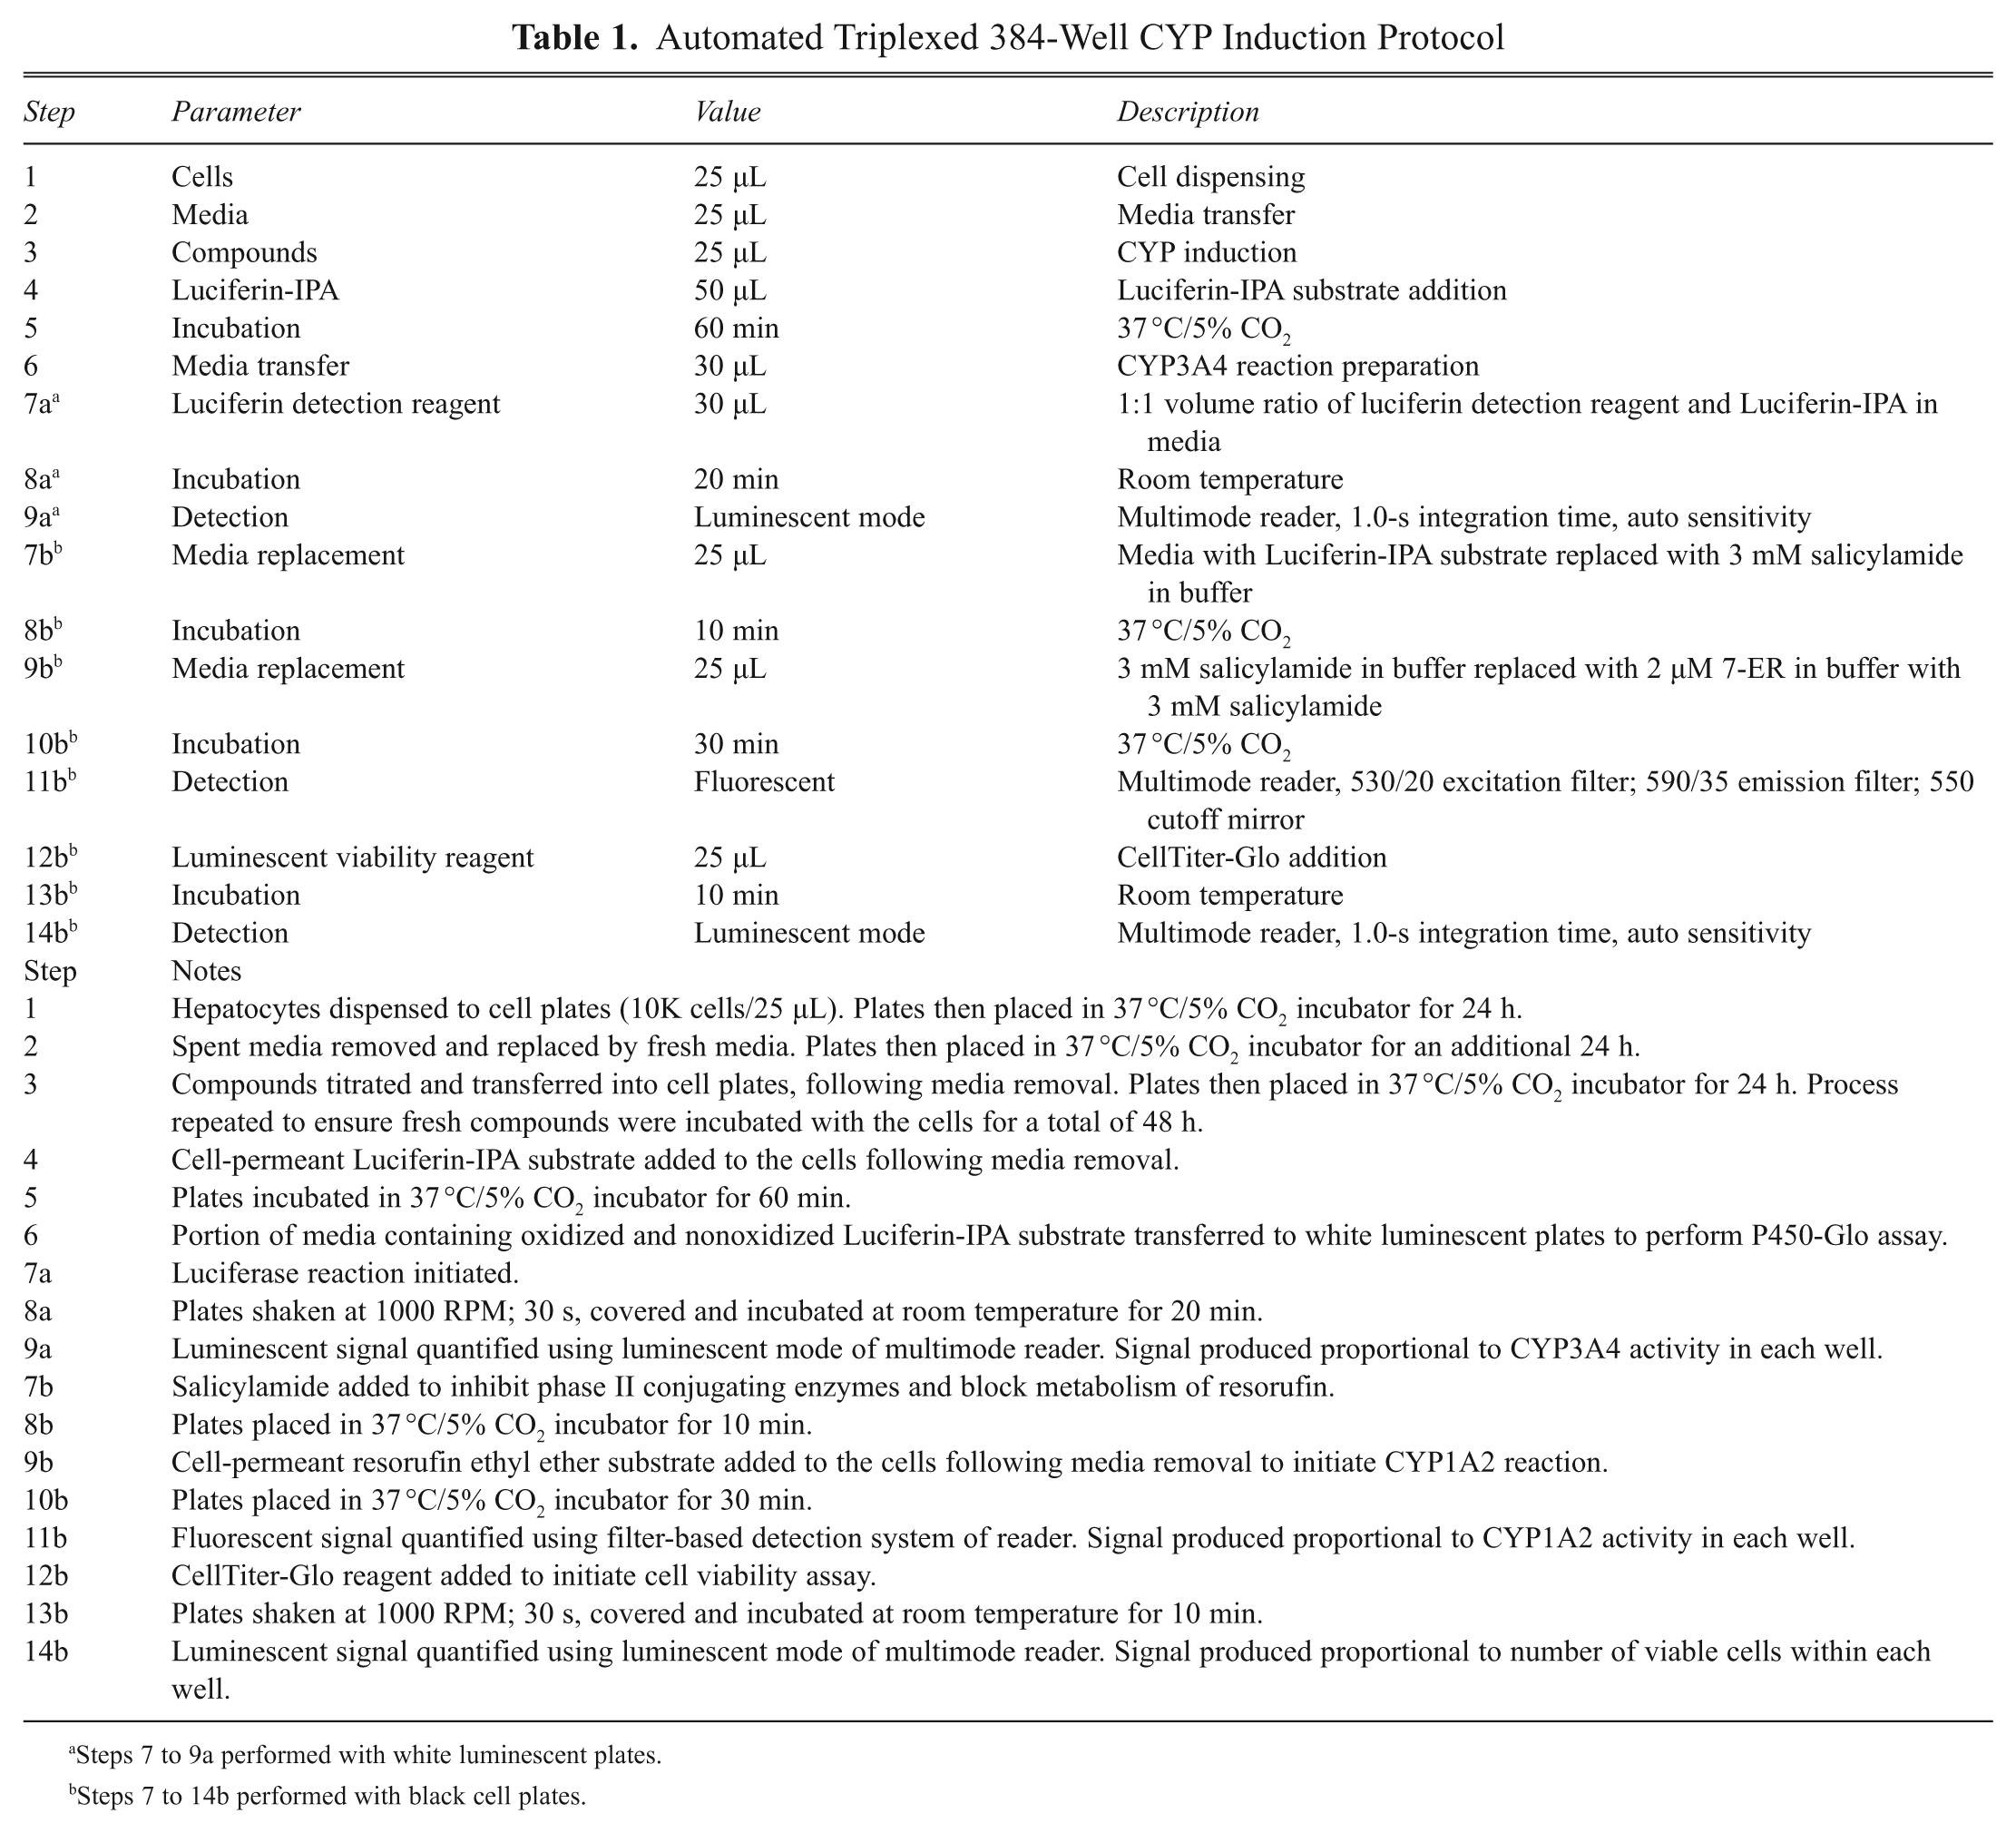
Steps 7 to 9a performed with white luminescent plates.
Steps 7 to 14b performed with black cell plates.
Luminescent detection reagent preparation
Reconstituted Luciferin Detection Reagent (LDR) was prepared by adding Reconstitution Buffer with Esterase to the lyophilized LDR. Reconstituted CellTiter-Glo reagent (CTG) was prepared by adding CellTiter-Glo buffer to the lyophilized CellTiter-Glo substrate.
Compounds
All compounds were dissolved in 100% DMSO. Omeprazole (Omep), β-napthoflavone (β-NF), phenylbutazone (Pb), and dexamethasone (Dex) were prepared at 100 mM; lansoprazole (Lpz) was prepared at 60 mM; 3-methylcholanthrene (3-MC) and rifampicin (Rif) were prepared at 10 mM; and SR12813 (SR) was prepared at 1 mM. Omep and Rif were diluted to 10 µM in 0.5% DMSO for the Z′ factor validation. For the EC50 determination, all test compounds were serially diluted 1:2 in 100% DMSO, starting at the concentration prepared. Each titration series was then diluted 1:200 in media to create the final concentrations used to test for CYP induction. Final DMSO concentrations were 0.5%.
Data analysis
P450-Glo CYP3A4 and resorufin CYP1A signals were measured in relative luminescent units (RLU) and relative fluorescent units (RFU), respectively. Signals from vehicle-alone treated cells are referred to as basal. The average of the no–cell fluorescent or luminescent background was subtracted from the individual signals to give net values. Net values were then divided by the CTG viability signal, as measured by RLU, from the same well to provide values normalized to cell number. Fold induction (treated wells/basal wells) was calculated from net, normalized values. The CTG basal values were set as 100% cell viability, and treated cell viability was calculated relative to this value.
The coefficient of variation (CV) for the CTG signal in the hepatocyte dispensing validation was computed by dividing the standard deviation (σ) among the replicates by the mean (µ) of the same replicate group. This fraction is expressed as a percentage to create the following formula: (σ(Replicates)/µ(Replicates)) × 100.
Z′ factors (Z′) were determined from 48 replicate wells containing 10 µM inducer (positive control) and 48 replicate wells containing 0 µM inducer (negative control). 7 EC50s were computed using a one-site hyperbola equation: Y = Ymax × X/ (EC50 + X) + C. The zero compound value was set as a constant (C) equal to 1, Y = fold induction, X = [inducer], and EC50 = half maximal induction, with Prism Software, version 5.03, from GraphPad Software (La Jolla, CA).
Automated workflow
Assay setup
Table 1 describes the general automated multiplexed assay protocol. Labcon (Petaluma, CA) 200-µL robotic tips: sterile, low retention were used for diluent addition and serial dilutions and to transfer the dilution series to 384-well cell plates. Dilutions were carried out in 96-well format using Corning (Corning, NY) 96-well clear, round-bottom, polypropylene plates. The hepatocytes were plated in collagen I 384-well black, clear-bottom microplates. Media from incubations containing Luciferin-IPA were transferred to and combined with LDR in Corning 384-well white, flat-bottom, polystyrene, nontreated plates.
Cells, media, compounds, salicylamide, resorufin ethyl ether, and CTG were dispensed at 25-µL volumes, and Luciferin-IPA in medium was dispensed at a 50-µL volume. The medium transfer following the substrate incubation and LDR addition were completed using a 30-µL volume. All assay plates were mixed on an orbital shaker for 30 s at approximately 1000 RPM following the LDR and CTG additions to increase reaction consistency among replicates. According to the manufacturer’s protocols, LDR is stable at room temperature for 24 h, and CTG is stable at room temperature for up to 8 h.
Hepatocyte dispensing validation
The EL406’s ability to properly dispense hepatocytes in a 384-well format was validated by analyzing the CV of the luminescent cell viability signal from replicate wells. Hepatocytes were dispensed at 25 µL, into columns 1 to 22 of the 384-well collagen I–coated black, clear-bottom microplates described previously. A total of 10 000 cells were dispensed into each well of the 384-well plates. The cell plates were then placed into a 37 °C/5% CO2 cell incubator for 24 h. After incubation, 25 µL of reconstituted CTG was dispensed to each test plate well. The plates were covered, shaken at approximately 1000 RPM for 30 s, and incubated for 10 min at room temperature. The luminescent signal from each well was then quantified using the Synergy H4 microplate reader. The CV was then determined.
Z′ factor validation
The quality of the automated assay was assessed before proceeding with the compound profiling. Hepatocytes from donor 1 were dispensed into the first eight rows of a collagen I 384-well cell plate per Table 1 . The cells were incubated for 48 h, with fresh media applied to the cells after 24 h. Forty-eight replicates of 10 µM or 0 µM inducer, diluted in InVitro Gro HI media, were then added to the 384-well cell plate following media removal. The final DMSO concentration was 0.5%. Omep was the CYP1A assay inducer, and Rif was the CYP3A4 assay inducer. Wells containing 10 µM inducer represent the positive control, whereas the wells containing 0 µM inducer represent the negative control. The process was repeated after 24 h, and the remainder of the assay was performed per Table 1 . Fold induction by the 10-µM inducer and the Z′ factor for each automated assay were then computed.
EC50 and Emax validation
The automated triplex assay was run as described in Table 1 using known inducers of CYP1A (Omep, β-NF, 3-MC, Lpz) and CYP3A4 (Pb, Rif, SR, Dex). Compound serial 1:2 dilutions were performed using the Precision for half maximal (EC50) and maximum fold induction (Emax) determinations. Each concentration–response curve included a vehicle control point. The assay was run in a 384-well format.
CYP induction profiling
To test the CYP profiling triplex validity and reproducibility, assays were run using three hepatocyte donors. Three separate runs were performed on separate days with hepatocytes from donor 1, whereas one run was performed with hepatocytes from donors 2 and 3. Hepatocytes were dispensed in a 384-well format with the EL406 and incubated for 48 h, including medium exchange. Following the incubation, serial 1:2 titrations were performed with eight separate compounds to create the titration curves. Following media removal, the titrated compounds were added to the wells. Final starting concentrations were 500 µM for Omep, β-NF, Pb, and Dex; 300 µM for Lpz; 50 µM for 3-MC and Rif; and 5 µM for SR. The remainder of the automated triplex assay was performed as described above.
Results and Discussion
Hepatocyte dispensing validation
A target cell density of 180 000 hepatocytes per cm2 was used to achieve a confluence above 90%, which is concordant with literature values. 8 To assess automated hepatocyte dispensing precision to obtain equivalent cell density between wells, a CV was calculated from the luminescent cell viability signals detected among the 352 replicate wells tested in the 384-well format. The CV value measured was 4.34%, which compares favorably with previously reported values for automated reagent dispensing of 4% to 10%. 9
Z′ factor validation
The 384-well CYP1A and CYP3A4 induction assay quality was assessed by performing Z′ factor determinations. Z′ factor, as a statistical parameter, is commonly used for assay quality assessment in drug discovery applications. Therefore, it is widely adopted as a measurement of automated assay quality where a value ≥0.5 is considered an excellent assay, providing a basis for accurate pharmacological measurements. The Z′ values were 0.73 and 0.77 for CYP1A induction by Omep and CYP3A4 induction by Rif, respectively, and these values indicate high-quality assays. 7
Automated triplex assay performance
To evaluate the automated triplex assay performance, dose–response treatments with known inducers of CYP1A and CYP3A4 enzymes were carried out along with a cell viability measurement ( Fig. 1 ). Relative viable cell signals measured with this assay, which correlates adenosine triphosphate (ATP) content with viable cell number, are not influenced by the CYP substrates applied at the concentrations used in the triplex format (data not shown). Three independent assay tests using donor 1 hepatocytes and single tests with donor 2 and 3 hepatocytes were performed. Fold stimulation was determined at each concentration across a dose range of the two compounds. The calculation of fold induction (induced signal/basal signal) requires assay chemistries that are sensitive enough to significantly detect basal activity signals over assay background. The CYP assays gave robust basal measurements that varied among the donors with an average signal/noise for CYP3A4 of 49 for the three runs with donor 1, as well as 32 and 14 for donors 2 and 3 (S/N = signal mean/standard deviation of the background). For the CYP1A assays, the basal S/N values for the three runs were 25 for donor 1, as well as 14 and 11 for donors 2 and 3. In each case, basal signals were significantly higher than background as evidenced by unpaired t test p values <0.0001.
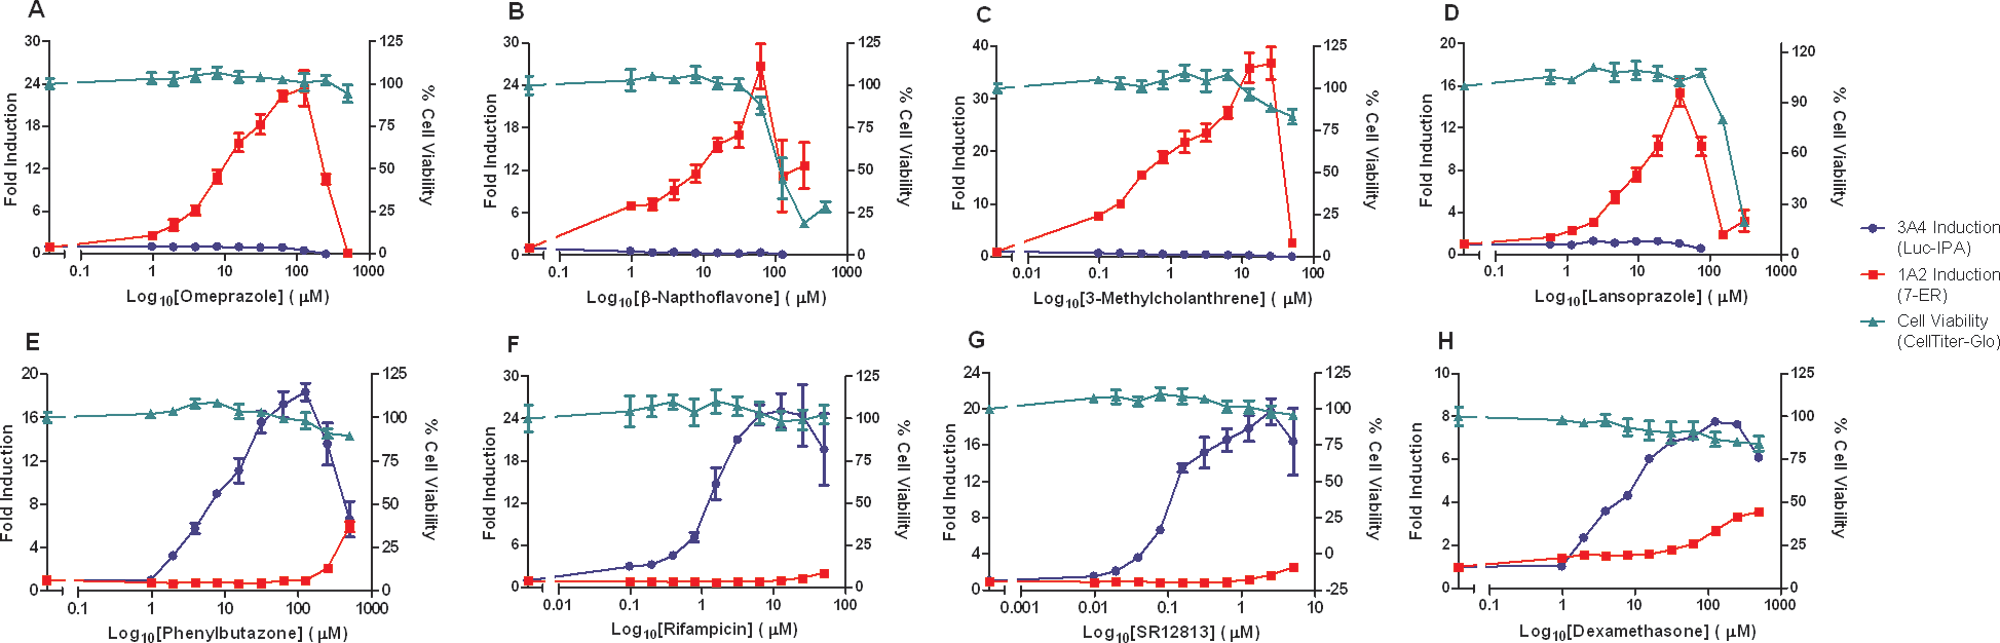
Fold induction/cell viability. A dilution series was created for each compound, using a 1:2 dilution scheme. (
We tested the triplex system using eight compounds that are well documented as CYP1A2 and -3A4 inducers via associated AHR and PXR nuclear receptors. Omep, β-NF, and 3-MC are recognized as preferred CYP1A2 inducers, as noted in the FDA Guidance for Industry, 1 due to their extensive references, 10 and from regulatory submissions. In addition, Lpz has been cited as a potent CYP1A2 inducer. 11 For PXR activation and CYP3A4 induction, Rif is cited as a preferred inducer, whereas Dex is considered an acceptable inducer according to the FDA Guidance for Industry. 1 Rif is well documented as a positive control for PXR activation and subsequent CYP3A4 induction. 10 Dex,10,12 SR, 13 and Pb 14 are also potent CYP3A4 inducers.
Figure 1 represents the data generated with the eight inducers for a single run with a single hepatocyte donor. Maximal increases between 11- and 48-fold were seen in the CYP1A assay from the known AHR receptor activators across the concentration–response curve, with no discernable activation seen with the CYP3A4 assay. The opposite is true with the known PXR activators, where a maximal 5- to 30-fold increase was seen in the CYP3A4 assay and minor activation seen with the CYP1A assay at the highest concentrations. Notably, Pb had a fold induction value for CYP1A of 5.9 at 500 µM. Substantial negative cell viability effects were observed at high concentrations with β-NF and Lpz. This loss in cell viability at approximately 100-µM compound concentrations and higher corresponds to marked changes in apparent fold induction trends for each compound.
The test compound induction potency can be expressed as an EC50 that represents the concentration where half maximal induction is observed. These values were calculated from curve fits of the ascending portion of the induction profiles ( Fig. 2 ). The three donors varied in basal, Emax, and EC50, as is commonly observed when different donors are compared ( Table 2 ). 14 However, in considering Rif and Omep respectively as prototypical CYP1A and CYP3A4 inducers, variability for induction from run to run and donor to donor was minimal at less than twofold. Specifically, for the three runs with donor 1, CVs for EC50 and Emax were 63% and 24% for CYP1A Omep induction and 24% and 32% for CYP3A4 Rif induction. Across the three donors, CVs for EC50 and Emax were 44% and 51% for CYP1A Omep induction and 62% and 13% for CYP3A4 Rif induction. The EC50 values measured here are consistent with previously reported values for AHR activation by Omep of 5.9 µM, 15 as well as for PXR activation by Rif of 0.8 µM. 16 The EC50 values can also be arranged to create rank orders of potency for CYP1A: 3-MC < β-NF ≈ Omep < Lpz, or CYP3A4: SR < Rif < Dex < Pb.
Compound EC50/Emax Values
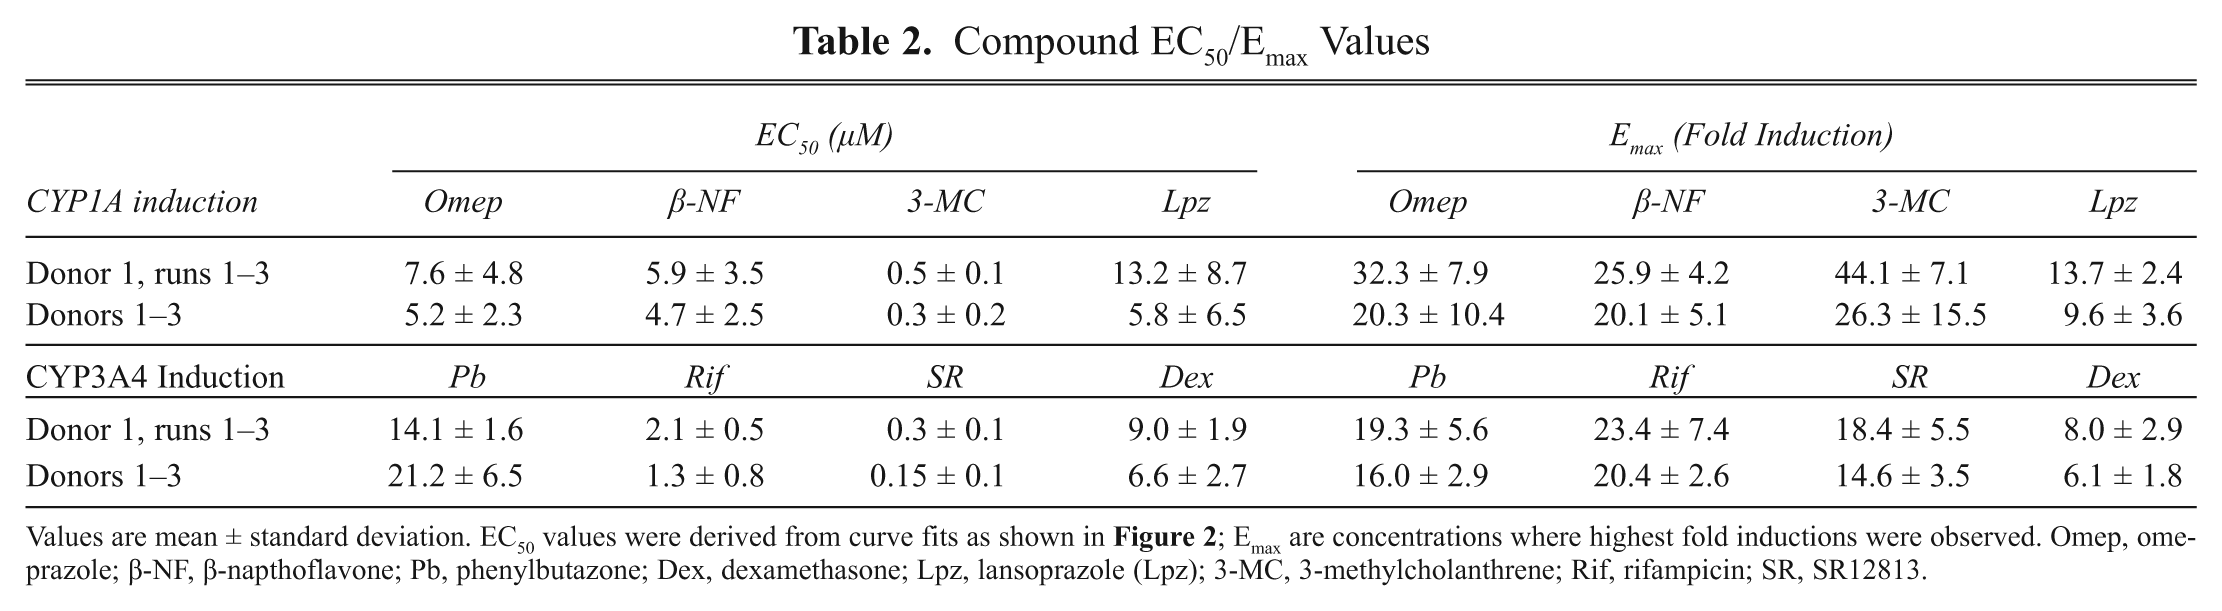
Values are mean ± standard deviation. EC50 values were derived from curve fits as shown in Figure 2 ; Emax are concentrations where highest fold inductions were observed. Omep, omeprazole; β-NF, β-napthoflavone; Pb, phenylbutazone; Dex, dexamethasone; Lpz, lansoprazole (Lpz); 3-MC, 3-methylcholanthrene; Rif, rifampicin; SR, SR12813.
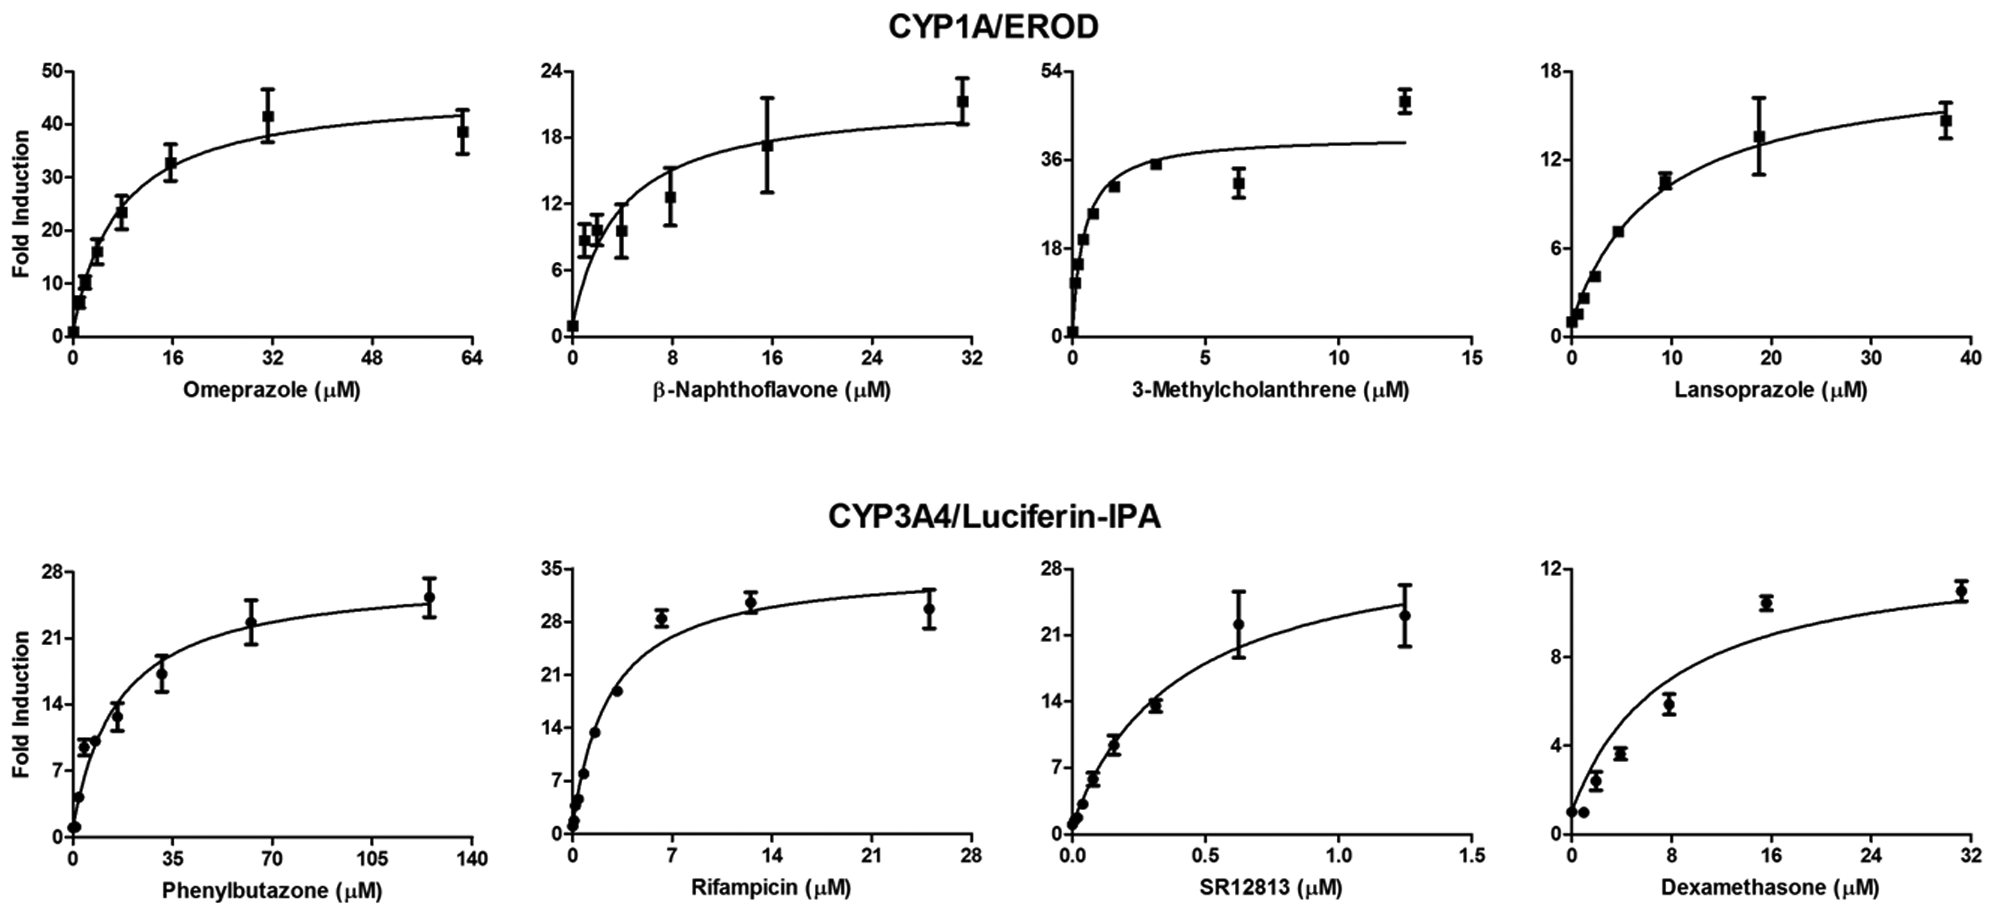
Dose-dependent CYP induction. The ascending phase of dose-dependent CYP1A and CYP3A4 induction responses from run 3 with donor 1 are shown. Fold induction values were calculated for each of four replicate samples at each drug concentration; the mean ± SD is shown. Fold induction is the fluorescent (CYP1A/EROD) or luminescent (CYP3A4/Luciferin-IPA) value divided by the average of the vehicle-treated controls (n = 4). The calculated EC50 values are presented in Table 2 .
The data may be used in more complex calculations from other in vitro induction models such as PXR transactivation, where effect may be calculated from Emin, Emax, EC50, and Hill coefficient values. 17 As well, this system may be redesigned to increase the compounds tested by limiting to one concentration for rank ordering of compounds or calculating induction potential as a positive control percentage. These benefits are compounded by the fact that both CYP1A and CYP3A4 data were generated from the same well, providing a direct comparison without potential confounding variability from separate well conditions, compound dosing, and signal generation.
Data quality was enhanced in the triplex assay by providing a viability component and generating induction data from the same well. In this way, data were normalized to account for any hepatocyte dispensing and culturing variations within the same experiment or from experiments carried out on different days. Besides an experimental variation control, viability can be used to determine compound toxicity within the concentration– response curve to aid in induction data interpretation. For instance, Lpz produced an Emax for CYP1A induction at 37.5 µM concentration and showed a substantial decline above that concentration ( Fig. 1 ). Viability also declined between 75 and 300 µM, indicating that decreased fold-induction in this range was influenced by Lpz toxicity. A similar trend was observed for β-NF. Conversely, the other compounds caused little or no loss in viability across the concentration–response curve. Nevertheless, at high concentrations, they did cause slight (Rif, SR, Dex) or substantial (Omep, 3-MC, Pb) declines in fold induction compared to Emax. This may be interpreted as an induction mechanism suppression or CYP inhibition. 18 It is also noteworthy that modest basal CYP3A4 inhibition was observed at high Omep and Lpz concentrations. Omep is a known CYP3A4 substrate that apparently acts here as a competitive CYP3A4/Luciferin-IPA reaction inhibitor. 19 The apparent inhibition of CYP3A4 by Lpz must be understood in light of its toxicity in the inhibitory concentration range. 20 Conversely, CYP1A induction was observed at the high end of the CYP3A inducer concentration ranges (Pb, SR, Dex). Pb presented a more complex action, where Emax for CYP3A4 was observed at 125 µM with lower CYP3A4 induction at 250 and 500 µM, whereas CYP1A induction was observed at 250- and 500-µM concentrations. Nevertheless, effects observed at high concentrations that are not explained in terms of cytotoxicity should be interpreted with caution due to the potential for off-target effects or toxicities that fall short of causing ATP depletion.
The triplex assay described here offers a straightforward and robust way to assess test compound effects on CYP1A and CYP3A4 enzymes, as well as any potential toxic effects that these compounds might have. The induction data generated from known inducers provided an assay quality and utility assessment for human cryopreserved hepatocytes in a 384-well format. The miniaturized format allowed for quantitative Emax and EC50 measurements from fewer hepatocytes than used in a traditional larger well plate format. The procedure was easily automated using instrumentation that ensures sterile manipulation of cells, media, and assay components. Hepatocyte dispensing, Z′ factor, and EC50 validation data illustrate the automated assay’s capability to deliver accurate and reproducible data. The mixing of viability, CYP1A, and CYP3A4 assays in an automated and miniaturized format provides complex data sets in a single pass. This approach optimizes data extraction from hepatocytes, a costly reagent; minimizes resource time; and provides a basis for more biologically relevant data interpretations than can be achieved with a single-parameter assay. The combination of assays and instrumentation provides a practical solution for automated CYP induction profiling.