
Abstract
A fluorescence-based continuous-flow enzyme affinity detection (EAD) setup was used to screen cytochrome P450 BM3 mutants on-line for diversity. The flow-injection screening assay is based on the BM3-mediated O-dealkylation of alkoxyresorufins forming the highly fluorescent product resorufin, and can be used in different configurations, namely injection of ligands, enzymes and substrates. Screening conditions were optimized and the activity of a library of 32 BM3 mutants towards the recently synthesized new probe substrate allyloxyresorufin was measured in flow-injection analysis (FIA) mode and it was shown that large activity differences between the mutants existed. Next, six BM3 mutants containing mutations at different positions in the active site were selected for which on-line enzyme kinetics were determined. Subsequently, for these six BM3 mutants affinity towards a set of 30 xenobiotics was determined in FIA EAD mode. It was demonstrated that significant differences existed for the affinity profiles of the mutants tested and that these differences correlated to alterations in the BM3 mutant-generated metabolic profiles of the drug buspirone. In conclusion, the developed FIA EAD approach is suitable to screen for diversity within BM3 mutants and this alternative screening technology offers new perspectives for rapid and sensitive screening of compound libraries towards BM3 mutants.
Keywords
Introduction
C
A very promising candidate to achieve this goal is the microbial P450 BM3 (CYP102A) from Bacillus megaterium because it is the most active P450 so far identified and is a soluble and highly stable enzyme. 7 P450 BM3 is a catalytically self-sufficient flavocytochrome containing a P450 heme domain and a β-nicotinamide adenine dinucleotide phosphate (NADPH)–dependent diflavin reductase domain in 1 polypeptide chain. 8 These characteristics, in combination with the availability of crystal structures and large-scale production and purification protocols, make P450 BM3 an ideal candidate for protein engineering and application in biocatalytic processes. Rational design and directed evolution have already been successfully employed, both separately and in tandem, to generate P450 BM3 mutants that are capable of metabolizing both native and nonnative substrates with increased activities and altered regio- and stereoselectivities. These substrates include aromatics, 9 alkanes, 10 hydrocarbons, 11 carboxylic acids, 12 and pharmaceuticals. 13-18
A bottleneck in the identification of novel P450 BM3 mutants generated by random or saturation mutagenesis techniques is the screening process. Direct monitoring of the reaction of interest by either gas chromatography (GC) or liquid chromatography/mass spectrometry (LC/MS) is time-consuming, requires costly equipment, and is not suitable for high-throughput screening (HTS). To overcome these limitations, several colorimetric HTS assays have been developed that make use of the Purpald, 19 4-AAP, 20 or NBP assay 21 ; monitor NADPH consumption 22 ; measure indigo formation 23 ; or are based on the conversion of pNCA. 24 Although these assays are suitable to screen BM3 libraries for mutants with improved properties, some limitations still exist. For example, measuring improved catalytic activity by monitoring cofactor depletion 22 is not very sensitive, and uncoupling of the mutant enzymes can result in false-positive signals. 25 Lussenburg et al. 26 have developed a sensitive fluorescence-based HTS assay that is based on the O-dealkylation of drug-like alkoxyresorufin molecules to yield the extremely fluorescent resorufin product. 27,28 Inhibition studies with this assay enabled the identification of novel ligands that are able to bind to P450 BM3 mutants. In the present study, this fluorescence-based screening assay was translated into a continuous-flow bioassay and applied to test affinities of compound series toward BM3 mutants.
It has already been shown by Kool et al. 29-31 that flow injection analysis (FIA) can be used to determine affinities of ligands toward P450s in an enzyme affinity detection (EAD) setup. The aim of this study was to use the same strategy to develop an alternative approach to screen BM3 mutants for diversity, and for this purpose, 3 different EAD setups were used. In the first setup, mutants were injected and mixed on-line with the substrate allyloxyresorufin and the cofactor (NADPH) to screen for mutant diversity by monitoring the allyloxyresorufin O-dealkylation (AROD) activities. In the second setup, different amounts of allyloxyresorufin were injected and mixed on-line with the enzyme and NADPH to determine enzyme kinetics and further investigate the kinetic differences between mutants. In the third setup, a selection of drug-like molecules were injected and mixed on-line with enzyme, allyloxyresorufin, and NADPH to perform on-line affinity profiling and investigate a selection of mutants for differences in inhibition patterns. Structural differences in the active site can influence the inhibition pattern of a BM3 mutant and can possibly lead to altered substrate selectivities and/or an altered metabolic regiospecificity. We subsequently tested if the differences in affinity profiling are predictive for alterations in the BM3 mutant-mediated metabolism of the drug buspirone. We demonstrate here that on-line affinity profiling can be used as a tool to reflect changes in regiospecificity between BM3 mutants.
Materials and Methods
Chemicals
All solvents used were of high purity for high-performance liquid chromatography (HPLC) and purchased from Sigma-Aldrich (Zwijndrecht, The Netherlands) unless stated otherwise. Ethylenediaminetetraacetic acid (EDTA), dithiothreitol (DTT), and NADPH were obtained from Applichem (Lokeren, Belgium). DMSO potassium dihydrogenphosphate (KH2PO4) and dipotassium hydrogenphosphate (K2HPO4) were obtained from Riedel de Haën (Seelze, Germany). Enzyme-linked immunosorbent assay (ELISA) blocking reagent was purchased from Roche (Mannheim, Germany). Glucose-6-phosphate and glucose-6-phosphate dehydrogenase were purchased from Sigma-Aldrich. All other chemicals were of analytical grade and obtained from standard suppliers unless stated otherwise.
Synthesis
7-Methoxy- and 7-ethoxyresorufin were synthesized as described previously. 32 7-Allyloxyresorufin was synthesized from resorufin as the starting material as follows. To a solution of resorufin sodium salt (50 mg, 213 µmol) in dry dimethylformamide (DMF; 10 mL), allyl bromide (500 µL, 4.13 mmol) was added. Subsequently, the reaction mixture was sonicated for 4 h at 30 °C under an atmosphere of nitrogen. The color of the purple suspension gradually turned to a clear dark orange solution. Completion of the reaction was followed by thin-layer chromatography (TLC), as described previously. 32 After completion of the reaction, the mixture was added to 250 mL ice-cold water and extracted with ethyl acetate (EtOAc). The organic extract was dried over anhydrous Na2SO4, filtered, and concentrated by rotary evaporation. After reuptake in 200 mL EtOAc, residues of DMF and remaining traces of the highly fluorescent resorufin were removed by repeated washing with ice-cold 1% NaHCO3. After evaporation of the organic solvent to dryness, an orange residue resulted, which, according to 1H–nuclear magnetic resonance (NMR), consisted of 7-allyloxyresorufin (>95% pure). 1H-NMR (400.13 MHz, DMSO-d 6): δ 7.76 (1H, d, J = 8.8 Hz), 7.51 (1H, d, J = 9.8 Hz), 7.11 (1H, d, J = 2.6 Hz), 7.06 (1H, dd, J = 8.8, 2.6 Hz), 6.77 (1H, dd, J = 9.8, 1.9 Hz), 6.25 (1H, d, J = 1.9 Hz), 6.05 (1H, ddt, J = 17.2, 10.8, 6.0 Hz), 5.43 (1H, dd, J = 17.2, 1.5 Hz), 5.30 (1H, d, J = 10.8, 1.5 Hz), 4.73 (1H, d, J = 6.0 Hz).
Enzymes and plasmids
The bacterial P450 BM3 mutants M01, M02, M05, and M11 in the pET28a+ vector were described previously.
28
Five different site-directed mutants of BM3 M01 were constructed: A74E (MT41), S72D (MT43), S72E (MT44), A82W (MT80), and A82C (MT81). Seven different site-directed mutants of BM3 M11 were constructed: L437E (MT32), L437N (MT33), L437S (MT35), L437T (MT36), A74E (MT34), A74D (MT37), and S72D (MT38). The mutations (see
The M01, M02, M05, and M11 mutant proteins were expressed as described previously. 13 The His-tagged pET28a+ constructs of all other mutants used in this study were transformed into Escherichia coli BL21 (DE3) cells using standard procedures. For expression, 600 mL Terrific Broth (TB) 35 medium (24 g/L yeast extract, 12 g/L tryptone, 4 mL/L glycerol) with 30 µg/mL kanamycin was inoculated with 15 mL of an overnight culture. The cells were grown at 175 rpm and 37 °C until the OD600 reached 0.6. Then, protein expression was induced by the addition of 0.6 mM isopropyl-β-D-thiogalactopyrasonide (IPTG). The temperature was lowered to 20 °C, and 0.5 mM of the heme precursor δ-aminolevulinic acid was added. Expression was allowed to proceed for 18 h. Cells were harvested by centrifugation (4600 g, 4 °C, 25 min), and the pellet was resuspended in 20 mL KPi-glycerol buffer (100 mM potassium phosphate [KPi] pH 7.4, 10% glycerol, 0.5 mM EDTA, and 0.25 mM DTT). Cells were disrupted using a French press (1000 psi, 3 repeats), and the cytosolic fraction was separated from the membrane fraction by ultracentrifugation of the lysate (120,000 g, 4 °C, 60 min).
Instrumentation
Two Knauer K-500 HPLC pumps (Berlin, Germany) were used to control the 120-mL superloops, made in house, containing enzyme (BM3) and cofactor/substrate (NADPH/allyloxyresorufin), respectively, and 1 Knauer K-500 HPLC pump was used for delivery of the injected samples. The BM3 and NADPH/allyloxyresorufin solutions were prepared in potassium phosphate buffer (100 mM; pH 7.4). Both superloops were kept on ice. Flow restrictors were inserted between the pumps and the superloops to ensure proper operation of the pumps at low flow rates. The flow restrictors consisted of natural polyetheretherketone (PEEK) tubing and gave back pressures of approximately 50 bar. The pressure limits of the pumps were set 20 bar higher than the working pressure, and VICI Jour backpressure regulators (Schenkon, Switzerland) were inserted after the superloops to prevent damage due to possible clogging of the system. For injections of samples, a Gilson 234 autoinjector (Villiers-le-Bel, France) equipped with a Rheodyne (Bensheim, Germany) 6-port injection valve (injection loop, 10 µL) was used. To maintain reaction coils at a constant temperature, a Shimadzu CTO-10AC column oven (Duisburg, Germany) was integrated in the system. An Agilent 1100 (Waldbronn, Germany) series fluorescence detector (λex 530 nm; λem 580 nm) was used for monitoring fluorescence. All hardware was integrated in 1 system by Kiadis B.V. (Groningen, The Netherlands) and was controlled by software developed by Kiadis B.V.
BM3 activity screening in microplate reader format
Microplate reader assays were used for validation of the BM3 EAD system in FIA mode and were carried out in black-bottomed PP-96-well microplates from Greiner Bio-One (Alphen a/d Rijn, The Netherlands) in a final volume of 250 µL. The assay is based on the O-dealkylation of alkoxyresorufins by BM3 to form the highly fluorescent product resorufin. The fluorescence of resorufin was measured at λex 530 nm (bandwith 8 nm) and λem 580 nm (bandwith 30 nm) on a Victor 2 1420 multilabel counter (Wallac, Turku, Finland).
To determine the activity of a selected part of the BM3 library (M01, M02, M05, M11, MT32, MT33, MT34, MT35, MT36, MT37, MT38, MT41, MT43, MT44, MT80, and MT81) toward the 2 probe substrates (methoxyresorufin and ethoxyresorufin) and the activity of the total library toward allyloxyresorufin, experiments were carried out at 24 °C with well volumes of 125 µL assay buffer (potassium phosphate buffer [100 mM; pH 7.4]) containing 100 nM of BM3. Alkoxyresorufins (25 µL) were introduced for preincubation in the assay buffer at a final concentration of 10 µM. The alkoxyresorufin stock solutions were prepared in 50% DMSO in assay buffer. Reactions were initiated by addition of 100 µL of NADPH, resulting in a final NADPH concentration of 100 µM. The increase in resorufin fluorescence was measured each minute over 6 min. The initial linear increase in resorufin fluorescence was taken as a measure of the enzymatic activity. All experiments were performed in triplicate.
Enzyme kinetics of BM3-mediated AROD activity
Enzyme kinetic measurement to determine Km and Vmax values toward the substrate allyloxyresorufin for a selection of BM3 mutants was performed off-line on a Shimadzu RF-1501 spectrofluorometer (λex 530 nm; λem 580 nm). All measurements were performed in duplicate at 24 °C in a total volume of 1 mL, and for all experiments, potassium phosphate buffer (100 mM; pH 7.4) was used. BM3 was introduced in the assay in buffer at a final concentration of 20 nM. The allyloxyresorufin stock solution was prepared in DMSO, and dilutions were made in the same solvent. Allyloxyresorufin was introduced into the assay for preincubation at concentrations ranging from 5 nM to 100 µM with a final DMSO concentration of 5%. Reactions were initiated by addition of 100 µL of NADPH, resulting in a final concentration of 100 µM. The increase in resorufin fluorescence was measured over 2 min, and the initial linear increase in resorufin fluorescence was a measure of the enzymatic activity.
Reaction rates were calculated and plotted against the substrate concentrations to obtain Michaelis-Menten curves, and the “1-site binding hyperbola” fitting module of GraphPad Prism 3.0 (GraphPad Software, La Jolla, CA) was used to estimate Km and Vmax values.
Optimization of the BM3 EAD in FIA mode
A schematic overview of the EAD system in FIA mode is depicted in Figure 1 . In this system, the flow from a superloop containing P450 BM3 is continuously mixed with a flow from a superloop containing a mixture of substrate (allyloxyresorufin) and cofactor (300 µM NADPH). Samples (10 µL) are introduced into the system by flow injection into a carrier solution (100 mM potassium phosphate buffer; pH 7.4) at a flow rate of 100 µL/min. Injected compounds and BM3, added to the carrier stream via an inverted Y-type mixing union at a flow rate of 100 µL/min, are allowed to bind in a knitted 0.5-mm i.d. PTFE reaction coil (50 µL). This mixture is combined with the flow of the allyloxyresorufin/NADPH solution of 100 µL/min. After mixing in a knitted 0.5-mm i.d. PTFE reaction coil (250 µL), the substrate allyloxyresorufin is converted into the highly fluorescent product resorufin. The temperature of both reaction coils is maintained constant at 24 °C. Eluting ligands (i.e., both inhibitors and substrates) competing with allyloxyresorufin for the active site of the BM3 mutants concerned cause a (temporarily) decreased production of resorufin that is monitored fluorescently directly after the second reaction coil.
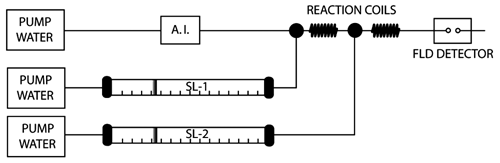
Schematic overview of the flow injection analysis P450 BM3 enzyme affinity detection system. Samples are introduced into the carrier solution by an autoinjector (A.I.) and are mixed in the first reaction coil with BM3 delivered by superloop-1 (SL-1). In the second reaction coil, the probe substrate (alkoxyresorufin) and cofactor (NADPH) are added to the mix by superloop-2 (SL-2). Ligands temporarily inhibit fluorescent product formation, which is monitored by a fluorescence (FLD) detector.
The BM3 EAD setup was optimized both for assay sensitivity (signal-to-noise ratio) and assay resolution (band broadening) for the BM3 mutant M11 by varying reaction times and investigating the influence of additives (Tween 20, PEG 3350, and ELISA blocking reagent) and solvents (ACN, MeOH, and DMSO).
BM3 activity screening in FIA mode
To test the activity of the different mutants toward the substrate allyloxyresorufin, a slightly different EAD setup was used. The superloop containing P450 BM3 was replaced by a loop containing only potassium phosphate buffer (100 mM; pH 7.4). The different BM3 mutants (10 pmol) were introduced into the system by flow injection into a carrier solution (100 mM potassium phosphate buffer; pH 7.4) at a flow rate of 100 µL/min. The activity of the different BM3 mutants toward allyloxyresorufin (5 µM) was determined by quantifying the fluorescent signal of the corresponding resorufin product peak formed.
Enzyme kinetics of BM-mediated AROD activity in FIA mode
To determine Km and Vmax values of the O-dealkylation of the substrate allyloxyresorufin by a selection of BM3 mutants, a slightly different EAD setup was used. The substrate was not added to the substrate/cofactor loop, which then only contained NADPH. Injection volumes of 10 µL allyloxyresorufin with different concentrations (0, 6.25, 12.5, 18.8, 25, 37.5, 50, 62.5, 75, 100, 125, 150, 200, 250, 300, 400, 500, and 600 µM) were introduced into the system by flow injection into a carrier solution (100 mM potassium phosphate buffer; pH 7.4) at a flow rate of 100 µL/min. The AROD activity of the different BM3 mutants (20 nM) at a specific allyloxyresorufin concentration was determined by quantifying the fluorescent signal of the resorufin product peak formed using a standard curve of the reference compound (50 nM to 500 µM). Product peaks were integrated with ACD/SpecManager 6.0 (Advanced Chemistry Development, Inc., Toronto, Canada). Reaction rates were calculated and plotted against the substrate concentrations to obtain Michaelis-Menten curves, and the 1-site binding hyperbola fitting module of GraphPad Prism 3.0 was used to estimate Km and Vmax values.
To determine the dilution factor, known resorufin concentrations were injected to determine peak heights, and the same resorufin concentrations were subsequently added to the carrier solution. The increase in fluorescence after equilibration was compared with the peak heights of the resorufin standards. The data obtained were used to calculate a dilution factor of 17.5 (5.7% of the injected concentration).
BM3 affinity profiling in FIA mode
The affinity profile of 6 BM3 mutants (M02, M11, M11 V87A, MT35, MT43, and MT80) toward a set of 30 compounds (amitriptyline3, buspirone4, aripiprazole5, dextromethorphan6, duloxetine7, nifedipine8, midazolam9, thioridazine10, ondansetron11, imatinib12, omeprazole13, rosiglitazone14, paroxetine15, norethisterone16, resveratrol17, dihydrobenzophenone18, 17α-ethinylestradiol (EE2)19, bisphenol A (BPA)20, 17α-estradiol (αE2)21, diethylstilbestrol (DES)22, estrone (E1)23, hexestrol24, 17β-estradiol (E2)25, estriol (E3)26, benzophenone-3 (BP3)27, aldrin28, testosterone29, tramadol30, imidazole31, and ketoconazole32) was measured in the standard EAD setup. Compounds (3 nmol, with the exception of ketoconazole [300 pmol]) were introduced into the system by flow injection into a potassium phosphate (100 mM; pH 7.4) carrier solution at a flow rate of 100 µL/min. The final BM3, allyloxyresorufin, and NADPH concentrations in the second reaction coil were 20 nM, 5 µM, and 100 µM, respectively, with the exception of MT80 (50 nM enzyme concentration). Injection of compounds with BM3 affinity caused a temporary decrease in resorufin formation and resulted in a negative peak in the EAD system. The difference in product formation (ΔPF) was calculated by subtracting the signal detected at the bottom of the negative peak from the signal detected at the start of the same negative peak. The percentage of inhibition for a specific compound was calculated by subtracting the signal decrease caused by DMSO (ΔPFDMSO) from the ΔPF of the compound in question and dividing this value (ΔPFeff) by the difference between the uninhibited product formation signal and the fluorescent signal without NADPH (no product formation).
To measure possible quenching of resorufin fluorescence by the compounds used, all compounds were also tested in the BM3 EAD system in which the substrate allyloxyresorufin was replaced by the product resorufin at a concentration similar to that formed during reaction in the optimized BM3 EAD system.
BM3-mediated metabolism of the drug buspirone
Metabolic incubations for the drug buspirone were performed in 100 mM potassium phosphate buffer (pH 7.4) with the cytosolic fraction containing 500 nM of the different BM3 mutants and a 200-µM substrate concentration. The final volume of the incubations was 250 µL, and the final DMSO concentration was always 5%. The reactions were initiated by addition of 50 µL of an NADPH-regenerating system, resulting in final concentrations of 0.5 mM NADPH, 7 mM glucose-6-phosphate, and 0.5 units/mL glucose-6-phosphate dehydrogenase. The reaction was allowed to proceed for 90 min at 24 °C and was terminated by the addition of 500 µL ice-cold ACN. Following centrifugation at 14,000 rpm for 10 min, 400 µL of supernatant was mixed with 200 µL of water, and the sample was analyzed by LC/MS. All reactions were performed in duplicate.
Metabolites and parent compounds were analyzed by reversed-phase chromatography using a Prodigy MAX-RP (Phenomenex, Luna 5µ, 150 × 4.6 mm i.d.), which was eluted by a binary gradient, composed of solvent A (0.1% formic acid in water) and solvent B (0.1% formic acid in ACN), at a total flow rate of 0.4 mL/min. The gradient applied was as follows: constant at 10% ACN for 1 min, linear from 10% ACN to 40% ACN in 16.5 min, constant at this percentage of ACN for 0.5 min, linear increase to 95% ACN in 0.01 min, constant for 5 min, linear decrease to 10% ACN in 0.01 min, constant for 7 min. For identification of parent and metabolites, a Finnigan LCQ Deca mass spectrometer (ThermoQuest-Finnigan, San Jose, CA) was used with positive electron spray ionization (ESI). N2 was used as a sheath gas (60 psi) and auxiliary gas (10 psi), the needle voltage was 5000 V, and the heated capillary was at 150 °C. LC/MS/MS data of the parents and metabolites were processed with Xcalibur/Qual Browser version 1.2 (ThermoQuest-Finnigan). An UV/VIS detector (254 nm) was placed in series with the MS for quantification. Standard curves of the substrates were used to estimate the concentrations of the metabolites, assuming that the extinction coefficients of the metabolites are equal to that of the corresponding substrates. Standard curves of the substrates were linear between 0.5 and 200 µM (data not shown).
Results and Discussion
The aim of this study was to develop an alternative approach to screen BM3 mutants for diversity. To achieve this goal, it was decided to use a continuous-flow bioassay setup analogously to the methods developed by Kool et al. 29,30 for rat and human P450s.
Alkoxyresorufin O-dealkylation activity screening
The BM3 mutants used for the alkoxyresorufin screening were shown to be active toward several drug-like molecules in previous studies. 13,14,28,36 Activities of these mutants toward methoxyresorufin, ethoxyresorufin, and allyloxyresorufin were measured in microplate reader format to determine which of these 3 alkoxyresorufins yielded the highest amount of O-dealkylation. The screening results ( Fig. 2 ) clearly demonstrated that the overall AROD activity was high and that this activity is much higher than the observed methoxyresorufin O-dealkylation (MROD) and ethoxyresorufin O-dealkylation (EROD) activities. The lowest overall activity was observed for the substrate methoxyresorufin, which is in agreement with the results published by Lussenburg et al., 26 who reported low MROD activities for BM3 mutants that contained the same mutations (R47L, L188Q, and F87V) as the mutants used in this study. Based on the screening results, allyloxyresorufin was selected as the substrate of choice for further development of the BM3 EAD system.
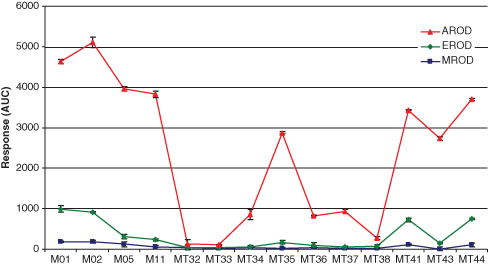
O-dealkylation activities of the alkoxyresorufins methoxyresorufin, ethoxyresorufin, and allyloxyresorufin by different BM3 mutants. Conditions were as described in Materials and Methods. AROD, allyloxyresorufin O-dealkylation; MROD, methoxyresorufin O-dealkylation; EROD, ethoxyresorufin O-dealkylation.
Optimization of the BM3 EAD in FIA mode
In the FIA EAD system ( Fig. 1 ), BM3 is continuously mixed with the substrate allyloxyresorufin and the cofactor NADPH to produce the highly fluorescent resorufin. Compounds are introduced into the assay by a carrier solution and are allowed to bind to the enzyme in a first reaction coil. After this first coil, the substrate/cofactor mix is introduced, which can react with the unoccupied enzyme in a second reaction coil. Eluting ligands temporarily inhibit product formation, thus allowing fluorescent detection of enzyme binding directly after the second reaction coil.
The next step in the developmental process was to optimize the BM3 EAD setup both for assay sensitivity (signal-to-noise ratio) and assay resolution (band broadening) using M11. The effect of the reaction time on the assay performance was tested by varying the length of the second reaction coil (50, 100, 125, 250, and 500 µL) and subsequently determining the fluorescent signal decrease after injection of 300 pmol ketoconazole (100% inhibition). The overall assay window was high because the noise of the BM3 EAD system was less than 1% of the maximal inhibition signal for all coil lengths tested (data not shown). Up to a volume of 250 µL, the maximum inhibition signal continued to increase without major peak broadening effects. At a coil volume of 500 µL, the increase in peak broadening was significantly higher than the increase of the inhibition signal (data not shown), and therefore it was decided to use a coil volume of 250 µL (which corresponds to a reaction time of 0.83 min).
Addition of the detergent Tween 20, which has been demonstrated to increase resolution, 29 had a negative effect on the assay performance. The polymer PEG 3350 and the additive ELISA blocking reagent, which may increase resolution, 29 were tested at different concentrations but did not improve the resolution when the inhibitor ketoconazole was injected (data not shown). It was therefore decided not to make use of additives in the screening setup. Solvent effects were investigated by injection of different solvents (ACN, MeOH, and DMSO) in different concentrations (ranging from 1%-10%) in duplicate. It was demonstrated that for all 3 solvents, the inhibition increased linearly with the amount of solvent injected. The linear increase in signal was higher for ACN and DMSO than for MeOH (data not shown). However, because most drug-like compounds have very poor solubility in nonorganic solvents at mM concentrations but do dissolve in DMSO, it was decided to use DMSO as the organic solvent of choice to make compound stock solutions but to keep the percentage in the samples as low as possible (3%).
Using the optimized assay conditions, a series of amitriptyline injections (3% of DMSO in sample; final reaction coil concentrations ranging from 1-57 µM) was performed in triplicate to test the performance of the FIA EAD system. From Figure 3 , it can be observed that injections of the water blank only caused minor injection peaks and corresponding decreases in signal. The triplicate injection of 0.2 nmol amitriptyline caused a temporary decrease of the fluorescent signal, which is partly caused by the DMSO present in the sample. However, the injections of higher concentrations of amitriptyline with the same DMSO percentage caused an increased signal decrease, which indicated that the inhibition was amitriptyline dependent. It can be observed from Figure 3 that the assay performance was highly reproducible (standard deviation for the triplicates was below 5%) and that the noise of the BM3 EAD was very low (less than 1% of the maximal inhibition signal). Duplicate injections were also measured in a staggered fashion (e.g., 1 injection for each condition followed by second injection for each condition) and gave similar results (data not shown).
Injections (triplicate) of amitriptyline in the BM3 enzyme affinity detection system using M11. Concentrations of 0 (water blank), 0.2, 0.4, 0.6, 0.8, 1, 2, 4, 6, 8, and 10 nmol were injected.
BM3 activity screening in FIA mode
The next step of the developmental process was to investigate if the continuous-flow bioassay setup could be adapted to test the enzymatic activity of the total library of 32 BM3 mutants toward allyloxyresorufin. The results of the FIA mutant screening are depicted in Figure 4 . These results clearly demonstrate that the AROD activity of the library of BM3 mutants can be measured in a FIA EAD setup and that differences exist between mutants. The reproducibility of the screening assay is high because the overall precision (coefficient of variation [CV]) was less than 5%. To verify the FIA EAD results, mutant activities were also measured in microplate reader format, and it was found that the results in the FIA EAD setup corresponded to those measured in the microplate reader format (data not shown). In addition, for the site-directed mutants of M11 targeting the 87 residue, the activities in the continuous-flow setup also corresponded very well with the results of Vottero et al.34 because they also determined high AROD activities for M11, M11 V87A, and M11 87Y and very low activities for M11 V87R, M11 V87K, M11 V87M, and M11 V87W.
Allyloxyresorufin O-dealkylation (AROD) specificities of the total library of BM3 mutants measured in an adapted flow injection analysis (FIA) enzyme affinity detection (EAD) setup. In the adapted FIA EAD setup, the superloop containing P450 BM3 was replaced by a loop containing only buffer. The different BM3 mutants (10 pmol) were introduced into the system by flow injection. The activity of the different BM3 mutants toward allyloxyresorufin (5 µM) was determined by quantifying the fluorescent signal of the corresponding resorufin product peak formed.
These results clearly show that a continuous-flow approach can be used to screen BM3 mutant libraries for diversity toward alkoxyresorufins. The advantage of this approach over the microplate reader format is the ease of automation and the improvement in speed. Another advantage is that a simple HPLC fluorescence detector is used for the assay readout instead of a costly microplate reader. The setup used for the mutant screening can in principle also be used to screen the activities of BM3 mutant libraries toward other substrates that generate a fluorescent readout to quickly gather detailed information about the diversity of the mutants.
Enzyme kinetics of BM3-mediated AROD activities in FIA mode
After screening the BM3 library for diversity based on its activity toward allyloxyresorufin, a number of mutants were selected to further investigate if kinetic differences existed between these mutants. In addition, to be able to compare affinity profiles between different enzymes, it is very important to measure the inhibition at a substrate concentration that is near the Km value for the enzyme investigated. The mutants M02, M11, M11 V87A, MT35, MT43, and MT80 were selected based on the AROD activity screening results and the fact that they contain mutations at different positions in the active site of the enzyme. In addition, for the mutants M02, M11, MT35, and MT43, it has already been shown within our lab (data not shown) that for the metabolism of drug-like compounds, (minor) changes in metabolic profile occur, which can indicate that different binding orientations exist between these mutants.
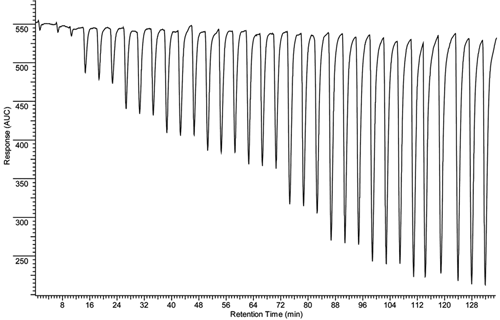
Enzyme kinetics was determined for the selected mutants as described above. The total amount of allyloxyresorufin injected was used to calculate the maximum concentration in the reaction coil. The dilution factor of the injected compound was determined in a similar way as described for the rat liver microsomal-based P450 1A EAD system by Kool et al. 29 An example of the activity of M11 at different substrate concentrations is depicted in Figure 5 . For all tested mutants, V/[S] curves could be constructed, and the kinetic parameters were determined (see Table 1 ). Enzyme kinetics also was determined in an off-line fashion to verify the on-line FIA results, and again the BM3-mediated AROD activities displayed typical Michaelis-Menten kinetics (R 2 > 0.96 for all tested mutants) in all cases. It can be seen from Table 1 that the Km and Vmax values determined in both setups corresponded relatively well. The apparent clearances (Vmax divided by Km) show that differences exist between the mutants, demonstrating that this continuous-flow approach can be used to screen the mutants for diversity.
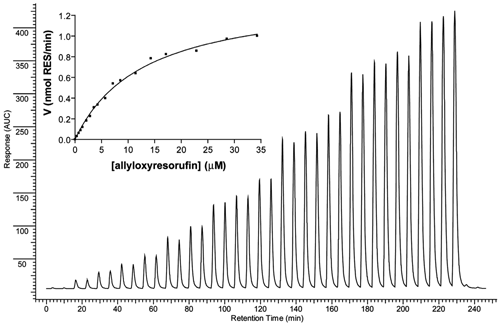
Allyloxyresorufin O-dealkylation (AROD) Michaelis-Menten kinetics measured in an adapted flow injection analysis (FIA) enzyme affinity detection (EAD) setup. Different amounts of allyloxyresorufin (0, 6.25, 12.5, 18.8, 25, 37.5, 50, 62.5, 75, 100, 125, 150, 200, 250, 300, 400, 500, and 600 pmol) were introduced into the system by flow injection into a carrier solution. The activity of the BM3 mutant M11 (20 nM) at a specific allyloxyresorufin concentration was determined by quantifying the fluorescent signal of the corresponding resorufin product peak formed. The resulting V/[S] curve is also depicted.
Kinetic Parameters Determined On-Line by FIA and Off-Line in a Standard AROD Activity Assay
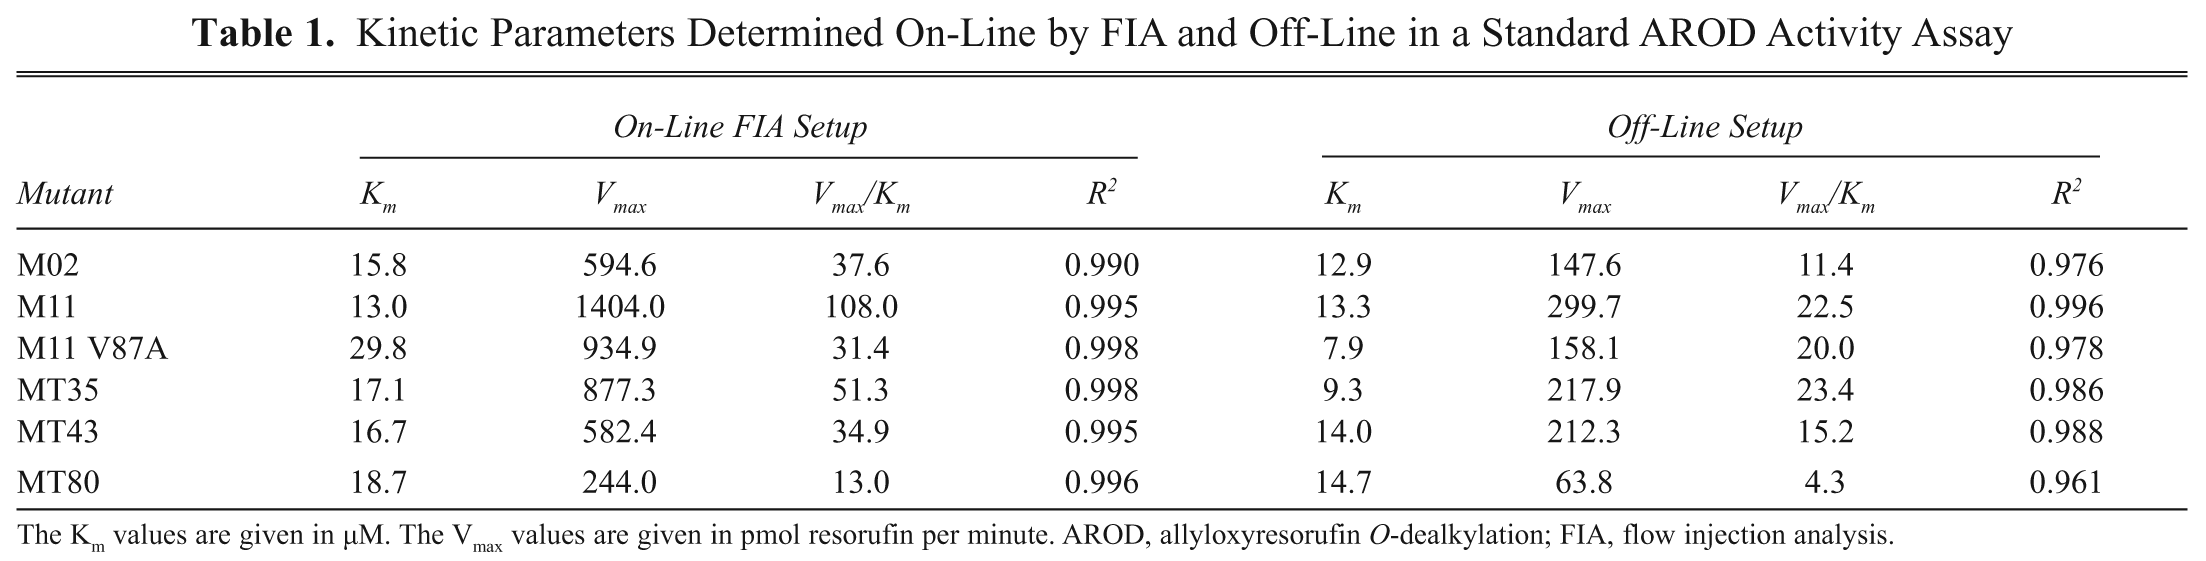
The Km values are given in µM. The Vmax values are given in pmol resorufin per minute. AROD, allyloxyresorufin O-dealkylation; FIA, flow injection analysis.
Advantages of the continuous-flow setup over the microplate reader format for the determination of enzyme kinetics are again the ease of automation, the improvement in speed, and the simple assay readout. However, another major advantage is that in this setup, the fluorescent product is determined at a fixed time from the start of the reaction. It is known that the BM3 mutants M02 and M11 display a very high initial activity during the first 50 s of benzyloxyresorufin O-dealkylation, which is followed by a decrease to a slower rate of metabolism as was determined in stopped-flow experiments. 28 In the continuous-flow setup, enzyme, substrate, and cofactor are mixed on-line in a reaction coil at the end of which the product formation is measured after 0.83 min (50 s). At this time point, the enzyme is still in its high initial activity phase. In the off-line microplate fashion enzyme, substrate and cofactor are mixed manually, after which the reaction mixture is placed in a microplate reader to monitor product formation in time. This setup makes it very difficult to start all the incubations simultaneously and therefore to standardize the time between the start of the reaction and the actual measurement of the AROD activity, which means that in the off-line microplate reader setup, it is very well possible that also the second slower activity phase is incorporated in the measurement.
BM3 affinity profiling in FIA mode
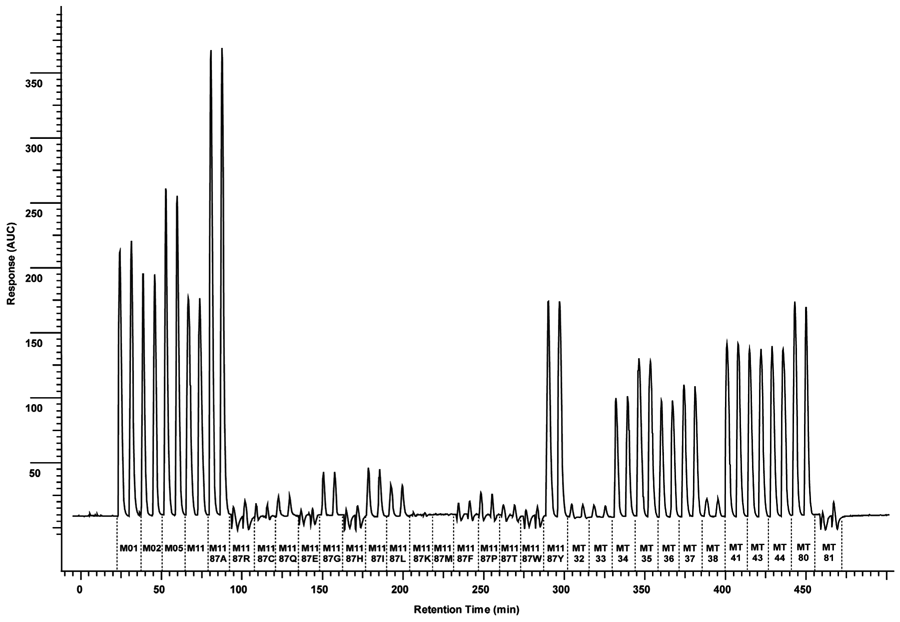
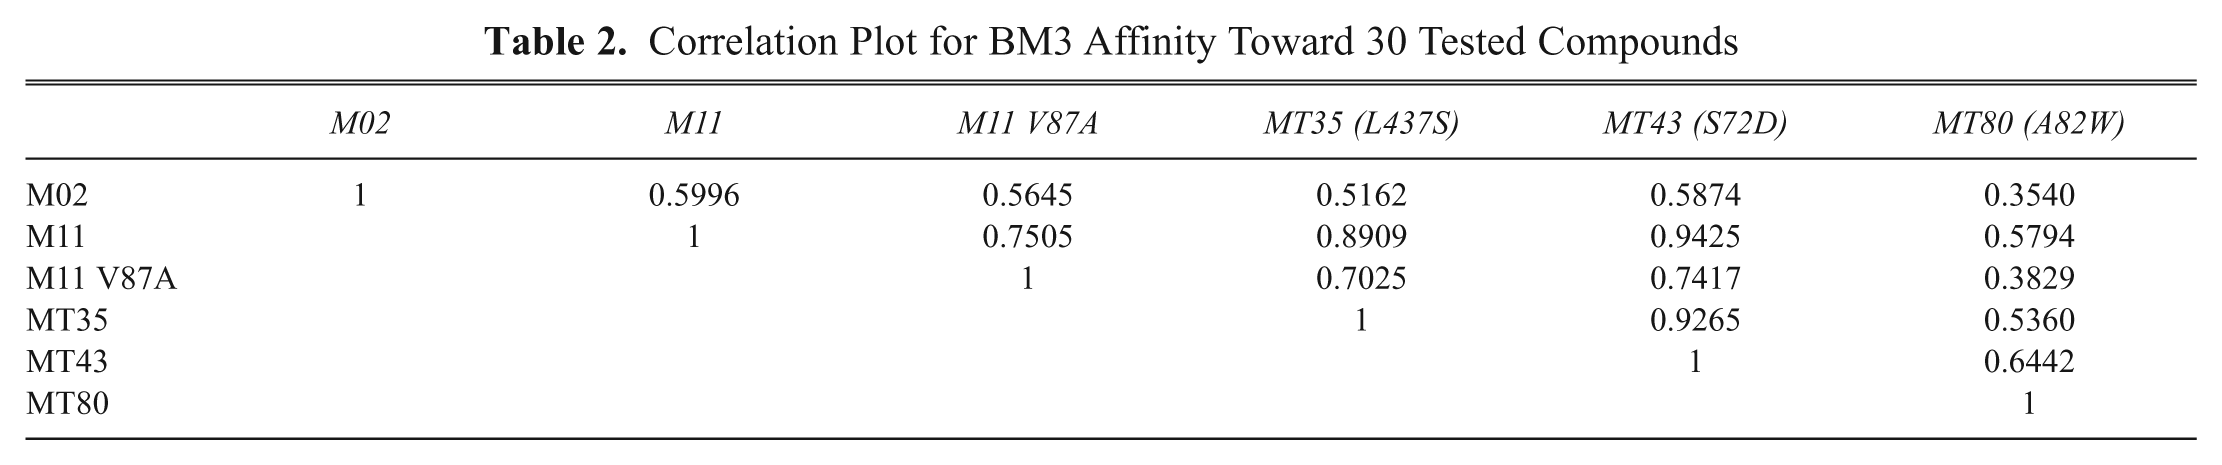
For the on-line profiling experiments, the affinity profiles of 6 BM3 mutants (M02, M11, M11 V87A, MT35, MT43, and MT80) resulting from the injection of a series of 30 compounds were determined in the optimized BM3 EAD setup. The results of these measurements are depicted in Figure 6 . The percentage of inhibition of the BM3 mutants by the different compounds was calculated as described above, and these data were used to make a correlation table, which is shown in Table 2 . Figure 6 clearly demonstrates that affinity differences exist between the mutants tested. Significant differences where some mutants display high inhibition but others show (almost) no inhibition at all can be observed for the compounds thioridazine10, imatinib12, omeprazole13, paroxetine15, norethisterone16, resveratrol17, dihydrobenzophenone18, and DES22 (the corresponding peak numbers are annotated in bold). The biggest differences between mutants can be found for M02, M11 V87A, and MT80, whereas M11, MT35, and MT43 display a high similarity in affinity profile.
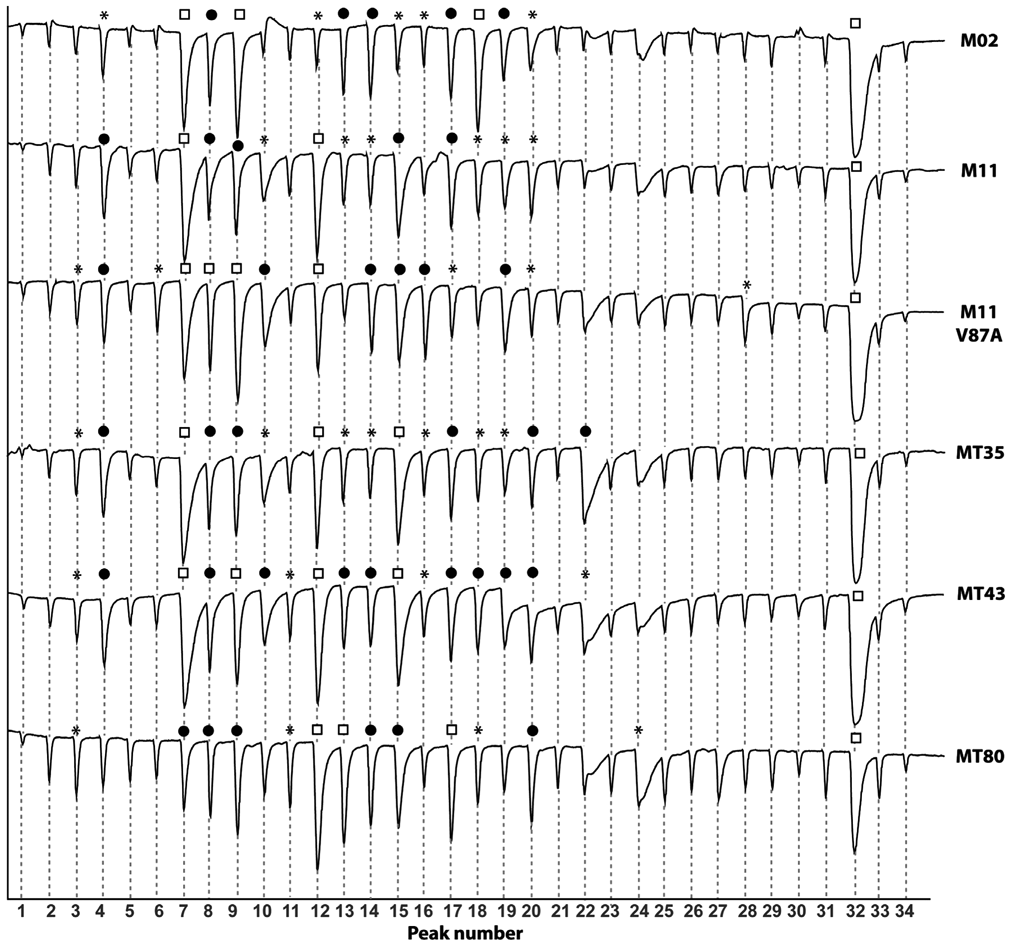
Superimposed flow injection analysis (FIA) affinity traces measured for 6 different BM3 mutants. Annotated bold compound numbers as listed in the Materials and Methods section correspond with the peak numbers (water blank1, DMSO blank2, second DMSO blank33, and second water blank34). Peaks displaying more than a 10% inhibition increase compared to the first DMSO blank are marked by an asterisk (*). For an increase higher than 25%, peaks have been marked by a closed black circle. When the inhibition increase exceeded 50%, peaks have been annotated with an open square.
Correlation Plot for BM3 Affinity Toward 30 Tested Compounds
BM3-mediated metabolism of buspirone
To investigate if on-line affinity profiling can be used as a tool to reflect changes in regiospecificity, the 6 selected BM3 mutants (M02, M11, M11 V87A, MT35, MT35, and MT80) were also used to perform metabolic incubations with the drug buspirone ( Fig. 7 ), which was shown to be metabolized into multiple products by M02, M11, MT35, and MT43 in earlier experiments performed at our lab (data not shown). To estimate the metabolic efficiency of the different mutants, the percentage of conversion was calculated. The masses of the metabolites that were detected and the corresponding metabolite distributions for each compound and each BM3 mutant were characterized by using the UV/Vis, LC/MS, and MS/MS data obtained. Metabolite structure assignments were based on comparison of the MS and MS/MS data with literature data. The results of the metabolism of the drug buspirone by the 6 BM3 mutants are displayed in Table 3 . For example, based on the UV/Vis data, the BM3 mutant M02 converts 20% of the starting material, and the distribution of the metabolites MB1, MB2, MB3, MB4, MB5, MB6, MB7, MB8, and MB9 is 18%, 33%, 2%, 23%, 9%, 1%, 2%, 9%, and 3%, respectively. From this table, it can be seen that significant differences exist in the distribution of the metabolites of the drugs for the tested mutants.
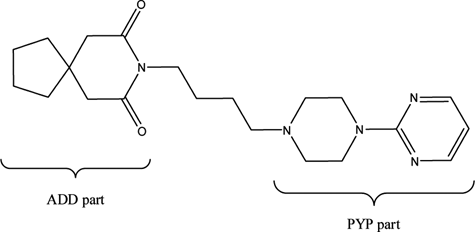
Chemical structures of the drug buspirone. The azaspirone decane dione (ADD) and the 2-(piperazin-1-yl)pyrimidine (PYP) parts of the busprione molecule are indicated.
Metabolism of buspirone by six BM3 mutants
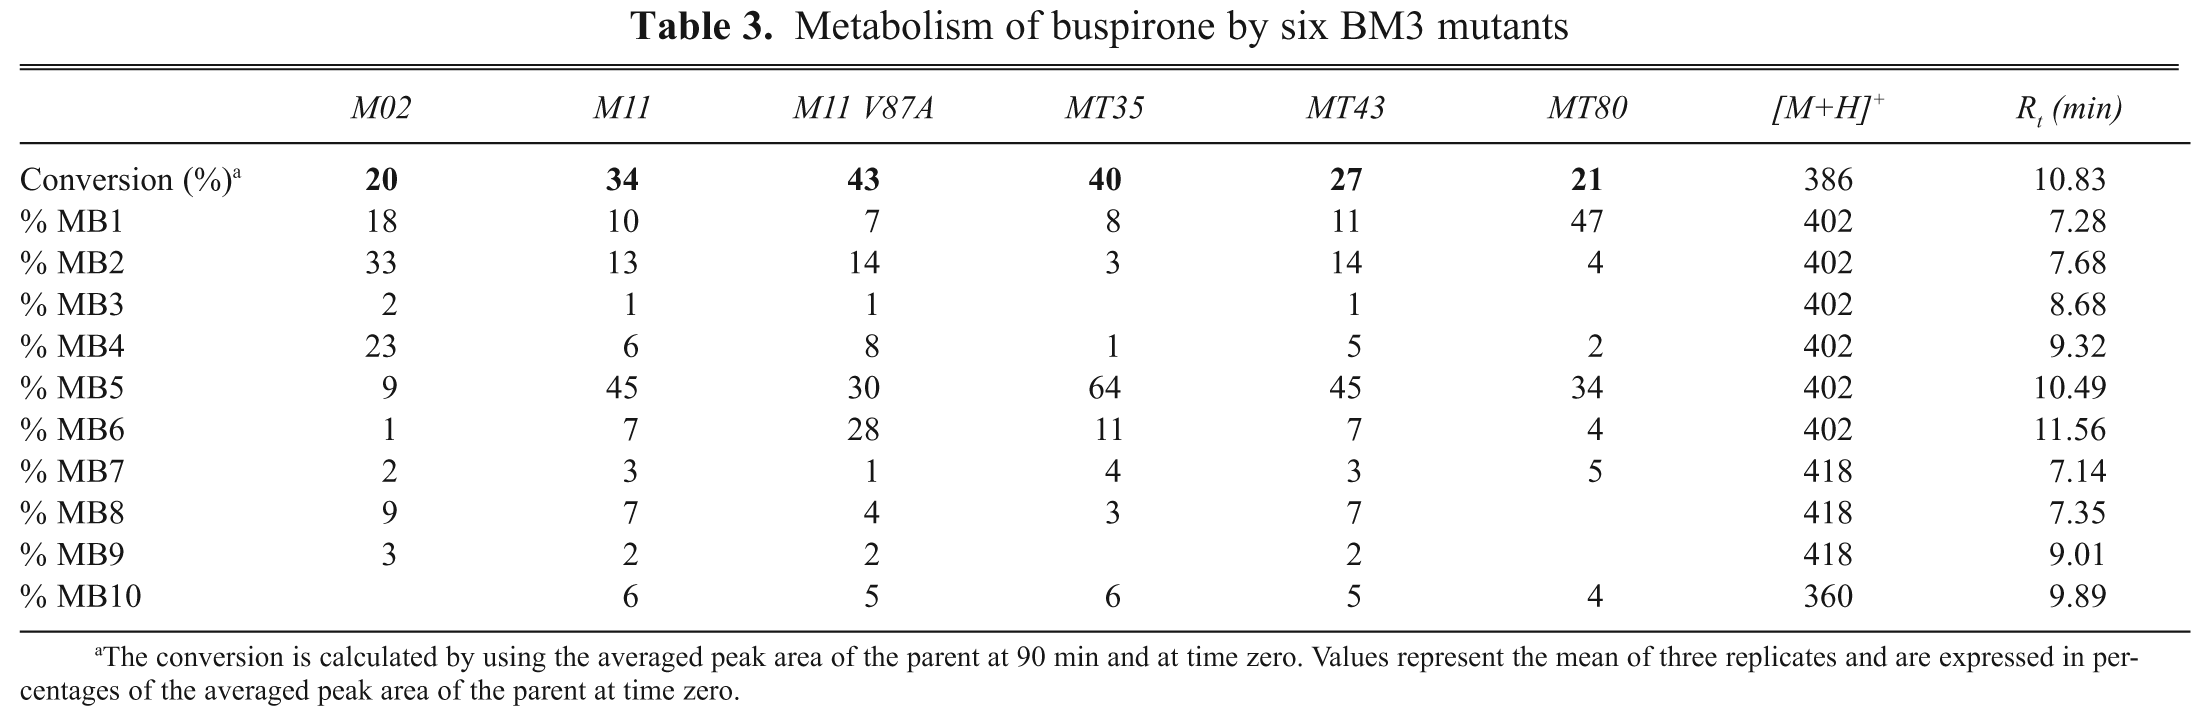
The conversion is calculated by using the averaged peak area of the parent at 90 min and at time zero. Values represent the mean of three replicates and are expressed in percentages of the averaged peak area of the parent at time zero.
Buspirone was metabolized into a total of 10 products. Six monohydroxylated products, MB1 to MB6 (m/z 402; [M+H]+); 3 dihydroxyl metabolites, MB7 to MB9 (m/z 418; [M+H]+); and 1 N,N-desethyl metabolite, MB10 (m/z 360; [M+H]+), were formed by the different mutants. Again, the distribution profiles of M11, MT35, and MT43 were very similar but differed significantly from the metabolite distributions obtained with the other 3 mutants. According to their MS/MS spectra, for MB1, MB2, and MB3, monohydroxylation occurred on the azaspirone decane dione (ADD) part of the molecule. The presence of very intense loss of water points to the hydroxylation site being in the cyclopentane part of the ADD. For MB4, it is clear that hydroxylation has not occurred on the 2-(piperazin-1-yl)pyrimidine (PYP) part of the molecule. The unique mass fragment at m/z 210 indicates that hydroxylation might have taken place on the aliphatic chain between the ADD and PYP parts of the molecule. The MS/MS spectrum of MB5 indicates that hydroxylation has taken place on the aromatic ring of the PYP part, and based on the results of Zhu et al., 37 this metabolite is identified to be 5-OH-buspirone. The product ion spectrum of MB6 is consistent with the structure of the N-oxide on the piperazine ring because the significant loss of an oxygen from the N-oxide group led to the formation of unique fragments at m/z 177 and 277. The MS/MS spectra of the 3 dihydroxymetabolites, MB7 to MB9, are all very similar and indicate that for all 3 metabolites, hydroxylation has been performed on both the ADD and the PYP parts of the molecule. MB10 was identified to be the N,N-desethylbuspirone metabolite. 38
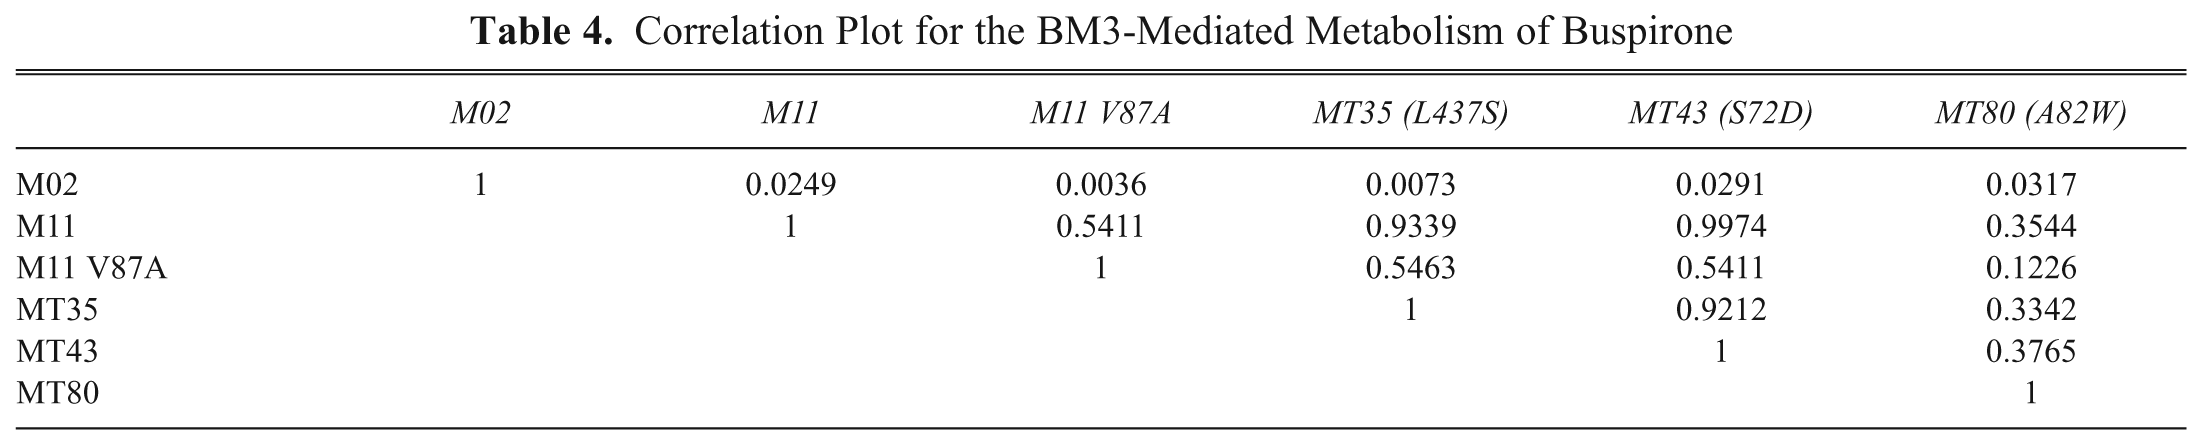
Significant changes in the metabolite distributions of the drug buspirone were found after enzymatic incubations of this drug with 6 structurally diverse BM3 mutants. The metabolite distribution profiles were used to make a correlation table, which is shown in Table 4 . Very high correlations were found between M11, MT35, and MT43, which is in good agreement with the results of the affinity-profiling experiment. Very low correlations were found between M02 and the other mutants, which also is in agreement with the result of the affinity-profiling experiment where M02 displayed the lowest overall correlation. These findings suggest that the binding orientation of the substrates might be different, which results in the formation of altered metabolite distributions.
Correlation Plot for the BM3-Mediated Metabolism of Buspirone
Conclusion
The present study clearly demonstrates that a continuous-flow bioassay setup can be used to screen BM3 libraries for diversity. The screening strategy used was based on the inhibition of BM3-mediated O-dealkylation of the alkoxyresorufin 7-allyloxyresorufin to form the highly fluorescent resorufin. It was shown that the continuous-flow setup could also be used to measure activities of a library of BM3 mutants toward the substrate allyloxyresorufin by injection of enzyme fractions. Furthermore, the setup could be used to successfully determine enzyme kinetics on-line by injection of different concentrations of substrates. The optimized BM3 EAD assay was shown to be stable and reproducible and was used to determine affinities for 6 mutants toward a total of 30 xenobiotics. The tested BM3 mutants displayed significant differences in affinity profiles, and these differences could be correlated with changes in metabolite distribution for the drug buspirone.
In conclusion, the relatively simple screening methodology described in this article will be a useful tool for research aiming at identification of BM3 mutants with improved activity and catalytic diversity with respect to substrate selectivity and regioselectivity. In addition, this methodology will also be generally applicable for enzymes for which fluorescent substrates are available.
Footnotes
Acknowledgements
The authors acknowledge Prof. Dr. Wilfried M. A. Niessen (Division of Biomolecular Analysis, Vriie Universiteit, Amsterdam) for his assistance in elucidating the LC/MS data. We also thank Dr. Jeroen Kool (Division of Biomolecular Analysis, Vriie Universiteit, Amsterdam) for critically reviewing the manuscript.
References
Supplementary Material
Please find the following supplemental material available below.
For Open Access articles published under a Creative Commons License, all supplemental material carries the same license as the article it is associated with.
For non-Open Access articles published, all supplemental material carries a non-exclusive license, and permission requests for re-use of supplemental material or any part of supplemental material shall be sent directly to the copyright owner as specified in the copyright notice associated with the article.