
Abstract
The retinoid acid receptor–related orphan receptors (RORs) represent important targets for the treatment of metabolic and immune disorders. Here the authors describe the application of AlphaScreen® technology to develop a high-throughput screening (HTS)–compatible assay to facilitate the discovery of RORα modulators. Using the ligand binding domain (LBD) of RORα and a peptide derived from the NR1 box of the nuclear receptor coactivator PGC-1α, a 384-well format assay was developed exhibiting high sensitivity, requiring only low nanomolar concentration of reagents. Recently, it was shown that oxysterols such as 7α-hydroxycholesterol (7α-OHC) function as modulators of the RORs. In this assay, 7α-OHC produced a concentration-response curve with an EC50 of 162 nM, a Z′ factor of 0.6, and a signal-to-background (S/B) ratio of 4.2, demonstrating that the assay is HTS compatible. Validation of the assay was afforded by screening against the Sigma LOPAC1280™ library in a 384-well format. In summary, the results presented here demonstrate that this assay can be used to screen large chemical libraries to discover novel modulators of RORα.
Keywords
Introduction
T
RORs have been suggested to function as constitutive transcriptional regulators in the absence of ligands by interacting with corepressors as well as coactivators. 6,7 Reports have suggested that cholesterol, 7-hydroxycholesterol (7α-OHC), and cholesterol sulfate might be ligands for RORα. 8,9 More recently, it was shown that 7α-OHC binds to and modulates the transcriptional output of RORα. 10 In this study, 7α-OHC was able to modulate the presence of the p160 family coactivator SRC2 at a RORα target gene promoter, glucose 6-phosphatase (G6Pase). Thus, it is clear that ROR ligands can modulate recruitment of coregulators. The interaction between NRs and their coactivators typically occurs between a region of the ligand-binding domain (LBD), referred to as activation function 2 (AF-2), and regions on the coactivator/corepressor, termed nuclear receptor boxes (NR boxes), which contain a hydrophobic LXXLL motif important for mediating this interaction. 11
RORs have emerged as important drug targets for the treatment of a variety of medical conditions, such as metabolic disorders, atherosclerosis, and certain cancers. The goal of this study was to develop a robust and sensitive high-throughput screening (HTS) biochemical assay for discovery of RORα modulators. It has been suggested that the interaction between RORα and PGC-1α (peroxisome proliferator-activated receptor g coactivator 1-α) serves as an important link between the circadian clock and various metabolic pathways and may play a pivotal role in lipid homeostasis in muscle. 12,13 We took advantage of this apparent constitutive interaction to design an assay that detects conformational change induced by ligand binding to the LBD of RORα that would perturb the interaction with the LKKLL motif present in the NR1 box of PGC-1α. It is important to note that this type of NR-LBD/NR box peptide interaction assay with purified proteins, although very useful to detect compound binding, is artificial and not necessarily directly reflective of the compound’s pharmacology in the context of a native transcription complex. NR coactivators (CoA) and corepressors (CoR) are large multidomain proteins that interact with nuclear receptors via a minimal domain referred to as the receptor interaction domain (RID). Within the RID are several NR boxes, each of which contains a classical hydrophobic LXXLL motif. These NR boxes facilitate cofactor interaction with NRs but by themselves have no function and do not mediate transcription. Peptides that contain 1 NR box will interact with hydrophobic clefts on the NR’s surface, often in a ligand-dependent fashion for NRs that are not constitutively active, whereas in the case of constitutively active RORα, the NR box peptide derived from the PGC-1α RID interacts with the receptor even in the absence of ligand. The ability to alter the level of interaction of the apo receptor with the PGC-1α NR box peptide requires ligand to bind in such a fashion to alter the conformation of the LBD. Thus, this assay is useful for identifying compounds that bind to RORα but does not directly provide insight into the cellular pharmacology of the ligand. This is also true for a radioligand displacement binding assay so there is no one single assay for nuclear receptors that effectively captures both binding potency and ligand pharmacology.
Discovery of novel modulators of NRs has been enhanced by using the AlphaScreen® (Amplified Luminescent Proximity Homogeneous Assay) technology. This has become one of the methods of choice for HTS, having the best sensitivity and dynamic range over alternative technologies. 14,15 Here we demonstrate an HTS-compatible AlphaScreen® assay to facilitate the identification of small-molecule modulators of RORα.
Materials and Methods
Reagents
7α-Hydroxycholesterol was purchased from Steraloids (Newport, RI). Sodium chloride (NaCl) was obtained from Fisher Chemicals (Waltham, MA). HEPES and bovine serum albumin (BSA) were purchased from Sigma Aldrich (St. Louis, MO). The AlphaScreen® histidine (nickel chelate) detection kit containing Ni-chelate acceptor beads and streptavidin donor beads was purchased from PerkinElmer (Waltham, MA). The AlphaScreen® TruHits kit containing streptavidin donor beads and biotinylated acceptor beads coated with BSA was from PerkinElmer. N-terminal biotinylated peptides PGC-1α NR1 and NR2 (SMPDGTPPPQE-AEEPSLLKKLLLAPANTQL and AKSICQQQKPQRRPCSELLKYLTTNDDPPH) and the recombinant His-RORα-LBD protein were provided by Eli Lilly and Company (Indianapolis, IN).
The sequence of the His-RORα-LBD (262-523) protein is MGHHHHHHGETSPTVSMAELEHLAQNISKSHLETCQYL REELQQITWQTFLQEEIENYQNKQREVMWQLCAIK ITEAIQYVVEFAKRIDGFMELCQNDQIVLLKAGSLEVV FIRMCRAFDSQNNTVYFDGKYASPDVFKSLGCEDFI SFVFEFGKSLCSMHLTEDEIALFSAFVLMSADRSWLQE KVKIEKLQQKIQLALQHVLQKNHREDGILTKLICK VSTLRALCGRHTEKLMAFKAIYPDIVRLHFPPLY KELFTSEFEPAMQIDG. A baculovirus expression system was used to express the His-RORα-LBD protein. This was purified using the Ni column and by the size exclusion chromatography method to a 95% purity.
The Library of Pharmacologically Active Compounds (LOPAC; Sigma LOPAC1280™) was obtained from Sigma Aldrich and was reformatted at 1 mM concentration in DMSO into 384-well format sources plates obtained from Greiner Bio-One (Monroe, NC).
Cell culture and transcriptional assays
Luciferase reporter assays were conducted using a pBind Ga14-tagged RORα LBD construct along with a UAS luciferase reporter in the presence or absence of full-length PGC-1α cotransfected into HEK293T cells. Reverse transfections were performed in bulk using 1 × 10⁶ cells in 6-cm plates; 3 µg of total DNA in a 1:1:1 ratio of receptor, reporter, and coactivator, respectively; and FuGene6 (Roche, Basel, Switzerland) in a 1:3 DNA/lipid ratio. Following 24-h incubation, cells were counted and plated in 384-well plates at a density of 10,000 cells/well. Cells were treated with vehicle or 10 µM 7α-hydroxycholesterol 4 h after plating. Following an additional 20-h incubation, luciferase levels were assayed by 1-step addition of 30 µL BriteLite (PerkinElmer) and read using an EnVision multilabel plate reader (PerkinElmer).
Radioligand receptor binding assay
Ninety nanograms of purified GST-RORα-LBD were incubated with 3 nM of [3H]-25-hydroxycholesterol in assay buffer (50 mM HEPES [pH 7.4], 0.01% BSA, 150 mM NaCl, and 5 mM MgCl2) as described previously. 10 In brief, for the competition assay, various concentration of compounds were incubated with receptor in the presence of [3H]-25-hydroxycholesterol for 1 h. The assays were terminated by rapid filtration through presoaked Whatman GF/B filters (0.5% polyethylenimine [PEI] in phosphate-buffered saline [PBS]) in Multiscreen plates (Millipore, Billerica, MA) and were washed with ice-cold assay buffer (3 × 0.1 mL). The data are presented as specific counts in the presence of various concentrations of the above compounds.
AlphaScreen® assay development and characterization in 384-well format
All experiments were performed in white opaque 384-well plates (Greiner Bio-One) under green light conditions (<100 lux) at room temperature. All dilutions were made in 1× assay buffer containing 25 mM HEPES (pH 7.4), 100 mM NaCl, and 0.1% BSA to minimize nonspecific interactions. The final DMSO concentration was 0.25% for compound concentration-response curves. The luminescence was read on a PerkinElmer EnVision 2104.
The final assay volume was 15 µL for the peptide-protein cross-titration experiments and 20 µL for kinetics experiments. For the optimization of the constitutive interaction between His-RORα-LBD and Biotin-PGC-1α NR1, cross-titrations of protein and peptide, respectively, were performed. For titrating the Biotin-PGC-1α NR1 at 25, 50, 75, and 100 nM, respectively, of His-RORα-LBD, a mix of 12 µL of receptor and beads (12.5 µg/mL each) was added to each well followed by addition of 3 µL of peptide (8.4 pM-500 nM). For titrating the His-RORα-LBD (8.4 pM to 166 nM) against 70 nM of Biotin-PGC-1α NR1 or Biotin-PGC-1α NR2, a mix of 12 µL of protein corresponding to each dilution and beads at 12.5 µg/mL was added to each well followed by addition of 3 µL of peptide. For kinetics experiments, 75 nM His-RORα-LBD and 30 nM Biotin-PGC-1α NR1 were incubated for 0 to 6 h at room temperature with a 30-min interval, and 13 time points were generated. Two independent experiments were performed with each time point representing a separate experiment to avoid photo-bleaching. Plates were sealed and incubated for 1 h.
For compound concentration-response curves (425 pM to 25 µM), a mix of 12 µL of 75 nM of His-RORα-LBD and beads (range of 15-40 µg/mL for each bead depending on the experiment as indicated) was added to the wells and 4 µL of increasing concentration of compound and incubated for 1 h. After this preincubation step, 4 µL of 30 nM of Biotin-PGC-1α NR1 was added and further incubated for 2 h. The final assay volume was 20 µL. To investigate the effect of solvent DMSO on the compound EC50 value, 4 different DMSO final concentrations were tested (0.25%, 0.5%, 1%, and 5%).
AlphaScreen® TruHits assay
Biotin and streptavidin bind strongly, which brings the donor and acceptor beads into close proximity, generating a signal upon excitation at 680 nm. Any compound that causes a decrease in the signal represents an interfering compound that is not specific for the target of interest, whereas those that have no effect on the signal are potential true hits. The final assay volume was 20.5 µL. The assay buffer, plate format, light conditions, and luminescence reading instrument are described in the previous section. A mix of streptavidin donor (SA-D) beads and biotinylated acceptor beads (b-A) each at a final concentration of 1.5 µg/mL in a volume of 20 µL was added to each well. For generating the compound concentration-response curves, 0.5 µL of increasing concentrations of 7α-hydroxycholesterol compound (0.3 nM to 25 µM) or LOPAC hits (20 nM to 50 µM) were added, and the plates were sealed and incubated for 1 h at room temperature. The final DMSO concentration was 0.25%.
HTS LOPAC assay
Assay plates were filled with 12 µL per well of 1× assay buffer (described above) using a BioRAPTR FRD (Beckman Coulter, Fullerton, CA). First, the compound or controls (100 nL) in DMSO were added via the pintool instrument (Kalypsys, GNF, San Diego, CA) to have 0.5% nominal percentage of DMSO at a 5 µM screening compound concentration when using a 1 mM source plate. Each compound was transferred as a single instance per well but was pinned across 3 separate assays plates such that they were analyzed in triplicate. All reagent preparation and additions, as well as the experiment, were kept under green light conditions (<100 lux) from this point onward. Next, a mix of 4 µL of 5X His-RORα-LBD protein (375 nM) and 5X beads (50 µg/mL each of Ni-chelate acceptor beads and streptavidin donor beads) in assay buffer was dispensed into wells followed by incubation at room temperature for 1 h. To start the reaction, 4 µL per well of Biotin-PGC-1α NR1 in assay buffer was added at 150 nM (5X), and the reaction was allowed to proceed for 2 h at room temperature. The final assay volume was 20 µL. Plates were then read using the EnVision plate reader from PerkinElmer using the HTS AlphaScreen® modality reading at a height of 0 mm, exciting for 0.04 s with an emission time of 0.09 s per well with cross-talk corrections applied.
The compounds tested in the assay validation stage were from the Sigma LOPAC1280™ library containing 1280 proven pharmacologically active compounds. Detailed information about the library composition is available at http://www.sigmaaldrich.com/chemistry/drug-discovery/validation-libraries/lopac1280-navigator.html.
All data were normalized on a per plate basis to their individual controls. Since each compound was represented 3 times, we also calculated its average percent activity. The percent activation for each compound was calculated as follows in the equation below, where Test Compound is defined as wells containing His-RORα-LBD, Ni-chelate acceptor beads and streptavidin donor beads, and Biotin-PGC-1α NR1 in the presence of test compound. Positive Control is defined as wells containing the same except 7α-OHC is used at 25 µM in place of compounds. Low Control wells again are the same but contain DMSO: % Activation = 100X [1-(Test Compound – Median Positive Control)/(Median Low Control – Median Positive Control)].
The AlphaScreen® compound concentration-response curve (CRC) assay was run under identical conditions to the HTS version in triplicate using a 10 mM source starting concentration and 3-fold serial dilutions for 10 points. Final assay compound concentrations are thus 50 µM at the highest dilution, progressing downward accordingly.
Assay performance
To monitor assay sensitivity and evaluate the robustness of this assay, signal-to-background (S/B) ratios and the Z′ factor were calculated using the equations previously described. 16
Data analyses
All EC50 values were calculated by nonlinear regression analysis (sigmoidal dose-response variable slope) using Prism® software (GraphPad Software, Inc., San Diego, CA). Data analysis for the LOPAC1280™ compound library was performed using internal informatics tools and Symyx Assay Explorer version 3.2 (Symyx Technologies, Inc., San Diego, CA). For CRC analysis, for each test compound, percent activation was plotted against compound concentration. A 4-parameter equation describing a sigmoidal dose-response curve was then fitted with an adjustable baseline using Assay Explorer software (Symyx Technologies, Inc.). The reported EC50 values were generated from fitted curves by solving for the X-intercept value at the 50% inhibition level of the Y-intercept value. In cases where the highest concentration tested (i.e., 50 µM) did not result in greater than 50% inhibition, the EC50 was determined manually as greater than 50 µM.
Results and Discussion
Using a cell-based cotransfection assay, we found that PGC-1α was able to modulate RORα transactivation by 2.5-fold (
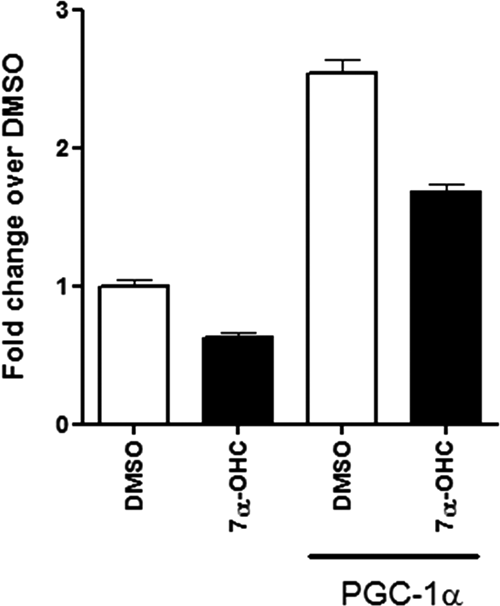
RORα is activated by PGC-1α, and 7α-hydroxycholesterol modulates the RORα interaction with PGC-1α. 293T cells were cotransfected with UAS-luciferase and Ga14-RORα in the absence or presence of PGC-1α, as mentioned in Materials and Methods. The cells were treated with 10 µM of 7α-hydroxycholesterol or DMSO (vehicle) as control for 20 h followed by luciferase activity measurement. Relative change was determined by normalizing to the cells treated with vehicle only. Each data point was performed in 6 replicates and represented as mean ± SEM.
Development of the 384-well format AlphaScreen® assay
Both binding partners were titrated to find the best reagent concentration and to determine the sensitivity of the assay. First, the Biotin-PGC-1α NR1 peptide was titrated against 4 concentrations of His-RORα-LBD. As illustrated in
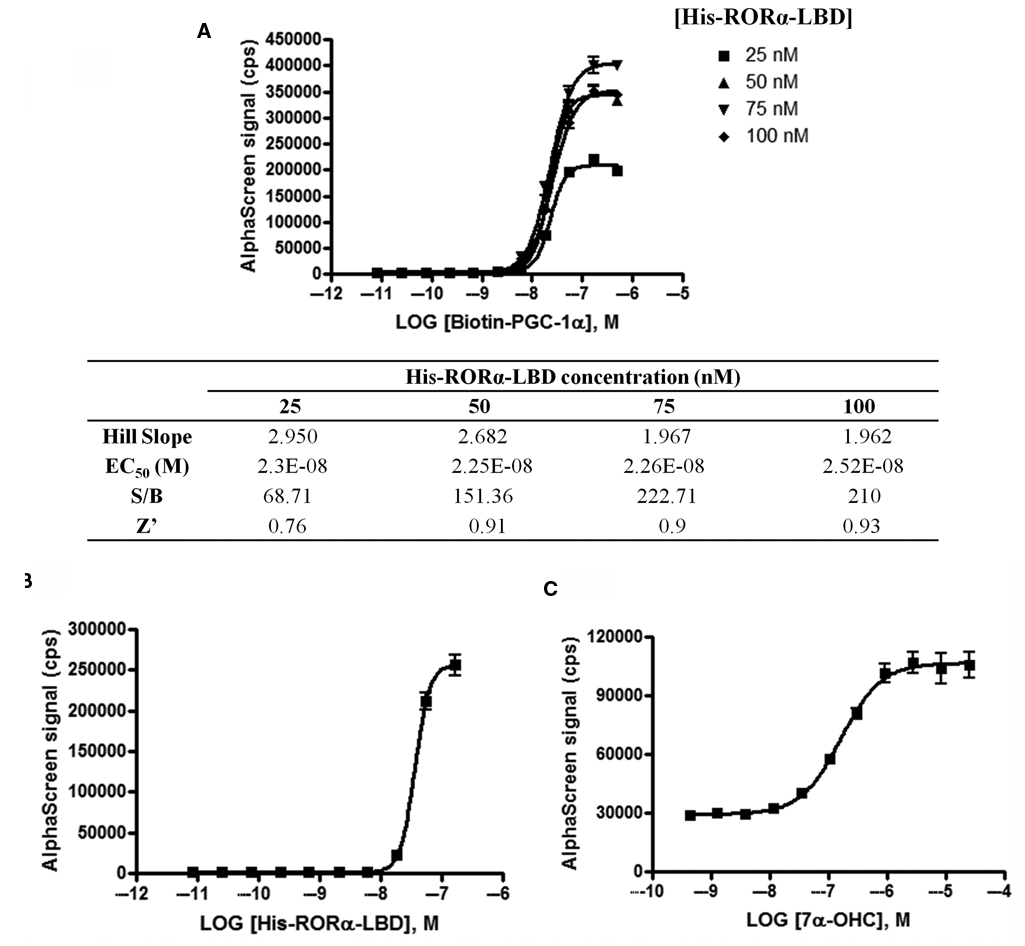
RORα-PGC-1α cross-titrations and validation of His-RORα-LBD protein conformational change. (
Next the kinetics of the interaction was assessed to determine the optimal timeframe for the assay (Suppl. Fig. S1). Using protein and peptide concentration as described above in the Materials and Methods section, a linear increase in assay signal was detected over the first 2 h of incubation. This optimal reaction timeframe is similar to results obtained for an AlphaScreen® assay for the NR retinoic acid receptor gamma (RARγ). 14 The assay signal decreased over the remaining 4 h, indicating that the optimal timeframe for the assay is around 2 h postmixing. Such a signal decrease is similar to that observed in a recent report describing an AlphaScreeen® assay for a tumor necrosis factor (TNF) receptor, where the signal decreased after 60 min of incubation. 17 Subsequent assay validation was performed reading the AlphaScreen® signal 2 h postmixing of all reagents.
Compound modulation of RORα/PGC-1α interaction
Following optimization of assay conditions, experiments were performed to determine if a small-molecule ligand can modulate the RORα/PGC-1α interaction. To this end, 7α-OHC was titrated, and the effect of different bead concentrations (15, 20, 30, and 40 µg/mL) on EC50 and S/B was also investigated to identify the optimal bead concentration (data not shown). In all cases, the EC50 of the test compound was similar. However, not surprisingly, the S/B decreased with decreasing bead concentration, and a similar trend was previously reported.
18
Optimal S/B was obtained using either 30 or 40 µg/mL of AlphaScreen® beads, respectively. Results for the assay using 30 µg/mL of each bead are shown in
HTS compatibility
The experiments described in this section were performed to characterize the assay under various conditions to support transfer to the HTS laboratory. First, the effect of DMSO concentration on assay performance was determined. The potency of 7α-OHC was determined at increasing DMSO concentrations ranging from 0.25% to 5% (data not shown). No significant difference in the EC50 value or the S/B ratio was observed, indicating that the assay can tolerate up to 5% DMSO. The performance of the assay was further monitored over the course of 3 days, and the data are shown in
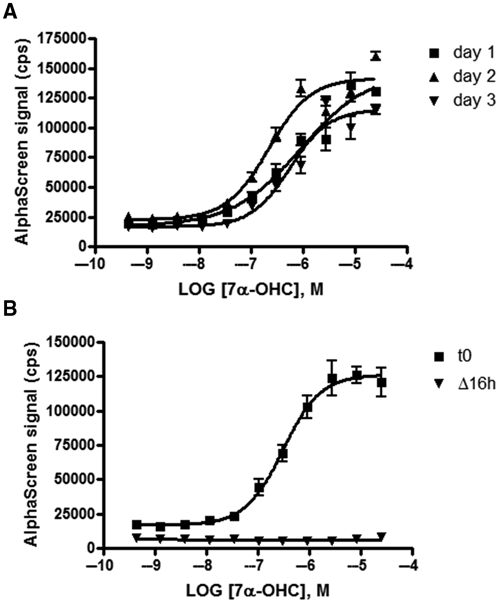
Assays for high-throughput screening (HTS) transfer. Increasing concentrations of compound 7α-hydroxycholesterol (425 pM to 25 µM) were preincubated with His-RORα-LBD (75 nM) and both beads for 1 h at room temperature. The peptide Biotin-PGC-1α (30 nM) was added to each well and further incubated for 2 h at room temperature. (
LOPAC screen using AlphaScreen® assay
To determine the performance of the assay in terms of robustness (Z′) under HTS conditions, the assay was screened against the LOPAC library using modified conditions specific to the HTS platform used, as described in the Materials and Methods section. Under these modified conditions, the EC50 for 7α-OHC was consistent with that determined during assay optimization (data not shown). Briefly, compounds were analyzed in triplicate at a nominal concentration of 5 µM using 7α-OHC as the positive control (25 µM). Each plate contained positive control wells and low control wells (DMSO only), both of which were used in Z′ factor calculations.
16
By using the sample field as the low control in conjunction with the positive control, we calculated the Z factor,
16
which, when compared to Z′, allows for determination of the inter- and intraplate variability (
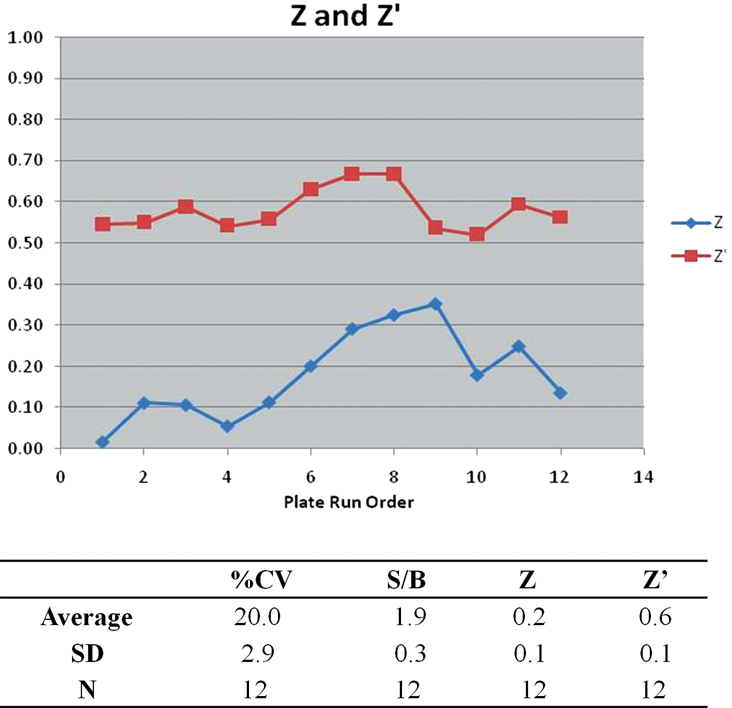
Z′ and Z factor results from the high-throughput LOPAC screen. One data point represents 1 plate of data. Calculations are described in the text. Both Z′ and Z are shown for each assay plate and are displayed in exact order as the run sequence. Z′, shown in red, is consistently >0.5, whereas the Z factor, depicted in blue, indicates interplate variability as expected when numerous hits are identified within the plate. Intraplate variability is consistent as shown by looking at the pairing of plates 1 to 3, 4 to 6, 7 to 9, and 10 to 12, which is expected. The entire run statistics are also tabulated and include percent coefficient of variation (%CV) analysis for the 320 sample wells, signal-to-background ratio (S/B) as calculated by dividing the positive control by the low control for each plate, and average and standard deviation.
Hits were identified in the LOPAC HTS effort by applying a mathematical algorithm in which 2 values are calculated: (1) the average activity of the low control and (2) three times their standard deviation. The sum of these 2 values was used as a cutoff parameter (i.e., any compound that exhibited greater average percent activity than the cutoff parameter was declared active). In this case, the cutoff value equated to 19.61%, which yielded 30 unique compounds with an average activity above this threshold (
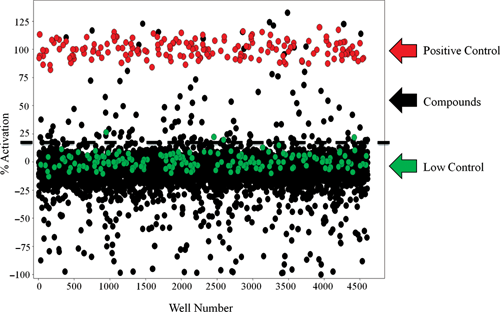
Scatter plot analysis results from the high-throughput LOPAC screen. All data from 12 assay plates, including controls, are displayed. The nominal cutoff for activators of this assay is shown by the dashed line. Active compounds were identified based on their average result being greater than the nominal cutoff threshold value of 19.61%. In this display, more than 30 test wells have activity exceeding the threshold value, which reflects the reproducibility of the compounds being tested in triplicate. Note that this assay identifies negative modulators of the RORα and PGC-1α interaction, which are displayed as negative percent activation.
To identify RORα target-independent positives, we employed the AlphaScreen® TruHits assay for all 30 hit compounds. No interfering compounds were identified in this assay, demonstrating that these are specific RORα modulators (data not shown). CRC analysis showed that 23 of these compounds displayed concentration-dependent and sigmoidal response (
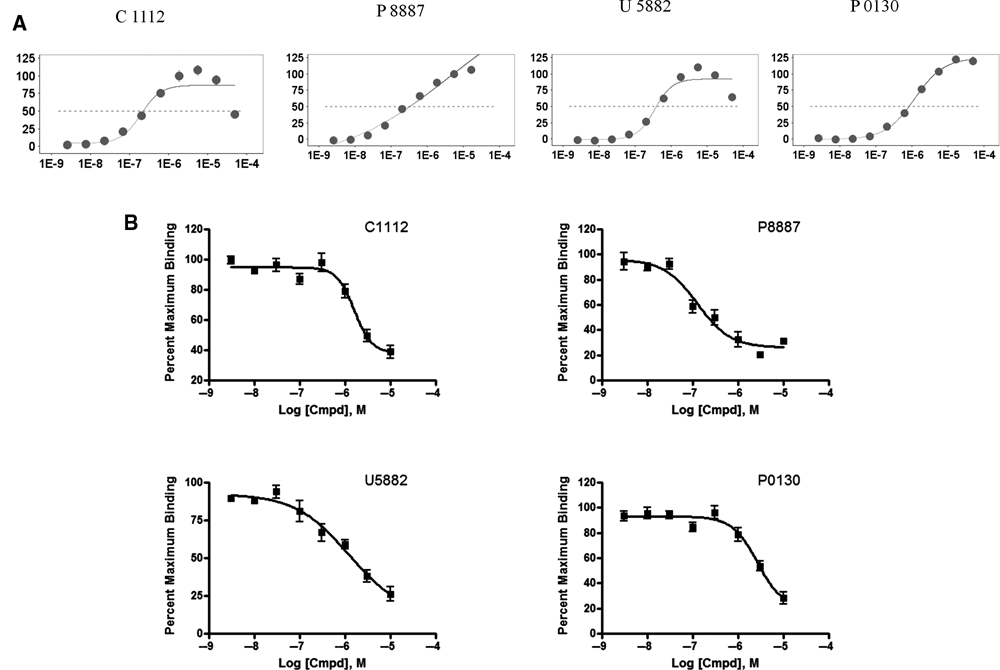
LOPAC hits concentration-response curves (CRCs) and radioligand receptor binding assay. (
LOPAC Hits Concentration-Response Curve
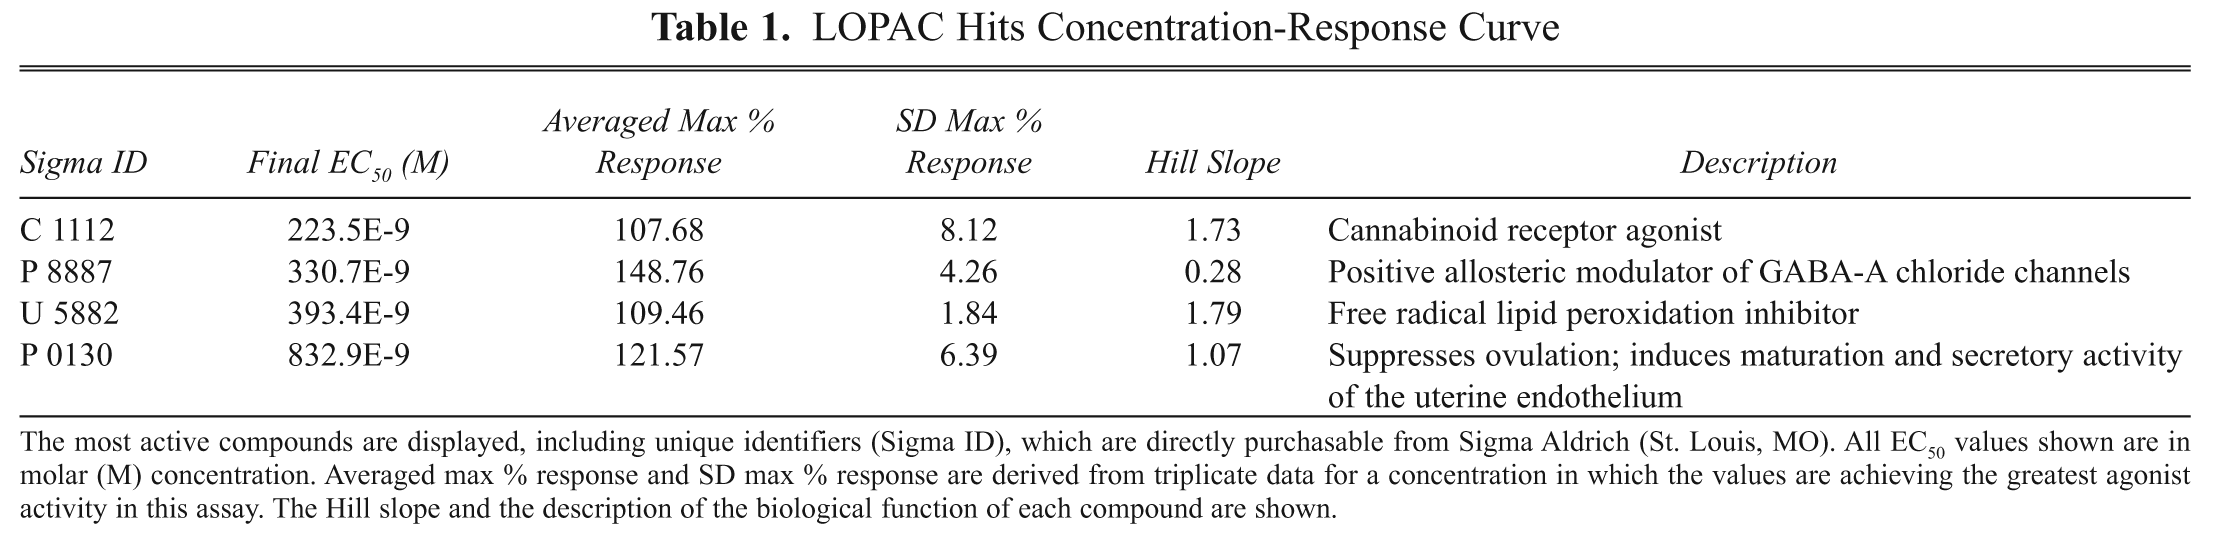
The most active compounds are displayed, including unique identifiers (Sigma ID), which are directly purchasable from Sigma Aldrich (St. Louis, MO). All EC50 values shown are in molar (M) concentration. Averaged max % response and SD max % response are derived from triplicate data for a concentration in which the values are achieving the greatest agonist activity in this assay. The Hill slope and the description of the biological function of each compound are shown.
Conclusion
We have established an HTS-compatible assay for identification of small-molecule compounds that modulate the interaction between RORα and PGC-1α using AlphaScreen® technology. We demonstrate that the assay is robust and sensitive with Z′ factor values over 0.5. By screening this assay against the 1280 pharmacologically active compounds in the Sigma LOPAC1280™ library, we demonstrate the HTS readiness of the assay. In summary, the results presented highlight the suitability of this assay for larger HTS campaigns.
Footnotes
Acknowledgements
We greatly appreciate the expert technical assistance of Guemalli Cardona from Lilly Research Laboratories, Eli Lilly and Company, Indianapolis, Indiana.
The efforts of P.R.G. were supported by the National Institutes of Health (NIH) Molecular Library Screening Center Network (MLSCN) grant U54MH074404 (Hugh Rosen, Principal Investigator).
References
Supplementary Material
Please find the following supplemental material available below.
For Open Access articles published under a Creative Commons License, all supplemental material carries the same license as the article it is associated with.
For non-Open Access articles published, all supplemental material carries a non-exclusive license, and permission requests for re-use of supplemental material or any part of supplemental material shall be sent directly to the copyright owner as specified in the copyright notice associated with the article.