
Abstract
The multidrug resistance protein 1 (MDR1) transporter is the most abundantly investigated adenosine triphosphate (ATP)–Binding Cassette (ABC) transporter protein. Multiple assay systems were developed to study MDR1-mediated transport and possible drug-drug interactions. Yet, as different probe substrates are used in these assays, it is difficult to directly compare the results. In this study, a common probe substrate was applied in 3 assay systems developed to study MDR1: the cellular dye efflux assay, the ATPase assay, and the vesicular transport assay. This probe substrate is calcein acetoxymethyl ester (calcein AM), the acetoxymethyl ester derivative of the fluorescent dye, calcein. Using a common probe allows the investigation of the effect of passive permeability on the result obtained by testing various compounds. In this study, 22 compounds with different logP values were tested in the above-mentioned 3 assay systems. The vesicular transport assay proved most sensitive, detecting 18 of 22 interactions with the protein. The ATPase assay detected 15 interactions, whereas the cellular dye efflux assay was the least sensitive with only 10 hits. A correlation was found between the hydrophobicity of the compound and the ratio of cellular and vesicular transport IC50 values, indicating the effect of passive permeability on the result. Based on hydrophobicity, the current study provides guidelines on applying the most correct tool for studying MDR1 interactions.
Introduction
M
Calcein acetoxymethyl ester (calcein AM) is a commonly used model substrate for MDR1. 6,7 Calcein is a fluorescent dye, originally developed for intracellular Ca2+ ion quantification. 8 Its acetoxymethyl ester (AM) derivative is transported by MDR1 and was proposed to be used as a probe for transporter-mediated cellular chemoresistance evaluation. 6 Three test systems using Calcein AM as probe substrate were evaluated in the current study.
The cellular dye efflux assay used in this study is a cellular inhibitory type assay. Calcein AM is an MDR1 transporter substrate with high permeability. Intracellularly, it is rapidly cleaved to free calcein, a low-permeability fluorescent molecule that is not a substrate of the transporter protein. Therefore, cells expressing MDR1 accumulate only low amounts of free calcein, whereas increased fluorescence indicates the blockade of MDR1-mediated calcein AM transport. Using this simple system, the interaction potential of various compounds with MDR1 can be studied.
The ATPase assay is a membrane-based assay that works on the assumption that substrate transport is strictly coupled with ATP hydrolysis. 9 During the assay, the amount of the liberated inorganic phosphate is measured. A concentration-dependent increase in inorganic phosphate generation is an indication of active transport. Thus, this assay system has the potential to indicate substrate nature of the tested compounds. Using a known substrate, an activator, one can study the inhibition potential of compounds on the transporter. In this study, we used calcein AM as an activator of MDR1.
The vesicular transport assay uses inside-out membrane vesicles. Due to the orientation of the vesicles, the substrates are transported into the vesicles. In the case of low-permeability substrates, when the compound becomes trapped in the vesicles and separated from the reaction buffer (e.g., rapid filtration), the compound remaining in the vesicles can be quantified. Calcein AM was chosen as probe substrate in this assay system as well, even though the compound has high passive permeability.
The set of test compounds was chosen from previous publications from the lab of Polli focusing on assay systems for MDR1. 10,11 This group has extensively studied the set in different assay systems such as measuring MDR1-MDCKII bidirectional transport, ATPase assay (activation mode), and cellular dye efflux assay using MDR1-MDCKII cells. A classification nomenclature was also generated based on the results of these 3 assays. However, in these studies, different probe substrates were used for the different test systems, making data difficult to correlate.
Our aim was to use the same probe in the above-mentioned 3 assay systems and correlate the results obtained with the hydrophobicity of the compounds. We also compared our results with those obtained in the work of Polli et al. 10 and Rautio et al. 11
Materials and Methods
Materials
Calcein AM was purchased from Invitrogen (Carlsbad, CA). Daunorubicin, colchicine, ranitidine, methotrexate, fexofenadine, diphenhydramine, triamterene, digoxin, dexamethasone, prazosin, cyclosporine A (CsA), trimethoprim, vinblastine, quinidine, reserpine, erythromycin, ketoconazole, propanolol, verapamil, testosterone, and all other chemicals were from Sigma (St. Louis, MO). Amprenavir was kindly provided by Oliver von Richter. 12 GF120918 was synthesized in house/in collaboration with the Institute of Pharmaceutical Chemistry at the University of Szeged following a published protocol. 13
Membrane vesicle preparations
Sf9 cells were cultured and infected with recombinant baculovirus coding MDR1 as described earlier. 14 Purified membrane vesicles from baculovirus-infected Sf9 cells were prepared as described previously with modifications. 14
Cells of human origin overexpressing MDR1 (MDR1-K) were chemically selected for MDR1 overexpression. Membrane vesicles were purified based on a method described previously with modifications. 15 Membrane protein content was determined using the BCA method (Pierce Biotechnology, Rockford, IL).
ATPase assay
The MDR1 Predeasy ATPase assay kit (Solvo Biotechnology, Szeged, Hungary) was used with modifications. The assay was performed as suggested by the manufacturer, but instead of using the reference activator (verapamil) in the kit, calcein AM (2 µM final concentration) was applied. Briefly, MDR1-Sf9 membrane vesicles (4 µg/well) were incubated in 50 µL ATPase assay buffer (10 mM MgCl2, 40 mM MOPS-Tris [pH 7.0], 50 mM KCl, 5 mM dithiothreitol, 0.1 mM EGTA, 4 mM sodium azide) with 5 mM ATP and various concentrations of test drugs for 10 min at 37°C. ATPase activities were determined as the difference of inorganic phosphate liberation measured with and without the presence of 1.2 mM sodium orthovanadate (vanadate-sensitive ATPase activity).
Vesicular transport assay
In the experiments, MDR1-containing and control-inverted membrane vesicles (MDR1-K and K-CTRL, manufactured by Solvo Biotechnology) were used. The final concentration of calcein AM in the assay was 1 µM, unless stated otherwise in the figure legends. The membrane vesicles (40 µg/well) were incubated in 75 µL reaction buffer (50 mM MOPS-Tris, 65 mM KCl, 7.5 mM MgCl2, pH 7.0) in the absence or presence of 4 mM ATP at 37 °C for 45 min, unless stated otherwise in the figure legends. The vesicles were separated by rapid filtration using a Millipore (Billerica, MA) vacuum manifold suitable for 96-well filterplates and washed. The remaining calcein AM was visualized and quantified after hydrolysis of the molecule to free calcein in the presence of 100 µL/well 0.1 N NaOH. Fluorescence was measured at excitation (Ex) 485 nm, emission (Em) 520 nm using a FLUOstar Omega (BMG Labtech, Offenburg, Germany) fluorimeter.
Cellular dye efflux assay
K562-MDR cells were cultured as previously described, 9 and 1 × 10⁵ cells were seeded into each well of a 96-well plate in Hank’s buffered salt solution (HBSS), pH 7.4. Test drugs at various concentrations and controls dissolved in DMSO were added and preincubated for 15 min at 37 °C. Calcein AM dissolved in HBSS containing 50 µg/mL bovine serum albumin (BSA) was added to a final concentration of 250 nM to each well (200 µL final volume), and fluorescence (Ex: 485 nm, Em: 520 nm) was recorded every 30 s for 8 min. All wells contained 1% DMSO. Based on the assay mechanism, the fluorescence increases with increasing inhibition of MDR1-mediated efflux of calcein AM.
Physicochemical properties
The partition coefficient (logP) and distribution coefficient at pH 7.4 (logD7.4) of the molecules in the data set were calculated using MarvinSketch 5.3 software (ChemAxon, Budapest, Hungary).
Data analysis
For data analysis, GraphPad PRISM 5.0 software (GraphPad Software, Inc., San Diego, CA) was applied, using the following equations: Km and Vmax values for calcein AM transport characterization were calculated using the Michaelis-Menten equation (equation (1)), after estimating the number of binding sites from the Hill plot:
where V is velocity (pmol substrate per mg protein per minute), Vmax is maximal velocity, [S] is substrate concentration in µM, and Km is the Michaelis-Menten constant.
The results of the vesicular transport, ATPase, and cellular dye efflux assays were analyzed using the 4-parameter logistic equation (equation (2)):
where V is velocity (pmol substrate per mg protein per minute), Vmin is minimal velocity (fully inhibited transport), Vmax is maximal velocity (in the absence of inhibitor), IC50 is inhibitor concentration producing 50% of maximal response, and Hill slope is the parameter characterizing the degree of cooperativity.
Results and Discussion
Physicochemical properties of the compound set
The compounds were ranked based on their logP values calculated by the MarvinSketch 5.3 software (ChemAxon). The calculated values are listed in Table 1 .
Physicochemical Properties and IC50 Values from Various Assay Systems
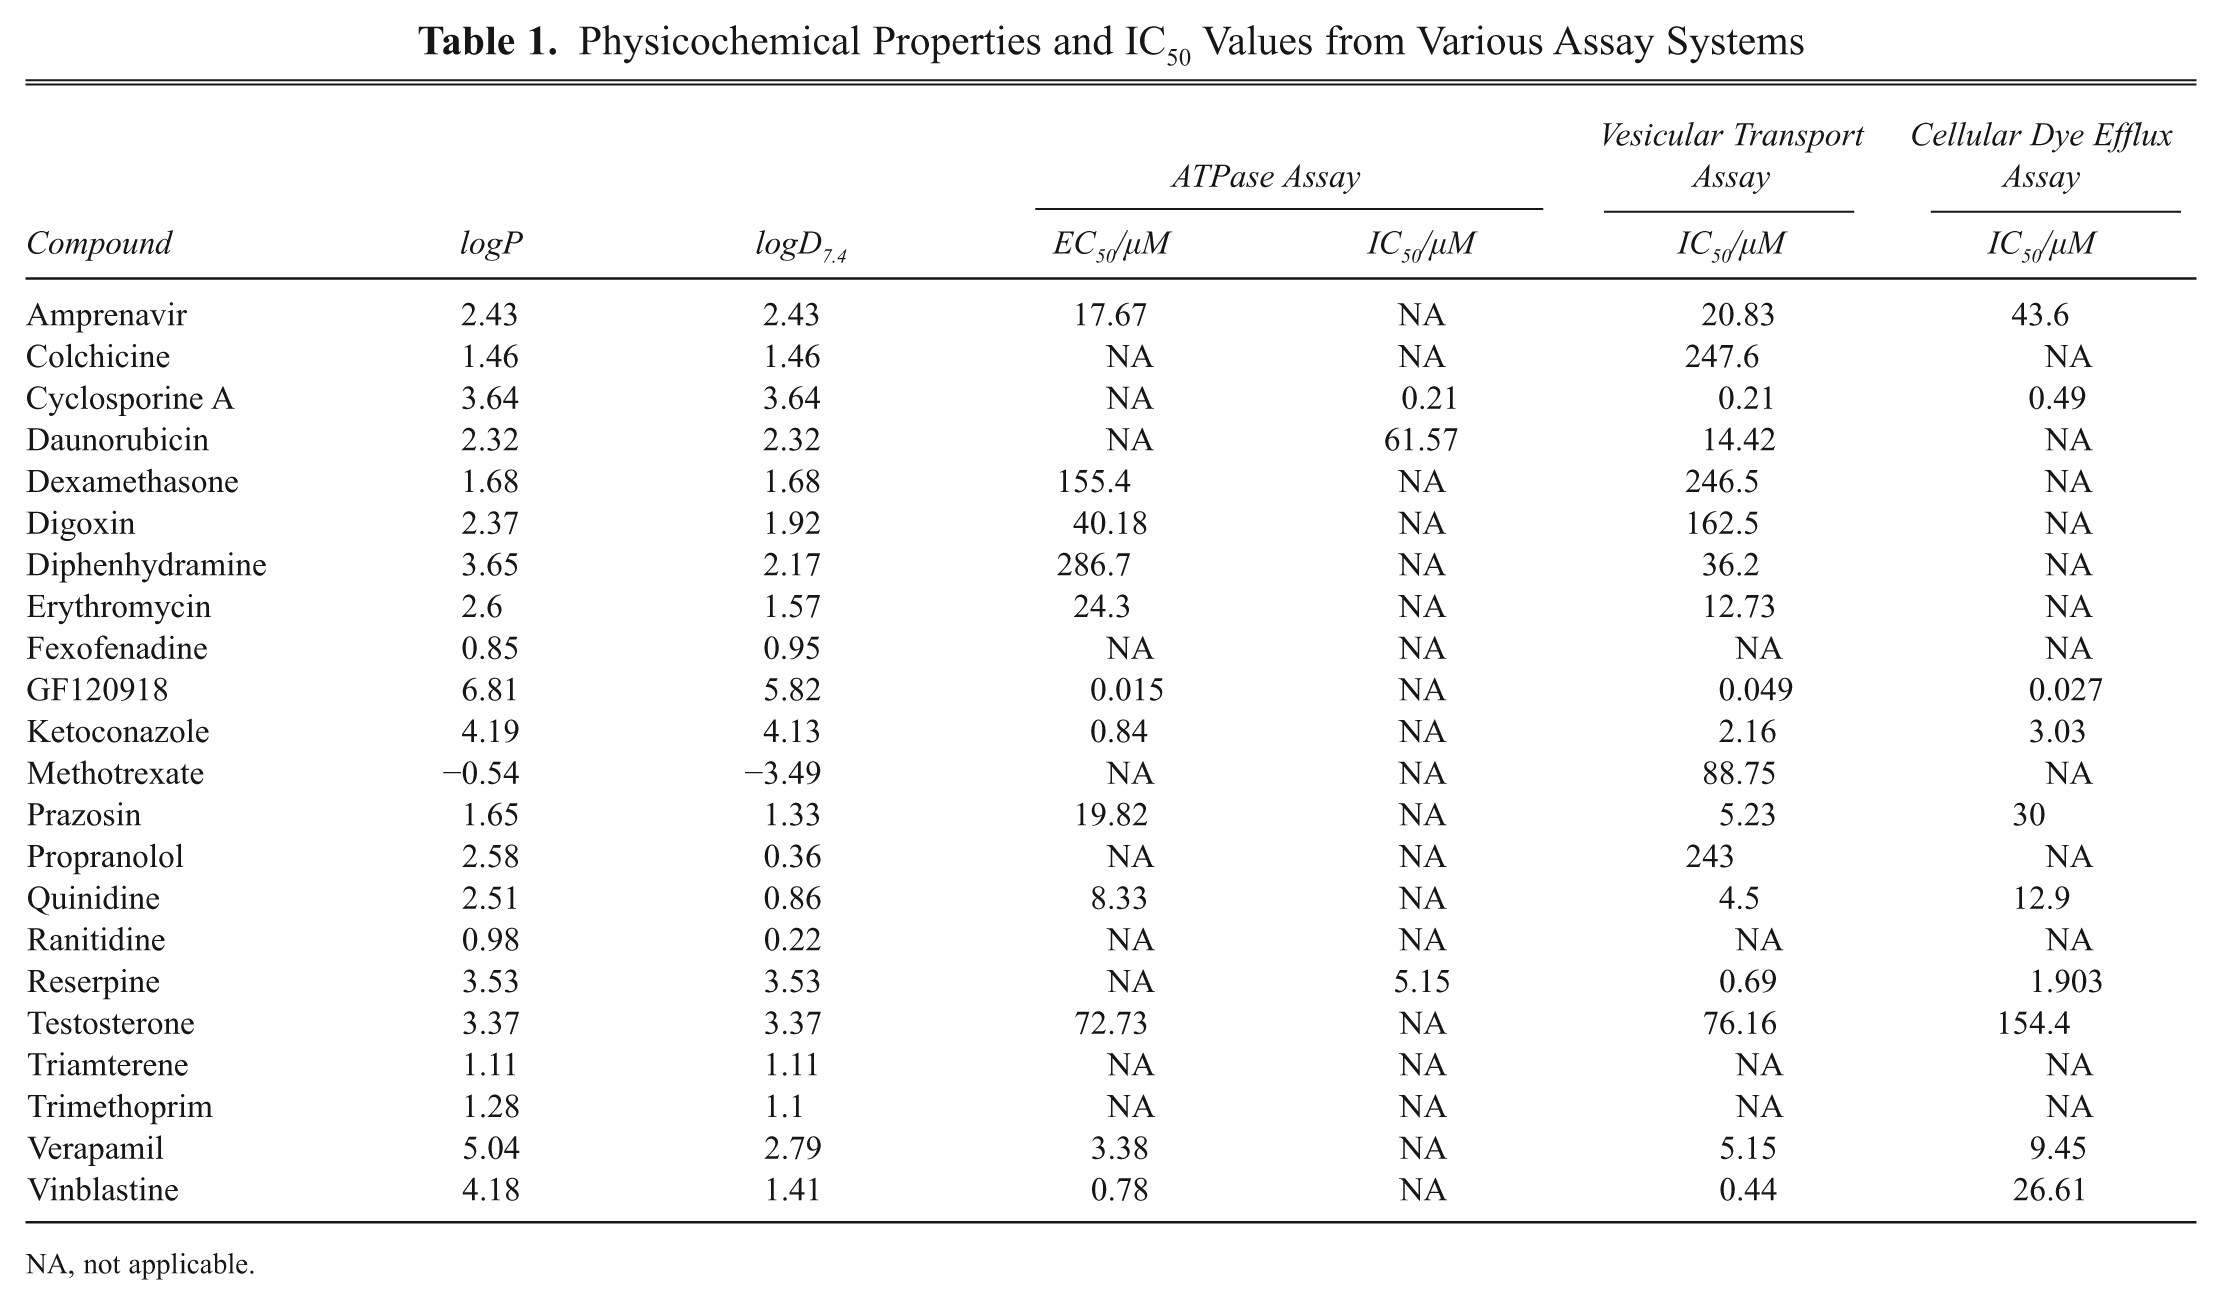
NA, not applicable.
ATPase assay
Calcein AM, at a final concentration of 2 µM, activated the MDR1-containing membrane preparation to a similar extent as did the reference activator, verapamil (final concentration: 40 µM), from ~15 nmol Pi/mg protein/min to ~45 nmol Pi/mg protein/min.
Of the 22 compounds, 12 activated the MDR1 ATPase activity in the assay. Only 3 compounds acted as inhibitors of the MDR1 transporter activated by calcein AM, and 7 compounds were noninteractors. Examples for activators, inhibitors, and noninteractors determined in the ATPase assay are shown in Figure 1 . The calculated EC50 and IC50 values are presented in Table 1 .
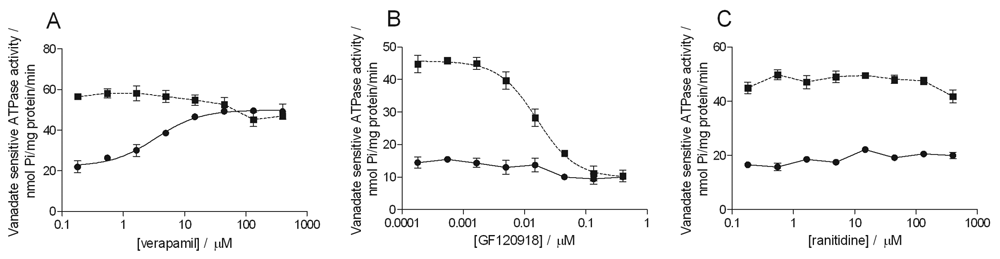
Examples for compounds activating, inhibiting, or noninteracting with calcein AM–activated MDR1 transporter in the ATPase assay. Panel
Vesicular transport assay
Calcein AM as a probe substrate in the vesicular transport assay displayed Km and Vmax values of 3.50 ± 1.75 µM and 66.43 ± 11.61 pmol/mg protein/min, respectively (
Fig. 2A
). The dynamic range of the assay was ~1.5 to 2 at 1 µM concentration. Control vesicles devoid of MDR1 transporter showed no ATP-dependent accumulation of calcein AM (data not shown). The uptake into the vesicles was linear up to 45 min and was sensitive to osmolarity (
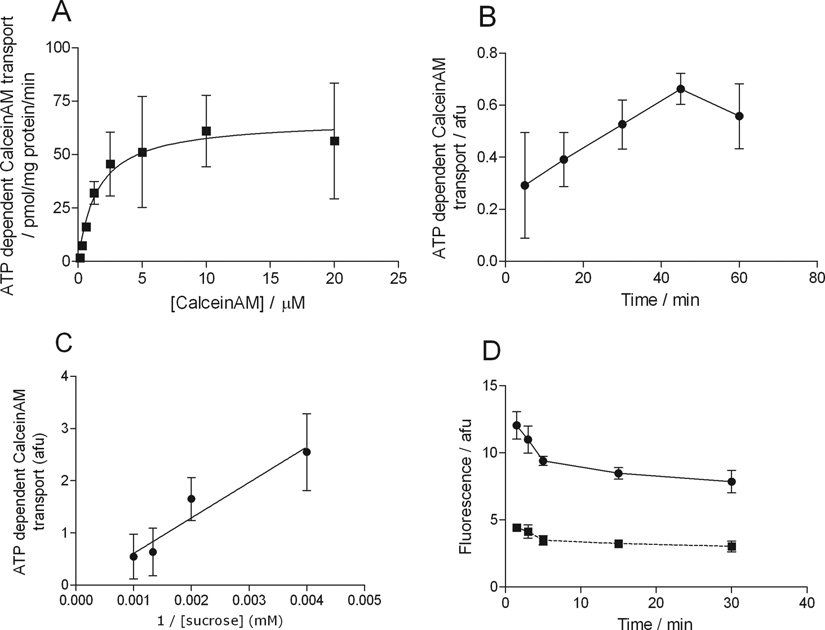
Characterization of MDR1-mediated calcein AM transport in the vesicular transport assay. Panel
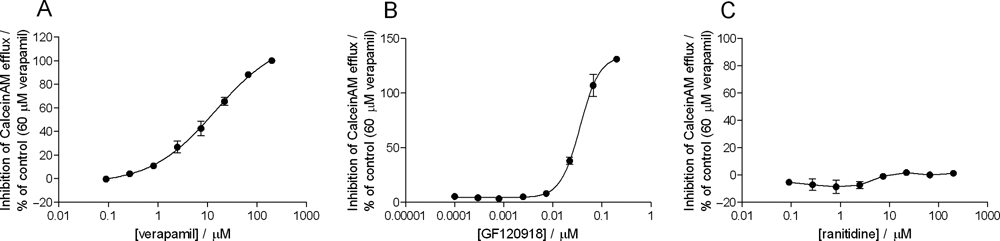
Eighteen of the 22 compounds inhibited the MDR1-mediated calcein AM transport. Examples of interactors and noninteractors are shown in Figure 3 . The calculated IC50 values are presented in Table 1 .
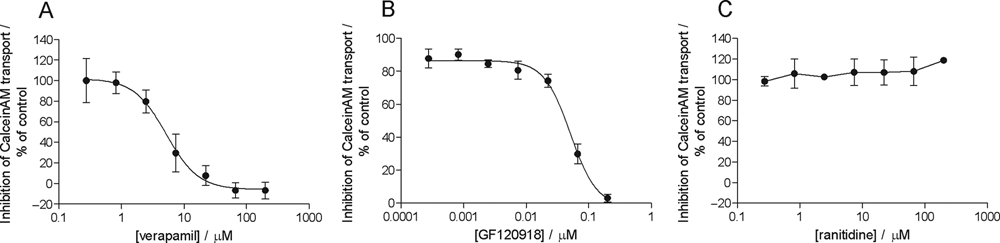
Examples of compounds interacting and noninteracting with MDR1 in the calcein AM vesicular transport assay. Panels
Cellular dye efflux assay
Ten compounds inhibited the calcein AM accumulation dose dependently in MDR1-expressing cells. Low-permeability compounds did not inhibit calcein AM transport even if they interacted in other assays. Examples of interactors and noninteractors are shown in Figure 4 . The calculated IC50 values are presented in Table 1 .
Examples of compounds inhibiting or noninteracting with MDR1 in the cellular dye efflux assay. Panels
Discussion
Utilization of the same probe substrate in different assay systems carries many advantages. Results are more comparable, and the strengths and limitations of the given assay systems are more apparent. It should be noted that MDR1 features complex transport kinetics. Depending on the probe substrate, a drug may potentiate or inhibit the MDR1-mediated transport due to allosteric interactions. 16 In the current study, calcein AM was used as an MDR1 probe substrate in 3 assay systems: as an activator in the ATPase assay, as a probe substrate in the cellular dye efflux assay, and in the vesicular transport assay. The suitability of the high-passive permeability calcein AM as a probe in the vesicular transport assay was unexpected, as this test system typically works with low-permeability substrates. The mechanism is still unknown; hypotheses include faster inward transport than passive diffusion outward or partial cleavage of AM moieties inside the vesicles. Nevertheless, an active, ATP-dependent transport was observed and characterized as shown in Figure 2 . The calcein AM accumulation is sensitive to the osmolarity of the buffer, as shown in Figure 2C , confirming the active nature of the transport.
Not all compounds interacted alike in the 3 assay systems. The findings are summarized in Figure 5 . The compounds with their EAC classification (EAC: E, monolayer efflux; A, drug-stimulated ATPase; C, calcein AM) are ranked based on their partition coefficient. 10 The compounds listed as noninteractors in the literature (NNN) were excluded from the graph as no interaction was observed in any of the test systems. The only exception was methotrexate, which inhibited the MDR1-mediated calcein AM transport in the vesicular transport assay in the current study. The following deviations from the literature studies were observed: in 3 cases (cyclosporine A, daunorubicin, GF120918) according to literature, no interaction was observed with the ATPase assay. It should be noted that the original work used only the activation mode of the ATPase assay and neglected the inhibitory approach. 10 The above listed 3 compounds inhibited the calcein AM–activated MDR1 ATPase activity. In the present study, 2 compounds (trimethoprim and diphenhydramine) interacted with MDR1 in fewer test systems compared to the literature, whereas dexamethasone interacted with the transporter in the ATPase assay that was not observed previously. Figure 5 demonstrates that the parameters obtained in the various assays systems are in good correlation.
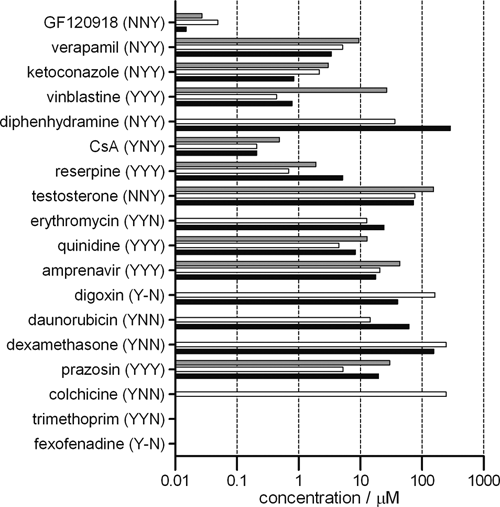
Collection of EC50/IC50 values measured in the various assay systems. The compounds with their EAC classification are listed based on their logP values (increasing from bottom to top). The NNN compounds are not included. Gray bars represent the IC50 values obtained in the cellular dye efflux assay, white bars represent the IC50 values from the vesicular transport assay, and the black bars represent the EC50 or IC50 values measured in the ATPase assay.
Comparison of assay results with logP values revealed that the cellular dye efflux assay is limited to medium/high-permeability compounds. This may be due to the requirement of the compound to cross the lipid bilayer to be able to interact with the transporter. Furthermore, in agreement with our previous results, IC50 values shifted compared to that observed in vesicular transport in the case of medium-permeability compounds. 12 In such cases, the intracellular concentration of the compounds might be lower than their concentration in the buffer.
The vesicular transport assay was the most sensitive, as the interaction with the transporter is not limited by permeability. This assay can be considered the best in vitro model to study interactions with the transporter. The ATPase assay showed good correlation with the vesicular transport results, although it had the limitation to bypass some transported substrates, such as cyclosporine A.
In the case of high-permeability compounds, IC50/EC50 values correlated well within the 3 assays. A tendency between passive permeability and IC50 shift in the cellular dye efflux assay could be observed. For medium-permeability compounds, a shift in the cellular dye efflux assay IC50 value was observed, pointing to the possibility that intracellular concentrations of these compounds may be lower than that in the buffer. For low-permeability compounds, no interaction was observed in the cellular dye efflux assay.
Results were compared with those published by Polli et al. 10 Based on the EAC classification in von Richter et al., 12 3 of the 22 compounds deviated (13%) from the results published. In the case of the ATPase assay, more interactions could be detected by using both the activation and inhibition modes than when using the activation mode alone. The inhibition mode ensures the detection of inhibitors and some transported substrates such as GF120918 and cyclosporine A or daunorubicin.
The ratio of cellular dye efflux assay and vesicular transport assay IC50 values was calculated to investigate the role of passive permeability of the compounds on the MDR1 interaction. Figure 6 shows a reasonable correlation between the IC50 ratios and the logP and logD7.4 values, with regression values of 0.61 and 0.54, respectively. The only outlier was vinblastine, with an exceptionally high IC50 ratio of ~60. This compound was not included in the analysis. This finding indicates that the cellular IC50 value is highly influenced by the passive permeability of the compound. The slope of the curve in both cases was −0.71, indicating a close to equal contribution of hydrophobicity in the ratio of IC50 values.
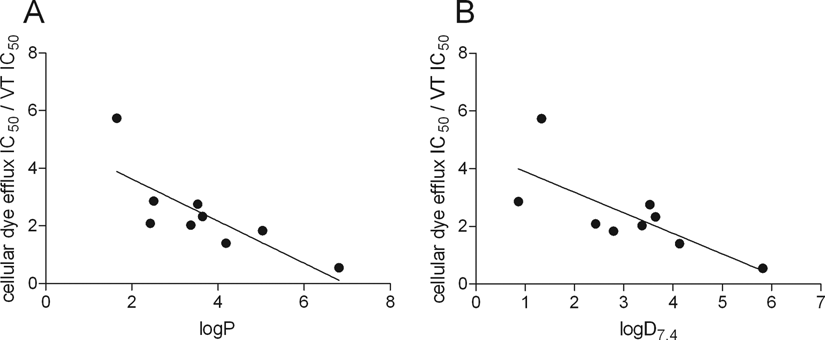
Correlation between the ratio of cellular dye efflux assay and vesicular transport IC50 values and the hydrophobicity of the compound. Panel
Table 2 contains examples with proposed use of the various MDR1 assay systems. The most problematic compounds, listed as “nontransported substrates” in the literature such as verapamil and ketoconazole, are hard to analyze in the monolayer assay, as the transport is saturated at low concentrations and the compound tends to passively cross the cell layer. Indeed, both verapamil and ketoconazole show an MDR1/Mdr1a-dependent blood-brain barrier penetration in vivo. 17,18 In these cases, it is suggested to use other assay types—especially the ATPase assay, which is suitable for distinguishing substrates and inhibitors of MDR1.
Examples for the Suggested Use of MDR1 Assays
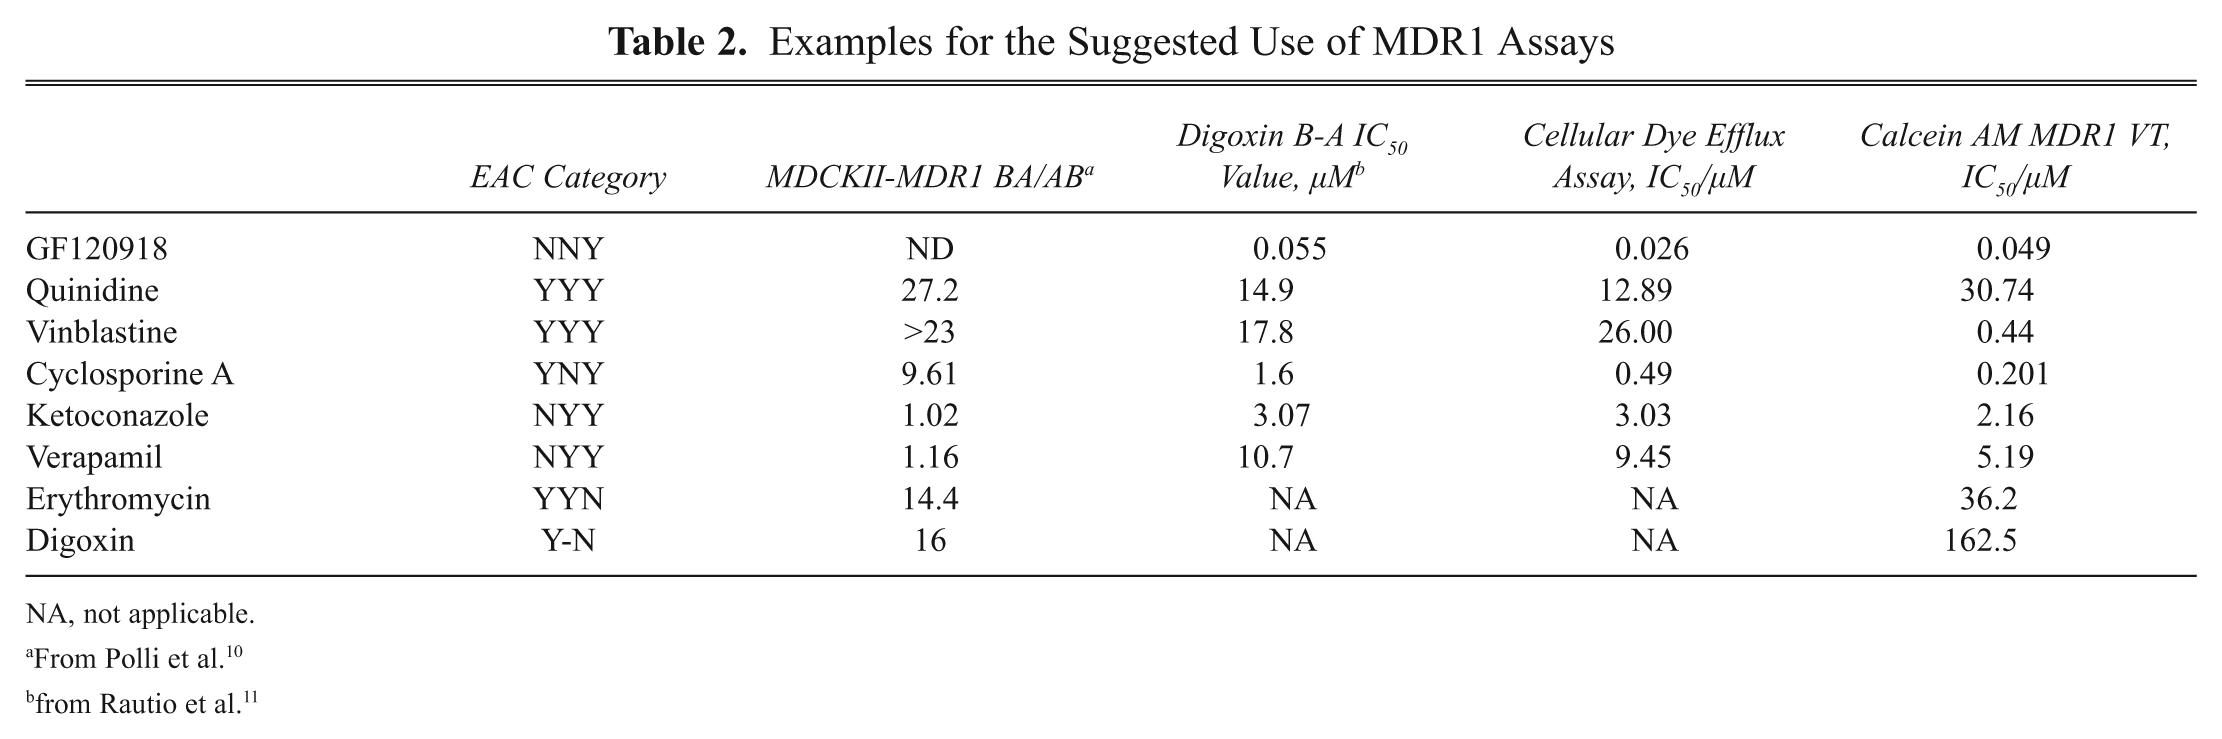
NA, not applicable.
From Polli et al. 10
from Rautio et al. 11
Footnotes
Acknowledgements
The work was supported by Hungarian grant Asboth-XTTPSRT1 and European Community grant Memtrans-LSHB-CT-2006-518246.