
Abstract
In genome-scale RNA interference (RNAi) screens, it is critical to control false positives and false negatives statistically. Traditional statistical methods for controlling false discovery and false nondiscovery rates are inappropriate for hit selection in RNAi screens because the major goal in RNAi screens is to control both the proportion of short interfering RNAs (siRNAs) with a small effect among selected hits and the proportion of siRNAs with a large effect among declared nonhits. An effective method based on strictly standardized mean difference (SSMD) has been proposed for statistically controlling false discovery rate (FDR) and false nondiscovery rate (FNDR) appropriate for RNAi screens. In this article, the authors explore the utility of the SSMD-based method for hit selection in RNAi screens. As demonstrated in 2 genome-scale RNAi screens, the SSMD-based method addresses the unmet need of controlling for the proportion of siRNAs with a small effect among selected hits, as well as controlling for the proportion of siRNAs with a large effect among declared nonhits. Furthermore, the SSMD-based method results in reasonably low FDR and FNDR for selecting inhibition or activation hits. This method works effectively and should have a broad utility for hit selection in RNAi screens with replicates.
Introduction
G
The false positives in an experiment are controlled by the false-positive rate (FPR) and/or false discovery rate (FDR). The false negatives are controlled by the false-negative rate (FNR) and/or false nondiscovery rate (FNDR). As pointed out by Storey and Tibshirani, 24 FPR and FDR are often mistakenly equated, but their difference is actually very important. So are FNR and FNDR. Zhang 23 proposes p*-value and q*-value to control FNR and FNDR, respectively, and provides the calculation of SSMD-based p-value, p*-value, q-value, and q*-value from a theoretical basis. In this article, we examine actual genome-scale RNAi data to illustrate the difference between FDR and FPR as well as that between FNDR and FNR. In particular, we demonstrate how to use SSMD-based q-value and q*-value to select inhibition hits in a primary siRNA screen for diabetes drug targets as well as how to select activation hits in a confirmatory screen for neurological disease drug targets.
Methods and Materials
An siRNA primary screen to identify novel targets for diabetes
A genome-wide RNAi screen was conducted to identify modulators of glucose output using a multiplexed array gene expression assay. A 7000-gene siRNA library representing the druggable genome was tested using pools of 3 siRNAs for each target in 4 replicates. A human hepatoma cell line (PLC PRF 5) was transfected with siRNA and treated with dexamethasone, cAMP, and a suboptimal dose of insulin. After 48 h, a 4-gene quantitative nuclease protection assay (qNPa; High Throughput Genomics, Tucson, AZ) in a 384-well format was used to measure the gene expression of beta-actin, glucose-6-phosphatase (G6PC), and pyruvate dehydrogenase kines 4 (PDK4) (in addition to a negative control gene). siRNAs that modulate the gene expression of these readouts were analyzed and tested for their ability to modulate gluconeogenesis and insulin sensitivity. The major goal in this screen was to select siRNAs with inhibition effects to identify potential diabetes drug targets.
An siRNA confirmatory screen for neurological disease targets
Following a primary screen without replicates in which a total of 23,653 pools of 3 siRNAs were tested, 960 pools of siRNAs were selected for further investigation in a confirmatory screen. Most of these 960 siRNAs showed activation activity in the primary screen. This confirmatory siRNA screen was carried out to identify genes involved in the regulation of adenosine triphosphate (ATP) binding cassette transporter protein 1 (ABCA1). The 960 pools of 3 siRNAs were transfected into H4 neuroglioma cells in a 384-well plate format. A reverse transfection protocol was used, with a cell density of 6000 per well. Forty-eight hours later, cells were assayed for cell viability and then lysed. Cell lysates were then used to measure total ABCA1 levels by enzyme-linked immunosorbent assay (ELISA). siRNAs that substantially altered total ABCA1 levels in H4 cells were considered hits. The 960 pools of siRNAs were arranged in 3 source plates; 4 experimental plates were generated from each source plate. The goal in the above confirmatory screen was to select activation hits to identify potential neurological disease targets.
SSMD-based methods controlling false discovery and false nondiscovery rates
In RNAi screens with replicates, there are several sets of source plates. Each set is unique and is repeated n times, and thus each siRNA has n replicates. Because plate-to-plate variability is usually much higher than within-plate variability, we calculated the difference (i.e., Dj
) between the measured intensity of an siRNA and average intensity of a negative control in the plate where this siRNA is located. Then we calculated the average difference (i.e., D̄) of all replicates for this siRNA—namely,
In the 2 experiments described in this article, inhibition is equivalent to downregulation. The FPR and FNR are controlled using p-value and p*-value, respectively. For selecting inhibition hits, using classical tests of testing no average inhibition effect (i.e., H
0: mean difference ≥ 0), we have p-value=F
t(n−1)(t
obs) and p*-value=1−F
t(n−1)(t
obs) for an siRNA with an observed t-value tobs
, where F
t(n−1)(·) is the cumulative distribution function of a central t-distribution with n−1 degrees of freedom. Traditional methods use one constant (i.e., 0 here) to group siRNA into interesting and noninteresting. To serve the need in RNAi screens, recently proposed methods use 2 constants to group siRNAs into interesting, tolerable, and noninteresting.
23
When using 2 constants µ1 and µ2 of mean difference µ for selecting inhibition hits, we have
We can use existing R packages (e.g., qvalue, 24 multtest, 26 or fdrtool 27 ) to convert p-value into q-value for controlling FDR with respect to a small effect β2 or µ2 and to convert p*-value into q*-value for controlling FNDR with respect to a large effect β1 or µ1. Similarly, we can obtain p-value, p*-value, q-value, and q*-value for the activation (i.e., upregulated) direction. See Zhang 23 for more details on how these methods are developed.
Results
A diabetes target identification siRNA primary screen
Based on traditional methods of testing H
0: mean difference ≥ 0 for selecting inhibition hits, the p-value, q-value, p*-value, and q*-value for each siRNA in the diabetes siRNA target identification screen are represented by black, red, blue, and green points, respectively, in
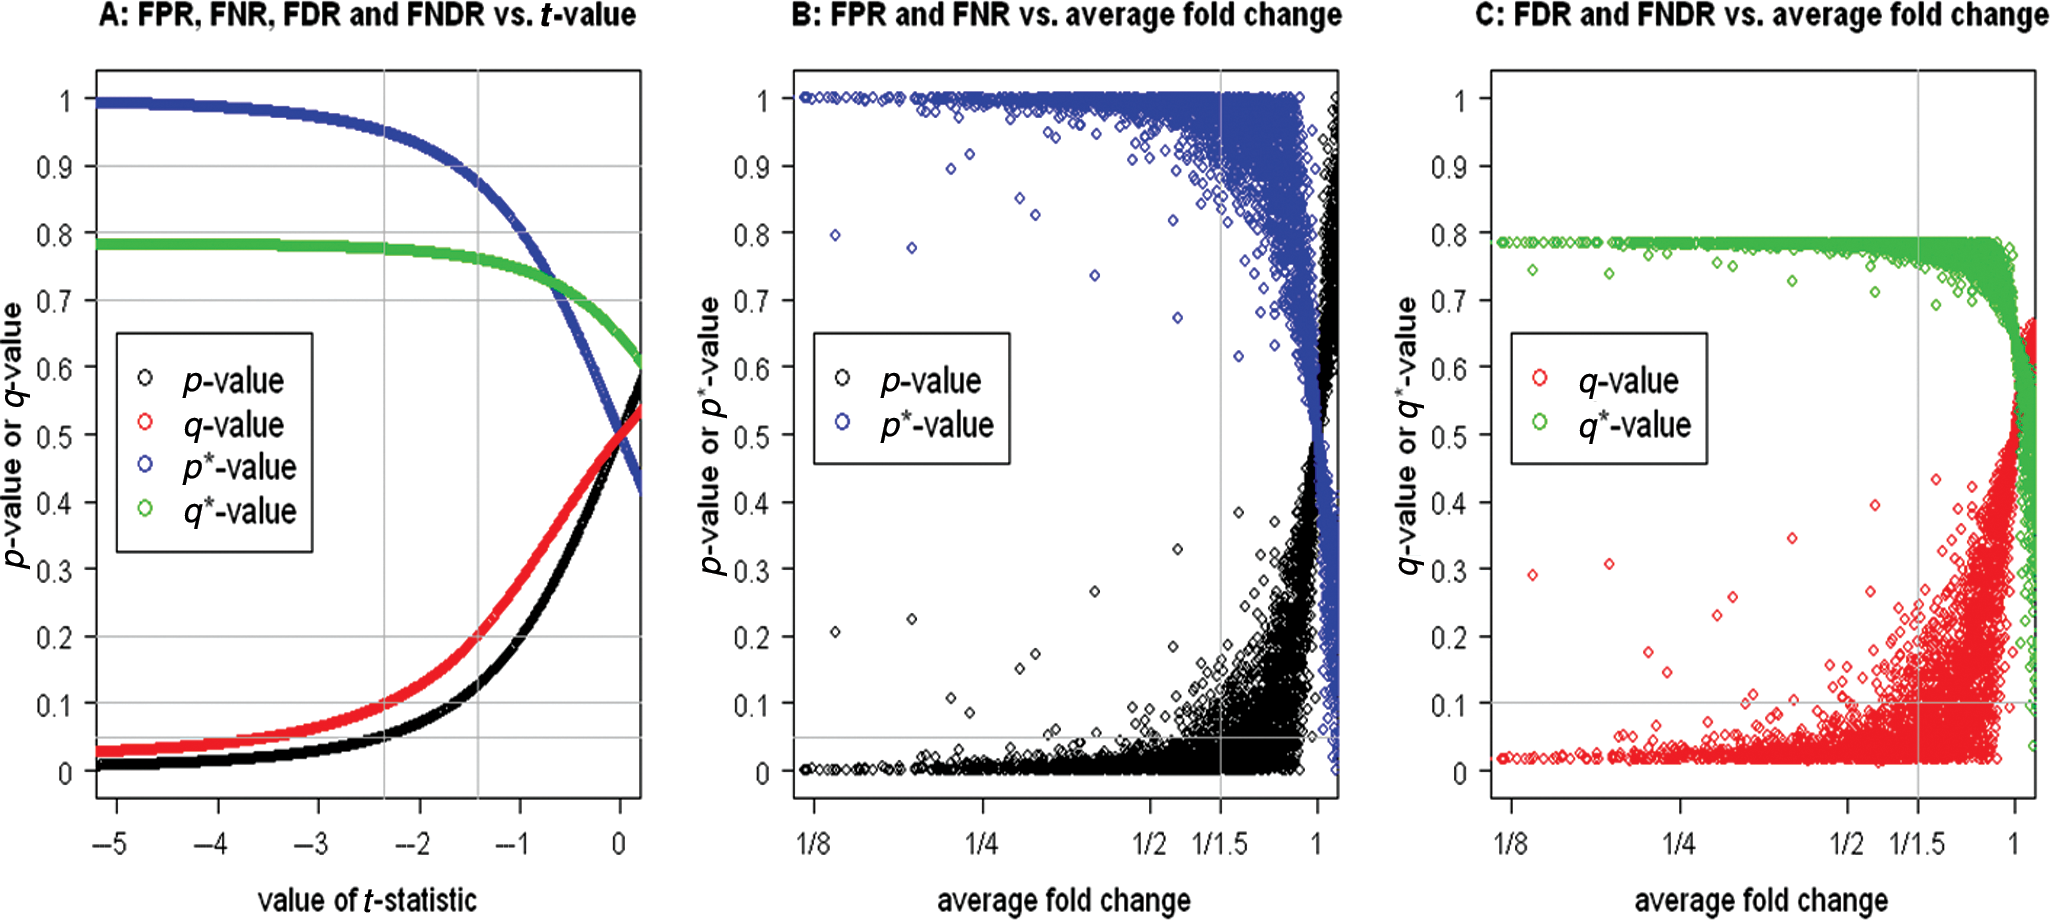
The false-positive rate (FPR), false-negative rate (FNR), false discovery rate (FDR), and false nondiscovery rate (FNDR) of the traditional t-test for testing no mean difference for selecting siRNAs inhibiting G6PC activity in a diabetes siRNA screen. The fold change is the ratio of the measured value of an siRNA versus that of a negative control in a plate. FPR, FNR, FDR, and FNDR are controlled through p-value, p*-value, q-value, and q*-value, respectively.
The t-value from traditional t-tests is dominated by sample size: the larger the sample size, the larger the absolute value of t-value; thus, it cannot be used to assess effect size. Mean difference (or, equivalently, average fold change) is a statistical parameter that is robust to sample size: its estimated value approaches its true value when sample size gets larger. However, because mean difference does not contain information about data variability (variance), the same value of mean difference may correspond to different p-values even when the sample size is the same for all siRNAs. For example, an siRNA with an average fold change of about 1.5 in the inhibition direction may have an FPR ranging from 0 to 0.2 (black points in
SSMD is the ratio of mean to standard deviation of the difference between an siRNA and a negative reference group.
21
Thus, SSMD is robust to sample size similar to mean difference and contains information about data variability similar to t-value.
25
There is a meaningful and interpretable SSMD-based criterion for classifying the size of siRNA effects.
22
Thus, we can use SSMD to define false negatives and false positives as shown in Zhang.
23
That is, for selecting inhibition hits, the false negatives are defined as the siRNAs with true SSMD values of less than β1, where β1 is a negative value such as −2 or −3 among declared nonhits. The false positives are defined as the siRNAs with true SSMD values greater than β2, where β2 is a negative value such as 0 or −0.25 among selected hits.
22
Based on the calculation of the corresponding FPR, FNR, FDR, and FNDR provided in Zhang,
23
we can obtain a q-value, q*-value, p-value, and p*-value for selecting inhibition hits in the diabetes siRNA target identification screen, as shown in
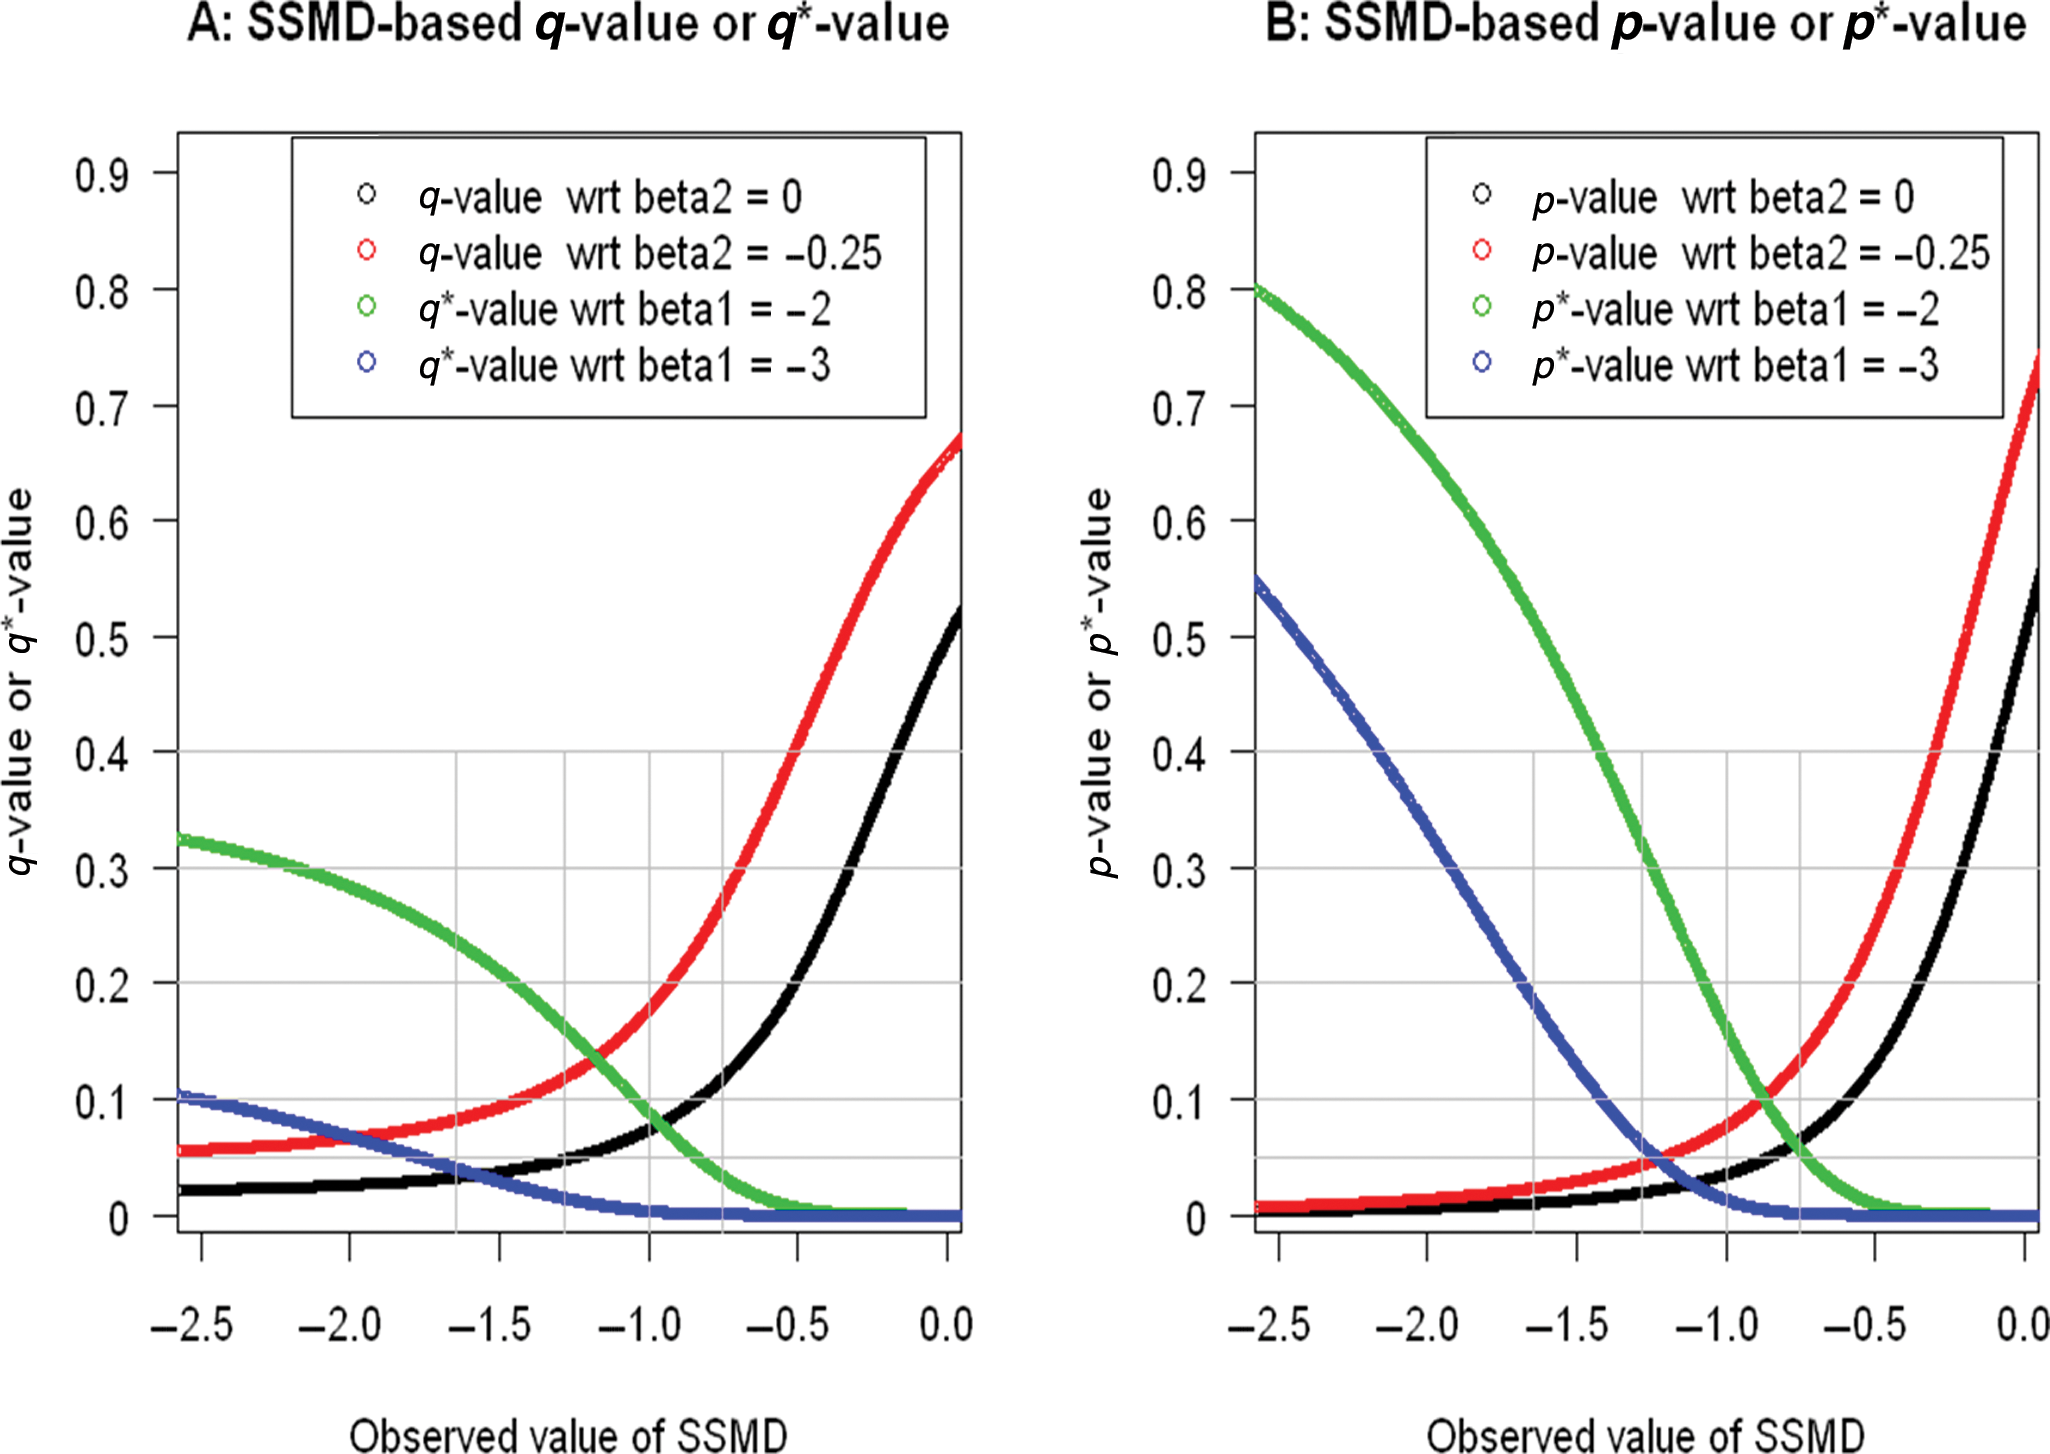
The q-values, q*-values, p-values, and p*-values with respect to (shortened as “wrt” in the figure legends) various true values of SSMD (
When using SSMD for selecting inhibition hits in RNAi screens, we normally use the following decision rule: an siRNA is selected as a hit if it has an estimated SSMD value less than or equal to a critical value; it is considered a nonhit otherwise. The application of this decision rule relies on the determination of a critical value that is normally achieved through the consideration of FDR and FNDR.
FDR and FNDR for Selecting Inhibition Hits among 6613 siRNAs under Investigation in a Primary siRNA Screen with 4 Replicates for Diabetes
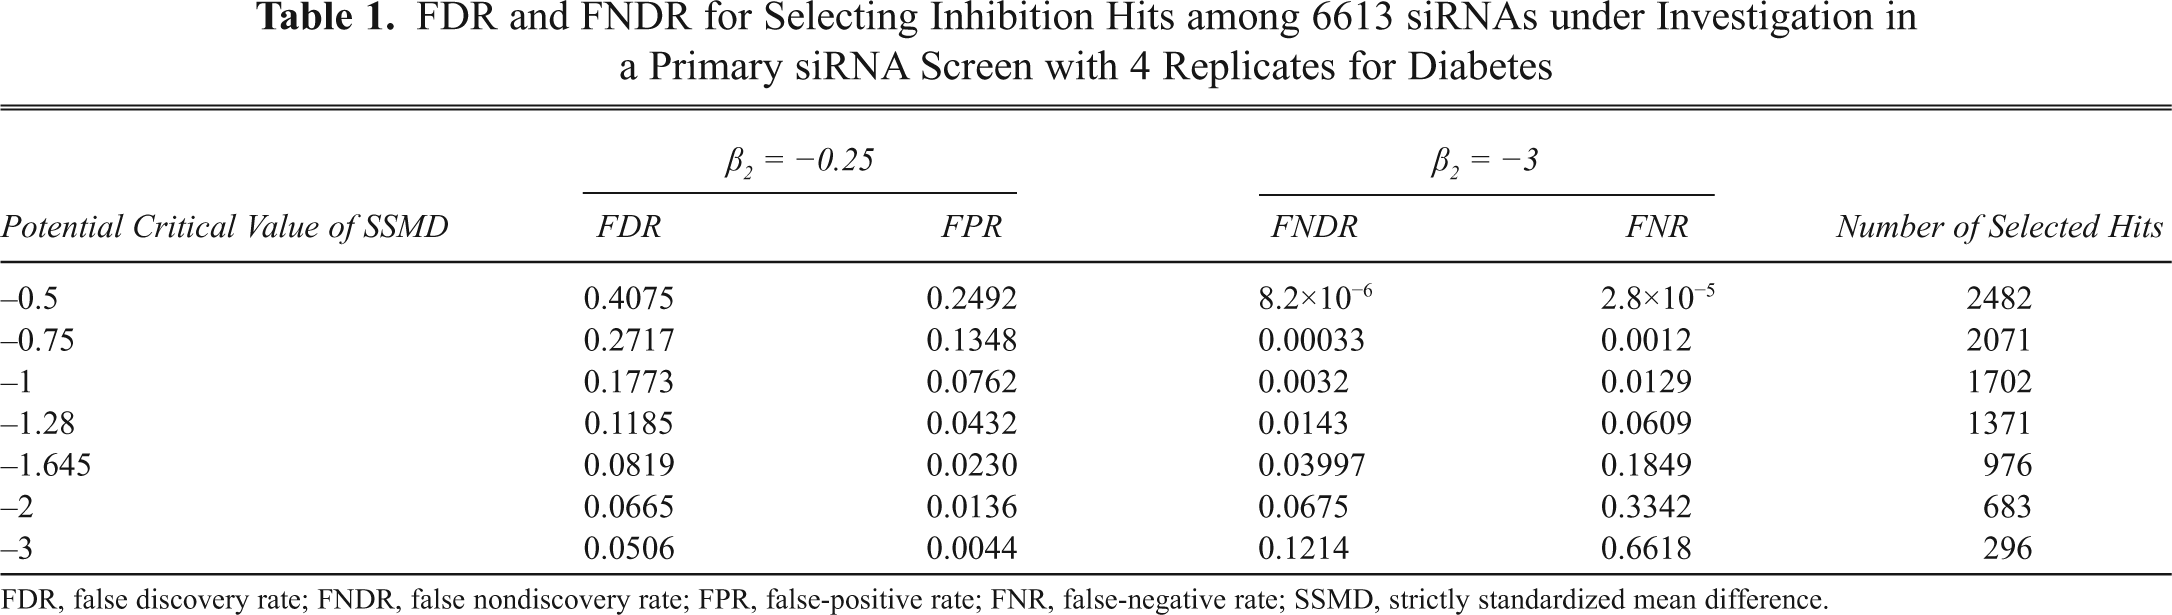
FDR, false discovery rate; FNDR, false nondiscovery rate; FPR, false-positive rate; FNR, false-negative rate; SSMD, strictly standardized mean difference.
The error rates in
Similarly, the critical value of −1.28 leads to an FNDR of 0.0143 with respect to very strong inhibition effects or stronger inhibition effects, as well as an FNR of 0.0609 with respect to extremely weak effects or no inhibition. The FNDR of 0.0143 indicates that among the 5242 (6613 − 1371) declared nonhits for inhibition, on average 75 (5242×0.0143) have very strong effects or stronger effects. By contrast, the FNR of 0.0609 indicates that, assuming all the 6613 siRNAs included in the experiment have a very strong inhibition effect or stronger inhibition effects, the critical value of −1.28 will lead to the identification of 403 (6613×0.0609) siRNAs as nonhits on average due to chance alone. Again, the FNR does not answer the question of interest about the proportion of siRNAs with very strong effects or stronger effects among the declared nonhits, whereas FNDR does. In addition, the assumption that all the 6613 siRNAs included in the experiment have very strong inhibition effects or stronger inhibition effects is not supported. Therefore, FDR and FNDR can address important questions of interest in the process of hit selection in RNAi screens better than FPR and FNR. Consequently, one should focus on the control of FDR and FNDR through q-value and q*-value rather than the control of FPR and FNR through p-value and p*-value in genome-scale RNAi screens.
From
Besides FDR and FNDR, another consideration that needs to be taken into account when planning a primary RNAi screen is the capacity to carry out follow-up confirmatory assays on leads from the primary screen. Confirmatory capacity might typically range from 300 to 2000 siRNAs. With this consideration, we use the critical value of −1.645 for selecting inhibition hits, which leads to the selection of 976 inhibition hits. From
Similarly, we use the following decision rule to select activation hits: an siRNA is selected as a hit if it has an estimated SSMD value greater than or equal to a specified critical value; it is considered a nonhit otherwise. Based on the calculation provided in Zhang,
23
we obtain the FDRs and FNDRs for 7 potential critical values in the activation direction, as shown in
FDR and FNDR for Selecting Activation Hits among 6613 siRNAs under Investigation in a Primary siRNA Screen for Diabetes Drug Targets
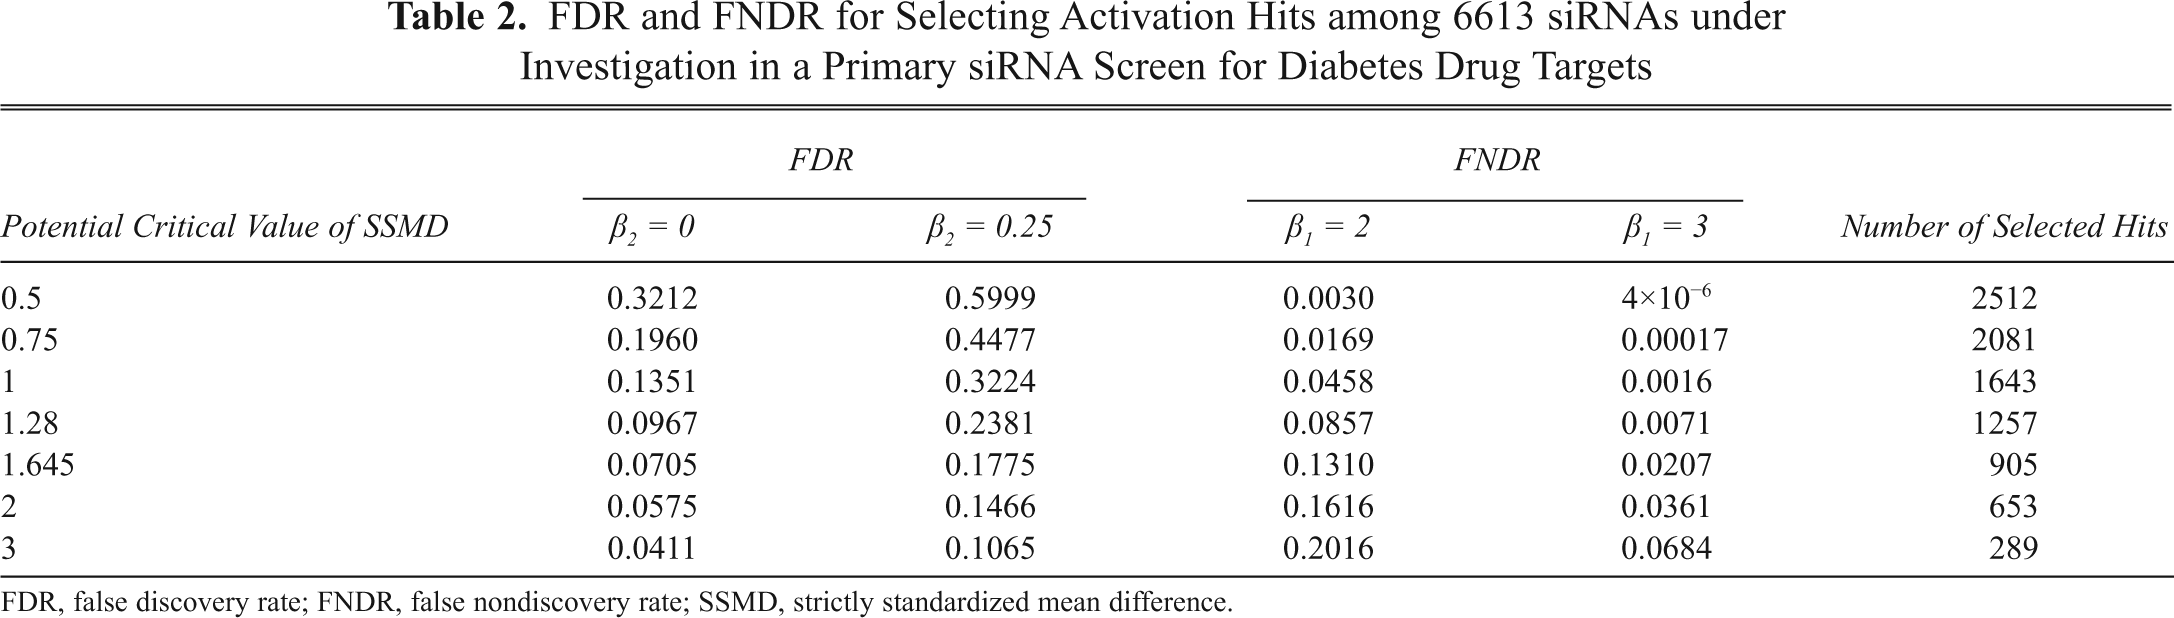
FDR, false discovery rate; FNDR, false nondiscovery rate; SSMD, strictly standardized mean difference.
An siRNA confirmatory screen for neurological disease targets
In the confirmatory screen for neurological disease targets described in the Materials and Methods section, the goal is to select activation hits. Accordingly, we need to search for a critical value via the following decision rule for selecting activation hits: an siRNA is selected as an activation hit if it has an estimated SSMD value greater than or equal to a specified critical value; it is declared a nonhit otherwise. The determination of this critical value mainly relies on the control of FDR and FNDR through q-value and q*-value in
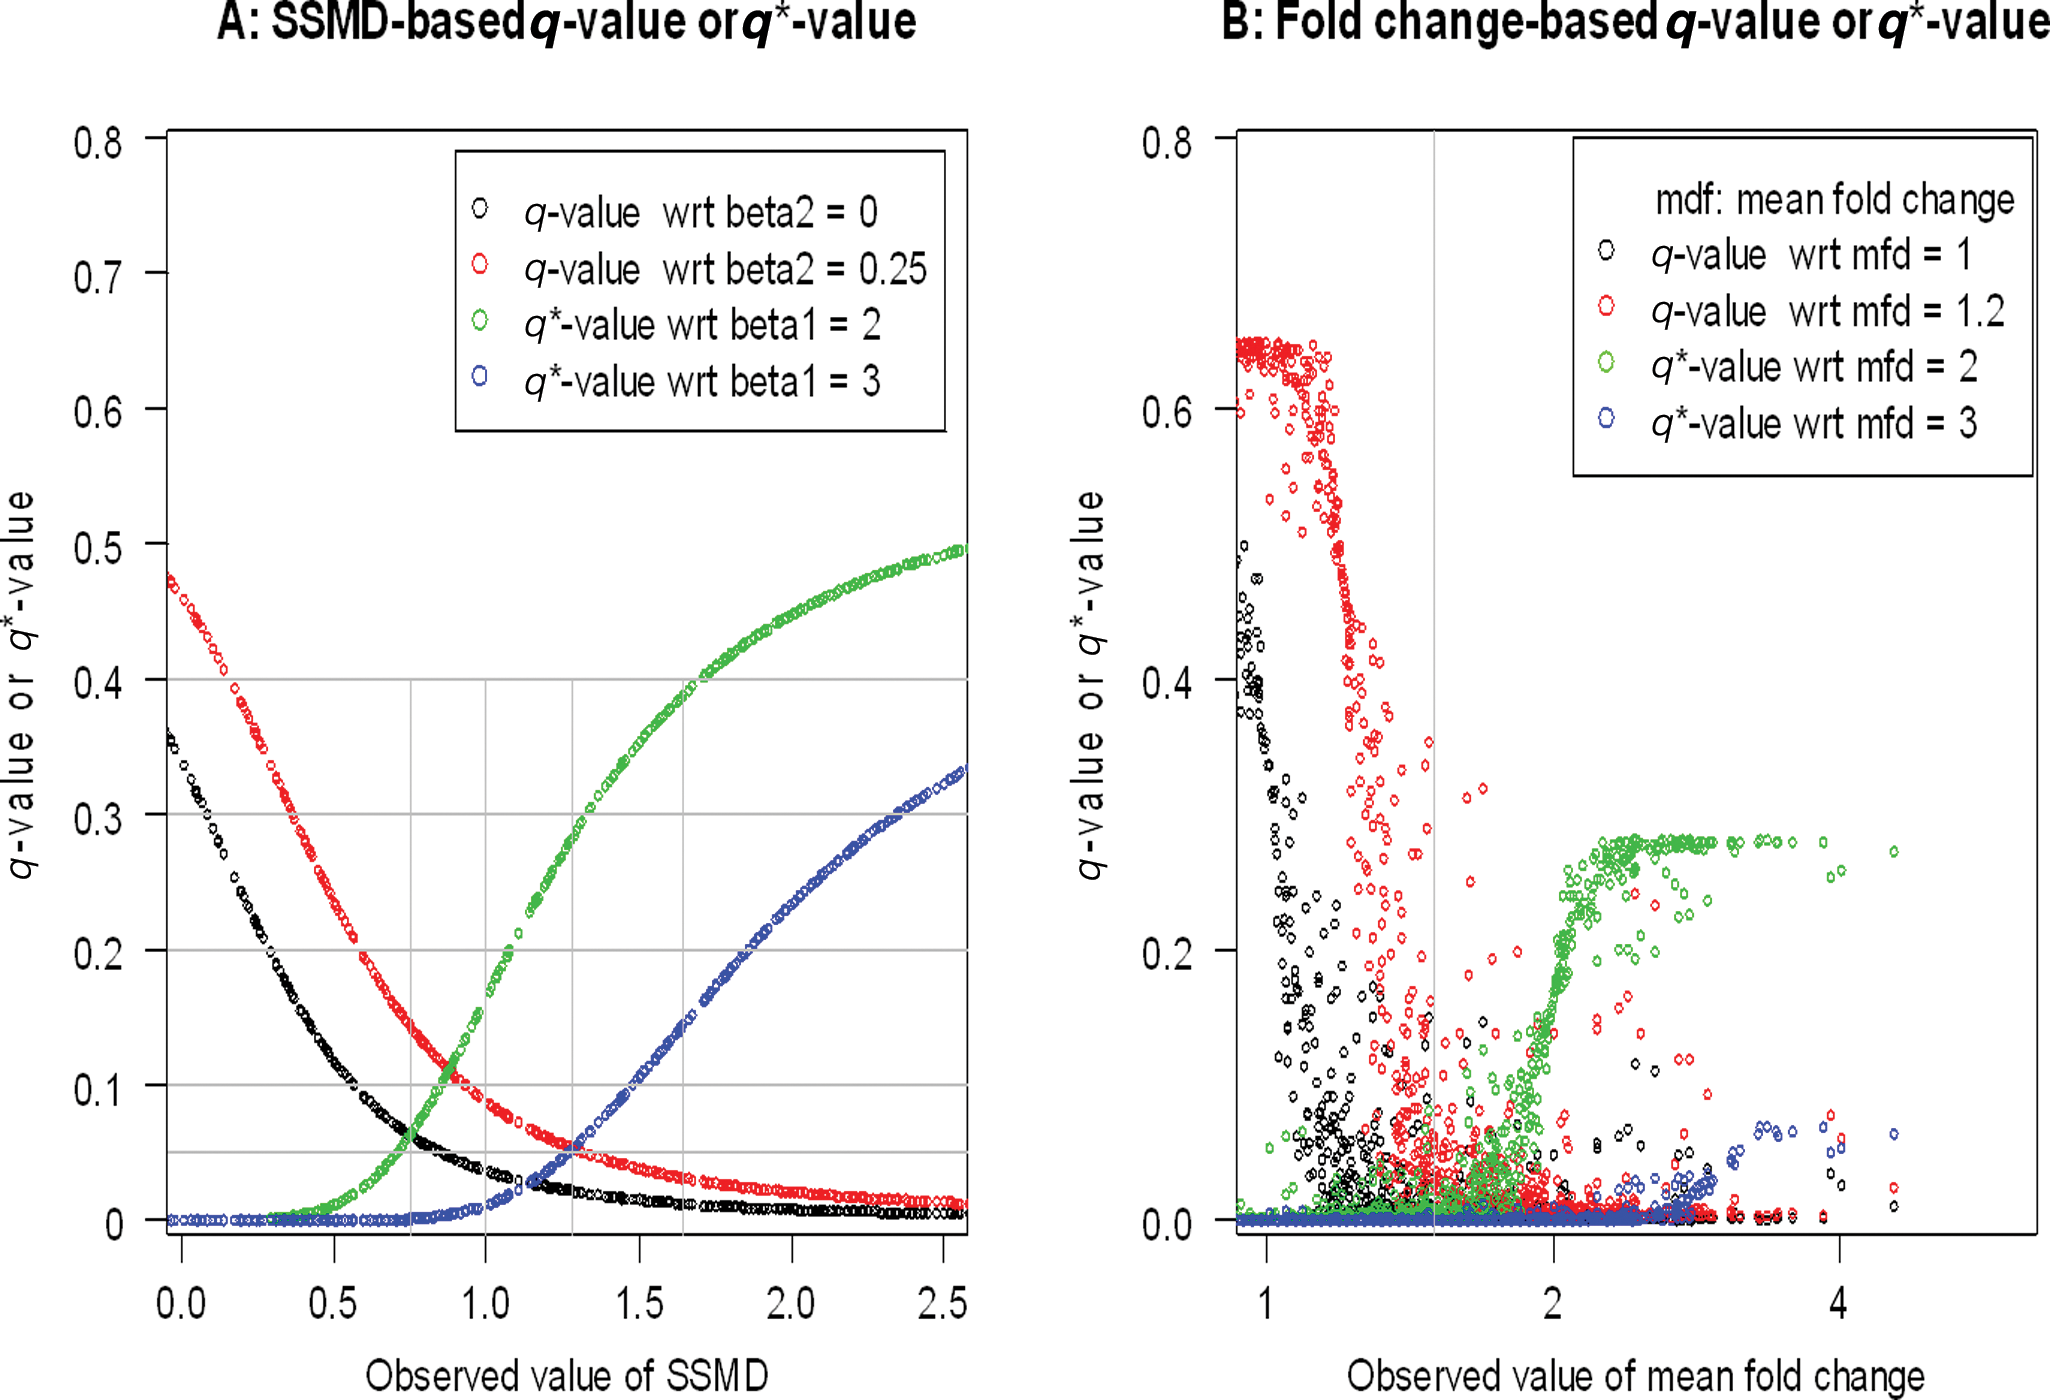
The q-values and q*-values with respect to (shortened as “wrt” in the figure legends) various true values of SSMD (
From
To determine the exact critical value for selecting activation hits, we need to know detailed information about the error rates and the number of selected hits generated by the decision rule in association with some potential critical values of 0.5, 0.75, 1, 1.28, 1.645, 2, and 3, which are shown in
FDR and FNDR for Selecting Activation Hits among 960 siRNAs under Investigation in a Confirmatory siRNA Screen with 4 Replicates for Diabetes
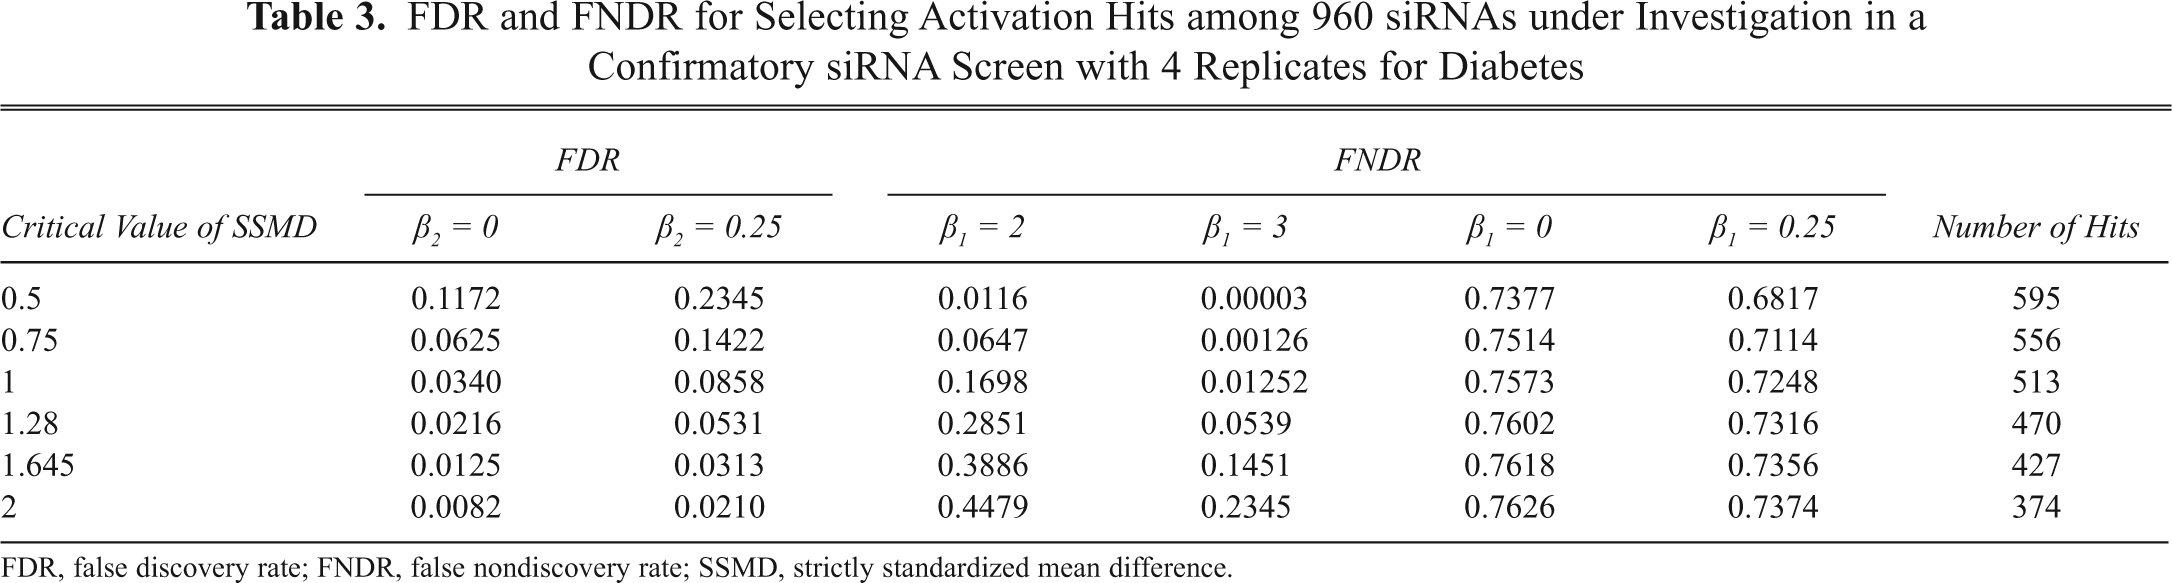
FDR, false discovery rate; FNDR, false nondiscovery rate; SSMD, strictly standardized mean difference.
The use of the critical value of 1.28 leads to the selection of 470 activation hits, an FDR of 0.0531 with respect to extremely weak activation effects, or no activation, as well as an FNDR of 0.0539 with respect to very strong activation effects or stronger activation effects (
One point in the new method of controlling false discovery rates and false nondiscovery rates in hit selection in genome-scale RNAi screens is that we control the FDR with respect to extremely weak effects or no effect (i.e., with respect to β2 = 0.25 for activation), whereas we control FNDR with respect to very strong effects or stronger effects (i.e., with respect to β1 = 3 for activation), not with respect to extremely weak effects or no effect (i.e., with respect to β1 = 0.25 for activation).
23
This is important as illustrated below. For each critical value shown in
When we use SSMD for controlling false discovery and false nondiscovery rates, we use one value such as 0 or 0.25 for controlling FDR and another value such as 3 or 2 for controlling FNDR. In context of mean fold change as a statistical parameter, it might be argued that one would want to consider the use of 2 values of mean fold change as well—for example, the use of a value of 1 or 1.2 of mean fold change for controlling FDR and another value of 2 for controlling FNDR. The corresponding formulas for calculating FDR and FNDR based on mean fold change in this adapted approach have been derived and provided by Zhang.
23
The major issue with this approach is that there is no theoretical framework to set up the 2 constants for mean fold change. Another consideration is that the siRNAs with the same or similar observed value of mean fold change may have very different q-values and very different q*-values (
Discussion
One important goal in genome-scale RNAi screens is to select siRNAs with a specified magnitude of inhibition effect or activation effect, which usually requires statistical control of false positives and false negatives. As demonstrated in the real RNAi screen shown in
The differences between FDR and FPR and between FNR and FNDR are demonstrated in the diabetes target example shown in
It should be noted that these newly developed methods result in not only a low FDR with respect to extremely weak effects or no effect but also a low FNDR with respect to very strong effects or stronger effects (not FNDR with respect to no effect, as in traditional methods). As demonstrated in
Traditional methods of controlling false positives and false negatives are largely based on testing for no mean difference (or, equivalently, average fold change being one), whereas the newly proposed methods are based on a different statistical parameter, SSMD. One may adapt the traditional method of testing mean difference to select hits in a similar fashion as in the SSMD-based method. That is, use one small value of true mean fold change to indicate a small effect and another larger value of true mean fold change to indicate a large effect and then control FDR with respect to the smaller value and FNDR with respect to the larger value of true fold change. The major issue with this approach is that, unlike SSMD, mean difference cannot effectively measure the size of siRNA effects because it cannot capture data variability. As described in Zhang,
22
there exist theoretically based thresholds (such as −5, −3, −1, −.75, −0.5, −0.25, etc.) of the population values of SSMD for classifying siRNA effects. In contrast, there is no theoretical framework to suggest thresholds of average fold change for classifying siRNA effects. Another potential issue is that, as demonstrated in
In summary, the traditional methods of controlling FDR and FNDR are inappropriate for hit selection in RNAi screens. A new method based on SSMD of controlling for false discovery and false nondiscovery rates has been proposed. 23 In this article, we explore the utility of this SSMD-based method in controlling FDR and FNDR for hit selection in RNAi screens. As demonstrated in 2 genome-scale RNAi screens, this SSMD-based method works effectively for hit selection and also addresses the unmet need of controlling the proportion of siRNAs with a small effect among selected hits and controlling the proportion of siRNAs with a large effect among declared nonhits.
Footnotes
Acknowledgements
The authors thank Drs. Soper, Bain, and Cleary for their support in this research, as well as Erica Stec and Francesca Santini for their discussions.
Conflict of interest statement. All the authors are employees of Merck Research Laboratories.