
Abstract
In most genome-scale RNA interference (RNAi) screens, the ultimate goal is to select siRNAs with a large inhibition or activation effect. The selection of hits typically requires statistical control of 2 errors: false positives and false negatives. Traditional methods of controlling false positives and false negatives do not take into account the important feature in RNAi screens: many small-interfering RNAs (siRNAs) may have very small but real nonzero average effects on the measured response and thus cannot allow us to effectively control false positives and false negatives. To address for deficiencies in the application of traditional approaches in RNAi screening, the author proposes a new method for controlling false positives and false negatives in RNAi high-throughput screens. The false negatives are statistically controlled through a false-negative rate (FNR) or false nondiscovery rate (FNDR). FNR is the proportion of false negatives among all siRNAs examined, whereas FNDR is the proportion of false negatives among declared nonhits. The author also proposes new concepts, q*-value and p*-value, to control FNR and FNDR, respectively. The proposed method should have broad utility for hit selection in which one needs to control both false discovery and false nondiscovery rates in genome-scale RNAi screens in a robust manner.
Introduction
F
In reality, what we really want to control in the list of selected hits are not just the siRNAs with exactly zero effects but also the siRNAs with very small effects, and what we really do not want to include in the list of declared nonhits are the siRNAs with large effects, not those with very small effects. This special feature of hit selection in RNAi screens requires the adoption of new definitions of false positives and false negatives: false positives are defined to be the siRNAs with a small effect among selected hits, and false negatives are defined to be the siRNAs with a large effect among declared nonhits. 2,3 Although false-positive rate (FPR) and false-negative rate (FNR) based on these new definitions of false positives and false negatives have recently been explored, 2,3 the corresponding false discovery rate (FDR) and false nondiscovery rate (FNDR) have yet to be investigated. As pointed out by Storey and Tibshirani, 4 FPR and FDR are often mistakenly equated, but their difference is actually very important. So is the relationship between FNR and FNDR.
In this article, I compare FDR and FNDR with FPR and FNR in mathematical forms and demonstrate theoretically that FDR and FNDR are more tractable and address the question that we are normally interested in an RNAi screen better than FPR and FNR. I propose the concepts of p*-value and q*-value to control FNR and FNDR, respectively, and provide the calculation of p-value, p*-value, q-value, and q*-value based on mean difference and strictly standardized mean difference (SSMD), respectively. In the follow-up article, 5 my colleagues and I will demonstrate the utility of the proposed method and concepts for hit selection in real genome-scale RNAi screens with replicates.
False Discovery Rate and False Nondiscovery Rate
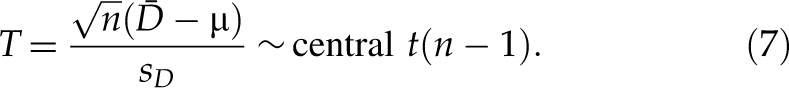
The effect of an siRNA is usually reflected by the difference of measured values between the siRNA and a negative reference. For simplicity, in this article, we assume that a positive value represents the upregulated direction and a negative value represents the downregulated direction. Suppose the true mean value of the difference for an siRNA is µ.
Traditionally, to select downregulated hits, the interesting siRNAs are those with µ < µ0, and the noninteresting ones are those with µ ≥ µ0 (where µ0 can be 0 or another fixed value) in the downregulated direction (
Traditional Methods for Defining False Discovery and False Nondiscovery Rates among m Simultaneous Tests in the Downregulated Direction
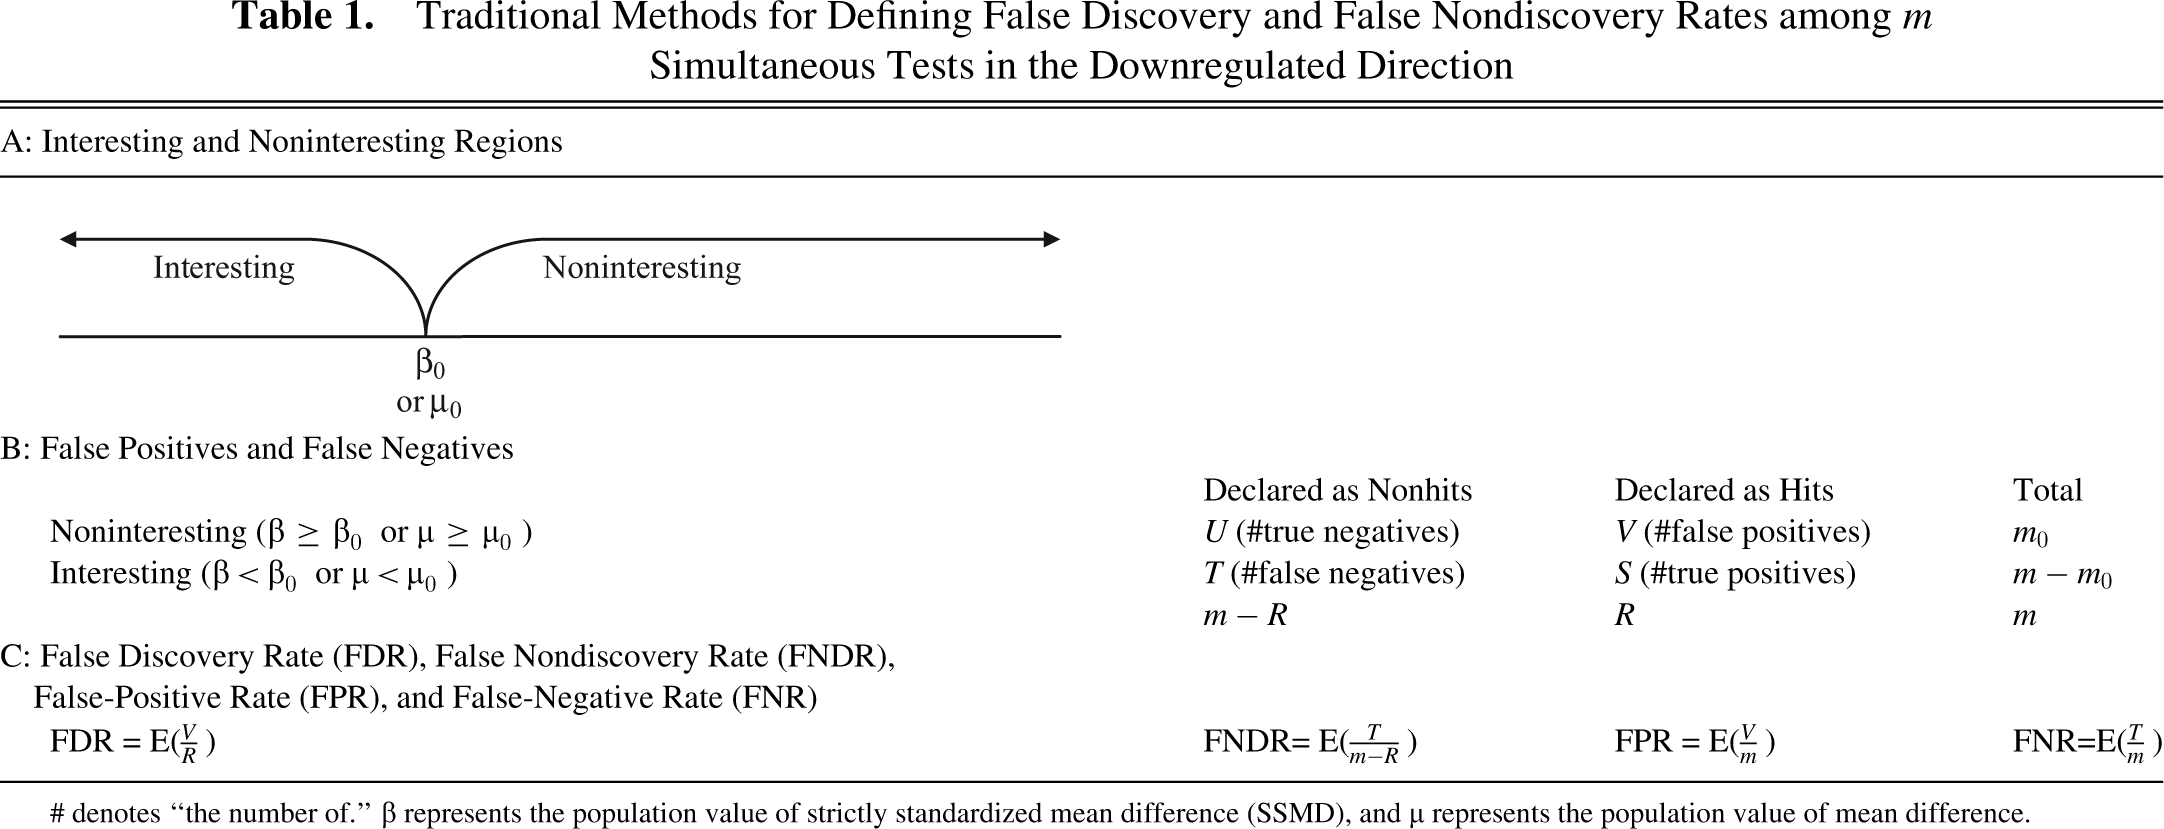
# denotes “the number of.” β represents the population value of strictly standardized mean difference (SSMD), and µ represents the population value of mean difference.
New Method for Defining False Discovery and False Nondiscovery Rates in m Simultaneous Tests in the Downregulated Direction in a Genome-Scale RNAi Screen
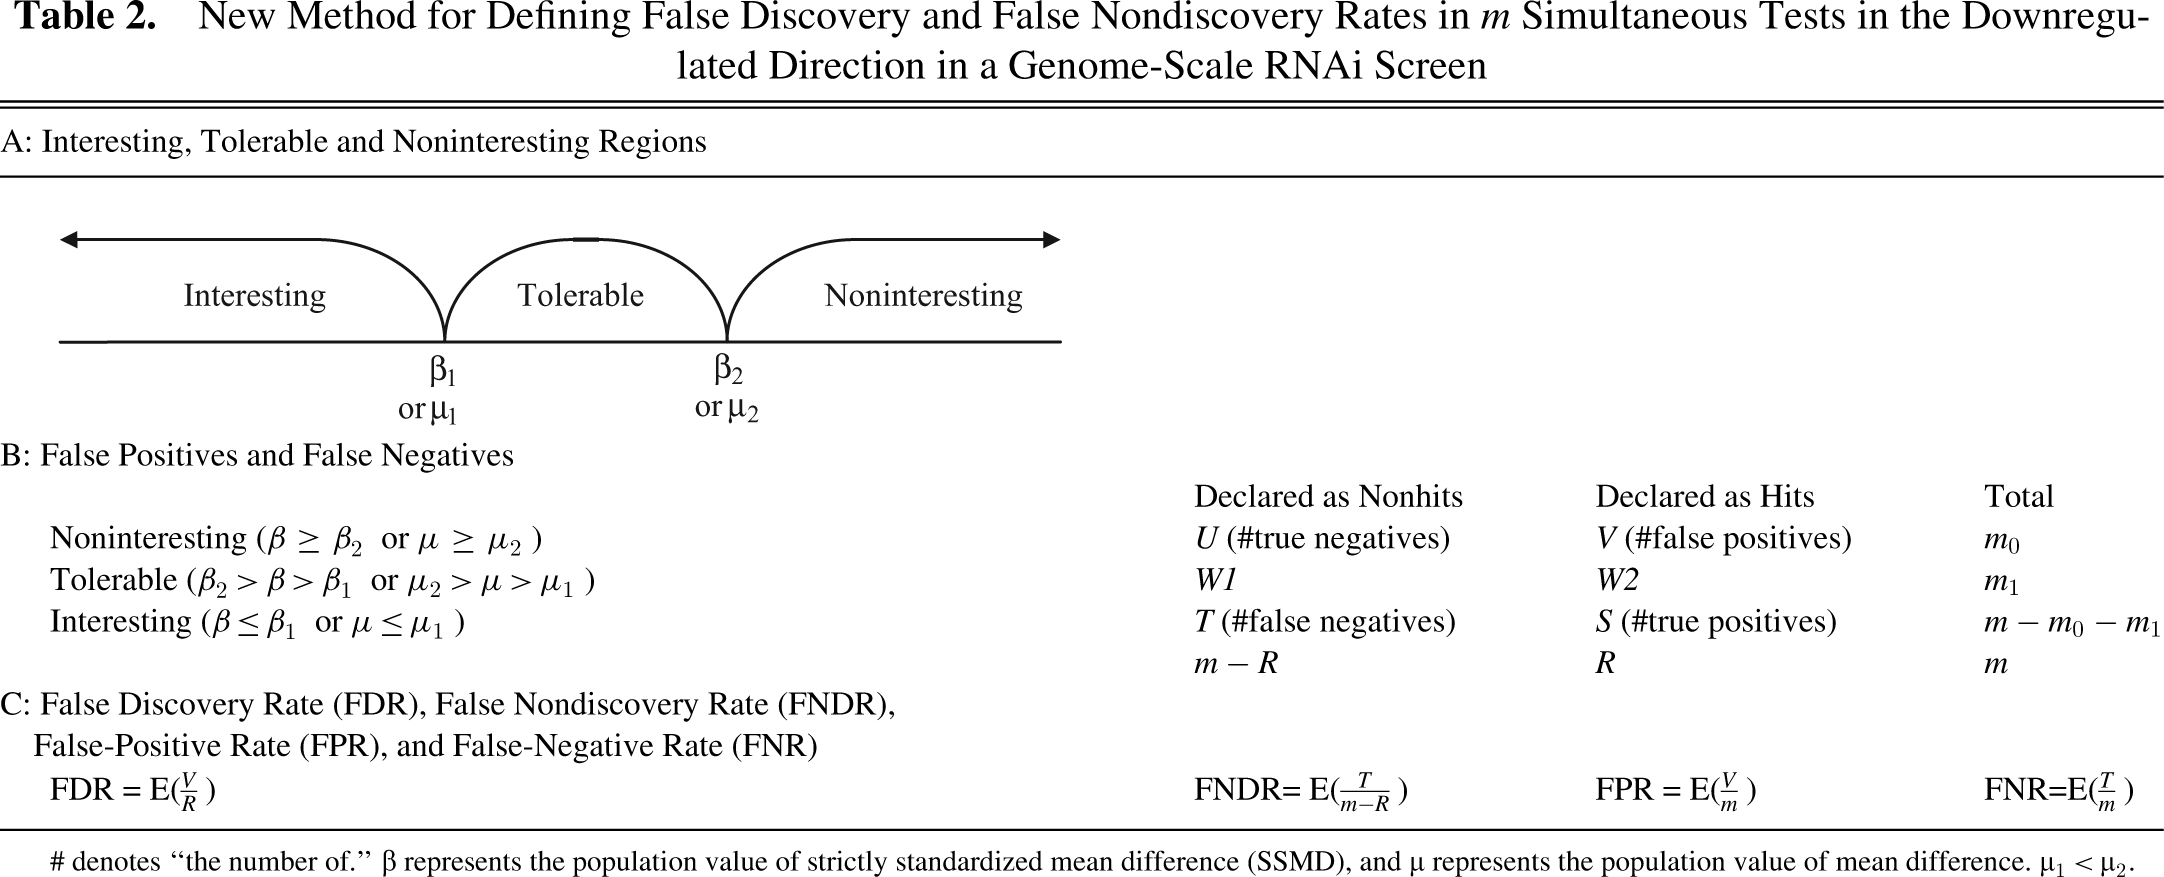
# denotes “the number of.” β represents the population value of strictly standardized mean difference (SSMD), and µ represents the population value of mean difference. µ1 < µ2.
Traditionally, hit selection is based on the test of mean difference (i.e., µ in
A clear advantage of SSMD over mean difference is that the population value of SSMD is comparable across experiments, and thus we can use the same cutoff for the population value of SSMD to measure the size of siRNA effects. 2 A meaningful and interpretable SSMD-based criterion for classifying the size of siRNA effects is as follows: |β| for extremely strong, 5 > |β| ≥ 3 for very strong, 3 > |β| ≥ 2 for strong, 2 > |β| ≥ 1.645 for fairly strong, 1.645 > |β| ≥ 1.28 for moderate, 1.28 > |β| ≥ 1 for fairly moderate, 1 > |β| ≥ 0.75 for fairly weak, 0.75 > |β| > 0.5 for weak, 0.5 ≥ |β| > 0.25 for very weak, and |β| ≤ 0.25 for extremely weak effects. 8 Based on this criterion, β1 can be set to be −3 or −2, and β2 can be set to be −0.25 in the downregulated direction. For example, in some RNAi screens, the false positives that we want to control are the siRNAs with SSMD ≥ −0.25 among hits; the false negatives are the siRNAs with SSMD ≤ −3 (not SSMD ≤ −0.25) among nonhits. We can tolerate siRNAs with SSMD between −0.25 and −3 in the hit list.
Traditionally, the FDR is defined based on
Based on the definitions of false positives and false negatives shown in
There are other concepts of FDR. One of them is positive FDR,
p-Value, p*-Value, q-Value, and q*-Value
The control of FPR and FDR is usually based on p-value and q-value. The well-known q-value is a term defined similarly to p-value. The q-value is defined on FDR, whereas p-value is defined on FPR. Considering hit selection in the downregulated direction, the p-value with respect to β2 of an siRNA with an observed value βobs is p-value(βobs) = max{FPR with respective to β2} = max{Pr(β̂ ≤ βobs|β ≥ β2)}. Similarly, the q-value is defined as q-value(βobs) = max{FDR with respective to β2}. In terms of P
i
(i.e., the p-value for the ith investigated siRNAs), the q-value is
In traditional hypothesis testing, people care about FNDR less than about FDR. However, in RNAi screens, the FNDR with respect to β1 can be as equally important as, if not more important than, the FDR with respect to β2, and FNR can be as equally important as FPR in RNAi screens. Similar to p-value being defined upon FPR, we have p*-value being defined upon FNR as follows: for hit selection in downregulation, the p*-value (with respect to β1) of an siRNA with βobs is p*-value(βobs) = max{FNR with respective to β1} = max{Pr(β̂ > βobs|β ≤ β1)}. In the context of FDR, corresponding to p-value, we have q-value. In parallel, in the context of FNDR, corresponding to p*-value, we have q*-value. That is, the q*-value is defined as q*-value(βobs) = max{FNDR with respective to β1}. The q*-value has the following meaning for an individual siRNA: the q*-value (with respect to β1) of a particular siRNA with an observed value βobs is the maximum FNDR if we use the following selection criterion: any siRNA is selected as a hit if it has the estimated SSMD value no more than βobs and as a nonhit otherwise.
There are an impressive number of algorithms for estimating/controlling FDR in the literature. 9,11-13 One popular algorithm is the Benjamin-Hochberg (BH) procedure. 11 The FDR calculated using the BH procedure is conservative. 9,11,13 After obtaining the p-value using the formulas described in the following section, we can use existing R packages (e.g., qvalue, 9 multtest, 11 or fdrtool 13 ) to calculate the q-value with respect to β ≥ β2 (or µ ≥ µ2). To calculate q*-value, we can treat p*-value as the p-value for testing H 0: β ≤ β1 (or H 0: µ ≤ µ1) and calculate the corresponding q-value; the resulting q-value equals the q*-value with respect to β ≤ β1(or µ ≤ µ1).
Similarly as the above methods for the downregulated direction, we can derive the p-value, q-value, p*-value, and q*-value for hit selection in the upregulated direction. The calculation of q-value and q*-value is usually based on the calculation of p-value and p*-value for a single test for an individual siRNA. The formulas for calculating p-value and p*-value are displayed in
Calculation of p-Value, p*-Value, q-Value, and q*-Value
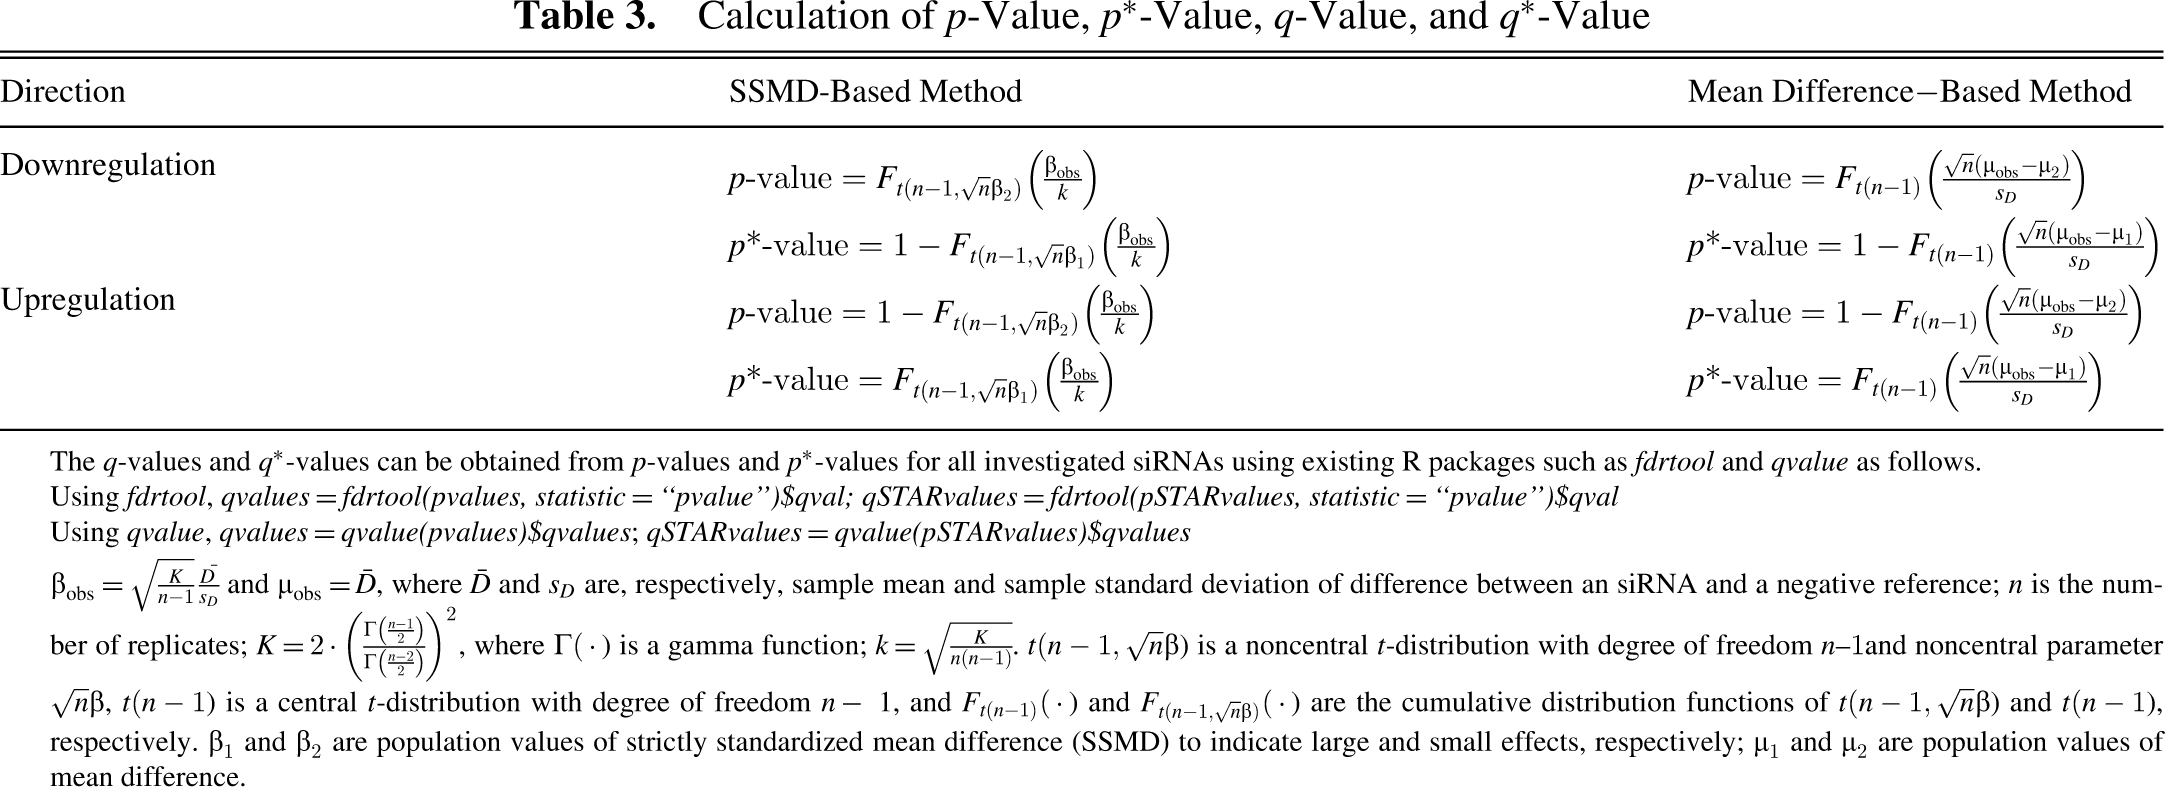
The q-values and q*-values can be obtained from p-values and p*-values for all investigated siRNAs using existing R packages such as fdrtool and qvalue as follows.
Using fdrtool, qvalues = fdrtool(pvalues, statistic = “pvalue”)$qval; qSTARvalues = fdrtool(pSTARvalues, statistic = “pvalue”)$qval
Using qvalue, qvalues = qvalue(pvalues)$qvalues; qSTARvalues = qvalue(pSTARvalues)$qvalues
Calculation of SSMD-Based p-Value and p*-Value
Suppose we observe n pairs of samples, (Y
11, Y
21), (Y
12, Y
22), ... ,(Y
1n
, Y
2n
), from groups G
1 and G
2, respectively. In a confirmatory or primary screen with replicates, groups G
1 and G
2 represent an investigated siRNA and the negative reference, respectively, and n is the number of replicates. Let Dj
be the difference between the jth pair of samples—namely, Dj
= Y
1j
− Y
2j
. Let D̄ and sD
be the sample mean and sample standard deviation of D, respectively—namely,
The method-of-moment estimate of SSMD is β̂ = D̄/S
D
. Assume that D is normally distributed—namely,
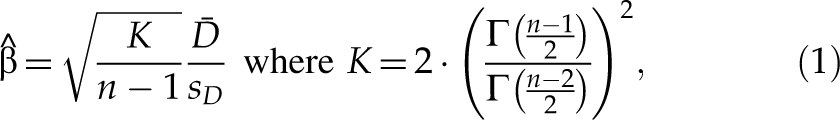
and we have the following noncentral t-distribution,
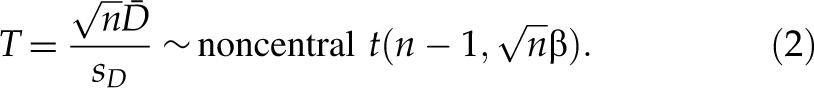
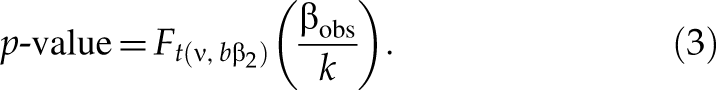
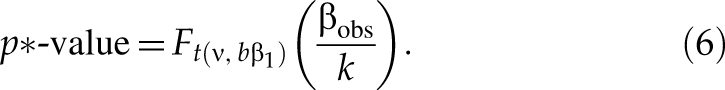
When selecting downregulated hits, for an siRNA with an observed value βobs of SSMD, given the true value of SSMD no less than a small value β2, p-value is defined as the maximum probability of selecting this siRNA as a hit if we use the following selection criterion: any siRNA is selected as a hit if it has the estimated SSMD value no more than βobs and as a nonhit otherwise. That is, p-value is the maximum of Pr(β̂ ≤ βobs | β ≥ β2)—namely, p-value = Pr(β̂ ≤ βobs | β = β2). Based on the noncentral t-distribution of T in formula (2),
where t(ν, bβ) is a noncentral t-distribution with ν degrees of freedom and noncentral parameter bβ, F
t(ν, bβ)(·) is the cumulative distribution function of t(ν, bβ), and
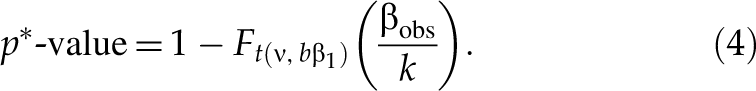
The values of β2 are 0 or −0.25, and the values of β1 are −1.645, −2, −3, or −5. 2,8
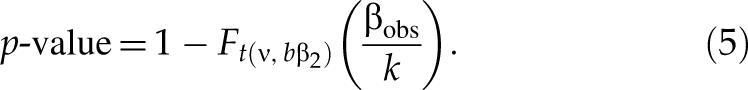
Similarly, when selecting upregulated hits (i.e., siRNAs with large positive value), for an siRNA with an observed value βobs of SSMD, the p-value with respect to β2 is the maximum of Pr(β̂ ≥ βobs|β ≤ β2)—namely, p-value = Pr(β̂ ≥ βobs|β = β2); thus,
And the p*-value with respect to β1 (β1 > β2 ≥ 0) is
The values of β2 may be 0 or 0.25, and the values of β1 may be 3 or 5.
2,8
The left panel of
Calculation of Mean Difference − Based p-Value and p*-Value
When D is normally distributed, the estimate of mean difference µ (equivalently mean fold change in log scale) is µ̂ = D̄, and we have the following central t-distribution:
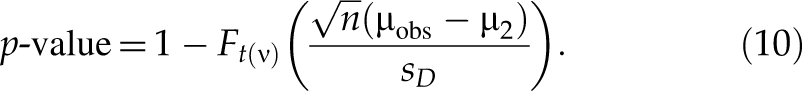
In the downregulated direction, for an siRNA with an observed value µobs of mean difference, the p-value is the maximum of Pr(T ≤ T obs|µ ≥ µ2)—namely, p-value = Pr(T ≤ T obs|µ = µ2). Based on the central t-distribution of T in formula (7),
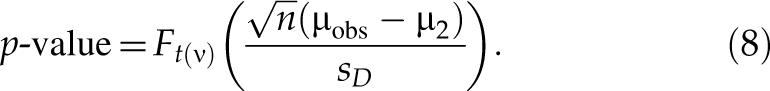
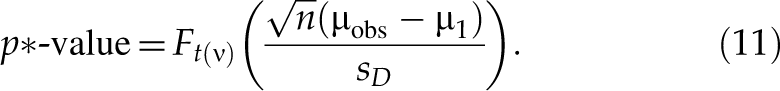
where t(ν) is a central t-distribution with ν degrees of freedom, F t(ν)(·) is the cumulative distribution function of t(ν), and ν = n − 1. The above p-value corresponds to FPR with respect to µ2. Similarly, the p*-value with respect to µ1 (µ1 < µ2 ≤ 0) is p*-value = Pr(T > T obs|µ = µ1) that corresponds to FNR with respect to µ1. Based on the central t-distribution of T in formula (7),
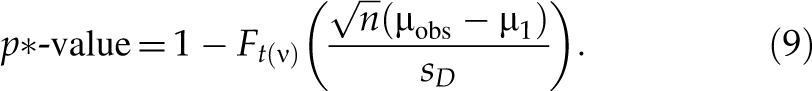
There is no theoretical base for choosing the values of µ1 or µ2. Some potential values of µ1 may be ½-fold or ⅓-fold in log scale. Some potential values of µ2 may be 1-fold,
Similarly, when selecting upregulated hits, for an siRNA with an observed value µobs of mean difference, the p-value is the maximum of Pr(T ≥ T obs|µ ≤ µ2)—namely, p-value = Pr(T ≥ T obs|µ = µ2). Based on the central t-distribution of T in formula (7),
And the p*-value with respect to µ1 (µ1 > µ2 ≥ 0) is
There is no theoretical base for choosing the values of µ1 and µ2. Some potential values of µ1 may be 2- or 3-fold in log scale. Some potential values of µ2 may be 1-, 1.1-, or 1.2-fold in log scale. The right panel of
Discussion
In most genome-scale RNAi screens, the ultimate goal is to select siRNAs with a large inhibition/activation effect. The hit selection usually requires statistical control of 2 errors: false positives and false negatives, which is commonly achieved through FPR or p-value, FDR or q-value,
4,11,14
FNR,
3
and FNDR.
15
In this article, I propose a new method for controlling FDR and FNDR, which applies 2 constants to define noninteresting, tolerable, and interesting siRNAs (shown in
As shown in
In addition, currently many analytic methods control false positives and ignore the control of false negatives in high-throughput biotechnologies. In genome-scale RNAi screens, when one chooses a decision rule to select hits, the interest is the control of not only false positives but also false negatives. If one misses a true positive in the first round of screening, one would not have a chance to investigate it again in the follow-up research. Therefore, in some screens, especially primary screens, the control of false negatives is even more important than the control of false positives. In this article, we propose a new concept called q*-value to address FNDR and another concept called p*-value to address FNR.
From
The method in this article has been developed from a methodological perspective based on scientific needs in genome-scale RNAi screens. There is a need to demonstrate the practical usefulness of the proposed method in real genome-scale RNAi screens. In a follow-up article, 5 my colleagues and I will report on the applications of the proposed method for hit selection in 2 in-house RNAi screens. Although the method presented in this article is developed for hit selection in RNAi-based high-throughput screens, it should be applicable to other assays in which the end point is a difference in signal compared to a reference sample, including those for receptor, enzyme, and cellular function.
Footnotes
Acknowledgements
The author thanks Drs. Holder, Soper, and Heyse for their support in this research.
Conflict of interest statement. XHD Zhang is an employee of Merck Research Laboratories.