
Abstract
Epipodophyllotoxins are the most important anticancer drugs used in chemotherapy for various types of cancers. To further, improve their clinical efficacy a large number of epipodophyllotoxin derivatives have been synthesized and tested over the years. In this study, a quantitative structure-activity relationship (QSAR) model has been developed between percentage of cellular protein-DNA complex formation and structural properties by considering a data set of 130 epipodophyllotoxin analogues. A systematic stepwise searching approach of zero tests, missing value test, simple correlation test, multicollinearity test, and genetic algorithm method of variable selection was used to generate the model. A statistically significant model (r (train) 2 = 0.721; q cv 2 = 0.678) was obtained with descriptors such as solvent-accessible surface area, heat of formation, Balaban index, number of atom classes, and sum of E-state index of atoms. The robustness of the QSAR models was characterized by the values of the internal leave-one-out cross-validated regression coefficient (q cv 2) for the training set and r (test) 2 for the test set. The root mean square error between the experimental and predicted percentage of cellular protein–DNA complex formation (PCPDCF) was 0.194 and r (test) 2 = 0.689, revealing good predictability of the QSAR model.
Keywords
Introduction
E
To construct an informative structure-activity relationship (SAR) model and further improve design of potentially bioactive compounds, there is a need for the development of predictive quantitative SAR (QSAR) models for the rapid prediction of inhibition of human TP-IIα of novel epipodophyllotoxin analogues and virtual prescreening. Comparative molecular field analysis (CoMFA) is one of the most popular methods for QSAR and is characterized by reasonable simplicity and a clear physiochemical sense of steric and electrostatic descriptors. 10 However, despite statistically excellent predictive performance, CoMFA has an inherent limitation in aligning with the database molecules correctly within 3D space. 11,12 The determination of the “active” conformation that each compound will retain is a critical issue due to the unavailability of the X-ray structure. We should have some knowledge or hypothesis regarding active conformations of the molecules under study as a prerequisite for structural alignment. Nevertheless, especially for structurally diverse molecules, unambiguous 3D alignment makes it difficult to initiate the CoMFA process.
We, as well as other researchers, 13 were motivated to explore possible alternatives that would use alignment-free descriptors derived from 2D or 3D molecular topology and thus alleviate frequent ambiguity of structural alignment typical of 3D QSAR methods. Accordingly, in this QSAR study, we have applied topological, electronic, geometrical, and energy-based descriptors calculated directly from the 2D and 3D structure of the molecules. This approach is simple, fast, and straightforward. It benefits in predicting the activities of a large set of molecules in rational drug design. Furthermore, we have implemented the concept of variable selection, a process that has been investigated recently by a number of researchers 14-16 using genetic function approximation (GFA) 17,18 optimization algorithms. Variable selection techniques choose the most informative variables and eliminate irrelevant variables to improve the signal-to-noise ratio in the resulting models. In addition, these techniques are not computationally intensive and are practically automated. The behavior of the QSAR model is examined with a variety of statistical parameters, 19 and the contribution of various descriptors is analyzed.
Materials and Methods
Data set
A total of 130 epipodophyllotoxin analogues ( Table 1 ) were used in the study, and were synthesized and tested under the same conditions in the same laboratory. 5-8 To generate statistically robust and, most important, validated models, all compounds in the original data set were divided randomly into 100 molecules in the training set and 30 molecules in the test set. All compounds in this study were evaluated for their ability to form intracellular covalent topoisomerase II–DNA complexes using human TP-IIα at similar laboratory conditions and experimental setup. The assay system has been described previously by Lee et al. 5 The activity data originally were expressed as the percentage of cellular protein–DNA complex formation (PCPDF) and were transformed by taking the logarithm of PCPDF (i.e., log10 [PCPDF]) and were used in subsequent variable selection as well as QSAR model development.
List of Epipodophyllotoxin Analogues and Their Experimental Activities
PCPDCF, percentage of cellular protein–DNA complex formation.
Building of molecular structures
All these epipodophyllotoxin analogues were built from the various scaffold structures ( Fig. 1 ), and the substitution of functional groups was carried out as mentioned in Table 1 . We used the Maestro molecular builder for building the scaffold and structural derivatives. LigPrep 20 was used for final preparation of ligands. LigPrep is a utility of the Schrödinger software suite that combines tools for generating 3D structures from 1D (Smiles) and 2D (SDF) representation, searching for tautomers and steric isomers, and performing a geometry minimization of ligands. The ligands were energy minimized using the Macromodel module of the Schrödinger software with default parameters and applying molecular mechanics force fields (MMFFs). A truncated Newton conjugate gradient (TNCG) minimization method was used with 500 iterations and convergence threshold of 0.05 kJ/mol.
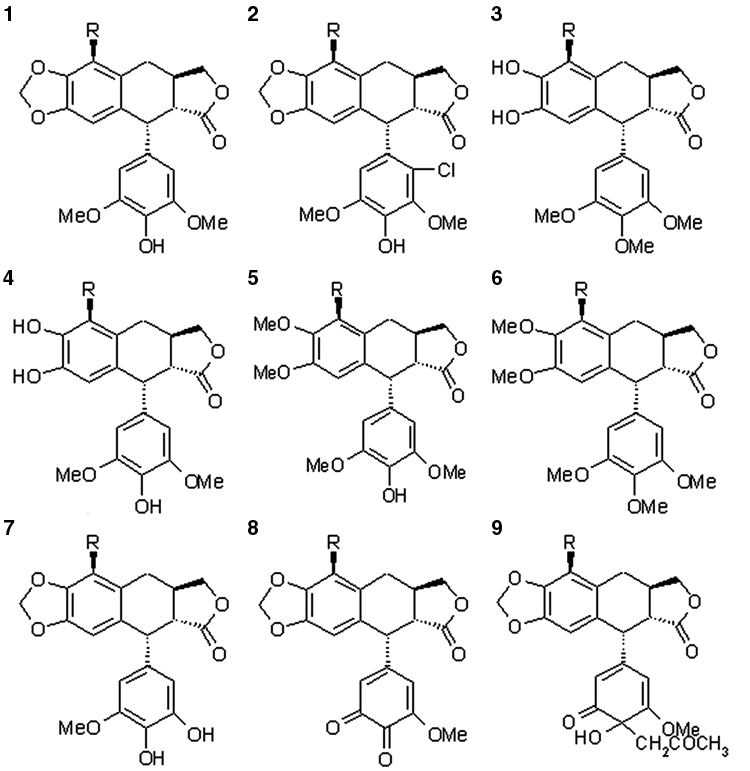
The various scaffold structures used for building the epipodophyllotoxin analogues.
Descriptor calculation
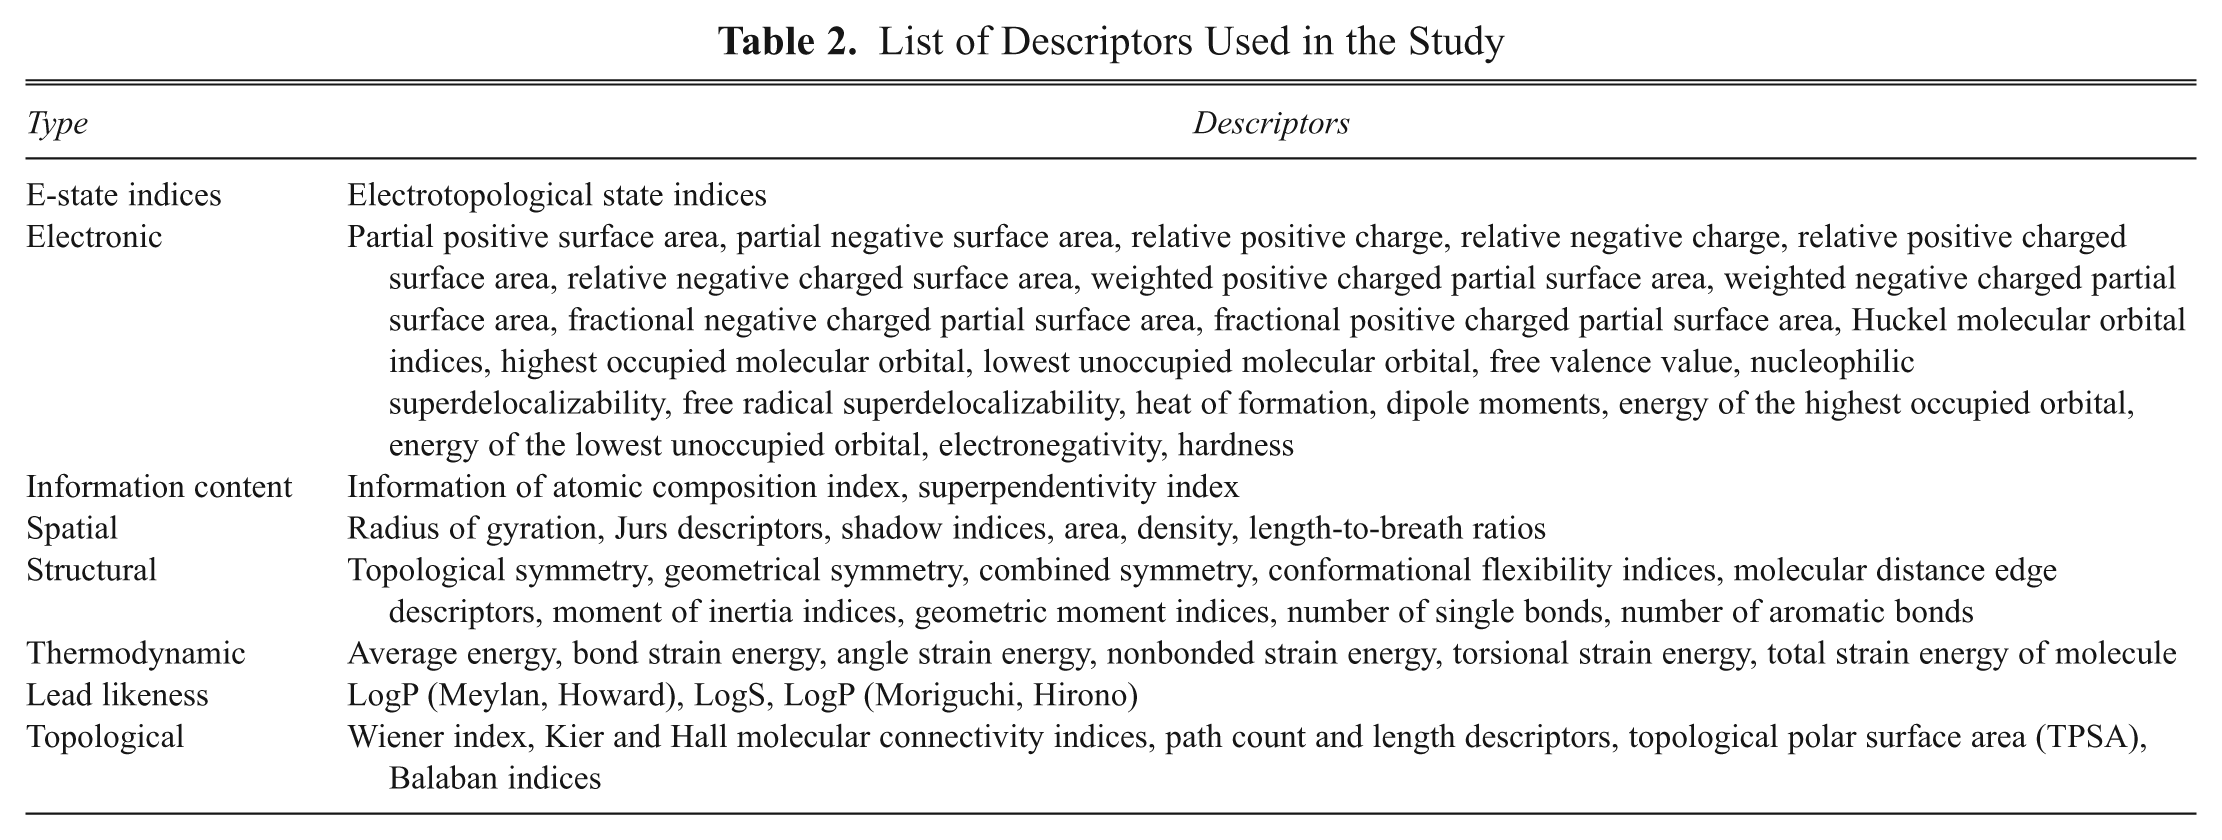
All the molecular descriptors such as E-state indices; log P; superpendentic index; structural, symmetrical, and topological descriptors; lead likeness; electronic Wang-Ford atomic charge and extended Huckel partial charge functions; bulk; moments; orbital energies; molecular connectivity indexes; gravitational indexes; hydrophobicity; and steric and thermodynamic factors were calculated using ADME Model Builder software package (version 4.5). 21 These descriptors help differentiate the molecules mostly according to their size, degree of branching, flexibility, and overall shape. Some of the descriptors included in the study are listed and described in Table 2 .
List of Descriptors Used in the Study
Screening of descriptors and development of QSAR model
A set of 372 molecular descriptors was calculated using the ADME Model Builder software package (version 4.5). A systematic search in the order of missing value test, zero test, correlation coefficient, and genetic algorithm was performed to determine significant descriptors using the ADME Model Builder (version 4.5) software package (Fujitsu, Fukuoka, Japan). Any molecular descriptor that was not calculated (missing value) for any number of the compounds in the data set was rejected in the first step. Some of the descriptors were rejected because they contained a zero value for all the compounds (zero tests). To minimize the effect of collinearity and to avoid redundancy, a correlation matrix was developed with a cutoff value of 0.6, and the variables were physically removed from the analysis, which showed exact linear dependencies between subsets of the variables and multicollinearity (high multiple correlations between subsets of the variables). From the descriptors thus remaining, the selection of variables to obtain the QSAR models was carried out using a genetic algorithm implemented in the ADME Model Builder (version 4.5) software package. The genetic algorithm (GA) works in the following way: first, a particular number of equations (set at 100 in this study) are generated randomly. Then pairs of “parent” equations are chosen randomly from this set of 100 equations, and progeny equations are generated performing “crossover” and “mutations” operations at random. The parameters set used for the GA included the following: mutation 0.1, crossover 0.9, number of generations 1000, r 2 floor limit 50% (lowest acceptable r 2), and objective function r 2 /N_par. The goodness of each progeny equation is assessed by the objective function, which is a mathematical function used for ranking the progeny equation. It favors the equation that has the highest correlation (r 2) with the biological activity, while minimizing the number of molecular descriptors (N_par). Finally, the 2 best equations were selected (one with 5 descriptors and the other with 6 descriptors) based on objective function for comparison. The effect of each molecular descriptor on the statistical quality of the model developed was assessed by applying the brute-force approach. Initially, the QSAR equation was developed by taking a single descriptor that had the highest correlation with the biological activity. To this equation, the second best descriptor was added, and likewise we increased the number of molecular descriptors one by one and evaluated the effect of adding new terms on the statistical quality of the model. The best equation was taken on the basis of statistical parameters such as squared regression coefficient (r 2) and leave-one-out cross-validated regression coefficient (q cv 2).
Validation of the QSAR model
The predictive capability of the QSAR equation was determined using the leave-one-out cross-validation method. The cross-validation regression coefficient (q cv 2) was calculated by the following equation:
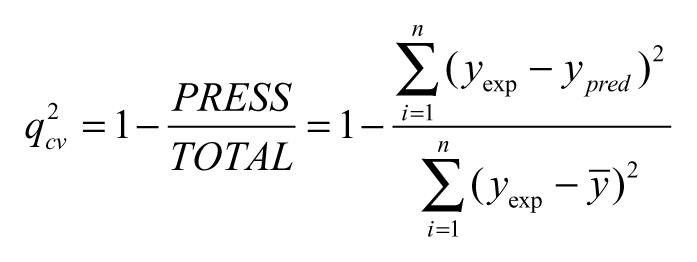
where y pred , y exp , and ȳ are the predicted, experimental, and mean values of experimental activity, respectively. Also, the accuracy of the prediction of the QSAR equation was validated by F-value, r 2, and r adj 2. A large F indicates that the model fit is not a chance occurrence. It has been shown that a high value of statistical characteristics is not necessary as the proof of a highly predictive model. 22,23 Hence, to evaluate the predictive ability of our QSAR model, we used the method described by Golbraikh and Tropsha 22 and Roy and Roy. 23 The values of the correlation coefficient of predicted and actual activities and the correlation coefficient for regressions through the origin (predicted vs. actual activities and vice versa) were calculated using the regression of analysis Tool-pak option of Microsoft Excel, and other parameters were calculated as reported by the above authors. 22,23 The determination coefficient in prediction, q test 2, was calculated using the following equation 23 :
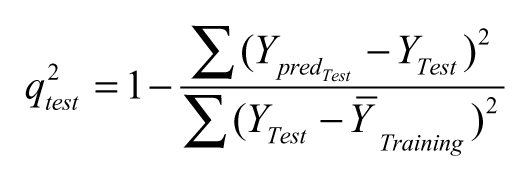
where
We also carried out the leave-10%-out and leave-20%-out cross-validation for the training set to further validate the QSAR model internally.
To check the intercorrelation of descriptors, variance inflation factor (VIF) analysis was performed. The VIF value is calculated from 1/(1 − r 2), where r 2 is the multiple correlation coefficient of one descriptor’s effect regressed on the remaining molecular descriptors. If the VIF value is larger than 10, information of descriptors can be hidden by correlation of descriptors. 24,25
Results and Discussion
The 130 active compounds with their biological activity in terms of PCPDCF were randomly divided into a training set of 100 compounds and a test set of 30 compounds. With the wide range of difference between PCPDCF values and the large diversity in the structures, the combined data set of 100 molecules and 30 molecules is ideal as training and test sets, as both sets do not suffer from bias due to the similarity of the structures. The various molecular descriptors (372 in total) as described in Table 2 were calculated initially. By applying a missing value test, a zero test, a correlation test with a cutoff value of 0.6, and a multicollinearity test with a cutoff value of 0.9, we have discarded the most likely descriptors, resulting in 218 descriptors. Further additional descriptors were discarded by applying the GA, and finally 6 descriptors (2 equations were selected: one equation with 5 descriptors and the other with additional descriptors in comparison to the previous one) were selected for the development of the QSAR equation. The initial QSAR equation was developed by considering a single molecular descriptor that showed the highest correlation with the biological activity (PCPDCF). To this equation, by applying a brute-force approach, we increased the number of parameters in the QSAR equation one by one and evaluated the effect of adding a new term on the statistical quality of the model. As the squared correlation coefficient, r 2, can be easily increased by the number of terms in the QSAR equation, we took the cross-validation correlation coefficient, q cv 2, as the limiting factor for a number of descriptors to be used in the final model. It was observed that the q cv 2 value increased until the number of descriptors in the equation reached 5, as shown in Table 3 . With further addition of parameters to the equation with 5 descriptors, there was a decrease in the q cv 2 value of the model. So, the number of descriptors was restricted to 5 in the final QSAR model. By graphing these molecular descriptors versus activity (log PCPDCF), all have poor correlation to experimental activity of the set of ligands ( Table 4 ).
Statistical Assessment of Quantitative Structure-Activity Relationship (QSAR) Equations with Varying Number of Descriptors
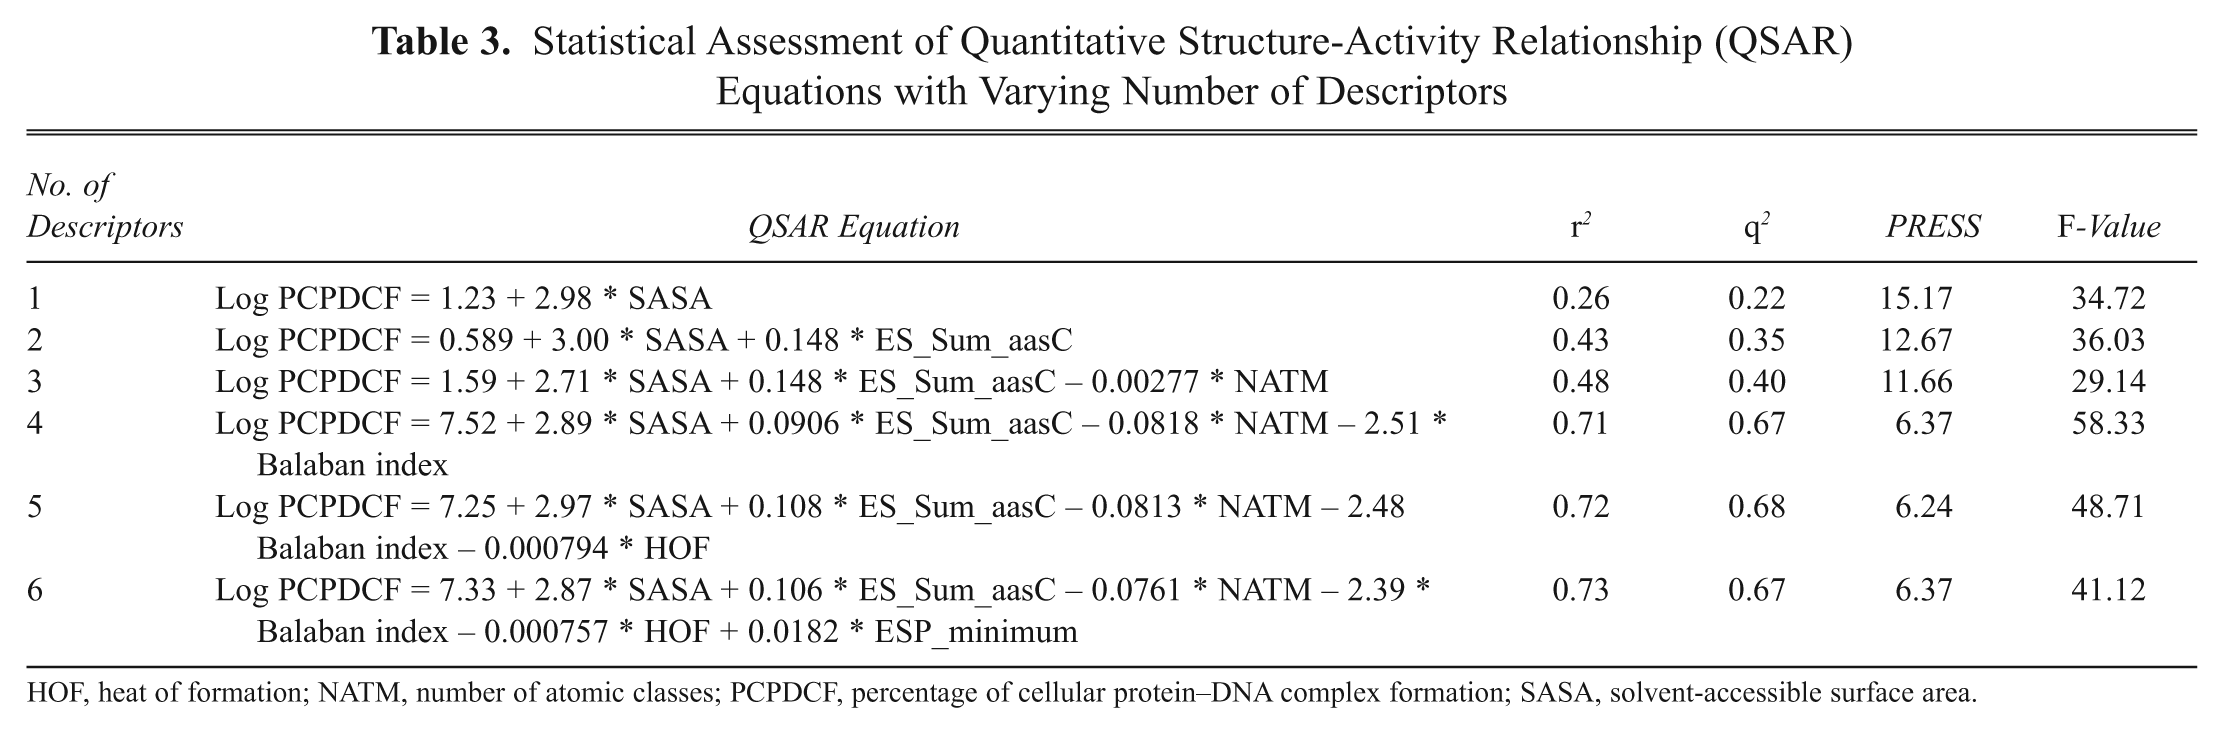
HOF, heat of formation; NATM, number of atomic classes; PCPDCF, percentage of cellular protein–DNA complex formation; SASA, solvent-accessible surface area.
Regression Properties of Molecular Descriptors with Experimental Activities (Log PCPDCF)
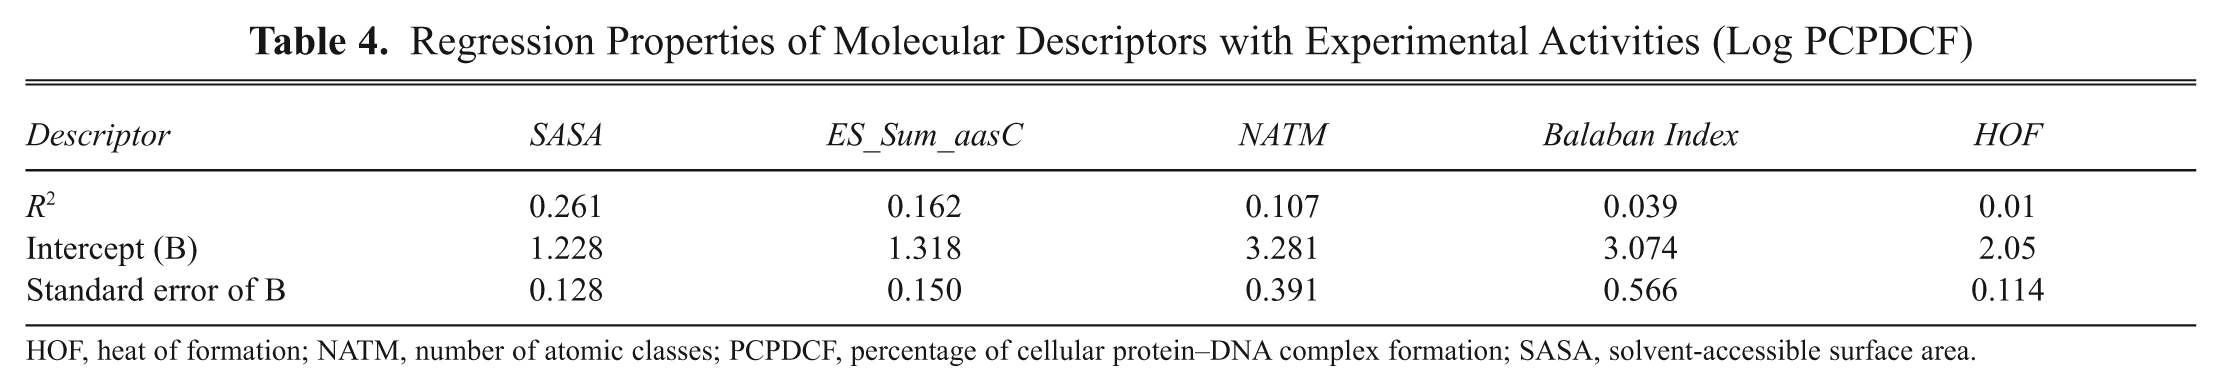
HOF, heat of formation; NATM, number of atomic classes; PCPDCF, percentage of cellular protein–DNA complex formation; SASA, solvent-accessible surface area.
The best significant relationship for the biological activity has been deduced to be
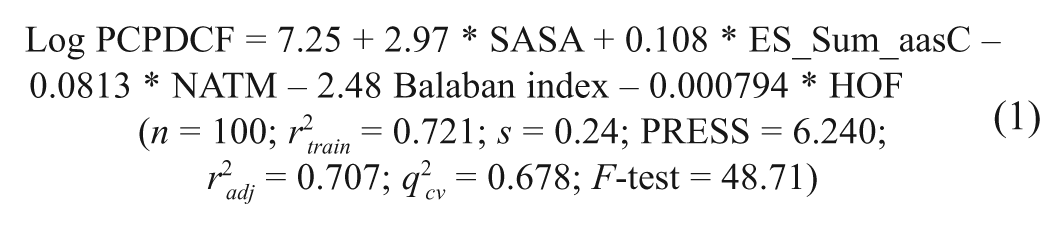
where n is the number of compounds in the training set, r (train) 2 is the squared correlation coefficient, s is the estimated standard deviation about the regression line, r adj 2 is the square of the adjusted correlation coefficient for degrees of freedom, F-test is the measure of variance that compares 2 models differing by 1 or more variables to see if the more complex model is more reliable than the less complex one (the model is supposed to be good if the F-test is above a threshold value), and q cv 2 is the square of the correlation coefficient of the cross-validation using the leave-one-out cross-validation technique. The QSAR model developed in this study is statistically (r (train) 2 = 0.721, q cv 2 = 0.678, F-test = 48.71) best fitted and consequently was used for prediction of PCPDCF of the training and test sets of molecules as reported in Supplementary Tables S1 and S2. The relationships between predicted (both training and test) activities and the corresponding experimental activities are shown in Figures 2 and 3 . The r (train) 2 and q cv 2 have values of 0.721 and 0.678, respectively, which corroborate with the criteria for a QSAR model to be highly predictive. 22 The standard error of estimate for the model was 0.24, which is an indicator of the robustness of the fit and suggested that the predicted PCPDCF based on Equation (1) is reliable. Leave-10%-out and leave-20%-out cross-validation for the training set was also performed. The value of r 2 and q cv 2 in all 10 cycles was greater than 0.5 (r 2 value 0.627-0.809 and q cv 2 value 0.605-0.78) using leave-10%-out cross-validation. Based on the leave-20%-out cross-validation technique, the value of r 2 and q cv 2 in all 5 cycles was greater than 0.5 (r 2 value 0.657-0.794 and q cv 2 value 0.601-0.752), hence further validating the model internally.
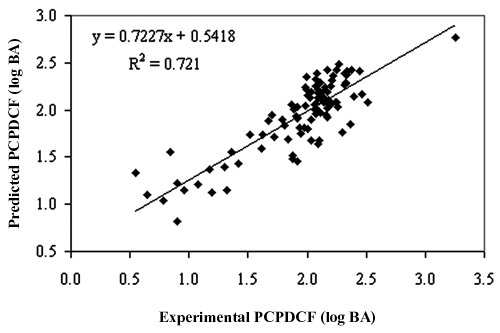
Relationship between predicted and experimental percentage of cellular protein–DNA complex formation (PCPDCF) as per Equation (1) of the training set compounds.
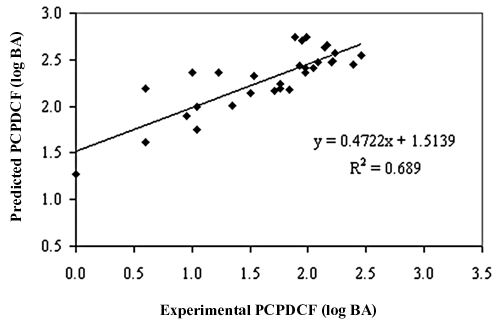
Relationship between predicted and experimental percentage of cellular protein–DNA complex formation (PCPDCF) as per Equation (1) of the test set compounds.
The intercorrelation of the descriptors used in the QSAR model (1) was very low (below 0.6), which is in conformity to the study. For a statistically significant model, it is necessary that the descriptors involved in the equation should not be intercorrelated with each other. 26 To further check the intercorrelation of descriptors, VIF analysis was performed. In this model, the VIF values of these descriptors are 1.02 (solvent-accessible surface area [SASA]), 1.09 (ES_Sum_aasC), 1.27 (number of atomic classes [NATM]), 1.34 (Balaban index), and 1.02 (heat of formation [HOF]), which are less than the threshold value of 10. 22,23
Satisfied with the robustness of the QSAR model (developed using the training set), we have applied the QSAR model to a test data set of epipodophyllotoxin analogues. As the experimental values of PCPDCF for these inhibitors are already available, this set of molecules provides an excellent data set for testing the prediction power of the QSAR model for new ligands. Supplementary Table S2 represents the predicted PCPDCF of the test set based on Equation (1). The overall root mean square error (RMSE) between the experimental and predicted PCPDCF was 0.194, which revealed good predictability. The estimated correlation coefficients (r (test) 2) and the cross-validated correlation coefficient (q cv(test) 2) between experimental and predicted PCPDCF was 0.689 and 0.623, respectively, thereby indicating the good external predictability of the QSAR model. Coupled with the good predictive ability of the QSAR model developed in this study, we believe that this model would perform well as rapid screening tools to uncover new and more potent anticancer drugs based on epipodophyllotoxin derivatizations.
Descriptors interpretation
Based on the developed QSAR model, it is observed that the important molecular descriptor that contributes to the potentiating activity is the solvent-accessible surface area (Jurs-SASA). It includes both shape and electronic information to characterize the molecules. This descriptor has the largest contribution to the bioactivity with a positive 36% contribution. The next largest contribution to bioactivity is from the Balaban J-index 27 with a negative 32% value (since the coefficient is negative). The Balaban index is a type of topological descriptor and calculated based on the 2D structure of the molecule. It is inversely proportional to the electronegativities and covalent radii of the atoms in the molecules. The third largest contribution to the biological activity comes from the descriptor ES_Sum_aasC with a positive 22.2%. It is the E-state index of an atom type that is the sum of the standard value for the atom type and the perturbation from the other atoms in the molecule. In this descriptor, “a” represents an aromatic bond, “s” is the single bond, and “C” is the carbon atom. Hence, it describes the electrotopological state index of the aromatic carbon atoms linked by single bonds. This is well supported if we compare the molecules consisting of aromatic rings and the molecules consisting of no aromatic rings. In general, substitution of aromatic groups in the scaffold structure (R group) has a higher complex formation. The contributions of the other two descriptors, NATM and HOF, are very low with a contribution of 7% and 1.4%, respectively. The descriptors that have been used for constructing the QSAR model in the present work encoded electronic, geometrical, and topological aspects of molecules.
Conclusion
We have compiled a virtual library of epipodophyllotoxin analogues built through structural modification of the scaffold structure of natural podophyllotoxin. QSAR modeling was done to get insights into ligand–TP-IIα interactions and corresponding PCPDCF of epipodophyllotoxin analogues. We have demonstrated that the QSAR model developed in this study can be applied to estimate the PCPDCF with a high level of accuracy for a diverse set of epipodophyllotoxin analogues. Using a combination of topological and electrotopological state indices, as well as electronic and thermodynamic descriptors of chemical structures, we have built several robust QSAR models with high values of q cv 2 (for training sets) and predictive r test 2 (for test sets). The calculated PCPDCF value of a set of structural analogues demonstrates good linear correlation to the experimental PCPDCF value. This model could be useful to predict the range of activities for new epipodophyllotoxin analogues. The information we have expressed in this study may lead to the design (synthesis) of more potent epipodophyllotoxin derivatives for inhibition of human TP-IIα (anticancer activity) and facilitate the search for related structures with similar biological activity from a large number of databases.
Footnotes
Acknowledgements
We thank the authorities of Scube Scientific Software for supplying the ADME Model Builder for a trial period.