
Abstract
Fragment-based screening (FBS) has gained acceptance in the pharmaceutical industry as an attractive approach for the identification of new chemical starting points for drug discovery programs in addition to classical strategies such as high-throughput screening. There is the concern that screening of fragments at high µM concentrations in biochemical assays results in increased false-positive and false-negative rates. Here the authors systematically compare the data quality of FBS obtained by enzyme activity-based fluorescence intensity, fluorescence lifetime, and mobility shift assays with the data quality from surface plasmon resonance (SPR) and nuclear magnetic resonance (NMR) methods. The serine protease trypsin and the matrix metalloprotease MMP12 were selected as model systems. For both studies, 352 fragments were selected each. From the data generated, all 3 biochemical protease assay methods can be used for screening of fragments with low false-negative and low false-positive rates, comparable to those achieved with the SPR-based assays. It can also be concluded that only fragments with a solubility higher than the screening concentration determined by means of NMR should be used for FBS purposes. Extrapolated to 10,000 fragments, the biochemical assays speed up the primary FBS process by approximately a factor of 10 and reduce the protease consumption by approximately 10,000-fold compared to NMR protein observation experiments.
Keywords
Introduction
F
A wide variety of detection methods can be used for FBS. 12 X-ray crystallography is a key technique in fragment-based drug discovery, although a significant false-negative rate might be observed and the throughput is low. But it directly provides structural information on the interaction between the target and the bound fragment. Especially for the process of fragment optimization, this information is essential. Nuclear magnetic resonance (NMR) is the most frequently used method in the context of fragment-based drug discovery because the interaction between fragment and protein can be measured directly, both in a ligand-based and in a protein-based manner. The method is robust against artifacts originating from fragment interference even at high concentrations. 13,14 However, the low throughput and the high protein consumption are factors limiting the applicability of the technique for high-throughput FBS. Both bottlenecks are nowadays partly circumvented by screening mixtures of fluorinated fragments with 19F-NMR. 15 In addition to NMR, surface plasmon resonance (SPR) is the most frequently used biophysical technique applied for FBS. Several successful fragment-based drug discovery projects based on SPR have been published. 16-20 In comparison to NMR, the protein consumption is significantly reduced. However, SPR does not enable a throughput as high as that of biochemical assays and is not as robust against compound interference artifacts as NMR.
There is the concern that screening of fragment libraries at concentrations of 100 to 1000 µM by biochemical fluorescence-based assays results in increased false-positive and false-negative rates due to fluorescence artifacts arising at high concentrations of fragments or compounds. Various companies implement FBS by biochemical assays in their first-line hit-finding strategy despite the awareness of the above-described potential pitfalls. 8,21-23 Studies have been published that demonstrate the added value of FBS by biochemical assays in several drug target classes, including kinases, 24 ATPases, 25,26 phosphatases, 22,27 and proteases. FBS examples from all 4 protease classes have been published (e.g., BACE-1, 28,29 cathepsin S, 30 MMP-9, 31 factor Xa, 32 and thrombin 10 ).
The definition of the appropriate process flowchart for a fragment-based drug discovery project depends on a variety of factors, including the fragment library size, the available quantities of proteins and fragments, and the available detection methods and their advantages and disadvantages. The pros and cons of the various detection methods are also discussed elsewhere. 4,33,34
In this study, we investigated the data quality obtained with enzyme activity-based fluorescence intensity (FI), fluorescence lifetime (FLT), and mobility shift assays (MSA) in a systematic comparison with NMR and SPR methods. Two well-described and well-characterized proteases were selected as model systems: the S1 serine protease trypsin and the matrix metalloprotease MMP12. For both studies, 352 fragments were each selected. The individual collection was composed of fragments showing binding to the protease of interest and of fragments showing no binding to the protease according to 1D-protein-observed NMR. The selected fragments were also tested for their aqueous solubility by NMR and dynamic light scattering (DLS). Finally, the false-negative and false-positive rates in the different assay systems were determined and compared to the results obtained by protein observation NMR. Based on the results of the 2 studies, FBS process flowcharts are discussed.
Materials and Methods
Cloning, expression, and purification of human trypsin and human MMP12
Trypsin purified from bovine pancreas was purchased from Serva (Heidelberg, Germany). The catalytic domain of human MMP12 (Uniprot P39900, amino acids (M)-R101 to N268) was purified and refolded from inclusion bodies isolated from Escherichia coli strain BL21(DE3) pLysS.
All substrate peptides were purchased from Biosyntan (Berlin, Germany). Coating 3 reagent was purchased from Caliper Life Sciences (Mountain View, CA). All other chemicals were obtained from Sigma (St. Louis, MO) at the highest grade available.
Liquid handling and instrumentation
For both studies, two 384-well source plates (Greiner, Frickenhausen, Germany) were generated containing the 352 selected fragments at a concentration of 100 mM and 30 mM, respectively, in 90% (v/v) deuterated DMSO and 10% D2O. For all assays and tests described below, aliquots from these source plates were taken to obtain the final fragment concentrations of 1 mM and 300 µM (at 0.9% DMSO), respectively. For this, 250-nL fragment aliquots were transferred from the source plates to 384-well assay plates by a 384-well head Hummingwell system (CyBio AG, Jena, Germany). Then, 12.5-µL enzyme solution diluted in assay buffer was added to the compounds and incubated for 1 h at room temperature (RT), followed by the addition of 12.5 µL substrate diluted in assay buffer. After a 1-h incubation time at RT, the plate was measured.
For MSA assays, the enzymatic reaction was stopped by the addition of 75 µL of a potent inhibitor diluted in “running buffer” prior to measurement.
Further details of the assay conditions for the 3 biochemical assays are listed in
Protease Activity Assay Conditions
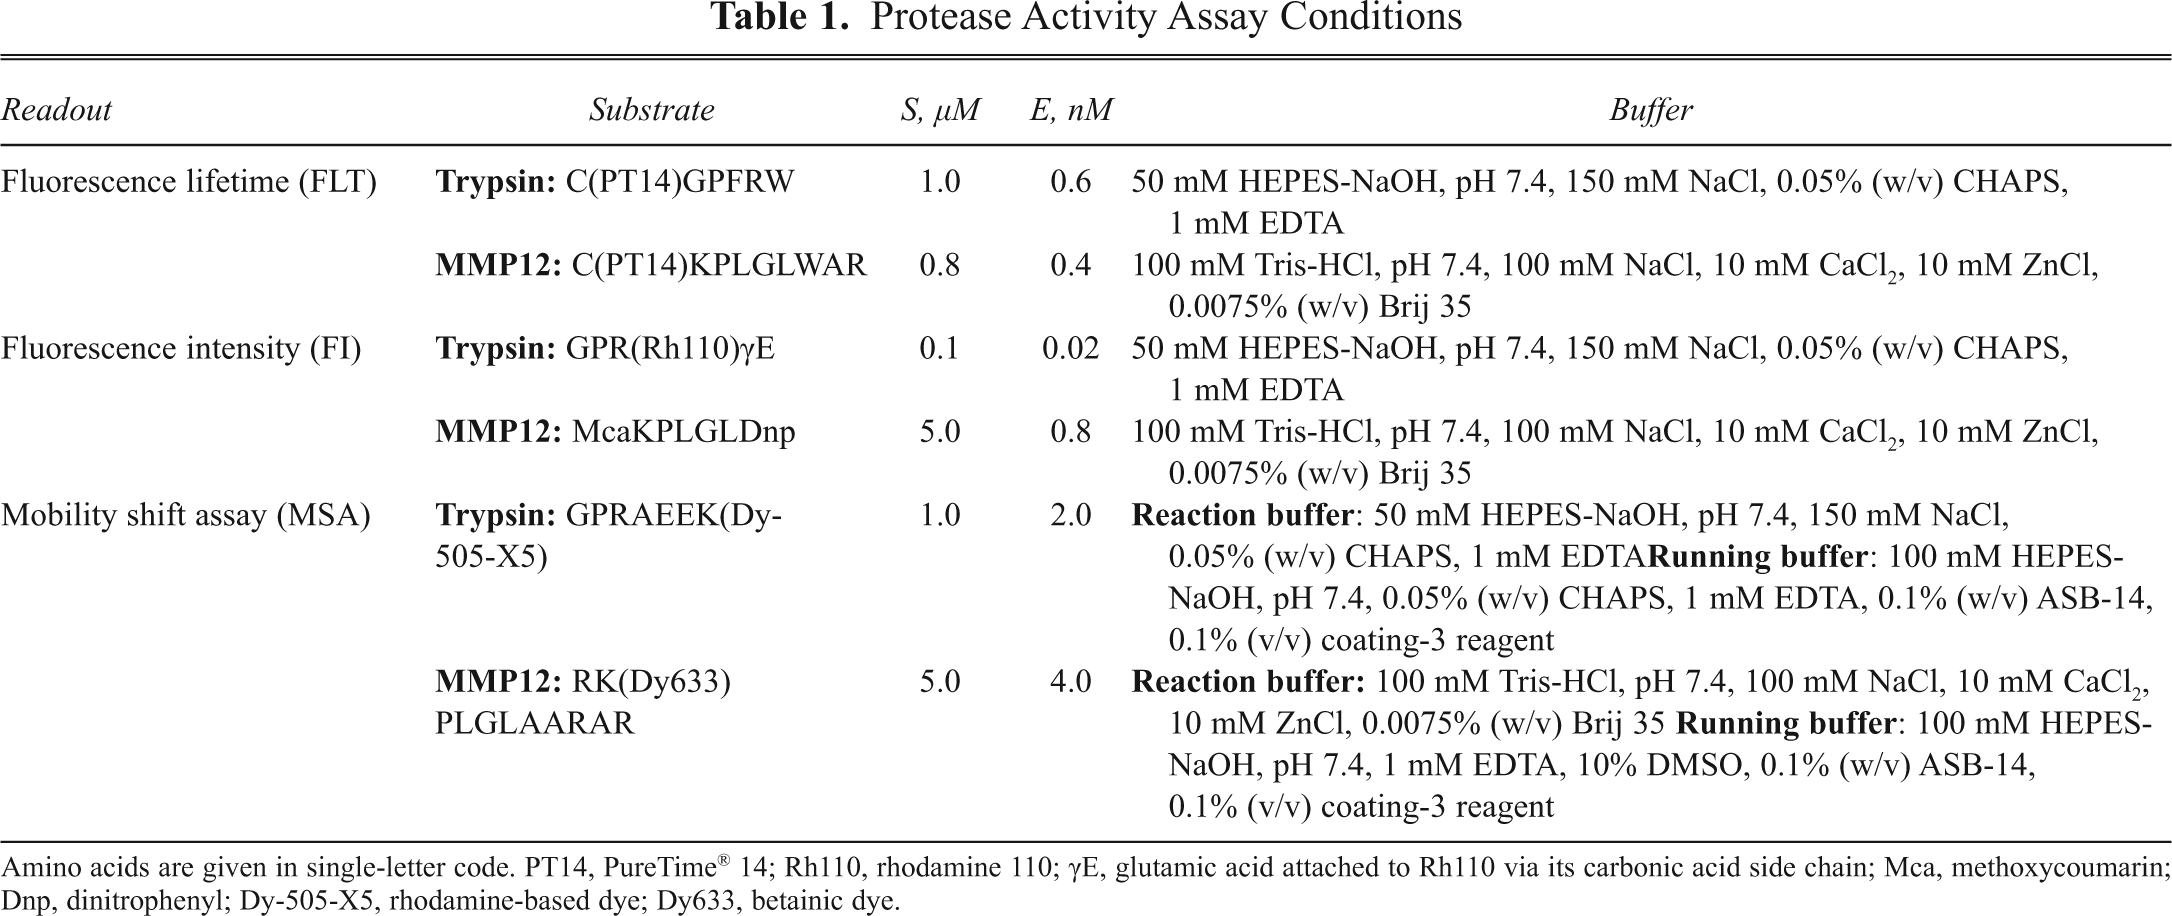
Amino acids are given in single-letter code. PT14, PureTime® 14; Rh110, rhodamine 110; γE, glutamic acid attached to Rh110 via its carbonic acid side chain; Mca, methoxycoumarin; Dnp, dinitrophenyl; Dy-505-X5, rhodamine-based dye; Dy633, betainic dye.
Instrumentation for fluorescence intensity measurements
Plate measurements were conducted using a Safire2 (TECAN, Maennedorf, Switzerland). Wavelengths of 485 nm/535 nm (rhodamine 110) or 340 nm/430 nm (methylcoumarin) were taken for fluorescence excitation and emission acquisition, respectively. The bandwidths were set to 20 nm in both the excitation and the emission path. The fluorescence in each well was excited by 3 flashes per measurement.
Instrumentation for fluorescence lifetime measurements
Plate measurements were conducted using an Ultra Evolution FLT reader (TECAN) exciting the dye PureTime®14 (6-(9-oxo-9H-acridin-10-yl)-hexanoate) as described by Doering et al. 35
Instrumentation for mobility shift measurements
The MSA readout was performed on a LabChip3000 drug discovery workstation (Mobility Shift Screening System, Caliper Life Sciences). The machine was used in the “off-chip” mode with the protease reaction taking place in a 384-well plate. After stopping the reaction, the mixture was sipped onto the 12- sipper chip (TC6, Caliper Life Sciences). For the separation of the reaction components, the upstream and downstream voltages for the 12-sipper chip were set to −150 and −2000 V. Values of −1.9 psi (trypsin assay) or −4 psi (MMP12 assay) were chosen as the screening pressure. The sample sip time was set to 200 ms. The detector settings were 488 nm excitation/530 nm detection for the trypsin assay and 633 nm/685 nm for the MMP12 assay.
Threshold setting for biochemical assays
As a basis for hit threshold setting, the median absolute deviation (MAD) was used. MAD can be defined as follows:

where X indicates all 352 sample values of a 384-well plate (without controls), and Xi indicates the individual sample well. First, the median of the actual data was calculated and then the median of the distances of the values from that median. The constant 1.4826 was used to make MAD comparable to standard deviation when data distribute normally.
To determine the individual hit thresholds for the 3 biochemical assay methods, the 352 fragments selected for the MMP12 study were tested in the respective trypsin assays and vice versa. These threshold-setting plates were generated and tested according to the same screening process as all other assay plates. For all biochemical assays, an MAD of 2 was used to calculate the hit threshold.
SPR assays for trypsin and MMP12
Immobilization of trypsin and MMP12 on ProteOn XPR36 chip
The immobilization step was performed using a flow rate of 30 µL/min at 25°C on a sensor chip surface (Bio-Rad, Hercules, CA). The channels were activated for 5 min using a mixture of 0.2 M N-ethyl-N′-(3-dimethylaminopropyl)-carbodiimide (EDC) and 0.05 M sulfo-N-hydroxysuccinimide (sulfo-NHS). This was followed by an immediate injection of 150 µL of the target protease. Finally, 150 µL of 1 M ethanolamine-HCL (pH 8.5) was injected to deactivate any remaining activated carboxyl groups. Bovine trypsin was immobilized on a GLM chip at a concentration of 50 µg/mL, and MMP12 was immobilized on a GLH chip at a concentration of 10 µg/mL in the presence of a reversible active site directed inhibitor (hydroxamate derivative with IC50 ~1 µM). Both proteins were dissolved in 20 mM acetate buffer (pH 5.5).
FBS with ProteOn XPR36
All of the binding measurements were performed at 25°C. The fragments were dissolved to a final concentration of 300 µM in the running buffer and spun down to precipitate insoluble particles. These solutions were injected in the vertical orientation ProteOn XPR36 fluidics for 30 s at 50 µL/min, and the dissociation time was 60 s. No further regeneration step was necessary. The chip performance was monitored during the screening by injection of a reference compound at a single dose in all 6 channels as well as a dose-response curve (DRC) after each plate.
In the trypsin study, the running buffer was PBST (phosphate-buffered saline + 0.005% [w/v] Tween-20) with 2% DMSO. In the MMP12 study, the running buffer was composed of 50 mM HEPES (pH 7.4), 100 mM NaCl, 10 mM CaCl2, 0.1 mM ZnCl2, and 0.005% (w/v) Tween-20 with 0.67% DMSO.
For the data analysis, the signals were corrected for nonspecific binding to the surface by subtracting signals from the reference surface from those of the enzyme surface (reference subtraction). A blank activated and deactivated channel served as reference. No further normalization of the response has been performed with respect to molecular weight (MW) of the fragments or the loss of binding capacity of the chip. The hit threshold was set with the objective of identifying fragments up to a KD of 1 mM. The threshold levels were determined by the formula

with an average MW of the fragments of 250 Da and a MW of the reference compound of 484 Da and 532 Da for trypsin and MMP12, respectively. The RUmax levels were 54 RU and 150 RU for trypsin and MMP12, respectively. The thresholds levels were 5 RU and 14 RU for trypsin and MMP12, respectively.
Dynamic light scattering
The compounds were tested in assay buffer at a final concentration of 1 mM and 300 µM, respectively. For negative controls, reaction buffer was added to DMSO containing wells. For the DLS measurements, a DynaPro MS/X (Wyatt, Dernbach, Germany) with a 55-mW laser at 826.6 nm, at a detector angle of 90°, was used. The integration time was 200 s. Each data set represents the average of 3 independent measurements, calculated as the ratio from sample wells and control wells.
To identify fragments with a limited solubility, a threshold was set based on the median signal-to-background (S/B) ratio values from all fragment-containing wells. The S/B ratio was calculated by dividing each individual DLS signal by values obtained from DMSO control wells. All compounds showing values of more than an MAD of 5 were classified as fragments with limited solubility.
Binding assays and fragment solubility determination by NMR
All NMR experiments were recorded at 23°C with a Bruker AVANCE-600 or Bruker AVANCE-500 spectrometer (Bruker Biospin, Zürich, Switzerland) equipped with a SampleJet robot for sample automation. For MMP12, the NMR samples were in 50 mM Tris (pH 7.2), 10 mM CaCl2, 0.1 mM ZnCl2, 300 mM NaCl, and 10% D2O. For trypsin, the samples were in 50 mM Tris (pH 8.0), 100 mM NaCl, 10 mM CaCl2, and 10% D2O. For protein observed experiments, excitation sculpting was employed for water suppression. 36
MMP12
The MMP12 concentration used in protein observation experiments was 27 µM, and the compound stock solution was added to a final concentration of 1 mM. The actual concentration was determined by comparing the 1H NMR peak intensities to a reference signal.
The KD values for the “assay false-negative” fragments were determined with FAXS. 37 FAXS is a displacement experiment that uses a weak affinity reporter molecule containing a CF3 or CF moiety and 19F as the nucleus of detection. 37 A CF3 containing compound with a KD of 130 µM was used as the reporter. Specific binding of the reporter to the active site was confirmed by competition with known MMP12 inhibitors. The conditions used in the FAXS experiment were as follows: 20 µM reporter, 1 µM MMP12, and 300 µM ligand concentration. Under these conditions, the measureable KD ranges from 100 to 1000 µM. A Carr–Purcell–Meibom–Gill (CPMG) experiment with a time interval of 40 ms between the 180° pulses and with a total length of 400 ms has been used. The data were multiplied with a shifted sine window function prior to Fourier transformation. Typically, 64 scans were recorded for each spectrum. Chemical shifts were referenced to the CFCl3 signal in water.
Trypsin
The trypsin concentration used in protein observation experiments was 40 µM, and the compound concentration was 1 mM.
The KD values for the “assay false-negative” fragments were determined by NMR titration. A 1-binding site isotherm was fitted to the data. The solubility of the fragments was determined in a separate 1H NMR experiment where DSS (2,2-dimethyl-2-silapentane-5-sulfonic acid) was added as a reference compound for integration. The buffer used for solubility determination was either 50 mM phosphate buffer at pH 7.0, 10% D2O with 222 µM DSS, or 50 mM Tris (pH 7.5), 100 mM NaCl, and 10% D2O with 100 µM DSS.
Results
Two sets of 352 fragments were screened in the FI, FLT, MSA, and SPR assay formats against 2 different proteases. The 2 studies were set up to predict the value of the assay methods for future applications in a routine FBS process. The design of the MMP12 study is described in
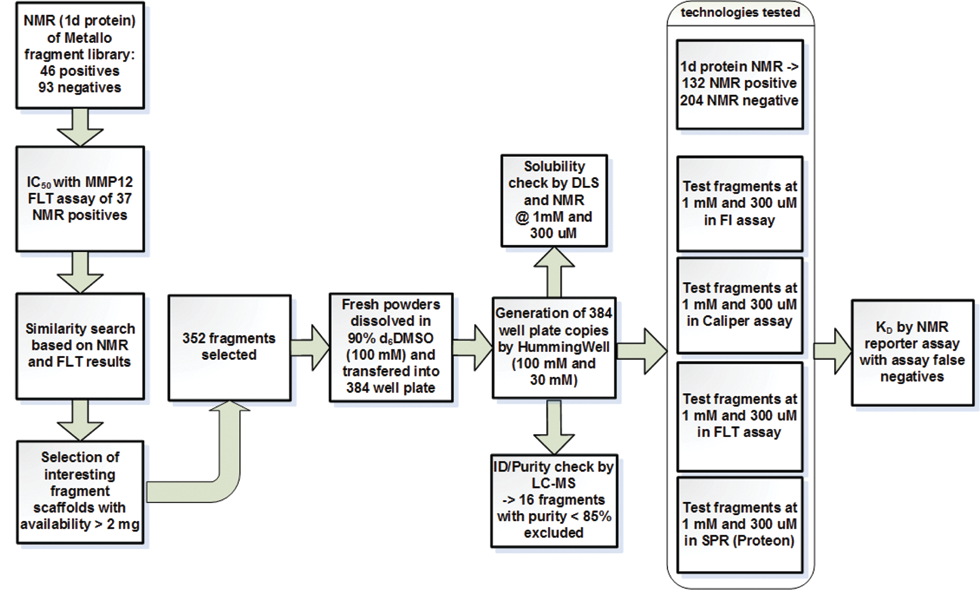
Process flow of FBS study with MMP12.
Selection of fragments for MMP12 study
A small but diverse metalloprotease-targeted fragment library consisting of 139 members, composed of known or potentially new zinc binders, S1′ pocket binders, or combinations thereof, served as a starting point for the selection of the 352 fragments. An earlier FBS allowed the identification of 46 MMP12 binders and 93 nonbinders from the 139-member library.
Fragments for which binding to the target was demonstrated by NMR are called “NMR positives,” and fragments for which no binding to the target could be shown by NMR are called “NMR negatives” in this article. To be able to compile a collection of fragments with a broad range of different binding affinities, the inhibitory potencies (IC50) of 37 of the 46 NMR positives were determined in the MMP12 FLT-based assay. The IC50 values for the 37 inhibitors varied between 0.01 and 985 µM and thus covered the potency range of a typical FBS campaign. Therefore, the best structural motifs present in the original 139-member library were used as a basis for extension to 352 members. These were selected by similarity or substructure searches with MW and clogP cutoffs at 350 g/mol and 3, respectively, with a few exceptions at higher clogP coming from structures bearing a bis aryl-type S1′ scaffold in combination with a zinc binding moiety.
Selection of fragments for trypsin study
Prior to the outset of the current study, pilot FBS screening using trypsin and employing X-ray crystallography as well as NMR spectroscopy had already been performed. Libraries tested included the screening set of the Novartis generic fragment library described by Schuffenhauer et al., 38 derived from chemical building blocks by masking of linker groups. In addition, a second generic library as well as 2 small targeted libraries had been screened by NMR followed by X-ray studies of selected fragment hits. This data set formed the basis for the selection of fragments to be included in the current trypsin study. The 312 NMR negatives (nonbinders) for this study were recruited from the first-mentioned library. Forty NMR-positive fragments (binders) were assembled from all 4 fragment sets previously tested.
Fragment identity and purity determination by liquid chromatography/mass spectrometry
Altogether, 16 fragments selected for the MMP12 study and 8 fragments selected for the trypsin study did not have a purity of ≥85% as determined by liquid chromatography/mass spectrometry (LC/MS) methods 39 and were therefore excluded from further data evaluation.
Fragment solubility determination by NMR and DLS
The fragment solubility was investigated by means of DLS and NMR at fragment concentrations of 1 mM and 300 µM, respectively. The results of this solubility check are shown in
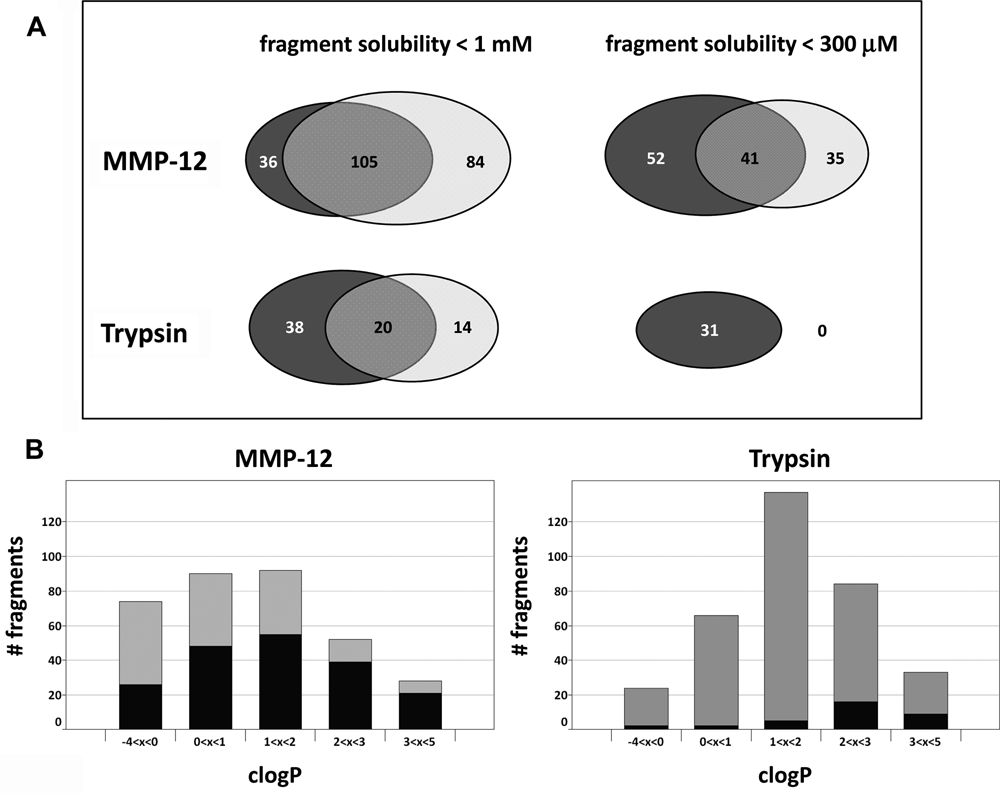
Comparison of fragment solubility determined by nuclear magnetic resonance (NMR) and dynamic light scattering (DLS). (
The comparison of the solubility data generated by NMR with the data generated by DLS shows that the overlap of fragment populations with a solubility of <1 mM and <300 µM, respectively, was significant but far from 100%. The data generated by NMR were regarded as more reliable because the solubility of the fragments could be quantified precisely through the determination of the effective concentration in the measured solution. This direct measurement was not possible by DLS. Therefore, the discrimination between highly and weakly soluble fragments was based on the NMR data in the subsequent data analysis.
Fragment binding to proteases by 1D 1H protein NMR
For trypsin and MMP12, we used 1D 1H protein chemical shift perturbation (CSP) experiments for the identification of binders because of the robustness and sensitivity of this method.
For 140 of the 352 selected fragments, binding to MMP12 could be demonstrated. For 212 of the selected molecules, no binding to the protease could be observed.
Data obtained with biochemical protease activity assays
The 352 fragments selected for the MMP12 study and the trypsin study, respectively, were tested in the biochemical FI, FLT, and mobility shift assays developed for these proteases. With all 3 biochemical assays, robust FBS data were generated in both studies. This was demonstrated by Z′ values of >0.7 for all tested plates. Critical for minimizing the false-negative and false-positive rate of an assay is the hit threshold setting. For this purpose, the fragments selected for the trypsin study were tested in the MMP12 assays and vice versa. Per definition, these plates yielded a distribution of negative controls representing the assay robustness on a 384-well plate. To minimize the false-negative rate, the hit threshold was set to 2 MAD. By the reduction of the threshold from the usually applied MAD of 3 to 2, the risk of an enhanced false-positive rate is taken into account. In the FLT measurements, the recorded fluorescence intensity decays from the individual samples were fitted automatically to a simple monoexponential decay model using the software provided by the manufacturer. 35 The obtained fluorescence lifetimes were used to calculate the percentile inhibition value for an individual compound. With this procedure, we observed a slight offset of the inhibition data toward positive values. The reason leading to the offset could not be identified. At fragment concentrations in the range of 1 mM and above, a significant increase of scatter on the FLT data was observed. We assume that at high concentrations, some fragments are able to quench the PT14 fluorescence dynamically, resulting in a decrease of the dye’s FLT (data not shown).
Data obtained with SPR-based binding assays
Binding experiments were performed with an amount of immobilized protein that corresponds to 6000 and 8000 RU for trypsin and MMP12, respectively. The experimentally determined saturation response levels for reference compounds were 54 and 150 RU for trypsin and MMP12, respectively. In comparison to the theoretical response level, the estimated percentage of active immobilized protein was 50% and 70% for trypsin and MMP12, respectively. The binding curves for the reference compounds were measured at regular intervals during the screen to monitor the stability of the immobilized protein. The saturation response levels were decreased by 10% to 20% toward the end of the screen, indicating that the immobilized proteases were sufficiently stable.
Fragments were injected at a concentration of 300 µM, and the response on the channel containing trypsin and MMP12 was referenced against an uncoated dextran channel.
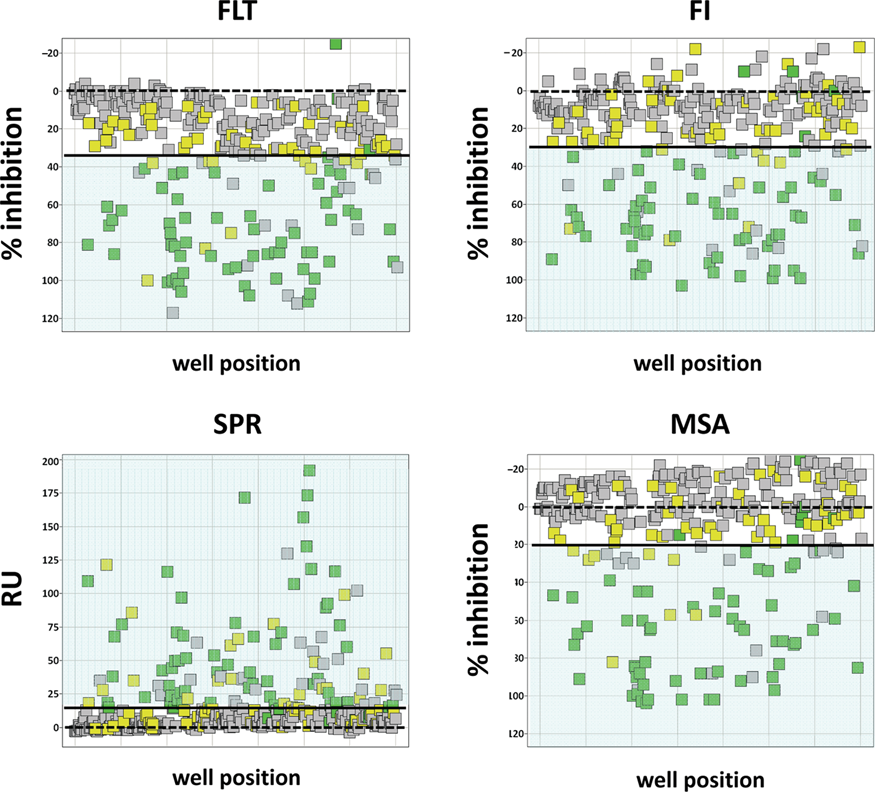
Visualization of assay performance on 384-well plates for fluorescence intensity, fluorescence lifetime, and mobility shift assays (all at a fragment concentration of 1 mM), and surface plasmon resonance–based (at a fragment concentration of 300 µM) MMP12 assays. Fragments not found to be binding to trypsin by 1D-protein nuclear magnetic resonance (NMR) are displayed as gray rectangles, those with a KD > 1 mM as determined by the NMR reporter assay are displayed as yellow rectangles, and those with a KD < 1 mM are displayed as green rectangles. The threshold individually determined for each assay is indicated by a black line and 0% inhibition by a dashed black line.
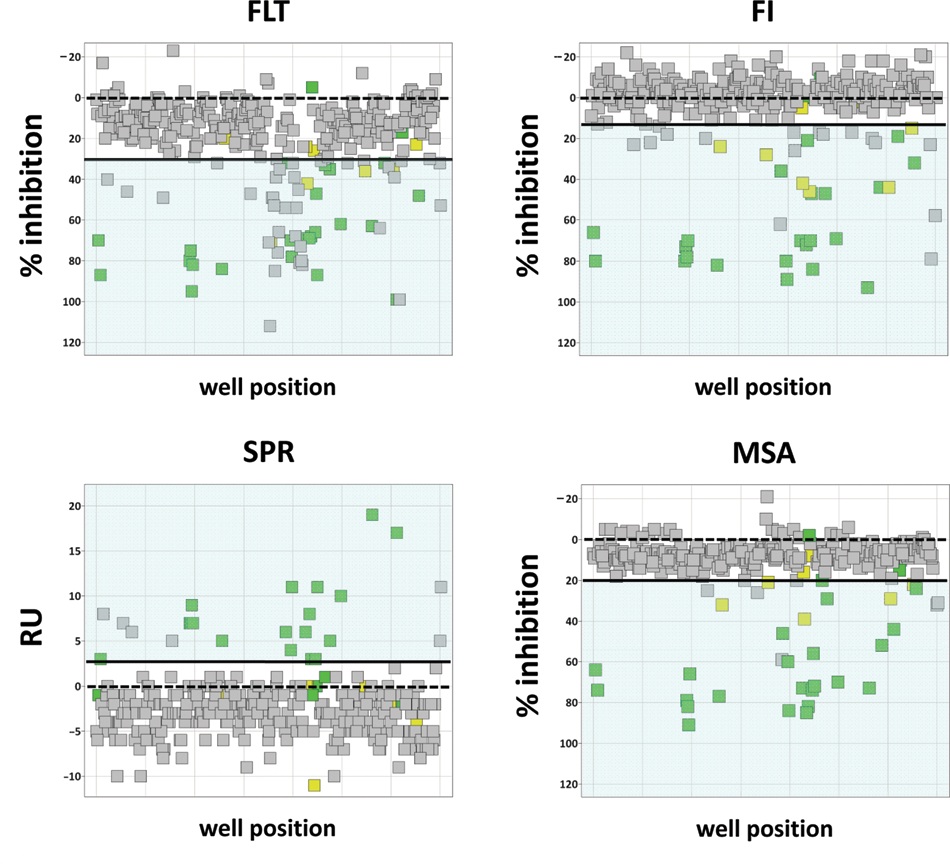
Visualization of assay performance on 384-well plates for fluorescence intensity, fluorescence lifetime, mobility shift assays, and surface plasmon resonance–based trypsin assays as in
KD determinations by NMR reporter assays
For trypsin, the KDs of all assay false-negative fragments were determined by 1D 1H CSP titration. For the KD determination of assay false-negative fragments for MMP12, FAXS was used.
In the MMP12 study, 79 of the 140 1D-protein NMR-positive fragments were not identified as hits at a fragment concentration of 1 mM in at least one of the biochemical assays or the SPR-based assay. These 79 fragments included those that showed a limited solubility according to the NMR solubility data. For all 79 assay false-negative fragments, the binding affinity to MMP12 was quantified by the NMR reporter assay.
The NMR reporter assay allowed the determination of binding affinities up to KD values of 1 mM. Thus, the fragment binding affinities were subdivided into 3 categories for further statistical evaluations: 100 µM < KD < 500 µM, 500 µM < KD < 1000 µM, and KD > 1000 µM. The results for each individual biochemical assay and the SPR-based assay are shown in
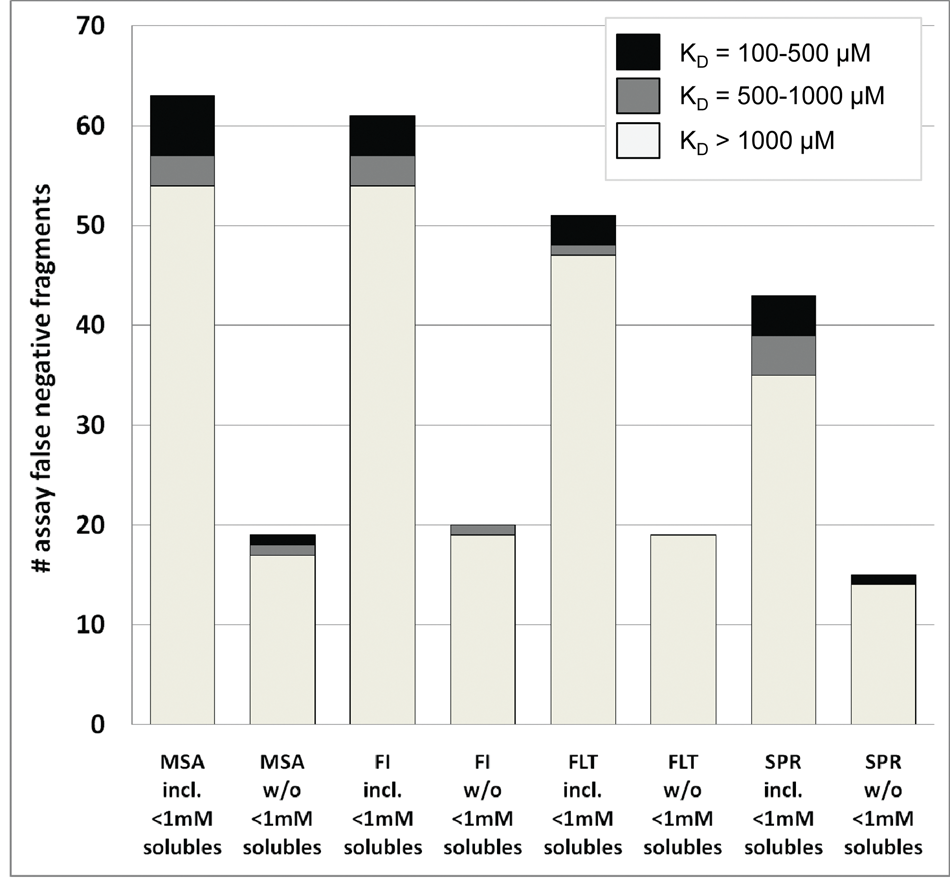
Distribution of false negatives in the MMP12 study divided by assay format and KD values determined by nuclear magnetic resonance (NMR) reporter assay, including fragment solubility determined by NMR. All fragments identified to be false negatives in one of the biochemical or the SPR assay were selected for KD determination by NMR reporter assay.
Rate of false positives and false negatives in individual assays and assay combinations
All fragments that were proven to bind to MMP12 by 1D-protein NMR but showed a binding affinity of KD > 1 mM in the NMR reporter assay were excluded from the subsequent false-negative/false-positive analysis. These fragments were excluded because the analysis of the false-negative rates should allow a general conclusion about the intrinsic sensitivity of the individual assay methods in FBS. This conclusion should not be biased by very weakly binding fragments that could not be identified as hits due to the limitation of the assay to a fragment concentration below the KD. It cannot be considered an intrinsic weakness of the assay methods that those very weakly binding fragments were not found as hits.
In
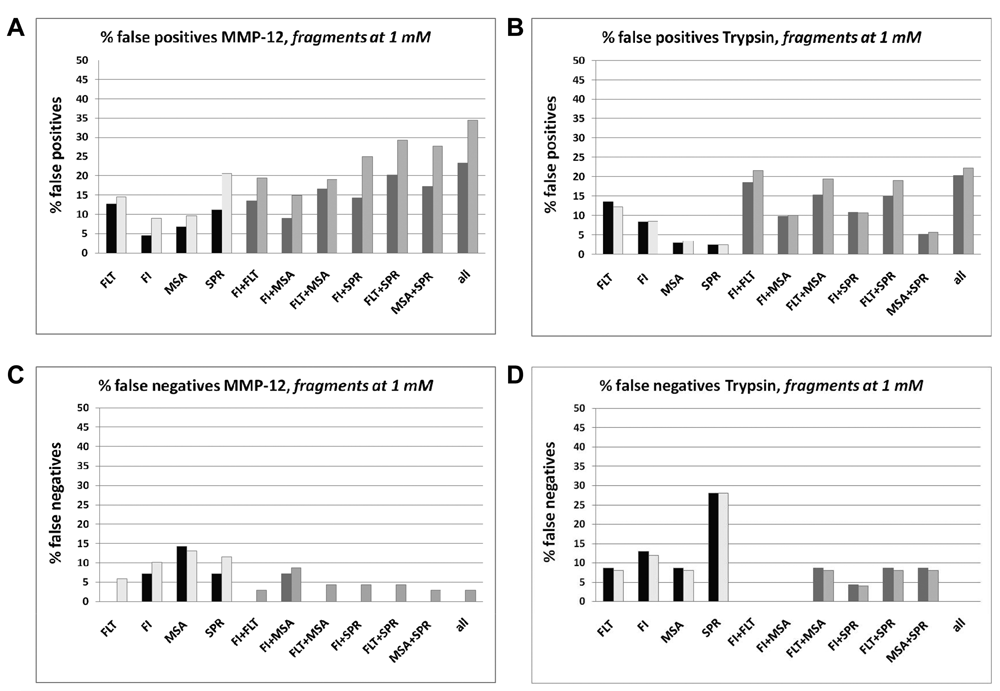
Analysis of false-negative and false-positive rates at a fragment concentration of 1 mM. Fragments were classified as follows: (1) false negatives = binder in 1D-protein nuclear magnetic resonance (NMR) but not identified as a hit in the assay or (2) false positives = fragment identified as a hit in assay but not identified as binder in 1D-protein NMR. SPR data for fragments at 300 µm. (
The exclusion of the weakly soluble fragments leads to a reduction of the false-negative rates for 3 assays in the MMP12 study but to an increase for all assays in the trypsin study. In the MMP12 study, the lowest false-negative rate of 0% was observed with the FLT-based assay. The highest false-negative rate of 15% was observed with the MSA. In the trypsin study, the lowest false-negative rate of 8% was also obtained with the FLT-based assay. The highest rate of 27% was observed with the SPR-based assay. In both studies, the combination of the data generated with 2 assay formats resulted in a significant reduction of the false-negative rates. Several combinations of data from 2 assay formats led to a reduction of the false- negative rate to 0%.
In
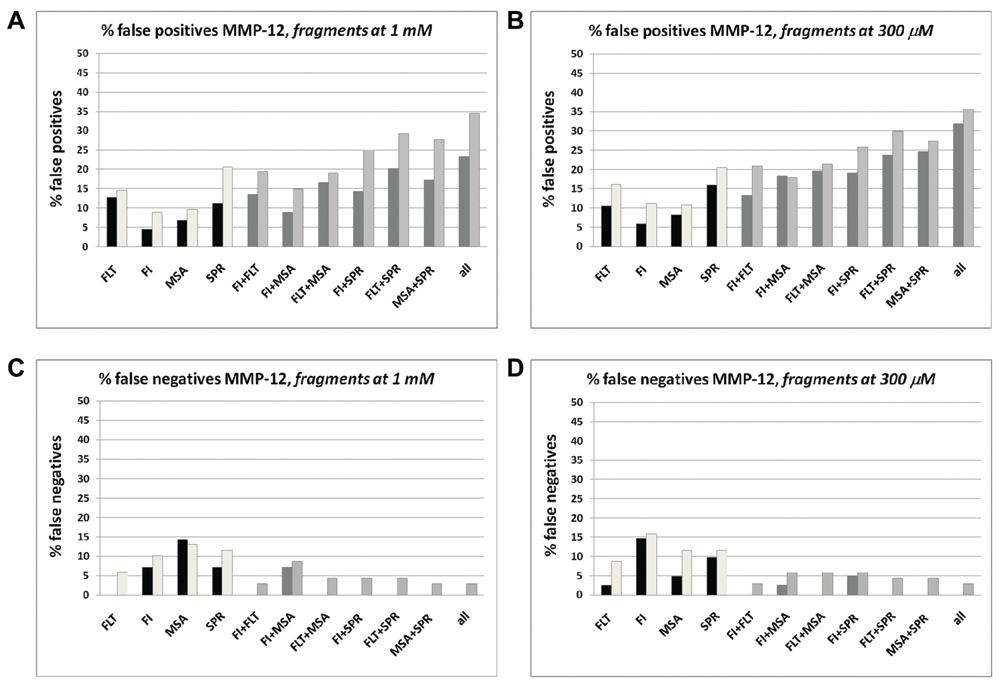
Analysis of false rates in the MMP12 study. (
Discussion and Conclusions
In 2 systematic investigations using trypsin and MMP12 as model systems, 3 different enzyme activity-based biochemical assay formats were compared with NMR- and SPR-based assays for their suitability in FBS. In general, protease activity assays based on fluorescence intensity, fluorescence lifetime, and mobility shifts could be used for screening of fragments with low false-negative and low false-positive rates, comparable to those achieved with SPR-based assays.
In both studies, the lowest false-negative rate was obtained with the FLT-based assay after exclusion of the fragments with a solubility of <1 mM. In both studies, the differences in the false-negative and false-positive rates between the methods were rather small. The average false-positive and false-negative rate calculated for each assay readout from the 2 studies varied within a factor of 2 to 3 between the readouts. Thus, none of the 3 biochemical readout principles turned out to be clearly superior to the others in terms of assay robustness or sensitivity. As expected, the pairwise combination of the hit lists of 2 of the tested assay formats resulted in an increase in false-positive rates and a reduction in the false-negative rates. As false negatives cannot easily be fed back into the fragment optimization process later, a combination of biochemical assay methods is recommended for FBS. In both studies, all 3 combinations of 2 biochemical assay formats led to comparable, low false-negative rates. Due to this observation and the fact that the MSA should be the most robust method with respect to artifacts stemming from autofluorescent and fluorescence quenching fragments, it is recommended to use a combination of the MSA format with 1 of the 2 fluorescence-based readouts. To appropriately decide between the FI- and the FLT-based assay, one should test the assay sensitivity by determining the IC50 values of well-characterized fragments (if available) and the assay robustness of both formats using DMSO-containing plates and randomly selected fragments to determine the hit thresholds. The definition of the hit threshold is a critical step for each HTS and FBS campaign in general. To minimize the false-negative rates, we decided to reduce the hit thresholds to the median inhibition value from all fragment-containing wells plus 2 MAD instead of an MAD of 3.
The results in terms of false-negative and false-positive rates obtained with the SPR-based assays were comparable to those of the 3 biochemical assays. However, the false-negative rate obtained with the SPR-based assay in the trypsin study was surprisingly high. This could largely be explained by the relatively weak response levels that were obtained for trypsin due to both the low protein loading onto the chip as well as the lower percentage of active immobilized protein. The assay setup could have been improved in analogy to the MMP12 study. The protein loading onto the chip was increased by using a high-density sensor chip (GLH) and the protection of the active site with a potent and reversible inhibitor during the amino coupling step to increase the percentage of active immobilized protein.
Thus, SPR is generally well suited for FBS. In our setup, SPR lends itself best to FBS of rather small collections of <1000 fragments or to the validation of hits identified from screening of bigger fragment collections with a combination of an MSA and 1 of the 2 fluorescence-based methods. In general, we envisage multiparallel FBS process scenarios depending on the fragment library sizes, the library composition, and the acceptable boundaries of an FBS approach. The FBS process will start with testing the fragments in 2 different biochemical assays if the collection size exceeds 1000 members or a low protein consumption is required. In this FBS scenario, the fragment hits would be validated by an NMR- or SPR-based method. Where the library comprises <1000 fragments, the FBS campaign would start directly with NMR measurements. Also, when it is desirable to identify fragments with a KD of >1 mM or fragments binding to the protease but not inhibiting its enzymatic activity, this FBS process would be chosen. Where the library exclusively consists of fluorine-containing fragments, 19F-NMR enables fragment collection sizes of >1000 members to be screened. All FBS processes should be based on fragment collections that have been characterized for their solubility. Restricting these to fragments having a clogP <3 helps to reduce the number of weakly soluble fragments but does not exclude them completely. In our view, the fragment solubility should be determined by NMR and not by DLS. NMR measurements allow the direct determination of the concentration of a fragment in solution.
In conclusion, we have described the results of testing 352 fragments on the proteases MMP12 and trypsin, respectively, using 3 different biochemical protease activity assay formats in comparison to SPR and NMR: fluorescence intensity, fluorescence lifetime, and mobility shift. The data quality is sufficient that all 3 methods can be applied in primary FBS. Extrapolated to 10,000 fragments, the biochemical assays speed up the primary FBS process by approximately a factor of 10 and reduce the protease consumption by approximately 10,000-fold compared to NMR protein observation methods.
Footnotes
Acknowledgements
We thank Gabriele Meder, Stephan Pritz, Ingo Muckenschnabel, and Danielle Barlier for their excellent experimental work and Trixi Brandl for her support with the selection of fragments for the study. We are grateful to Jörg Eder for the fruitful discussions and his continuous support. We thank Paul Ramage for his comments on the manuscript.