
Abstract
The use of engineered mouse embryonic stem (mES) cells in high-throughput screening (HTS) can offer new opportunities for studying complex targets in their native environment, increasing the probability of discovering more meaningful hits. The authors have generated and developed a mouse embryonic stem cell line called c-Photina® mES stably expressing a Ca2+-activated photoprotein as a reporter gene. This reporter cell line retains the ability to differentiate into any cell lineage and can be used for miniaturized screening processes in 384-well microplates. The c-Photina® mES cell line is particularly well suited for the study of the pharmacological modulation of target genes that induce Ca2+ mobilization. The authors differentiated this mES reporter cell line into neuronal cells and screened the LOPAC1280™ library monitoring the agonistic or antagonistic activities of compounds. They also demonstrate the possibility to generate and freeze bulk preparations of cells at an intermediate stage of differentiation and enriched in neural precursor cells, which retain the ability to form fully functional neural networks once thawed. The proposed cell model is of high value for HTS purposes because it offers a more physiological environment to the targets of interest and the possibility of using frozen batches of neural precursor cells.
Introduction
C
Cell-based assays often use transformed cell lines, which express both a photoprotein and a target receptor. The parental cells used for overexpressing the gene of interest are usually selected because of the limited expression of interfering receptors, their ease of culture, and rapid growth. However, exogenous expression of targets and the transformed environment can create artifacts of gene dosage, toxicity, or stoichiometry of the receptor target itself, particularly when it requires assembly of multiple subunits. Primary cells are a good alternative to transformed cell lines because they express the gene of interest endogenously in a more physiological environment, but they are often difficult to culture in sufficient number and sometimes very tricky to transfect.
Embryonic stem cells could represent a valid alternative. By retaining the self-renewal property of the undifferentiated state, they can be cultured and expanded in vitro for long periods and are easily transfected. 9 Moreover, embryonic stem cells can differentiate into virtually any cell type resembling primary cells. 10,11 Accordingly, they offer a natural environment for the receptor targets, and they can form complex targets (like multi-subunit ion channels), with the correct stoichiometry and natively regulated. 12
In our approach to the problem, we generate clones of mouse embryonic stem (mES) cells expressing a photoprotein as a Ca2+ reporter system under the control of a ubiquitous promoter. 13 We adapted a neuronal differentiation protocol to suit HTS conditions to set up robust cell-based assays. 13,14
We describe the preparation of bulk frozen cells at an intermediate stage of neural differentiation and enriched in neural precursor cells (NPCs). We demonstrate that neural cells derived from thawed NPCs maintain the same characteristics, in terms of neuronal subtype composition and functional responses, as the neural cells directly derived from undifferentiated mES cells, opening a new opportunity for HTS applications.
Materials And Methods
c-Photina® mES cell culture
c-Photina® TBV2 (129S2/SvPas) mES cells 13,15 were cultured in the undifferentiated state on a monolayer of mitomycin C–treated mouse embryonic fibroblasts in the presence of leukemia-inhibiting factor (LIF) (Chemicon, Temecula, CA).
Neuronal differentiation protocol
The mES reporter cells were seeded at 1500 to 3000 cells/cm2 on gelatin-coated dishes in KnockOut™–Dulbecco’s modified Eagle’s medium (DMEM) with 15% KnockOut™ Serum Replacement (KSR; Invitrogen, Carlsbad, CA) for 13 to 21 days with medium changes every 2 to 3 days, as described in Fico et al. 14
On day 7, the cells were detached using 0.05% trypsin/EDTA solution and counted. This step was defined as the replating step. At this stage, cells could be used either for immediate replating at 5000 cells/well in gelatin-coated 384-well plates to continue the neuronal differentiation protocol or frozen in 90% fetal bovine serum (FBS) + 10% dimethyl sulfoxide (DMSO) to obtain a homogeneous population of NPCs.
Frozen NPCs were thawed and immediately plated at 5000 cells/well in gelatin-coated 384-well plates. Two days after thawing and plating, the medium was changed using multichannel automatic pipettes, and this procedure was repeated every 2 to 3 days until the end of the differentiation protocol.
The functional test was performed on differentiated cells using the FLIPRTETRA® reader in the luminescent mode. Cells were incubated for 4 h with 40 µL/well of Tyrode’s buffer (130 mM NaCl, 5 mM KCl, 2 mM CaCl2, 1 mM MgCl2, 5 mM NaHCO3, and 20 mM HEPES, pH 7.4, 2 mM Ca2+) and 10 µM coelenterazine in the dark at 37 °C in a humidified atmosphere with 5% CO2. Agonists were injected at a 5× concentration.
RT-PCR analysis
Total RNA was isolated by TRIzol® (Gibco/BRL, Gaithersburg, MD). Reverse transcription–PCR (RT-PCR) was performed with the Invitrogen SuperScript® II RT-PCR kit (Invitrogen), as recommended by the manufacturer. The primer lists and the PCR conditions are described in Fico et al. 14
Immunofluorescence analysis
The cells were fixed with 4% paraformaldehyde (PFA, MERCK, Whitehouse Station, NJ) solution and simultaneously blocked and permeabilized with 10% normal goat serum (Chemicon)/0.2% Triton X-100 in 1× phosphate-buffered saline (PBS) directly in 384-well plates.
All antibodies were incubated in 10% normal goat serum 0.1% Triton X-100 in 1× PBS.
The primary antibodies used were as follows: mouse anti–beta III tubulin (Chemicon), rabbit anti–glial fibrillary acidic protein (GFAP) (Dako, Glostrup, Denmark), mouse antinestin (Rat-401) (Chemicon), and mouse anti-neuN (Chemicon).
The secondary antibodies used were the antimouse Alexa 488 and/or antirabbit Alexa 546. Hoechst 33342 dye (Invitrogen) (2 µg/mL final concentration) was incubated for 5 min at room temperature.
Images were acquired by using GE Healthcare’s IN Cell Analyzer 1000 System (GE Healthcare, Piscataway, NJ). The IN Cell Workstation v3.5 was used for automated analysis of cellular images. After the optimization of segmentation parameters, the number of Hoechst-positive cells was calculated as well as the number of GFAP and/or neuN or beta III tubulin-stained cells.
Cells were classified using the neuN intensity in the nuclei: cells with a neuN intensity greater than or equal to the threshold were classified as “neuN+” cells, whereas cells with a neuN intensity less than the threshold were classified as “neuN–” cells. The same procedure was followed to distinguish the cells based on beta III tubulin staining in the cytoplasm. With double staining, only the neuronal marker-negative cells were further filtered using GFAP intensity in the cytoplasm. All experiments were performed in duplicate, and 10 random areas were selected and analyzed for each well.
LOPAC1280™ screening
All the compounds of the LOPAC1280™ library were reformatted in 384-well plates and diluted to 50 µM in Tyrode’s buffer plus 2.5% DMSO (5× concentrated). All control wells were treated with DMSO at same concentration as assay wells.
Neural-differentiated mES reporter cells were seeded in triplicate at a concentration of 5000 cells/well 7 days before the test (conducted at day 14 of differentiation) in gelatin-coated 384-well plates. Prior to the test, all the samples were incubated in Tyrode’s buffer containing 10 µM coelenterazine for 4 h.
The LOPAC1280™ library was injected onto cell plates at 10 µM final concentration. After 5 min, the quisqualate compound was injected at 10 µM final concentration. The light release, expressed as RLU (relative luminescence units), was measured for a total of 350 s. The test was performed on the FLIPRTETRA® instrument in the luminescent mode.
Data analysis
For the bulk processing of data, an implemented version of Spotfire® Decision Site 9.1 was used. The analysis was performed using both an agonist and an antagonist screen approach, considering the maximum RLU values.
First, the Z′ values were calculated for both approaches, computing the means and the standard deviations of the control samples after removal of all the outlier points (defined as those with a modified |z-score| >3.5). The Z′ was computed as follows: Z′ = 1 − 3(s max − s min)/| x̄ max − x̄ min| where s max and s min are standard deviations of positive and negative controls, and x̄ max and x̄ min are means of positive and negative controls, respectively. Control samples were defined in agonist screen mode as “max” signals and “min” signals, which correspond respectively to 100 µM glutamate (n = 8) and Tyrode’s + 0.5% DMSO solution (n = 8). While in antagonist screen mode, “max” signals and “min” signals were, respectively, the following: Tyrode’s buffer (in first injection) plus 10 µM quisqualate (in second injection) (n = 8) and 100 µM JNJ16259685 (in first injection) plus 10 µM quisqualate (in second injection) (n = 8).
Then, the “percent activity mean” was calculated for the agonist screen approach (after triplicate outliers removal, defined as those with |z-score| >3.5), relative to the mean max signal (100 µM glutamate) for each plate corresponding to 100% activity, as well as the mean min signal (Tyrode’s DMSO 0.5% solution) for each plate corresponding to 0% activity, with the following formula: 100 * [(response value in first injection − x̄ min)/ x̄ max − x̄ min].
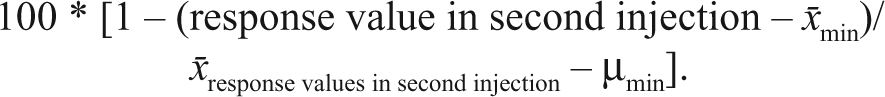
For the antagonist screen approach (after triplicate outliers removal, defined as those with |z-score| >3.5), the “percent inhibition mean” was computed relative to the mean compound responses for each plate corresponding to 0% inhibition (x̄ response values in second injection) and the mean min signal response (100 µM JNJ16259685 and 10 µM quisqualate) for each plate corresponding to 100% inhibition, with the following formula:
Active compounds in both approaches were defined as those samples that were 3 standard deviations above the mean percent activity or inhibition assuming that the values were normally distributed.
FM4-64 uptake protocol
Neurons differentiated from c-Photina® NPCs (day 14) were stimulated for 1 min with Krebs’-Ringer’s-HEPES (KRH) (in mM: 130 NaCl, 5 KCl, 1.2 MgSO4, 1.2 KH2PO4, 2 CaCl2, 6 glucose, and 25 HEPES/Na, pH 7.4) supplemented with 50 mM KCl, in the presence of 10 µM FM4-64 and 1 µM tetrodotoxin (TTX). After FM4-64 loading, neurons were washed 4 times for a total of 8 min with warmed KRH at 37 °C supplemented with 1 µM TTX and 10 µM CNQX (6-cyano-7-nitroquinoxaline-2,3-dione).
Video microscopy and image analysis
Specimens were observed with a Zeiss (Oberkochen, Germany) Axiovert 135 TV inverted microscope equipped with epifluorescence optics.
Multielectrode array (MEA)–based electrical recordings
Electrical recordings were performed in the neural culturing medium at 37 °C using the Multi-Channel System apparatus with the MEA60 200 Pt GND chip (Ayanda Biosystems SA, Lausanne, Switzerland). Data recorded at 25 kHz/ch from the 60 channels were then filtered from 200 Hz to 3 kHz, and spikes were sorted using a threshold algorithm. The threshold was defined as a multiple of the standard deviation of the biological noise computed during the first 100 ms of the recording (−7 × SD noise). Data were further analyzed with the Multi-Channel System software (MC_rack).
The cells were incubated with 1 µM TTX for 5 min, and then the toxin was washed out to study the recovery. The electrical activity was monitored for 180 s during and post TTX washout.
NBQX (2,3-dihydroxy-6-nitro-7-sulfamoyl-benzo[f]quinoxaline-2,3-dione) AMPA receptor inhibition was performed at the final concentration of 100 µM. The electrical activity was monitored for 250 s before and after NBQX addition.
Results
Neuronal differentiation
Different approaches have already been described to induce neural differentiation of mES cells through the serum-free KSR-supplemented medium. 16,17
We selected the monolayer-based method described in Fico et al.
14
and optimized it for HTS purposes. In the original protocol,
14
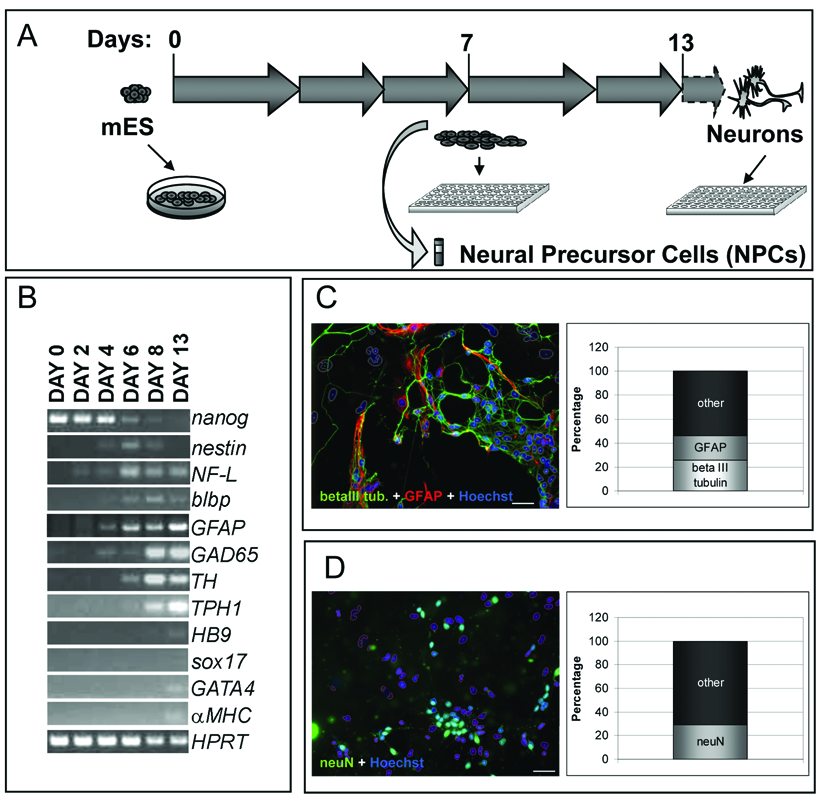
cells were not dissociated, and differentiation took place directly in the plates chosen for initial cell seeding. We first adapted the neural differentiation protocol to the 384-well plate format: neural cells were forming over time, but we observed marked well-to-well differences in the growth rate with a consequential variation in cellular composition and cell numbers at the end of the differentiation period. To overcome these limitations, we decided to introduce a replating step at day 7 of differentiation (
(
Furthermore, the pool of harvested cells can be frozen and thawed upon need at any time, acting similarly to a reagent for HTS (
c-Photina® mES cells were plated as described in Fico et al.
14
for 1 week and then dissociated and replated in gelatin-coated 384-well plates at 5000 cells/well. In this way, we observed the presence of cells showing a neural-like morphology. To confirm that those cells were indeed neural cells, we analyzed the expression of markers for undifferentiated and differentiated mES cells at various time points by RT-PCR (
The neuronal subtype composition of the differentiated neural cells and the presence of contaminant cells from different germ layers were checked by RT-PCR analysis. The results showed the expression of GABAergic (GAD65, glutamic acid decarboxylase 65), dopaminergic (TH, tyrosine hydroxylase), and serotoninergic markers (TPH1, tryptophan hydroxylase 1) and a small amount of the motoneuronal marker (HB9, homeobox gene 9), especially after 8 days of differentiation (see
To validate the method and the reproducibility of the results, we set up a quantification protocol using an immunofluorescence approach (
Differentiated cells were immunostained directly in 384 MTP format, with specific markers for neurons (beta III tubulin,
Screening of a library of pharmacologically active compounds
We have already shown that c-Photina® mES cells differentiated into neural cells were suitable for HTS purposes.
13
As proof of principle, we screened the neuronal differentiated and undifferentiated mES -reporter cells with an unbiased Library Of Pharmacologically Active Compounds (LOPAC1280™).
13
During this screen, we observed that both cell types were stimulated by several compounds capable of stimulating endogenous receptors/channels and induced Ca2+ flux. In particular, we detected a substantial presence of glutamate receptors.
13
To investigate which class of glutamate receptor was the most represented, we designed a compound master plate containing specific agonists for the different subclasses of glutamate receptors. Using this approach, we observed the predominant presence of group I metabotropic glutamate receptors (
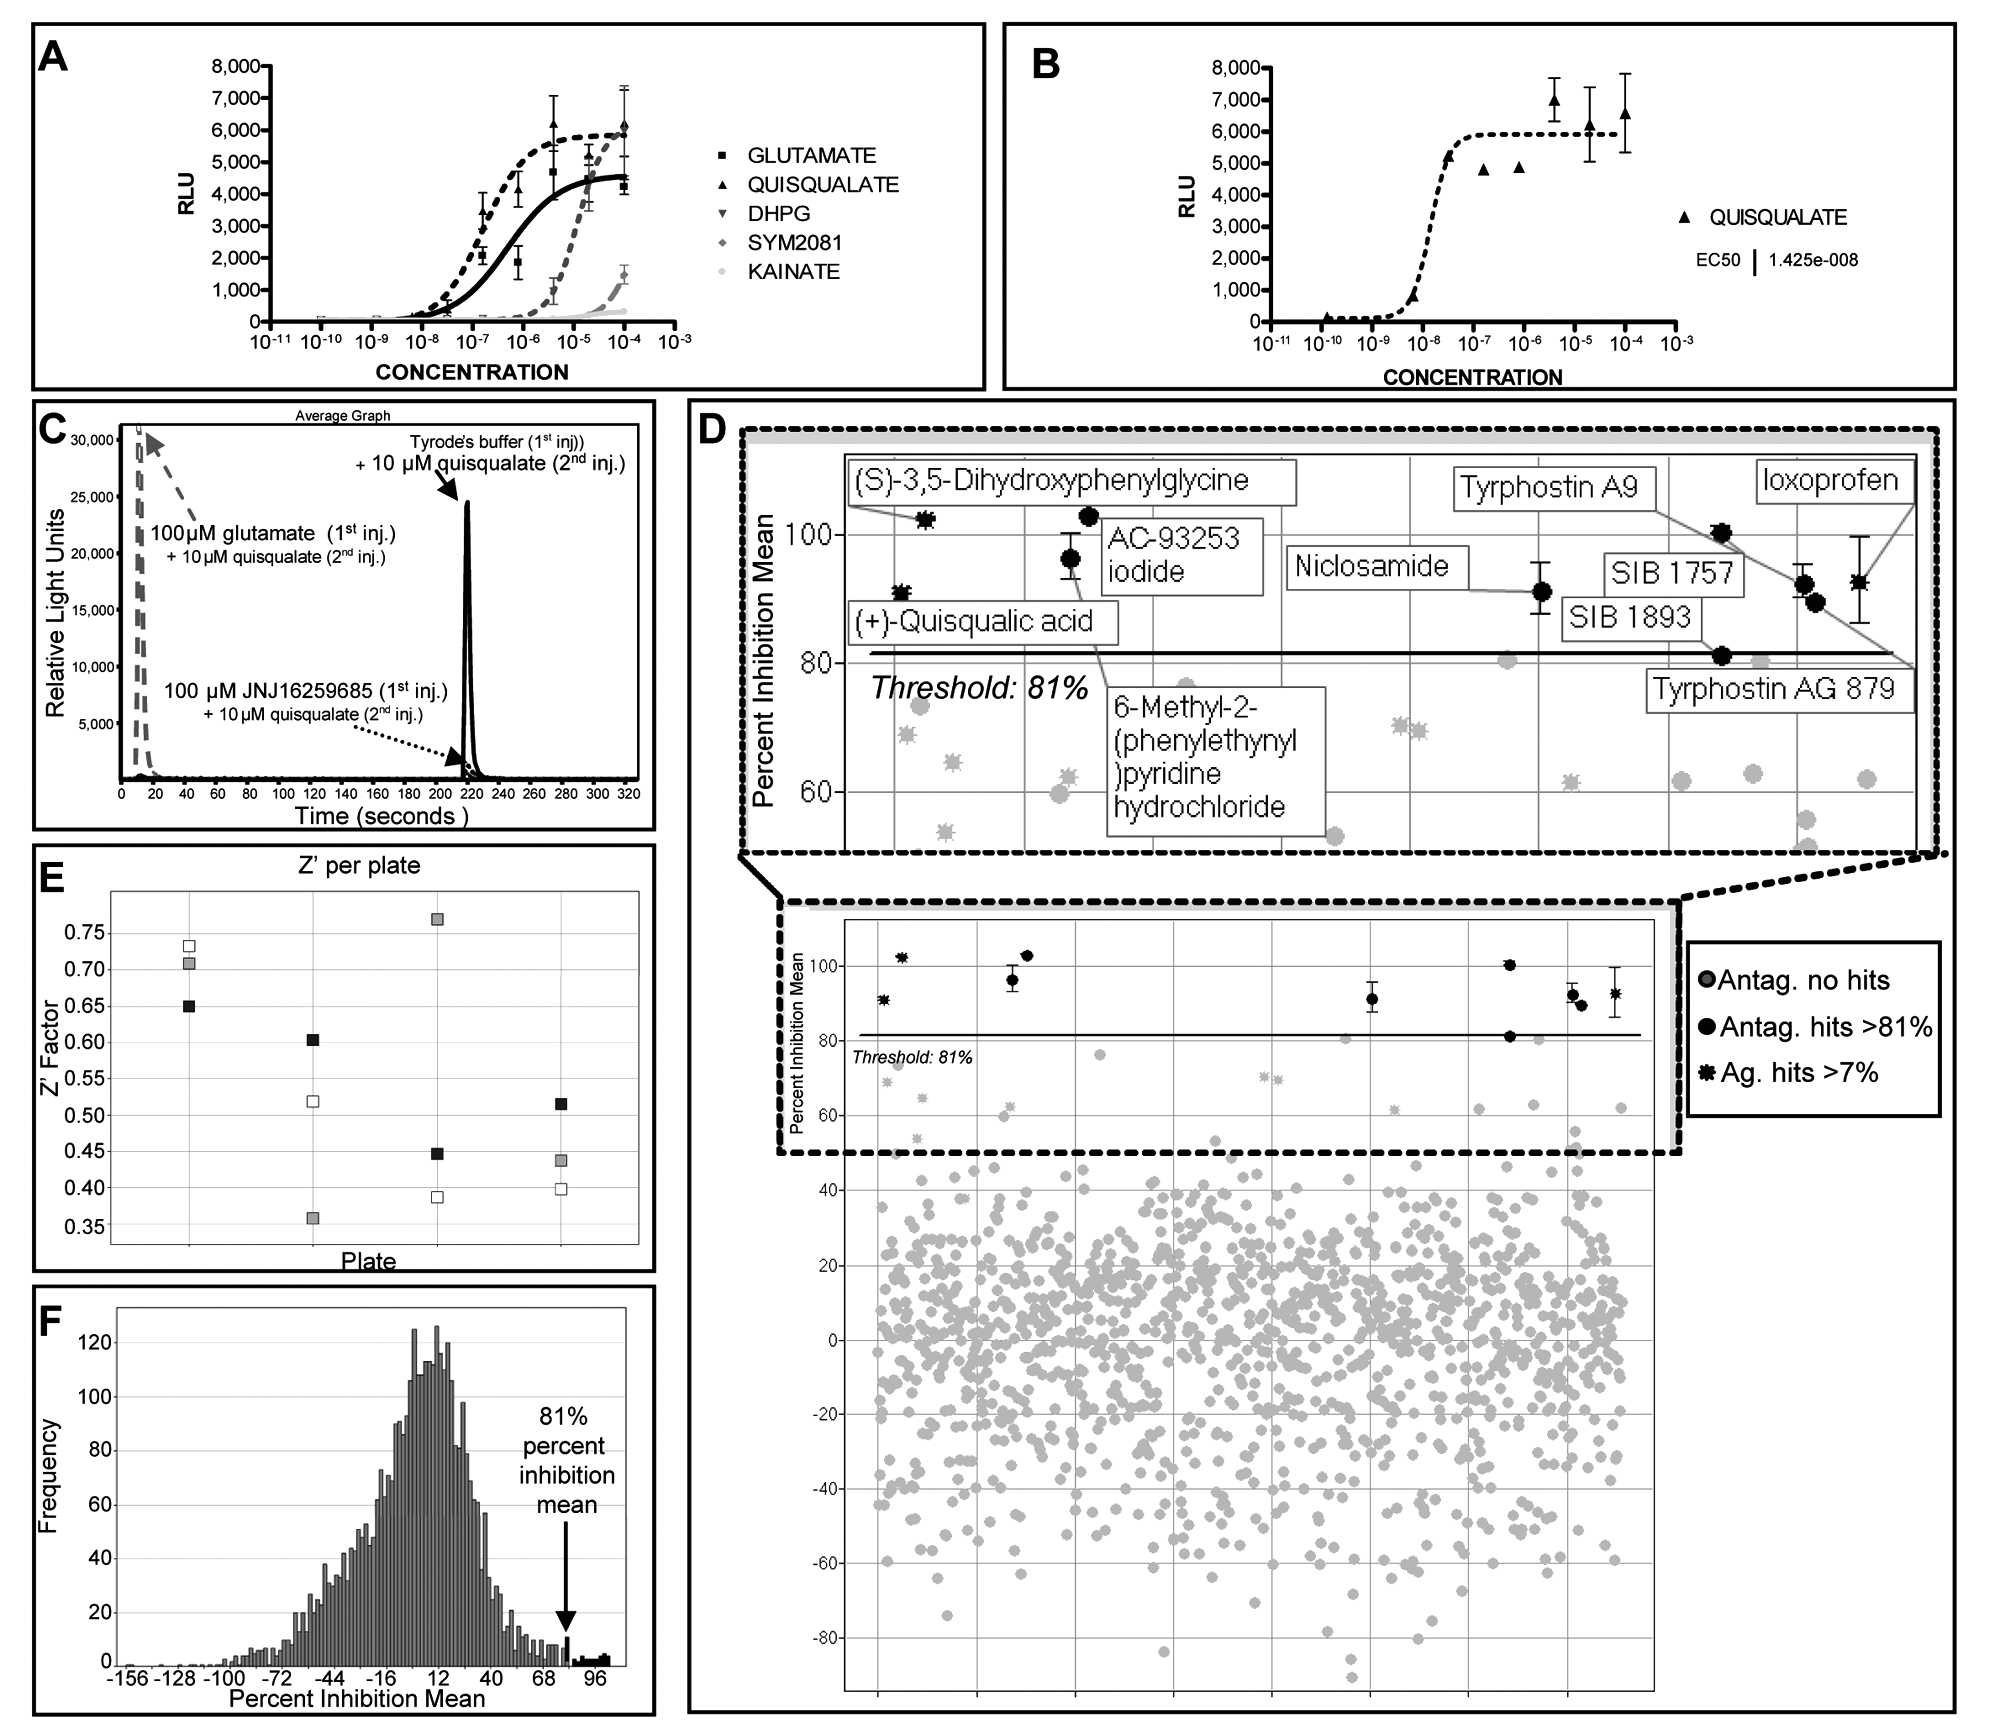
LOPAC1280™ screening of neural cells derived from c-Photina® mES cells at day 14 of differentiation. (
The Ca2+-mediated high luminescence response obtained after stimulation with quisqualate suggested the possibility of using this compound in an antagonist screen approach to look for mGluR inhibitors (
Notably, quisqualate activates both the mGluR1 and mGluR5 metabotropic receptors, both present in neural cells. From literature data, it was shown that the EC50 values of quisqualate for rat mGluR5 are 20 times lower than for rat mGluR1 (in µM range) when these receptors are transfected in Chinese hamster ovary (CHO) cells. 18 It is also known that there is a different expression pattern of these receptor subtypes in brain regions, with a predominant presence of mGlur5 receptors, for example, in rat cortex and hippocampus areas. 19
For the group I mGluR antagonist screen, we decided to use again the LOPAC1280™ library because it is a validation library containing compounds active on all the major pharmacological target classes, including group I mGluRs. The screen was performed in triplicate on c-Photina® mES cells, differentiated to neural cells, at day 14 of differentiation. We injected the cells first with the LOPAC1280™ library and after 5 min with quisqualate to look for group I mGluRs inhibitors. Data were analyzed for each addition, to study both the agonist and antagonist screen approaches.
Results are expressed as “percent activity” in agonist screen mode, with respect to 100 µM glutamate (100% activity) and Tyrode’s solution (0% activity) (see Materials and Methods). To determine the hit cutoff threshold for the agonist approach, the mean and the standard deviation of the percent activity of all samples tested were estimated to be −0.580 and 2.58, respectively. Hits were defined as those samples with a percent activity mean of the triplicates equal to 7% or greater (3 standard deviations above the percent activity mean;
The Ca2+-mediated signals obtained confirmed the presence of glutamate receptors together with purinergic and adrenergic receptors (
For the antagonist screen approach, the results are expressed as percent inhibition, with respect to the mean response per plate in the second injection of the tested samples stimulated with 10 µM quisqualate (0% inhibition) and the mean response per plate in the second injection of 100 µM JNJ16259685, a group I mGluR antagonist, plus 10 µM quisqualate (100% inhibition;
To determine the hit cutoff threshold for the quisqualate antagonist screen, the mean and the standard deviation of the percent inhibition for all samples tested were estimated to be −0.53 and 27.41, respectively. The hits were defined as those samples with a percent inhibition mean of the triplicates equal to 81% or greater (3 standard deviations above the percent inhibition mean;
The screening quality parameter Z′ was evaluated for every plate both in agonist and antagonist mode. An overview of the HTS performance in antagonist screen mode for Z′ is presented in
Of the 8 compounds scoring as putative quisqualate antagonists (in italics in
In the LOPAC1280™ library, 5 antagonists for group I metabotropic glutamate receptors are present: 3 specific for the mGluR5 and 2 for the mGluR1 subtypes. We found 3/3 antagonists for mGluR5 and none for mGluR1 (in bold in
The data obtained in both agonist and antagonist mode provide additional evidence for the robust and appropriate differentiation of the c-Photina® mES cells into neural cells and their suitability for HTS purposes.
c-Photina® neural precursor cells
To further characterize our differentiation protocol, we investigated if the cells frozen during the intermediate step of replating, named NPCs, could be used as a source of cells already neural committed and ready to use. These cells can be thawed directly in gelatin-coated 384-well plates, and the differentiation can be completed in this format.
First, we verified that the freeze-thaw procedure did not interfere with correct neural development. We compared the neural populations obtained from freshly differentiated mES reporter cells and from thawed c-Photina® NPCs using RT-PCR, immunofluorescence, and functional analysis. We measured Ca2+-mediated luminescence in a miniaturized screening format (384-well plate) after stimulation with compounds targeting receptors highly expressed in neural cells.
We demonstrated that c-Photina® NPCs retain the same characteristics as c-Photina® mES cells in terms of neural differentiation efficiency, following the presence of markers both at RNA (see RT-PCR expression panel in
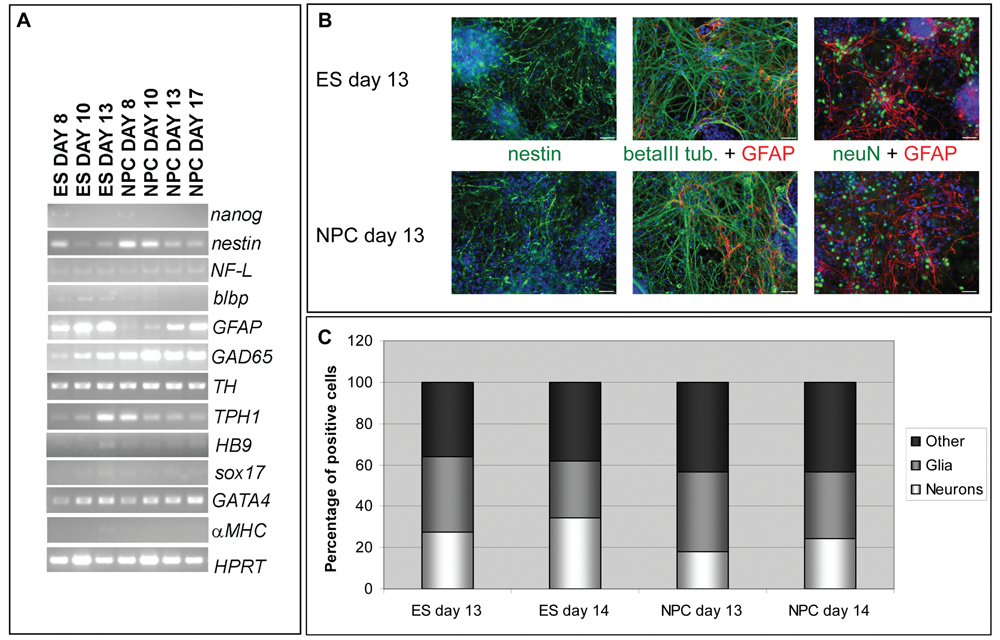
Comparison between neural cells differentiated directly from mES cells and from frozen neural precursor cells (NPCs) at different days of differentiation. (
We also performed comparative functional tests with compounds behaving as agonists for GPCRs and channels enriched in neural populations, such as glutamate receptors (
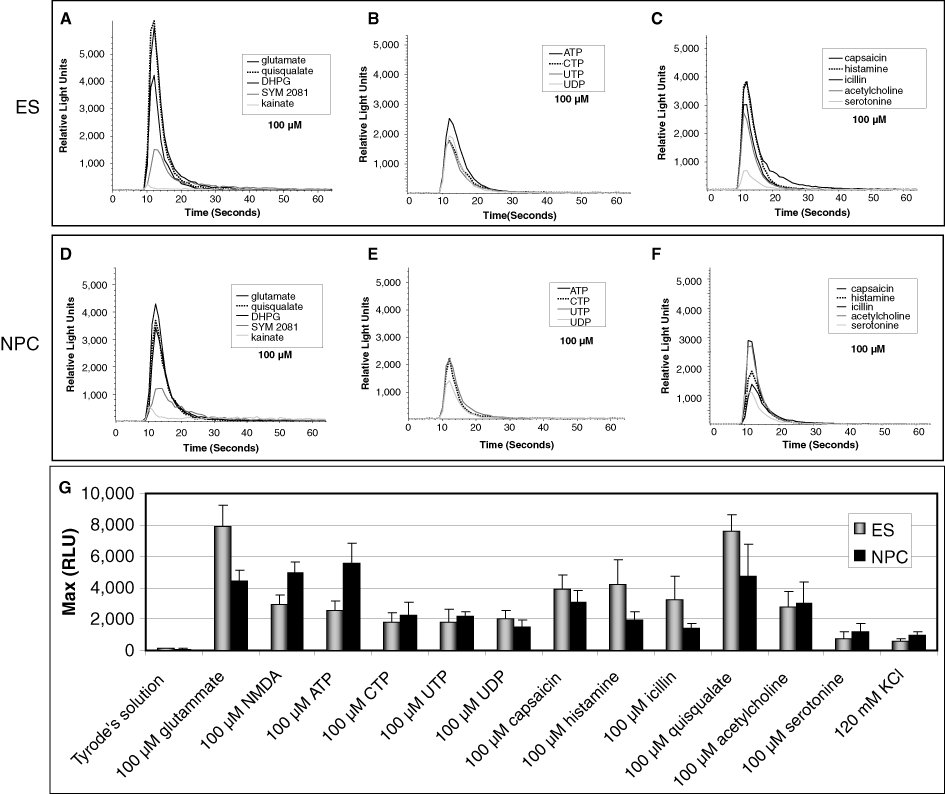
FLIPRTETRA® functional analysis of neural cells differentiated from mES cells and neural precursor cells (NPCs) at day 13 of differentiation. (
We also performed functional studies with the neural cells derived from c-Photina® NPCs at different days of differentiation using different agonists (
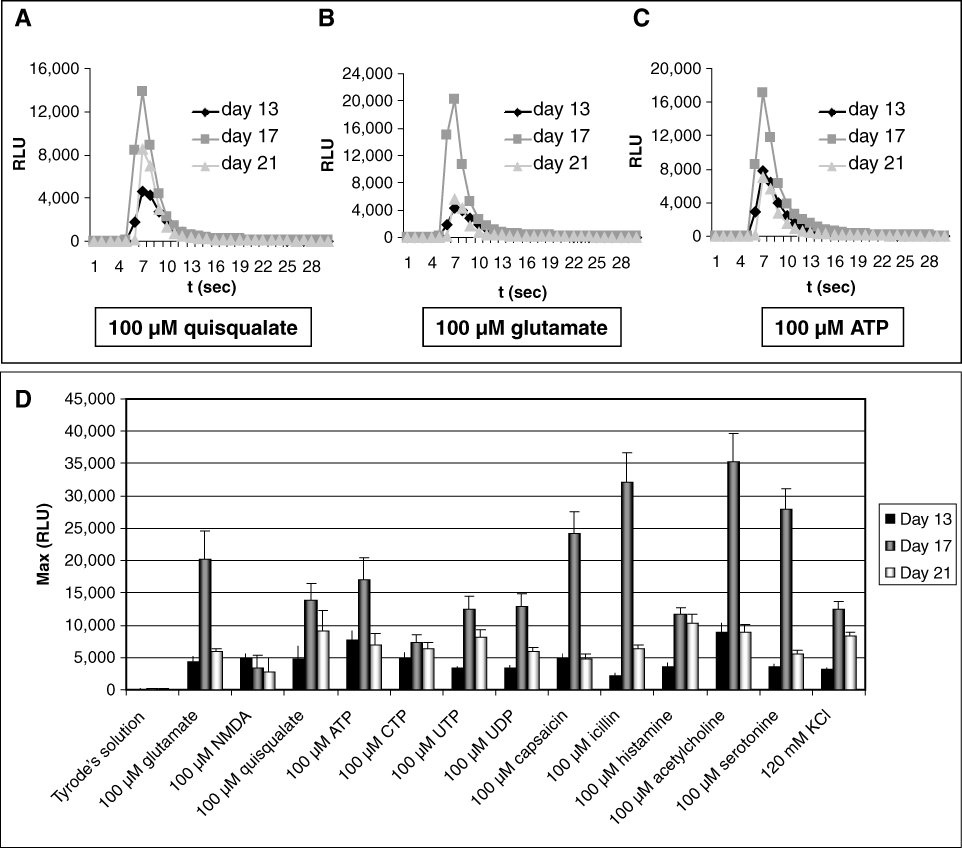
FLIPRTETRA® functional tests performed on neural cells derived from neural precursor cells (NPCs) at different days of differentiation. (
Neural cells derived from NPCs are able to form functional neuronal networks. We demonstrated that these cells are able to form active synapses by studying synaptic vesicle (SV) recycling using the fluorescent styryl dye FM4-64 (
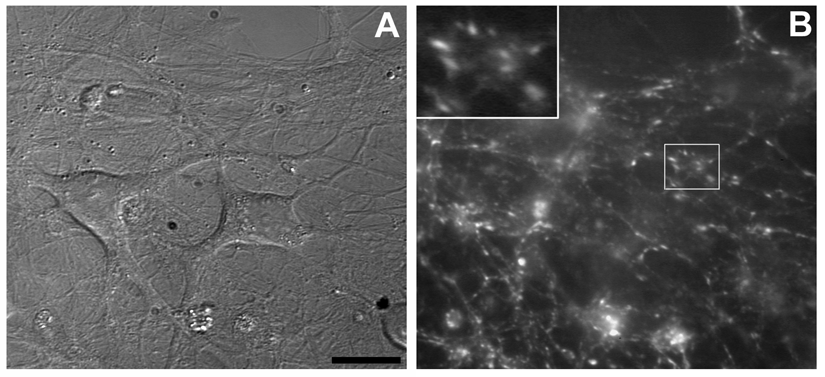
FM4-64 uptake test. (
We also succeeded in recording spontaneous action potentials using the MEA technology in neural cells derived from NPCs. The culture shows spontaneous activity from day 13 in a manner similar to primary cultures.
21
We seeded the NPCs on gelatin-coated MEA chips and enabled growth and differentiation for 1 to 2 weeks (
To further characterize the neural network of the NPC culture, we decided to investigate also the glutamatergic transmission. The experiment was performed at day 20 of differentiation using 100 µM NBQX (an AMPA glutamate receptor inhibitor;
Discussion
The neural cells differentiated from c-Photina® mES cells offer many possibilities for the generation of cell-based assays to measure Ca2+ mobilization through the activation of endogenous receptors. A set of validation studies described here demonstrates that the protocol we set up is suitable for miniaturized formats and gives robust results in terms of marker expression and percentage of neural cells. We demonstrated that the system is sensitive enough to be used in screening aimed to identify agonist as well as antagonist compounds for endogenously expressed receptor modulation. As proof of principle, we screened neural cells derived from mES cells in agonist and antagonist mode (with quisqualate as the activator compound) with the LOPAC1280™ library.
Furthermore, we developed a method that allows the preparation of a frozen bulk of cells (neural precursor cells) already committed to neural lineage and ready to use in miniaturized format after only 1 week postthawing. We demonstrated that the neural cells obtained from the frozen c-Photina® NPCs are able to form mature neural structures, which express all the markers of neural cells directly derived from c-Photina® mES cells and are able to respond to the same stimuli with similar pharmacology.
Ca2+ signals govern important processes in neurons, including neurotransmitter release, membrane excitability, neurite outgrowth, and neurodegeneration. 22,23 The cytosolic Ca2+ concentration ([Ca2+]c) increases upon activation of plasma membrane Ca2+ channels or Ca2+ release from intracellular stores. 23 To detect Ca2+ concentration changes, we introduced a Ca2+-activated photoprotein reporter system into a complex endogenous neuronal network, which allows the accurate monitoring of Ca2+ fluxes. The presence of a Ca2+ sensor in a complex physiological environment could be very interesting from an HTS perspective.
We set up a robust differentiation protocol that allows the formation of a complex neural network containing different neuronal cell populations, with special attention to potential screening applications. For example, the idea of generating bulk cells at a precommitted neural stage allowed us to use cells as reagents that can be frozen and are ready to use when needed. This approach can consistently reduce the cell culturing time from plating to use, decreasing the problems of variability, in terms of cell numbers and cell type, and of reproducibility.
We also monitored the presence of different indicators of neural differentiation not only by RT-PCR and immunofluorescence analysis but also by functional tests. We observed that for some receptors, it is possible to perform functional tests in a time window of 1 week. This result is very important because it suggests the possibility of using the neural-differentiated cells over different days even though we suggest carefully investigating this parameter for each selected target.
The choice of the best differentiation time window for performing the functional test is not trivial, and several factors must be considered. In fact, the expression level of the selected target (receptor/channel) might not be stable in the chosen temporal window or could vary in terms of subunit compositions during differentiation, and this could significantly alter the pharmacological behavior.
We previously reported 13 that on day 13 of differentiation, the populations of neural-differentiated c-Photina® cells behave more like prenatal and early postnatal neurons rather than adult neurons. This kind of neuronal behavior is typical of the early CNS development stage (reviewed in Li and Xu 24 ). Furthermore, the electrophysiological analysis of neurons derived from c-Photina® NPCs reveals that the spontaneous action potentials shown at day 13 were sporadic and of smaller amplitude compared with the one shown by neurons at days 17 and 20 of differentiation. At these latter time points, we observed spontaneous network bursts with spikes more frequent and more clustered, with higher amplitude and more organized in space compared to day 13, behavior that resembles adult neuronal networks. In addition, the incomplete block of excitatory activity by NBQX at day 13 provides evidence of a maturation trend of neuronal network activity from day 13 to day 21.
Even if the cell maturation continues over time, we elected days 13 and 14 of differentiation as optimal for our tests based on several considerations. First, the quisqualate signal was steady in that temporal window. Second, the choice of those days allows a reduction of time from cell plating to screening with a consequential reduction in cell number variability mainly due to proliferation of other cells such as glia and cells from other germ layers over time. These results demonstrated that the model is adaptable to screening purposes.
The high quality of the obtained neural networks was demonstrated not only by the expression of neural markers but also by the ability to respond to endogenous stimuli to form active synapses and to generate action potentials. The electrophysiological data also demonstrate that the neural network formed contains a significant proportion of excitatory glutamate-induced electrophysiological activity. The more homogeneous results and the reduction of differentiation time make this frozen batch of cells enriched in neural precursors a powerful tool for HTS purposes.
Footnotes
Acknowledgements
The authors thank Cinzia Nucci, Angela Molteni, and Alessandro Taddei (Axxam S.p.A.); Miriam Ascagni (ALEMBIC, San Raffaele Scientific Institute, DIBIT); Emilia Biffi and Giancarlo Ferrigno (Politecnico di Milano, NearLab, Italy); Cinzia Ferri and Lawrence Wrabetz (San Raffaele Scientific Institute, DIBIT, Division of Genetics and Cell Biology, Milan, Italy); and Stefania Filosa and Genesia Manganelli (Stem Cell Fate Lab, Institute of Genetics and Biophysics “Adriano Buzzati Traverso,” CNR, Naples, Italy).
References
Supplementary Material
Please find the following supplemental material available below.
For Open Access articles published under a Creative Commons License, all supplemental material carries the same license as the article it is associated with.
For non-Open Access articles published, all supplemental material carries a non-exclusive license, and permission requests for re-use of supplemental material or any part of supplemental material shall be sent directly to the copyright owner as specified in the copyright notice associated with the article.