
Abstract
The degree of supercoiling of DNA is vital for cellular processes, such as replication and transcription. DNA topology is controlled by the action of DNA topoisomerase enzymes. Topoisomerases, because of their importance in cellular replication, are the targets of several anticancer and antibacterial drugs. In the search for new drugs targeting topoisomerases, a biochemical assay compatible with automated high-throughput screening (HTS) would be valuable. Gel electrophoresis is the standard method for measuring changes in the extent of supercoiling of plasmid DNA when acted upon by topoisomerases, but this is a low-throughput and laborious method. A medium-throughput method was described previously that quantitatively distinguishes relaxed and supercoiled plasmids by the difference in their abilities to form triplex structures with an immobilized oligonucleotide. In this article, the authors describe a homogeneous supercoiling assay based on triplex formation in which the oligonucleotide strand is labeled with a fluorescent dye and the readout is fluorescence anisotropy. The new assay requires no immobilization, filtration, or plate washing steps and is therefore well suited to HTS for inhibitors of topoisomerases. The utility of this assay is demonstrated with relaxation of supercoiled plasmid by Escherichia coli topoisomerase I, supercoiling of relaxed plasmid by E. coli DNA gyrase, and inhibition of gyrase by fluoroquinolones and nalidixic acid.
Introduction
W
Topoisomerases are important drug targets because of their importance for DNA-dependent functions of the cell, particularly replication. Topoisomerases are classified as type I or II, depending on whether they catalyze reactions involving the transient breakage of one or both strands of DNA, respectively. The type II topoisomerase, DNA gyrase, introduces negative supercoils into bacterial DNA at the expense of adenosine triphosphate (ATP) hydrolysis and is the target of the fluoroquinolone class of antibacterial drugs. 4,5 Cancer chemotherapy drugs, such as camptothecins 6 and epipodophyllotoxins, 7 target topoisomerases as well. Assay formats supporting high-throughput screening (HTS) for topoisomerase inhibitors are highly desirable to facilitate discovery of new drug molecules that target these enzymes.
The standard method for measuring changes in the topology of DNA caused by topoisomerases is to separate topoisomers by agarose gel electrophoresis, stain the gel for DNA using a fluorescent DNA dye such as ethidium bromide, and quantify the intensity of fluorescence of the various topoisomer bands. 8 This assay method is low throughput, time-consuming, labor intensive, and therefore impractical for use in automated HTS of large compound libraries containing hundreds of thousands of samples for new topoisomerase inhibitors. For a typical single-point screen of about 1,000,000 samples, it would be necessary to load, run, stain, destain, photograph, and manually integrate the bands on 25,000 forty-well agarose gels of the size needed to obtain sufficient resolution of topoisomers. Another assay method, not based on gel electrophoresis, makes use of the differential in binding of ethidium bromide or PicoGreen to supercoiled DNA compared to relaxed DNA. 9,10 This is a high-throughput assay format, albeit with the significant limitations of low signal/background and less than 2-fold fluorescence differential between relaxed and supercoiled DNA. A cell-based approach to screening for inhibitors of topoisomerases makes use of a reporter gene under the control of a topology-sensitive promoter. 11 The disadvantage of cell-based assays is that a test compound may by insufficiently permeable to enter the cell or may have cellular effects other than the one of interest that complicate interpretation of the results. Maxwell et al. 12 described a DNA supercoiling assay in which an immobilized oligonucleotide bound to double-stranded supercoiled plasmid through triplex formation 13 but not to relaxed plasmid. The unbound DNA was removed using several washing steps, and the amount of bound DNA was quantified by a DNA-dependent fluorescent dye or by binding of a radiolabeled oligonucleotide. The need for a plate-washing step limits the throughput of this assay.
Here we describe a fluorescence anisotropy-based version of the triplex-forming assay in a mix-and-read format that eliminates the immobilization of the oligonucleotide to a surface and the washing step (
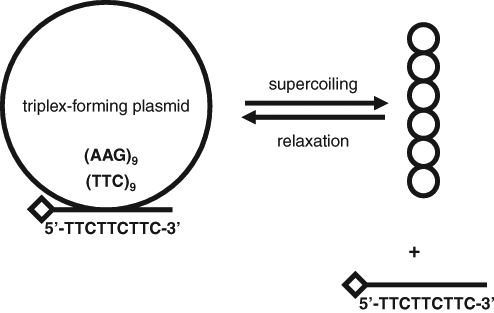
One possible principle of the fluorescence anisotropy-based supercoiling assay. The plasmid contains a triplex-forming sequence, in this case 9 repeats of TTC and its complement on the opposite DNA strand. The topologically relaxed plasmid binds a short, single-stranded oligonucleotide DNA containing the triplex-forming sequence TTCTTCTTC and labeled with a fluorescent dye (diamond). In contrast, the supercoiled plasmid does not bind the oligonucleotide. The fluorescence anisotropy of the fluorescent dye is higher in the presence of relaxed plasmid than the supercoiled plasmid because of the lower mobility of the bound oligonucleotide than the free oligonucleotide. The conditions favoring the differential triplex formation of the oligonucleotide with relaxed and supercoiled plasmid are pH 3.5 and minimal concentration of Mg2+. The plasmid and oligonucleotide are not drawn to scale.
Materials and Methods
Preparation of fluorescent oligonucleotide
Single-stranded, fluorescently labeled, triplex-forming DNA oligonucleotides were synthesized by Trilink Biotechnologies (San Diego, CA). BODIPY-FL or BODIPY-TMR (Invitrogen, Carlsbad, CA) was attached at the 5′-end with a 6-carbon linker. Oligonucleotide sequences are given in the table and figure legends.
Construction of plasmid for triplex formation
Oligonucleotides containing the triplex-forming sequence were purchased from Eurofins MWG Operon (Huntsville, AL) and are as follows:
5′-GAAGAAGAAGAAGAAGAAGAAGAAGAAA-3′
5′-TTCTTCTTCTTCTTCTTCTTCTTCTTCA-3′
The triplex-forming plasmid was constructed by annealing the oligonucleotides and cloning into pCR4-TOPO by TA cloning (Invitrogen). Plasmid DNA was isolated from Escherichia coli DH5α by a modified alkaline lysis method. 14 The plasmid contains 3983 base pairs, for an approximate molecular weight of 2,600,000.
Preparation of relaxed plasmid
Supercoiled triplex-forming plasmid used in some experiments was purified with a Gigaprep kit (Qiagen, Valencia, CA) and relaxed using vaccina virus topoisomerase 1 (Sigma-Aldrich, St. Louis, MO). The relaxation reaction contained 0.25 mg/mL of plasmid and 0.86 U/mL topoisomerase 1 in a solution containing 39 mM Tris-HCl (pH 7.5), 42-mM NaCl, 4.3% glycerol, 0.31-mM EDTA, 2.5 mM MgCl2, 86-µM dithiothreitol, and 0.0086% Triton X-100 detergent. The mixture was incubated at 30°C for 2 h. The relaxed plasmid was purified by ethanol precipitation and resuspended in buffer consisting of 10 mM Tris-HCl (pH 7.5) and 1-mM EDTA.
Relaxation of high-purity, supercoiled triplex-forming plasmid prepared by Nature Technologies (Lincoln, NE) with E. coli TopA was performed as follows: highly purified plasmid at 2 mg/mL was combined with 60-nM E. coli TopA in a buffer consisting of 20-mM Tris-HCl (pH 8), 50-mM potassium acetate, 10-mM magnesium acetate, 2-mM dithiothreitol, and 100-µg/mL bovine serum albumin and incubated at 38°C for 2 h. Because the TopA becomes inactivated during this procedure, repurification of the resulting fully relaxed plasmid was not necessary.
Plasmid prepared by each method behaved similarly. The method of preparation of plasmid used in each experiment is given in the figure legends.
Cloning and expression of E. coli TopA
The topA gene for topoisomerase 1 was cloned from chromosomal DNA of wild-type E. coli strain MG1655 using the polymerase chain reaction (PCR). Amplification was performed using High Fidelity PCR Master (Roche Applied Science, Indianapolis, IN) and the following primers:
5′-GACGACGACAAGATGGGTAAAGCTCTTGTCATCG-3′
5′-GAGGAGAAGCCCGGTTTATTTTTTTCCTTCAACCC-3′
The PCR product was purified using the QuickStep 2 PCR Purification Kit (EDGE Biosystems, Gaithersburg, MD). The resulting fragment was then annealed to expression vector pET46 EK/LIC according to the manufacturer’s protocol (EMD Chemicals, San Diego, CA), producing the plasmid pET46-topA. DNA sequence of the cloned topA was confirmed by sequencing on an ABI PRISM 3100 DNA sequencer (Applied Biosystems, Foster City, CA) using Big Dye Terminator Cycle Sequencing Kit (Applied Biosystems). Computer analysis of DNA sequences was performed with Sequencher (Gene Codes Corp., Ann Arbor, MI). For protein overproduction, the plasmid was transformed into HMS174(DE3) (EMD Chemicals) and plated on LB medium containing 100 µg/mL of ampicillin at 37°C overnight. A single colony of HMS174(DE3)/pET46-topA was inoculated into a 70-mL culture of LB medium containing 100 µg/mL of ampicillin and grown overnight at 30°C. Samples (6 × 10 mL) of the overnight culture were added to 6 × 1 liter of LB medium containing 100 µg/mL of ampicillin and grown at 30°C with aeration to mid-logarithmic phase (OD600 = 0.5). Isopropyl-β-
Purification of TopA
Frozen cell paste from 3 liters of culture was resuspended in 100 mL of lysis buffer consisting of 25-mM Tris-HCl (pH 8.0), 0.3 M NaCl, 5% (v/v) glycerol, and 2 EDTA-free protease inhibitor cocktail tablets (Roche Applied Science). The cells were disrupted twice at 4°C by French Press at 18,000 psi. The crude extract was centrifuged at 150,000 g for 30 min at 4°C. The supernatant was applied at a flow rate of 2 mL/min onto a 5-mL HiTrap Ni2+ chelating column (GE Healthcare, Piscataway, NJ) preequilibrated with buffer A (25 mM Tris-HCl [pH 8.0], 0.3 M NaCl, 5% [v/v] glycerol). The column was then washed with buffer A, and the protein was eluted by a linear gradient from 0- to 0.5-M imidazole in buffer A. Fractions containing TopA were pooled and dialyzed against 2 liters of buffer B (25-mM Tris-HCl [pH 8.0], 1 mM EDTA, 1-mM dithiothreitol, 5% [v/v] glycerol) overnight at 4°C. The dialyzed sample was applied at a flow rate of 2 mL/min onto a 20-mL Q-Sepharose (HR16/10) column (GE Healthcare) preequilibrated with buffer B. After the column was washed with 100-mL of buffer B, the protein was eluted by a linear gradient from 0- to 1-M NaCl in buffer B. The fractions containing TopA were pooled and dialyzed against 1 liter of storage buffer (25-mM Tris-HCl [pH 7.5], 1-mM EDTA, 150-mM NaCl, 1-mM dithiothreitol, 20% [v/v] glycerol) overnight at 4°C. The protein was stored at −80°C.
Cloning and expression of GyrA and GyrB
The expression vectors for the E. coli GyrA and GyrB subunits were as described in Hallett et al. 15
For production of GyrB protein, the plasmid was transformed into E. coli BL21(DE3). Ten liters of LB medium containing 50 µg/mL of ampicillin in shake flasks were inoculated at an optical density of 0.1, induced after 3 h at 30°C with 0.5 mM of IPTG at an optical density of 0.53, and harvested by centrifugation at an optical density of 3.4. Cell paste was stored at −20°C. Essentially the same procedure was used for expression of GyrA protein.
Purification of E. coli GyrA subunit
Frozen cell paste from 3 liters of culture was resuspended in 60 mL of lysis buffer consisting of 50-mM Tris-HCl (pH 7.5), 1-mM EDTA, 5-mM dithiothreitol, 10% (v/v) glycerol, 25-mM NaCl, 1-mM phenylmethylsulfonyl fluoride, and 2 protease inhibitor cocktail tablets (Roche Applied Science). The cells were disrupted using a French Press at 18,000 psi twice at 4°C, and the crude extract was centrifuged at 130,000 g for 30 min at 4°C. The supernatant was loaded at a flow rate of 1.5 mL/min onto a 20-mL Q-Sepharose HP (HR16/10) column (GE Healthcare) preequilibrated with buffer C (50-mM Tris-HCl [pH 7.5], 1-mM EDTA, 5-mM dithiothreitol, 10% [v/v] glycerol, and 25-mM NaCl). The column was then washed with buffer C, and the protein was eluted by a linear gradient from 25-mM to 1-M NaCl in buffer C. Fractions containing GyrA were pooled and dialyzed against 1 liter of buffer C overnight at 4°C. The dialyzed sample was loaded at a flow rate of 1.5 mL/min onto a 20-mL Heparin Sepharose CL-6B (HR16/10) column (GE Healthcare) preequilibrated with buffer C. After the column was washed with 100-mL of buffer C, the protein was eluted by a linear gradient from 25-mM to 1-M NaCl in buffer C. The fractions containing GyrA were pooled, and solid (NH4)2SO4 (0.4 g/mL) was added to precipitate all the proteins and mixed on ice for 1 h. The sample was centrifuged at 19,500 g for 30 min at 4°C. The pellet was then dissolved in 5 mL of buffer C. The 5-ml sample was applied at a flow rate of 1-mL/min to a 320-mL Sephacryl S-200 (HR 26/60) column (GE Healthcare) preequilibrated with buffer D (50 mM Tris-HCl [pH 7.5], 1-mM EDTA, 5-mM dithiothreitol, 10% [v/v] glycerol, and 150-mM NaCl). The fractions containing GyrA were pooled and dialyzed against 1 liter of storage buffer (50-mM Tris-HCl [pH 7.5], 1-mM EDTA, 100-mM KCl, 2-mM dithiothreitol, 20% [v/v] glycerol) overnight at 4°C and stored at −80°C.
Purification of E. coli GyrB subunit
Frozen cell paste from 10 liters of culture was resuspended in 200 mL of lysis buffer consisting of 25-mM Tris-HCl (pH 7.5), 1-mM EDTA, 2-mM dithiothreitol, 5% (v/v) glycerol, 250-mM NaCl, 20-mM spermidine, and 4 protease inhibitor tablets (Roche Applied Science). The cells were disrupted using a French Press at 18,000 psi twice at 4°C, and the crude extract was centrifuged at 130,000 g for 30 min at 4°C. To the supernatant was added 0.35 g/mL of solid (NH4)2SO4 to precipitate the protein. After stirring for 30 min at 4°C, the sample was centrifuged at 100,000 g for 30 min at 4°C. The pellet was dissolved in buffer E (25-mM Tris-HCl [pH 7.5], 1-mM EDTA, 2-mM dithiothreitol, and 5% [v/v] glycerol) and dialyzed overnight against 2 liters of buffer C at 4°C with 1 change of dialysis buffer. The sample was loaded onto a 60-mL Q-Sepharose HP (XK 26/20) column (GE Healthcare) equilibrated with buffer E at a flow rate of 3-mL/min. The column was washed with 5 column volumes of buffer E, then eluted with a 600-mL linear gradient from 0- to 1-M NaCl in buffer E. Fractions containing GyrB were pooled and dialyzed against 2 liters of buffer E at 4°C overnight. The sample was applied at a flow rate of 2.5 mL/min onto a 50-ml Heparin Sepharose Fast Flow (XK 26/20) column (GE Healthcare) equilibrated with buffer E. The column was washed with buffer E and then eluted with a 400-mL linear gradient from 0 to 1 M NaCl in buffer E. Solid (NH4)2SO4 was added to 0.4 mg/mL to the pooled GyrB sample and mixed on ice for 1 h. The sample was centrifuged at 19,500 g at 4°C for 30 min. The pellet was dissolved in 10 mL of buffer E and applied at a flow rate of 1.5 mL/min to a 320-ml Sephacryl S-200 (HR 26/60) column (GE Healthcare) equilibrated with buffer E plus 150 mM NaCl. Later fractions containing GyrB were pooled and dialyzed against 2 liters of buffer E at 4°C overnight. The sample was applied to a 20-mL Q-Sepharose (HR 26/10) column (GE Healthcare) equilibrated with buffer E. After washing with buffer E, the column was eluted with a linear gradient of 0- to 1-M NaCl in buffer E. Fractions containing GyrB were pooled, dialyzed against 1 liter of storage buffer (50-mM Tris-HCl [pH 7.5], 1-mM EDTA, 150-mM NaCl, 2-mM dithiothreitol, and 20% [v/v] glycerol), and stored at −80°C.
Reconstitution of E. coli gyrase
E. coli gyrase tetramer was reconstituted by mixing 1 µM of each purified subunit in buffer consisting of 50 mM Tris-HCl (pH 7.5), 100-mM KCl, 2-mM dithiothreitol, 1-mM EDTA, and 20% (v/v) glycerol.
Measurement of fluorescence anisotropy
Fluorescence anisotropy measurements were performed in untreated, 384-well, black, polystyrene assay plates using a Tecan Ultra plate reader (Tecan US, Inc., Durham, NC) equipped with a vertically polarized 485-nm excitation filter and vertically and horizontally polarized 535-nm emission filters, unless otherwise stated. The G-factor was set to the default value 1.0. The effect of an inaccurate G-value, which corrects for differences in the sensitivity of detection of horizontally and vertically polarized light, is to shift anisotropy measurements to higher or lower values, but this has no effect on the anisotropy difference between supercoiled and relaxed plasmids.
Z′ measurement
The Z′ for the supercoiling assay was measured using the ATP-dependent supercoiling reaction of E. coli gyrase with relaxed pJT519 plasmid. Low-volume, black, 384-well, polystyrene plates with untreated surfaces were used. The assay buffer consisted of 35-mM Tris-HCl (pH 7.6), 24-mM KCl, 1-mM dithiothreitol, 4-mM MgCl2, 1.8-mM spermidine, 0.2-µM bovine serum albumin, 5% (v/v) glycerol, and 0.002% Brij-35 detergent. First, 2-µL of assay buffer (MAX wells) or 25 µM ciprofloxacin (MIN wells) was added, each to half the wells on the plate. Second, 5 µL of 0.6 mM ATP in assay buffer was added. Third, the reactions were initiated by the addition of 5 µL of 12-nM E. coli gyrase and 0.17-mg/mL pJT519 plasmid. The reactions were quenched after 20 min with 5-µL of triplex-forming buffer containing 150-mM sodium acetate (pH 3.5), 150 mM NaCl, and 30-nM 5′-BODIPY-TMR-TTCTTCTTCT oligonucleotide. The fluorescence anisotropy was measured after 1 h. Z′ was calculated using the following formula:

MAX and MIN are the uninhibited and fully inhibited reactions, respectively.
Inhibitors
Ciprofloxacin was from MP Biomedicals (Santa Ana, CA). Ofloxacin, enrofloxacin, sparfloxacin, levofloxacin, lomefloxacin, and nalidixic acid were from Sigma-Aldrich.
Results
Optimization of conditions for differentiation of relaxed and supercoiled plasmid by fluorescence anisotropy
The assay described in this article makes use of the difference between the fluorescence anisotropies of a 5′-BODIPY-FL-labeled triplex-forming oligonucleotide when combined with relaxed or supercoiled plasmid containing the same triplex-forming sequence at acidic pH. The particular triplex-forming sequence we use is (TTC)n. For the plasmid DNA, n = 9. The optimal conditions of Mg2+ concentration and pH for differentiation between relaxed and supercoiled plasmid, as measured by the difference in fluorescence anisotropy, were explored using the oligonucleotide 5′-BODIPY-FL-TTCTTCTTC (
Optimization of pH for Detection of Maximal Fluorescence Anisotropy Difference between Relaxed and Supercoiled Triplex-Forming Plasmid
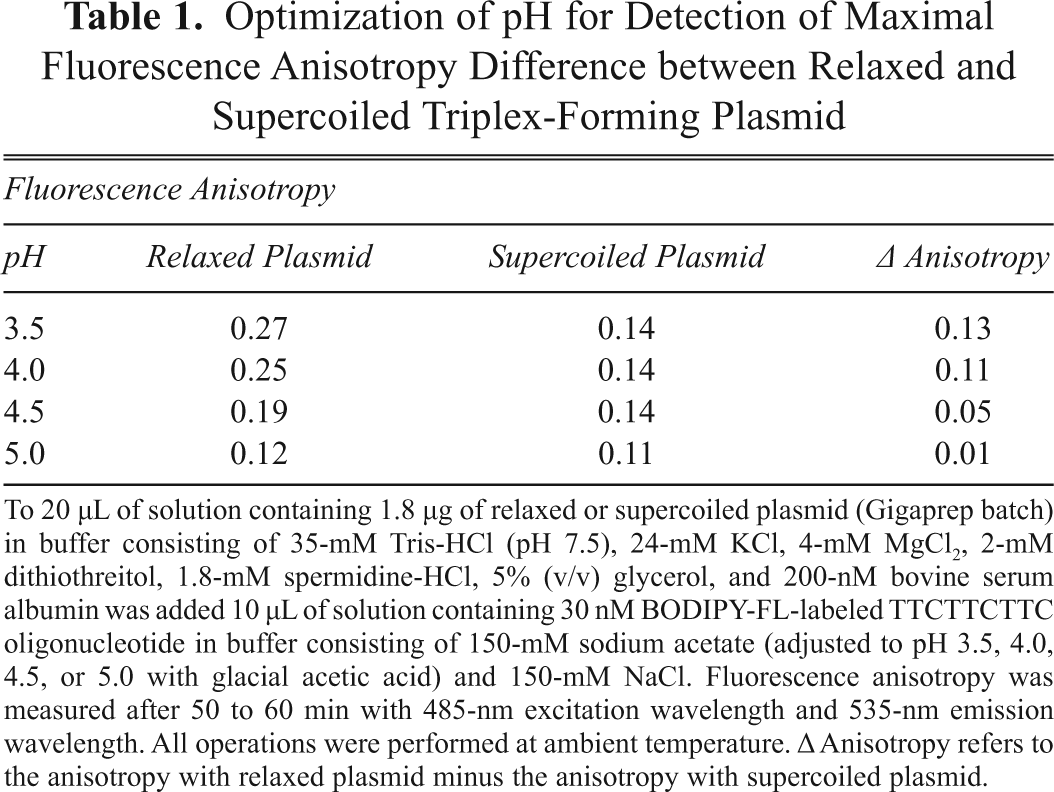
To 20 µL of solution containing 1.8 µg of relaxed or supercoiled plasmid (Gigaprep batch) in buffer consisting of 35-mM Tris-HCl (pH 7.5), 24-mM KCl, 4-mM MgCl2, 2-mM dithiothreitol, 1.8-mM spermidine-HCl, 5% (v/v) glycerol, and 200-nM bovine serum albumin was added 10 µL of solution containing 30 nM BODIPY-FL-labeled TTCTTCTTC oligonucleotide in buffer consisting of 150-mM sodium acetate (adjusted to pH 3.5, 4.0, 4.5, or 5.0 with glacial acetic acid) and 150-mM NaCl. Fluorescence anisotropy was measured after 50 to 60 min with 485-nm excitation wavelength and 535-nm emission wavelength. All operations were performed at ambient temperature. Δ Anisotropy refers to the anisotropy with relaxed plasmid minus the anisotropy with supercoiled plasmid.
Optimization of Mg2+ Concentration for Detection of Maximal Fluorescence Anisotropy Difference between Relaxed and Supercoiled Triplex-Forming Plasmid
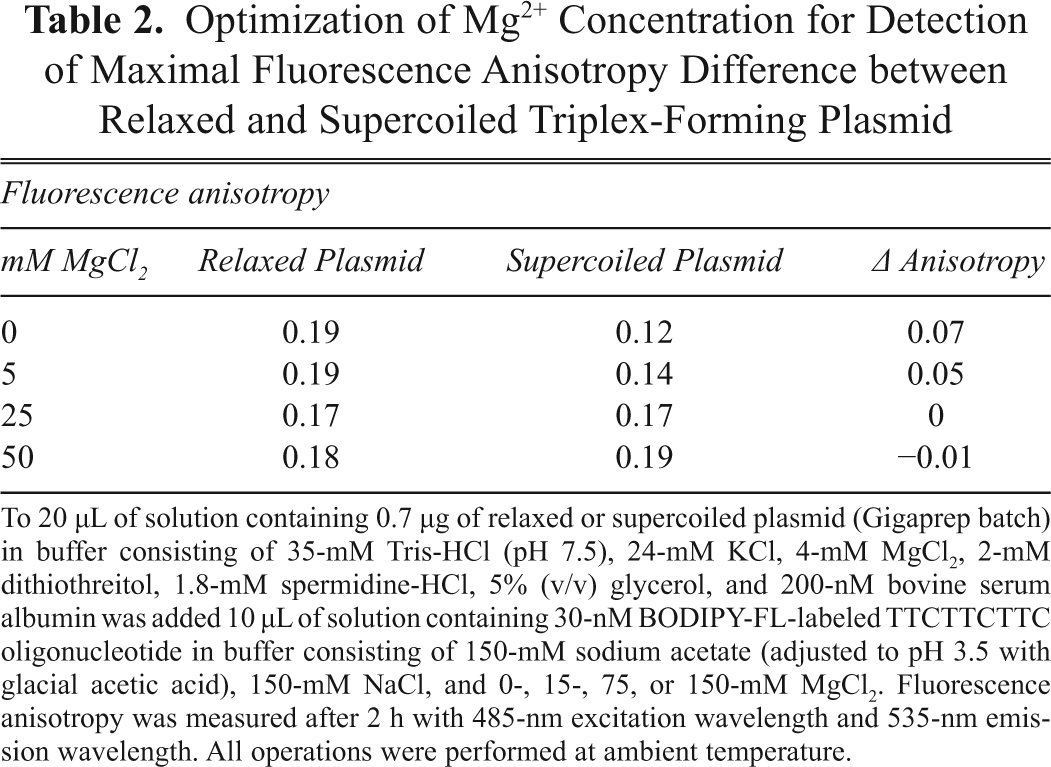
To 20 µL of solution containing 0.7 µg of relaxed or supercoiled plasmid (Gigaprep batch) in buffer consisting of 35-mM Tris-HCl (pH 7.5), 24-mM KCl, 4-mM MgCl2, 2-mM dithiothreitol, 1.8-mM spermidine-HCl, 5% (v/v) glycerol, and 200-nM bovine serum albumin was added 10 µL of solution containing 30-nM BODIPY-FL-labeled TTCTTCTTC oligonucleotide in buffer consisting of 150-mM sodium acetate (adjusted to pH 3.5 with glacial acetic acid), 150-mM NaCl, and 0-, 15-, 75, or 150-mM MgCl2. Fluorescence anisotropy was measured after 2 h with 485-nm excitation wavelength and 535-nm emission wavelength. All operations were performed at ambient temperature.
In the absence of added Mg2+, the anisotropy difference with relaxed and supercoiled plasmid increased as the pH decreased (
A plausible interpretation for the difference in anisotropies of 5′-BODIPY-FL-TTCTTCTTC with relaxed and supercoiled plasmids is that the relaxed plasmid binds with greater affinity to the oligonucleotide than the supercoiled plasmid under this particular set of conditions (
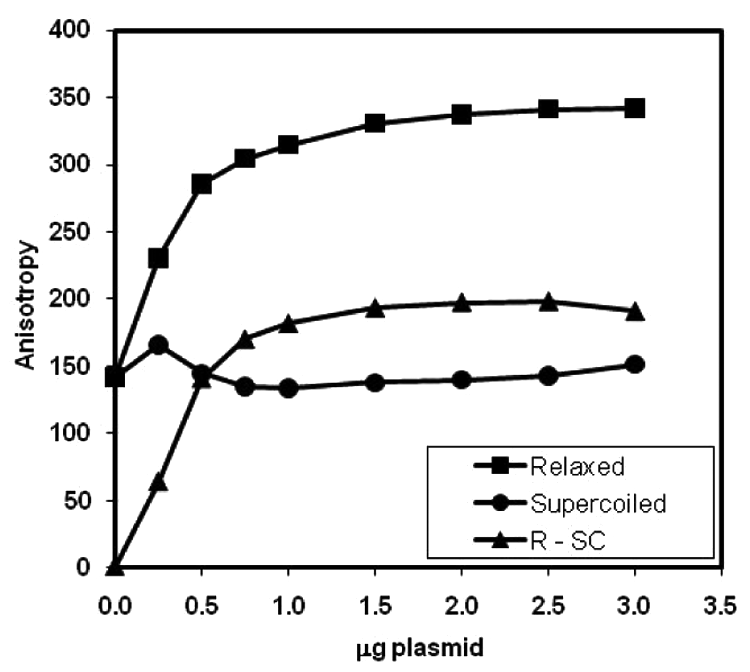
Effect of relaxed and supercoiled triplex-forming plasmid concentration on fluorescence anisotropy of BODIPY-FL-labeled TTCTTCTTC triplex-forming DNA oligonucleotide. To 20 µL of plasmid (Gigaprep batch) in buffer consisting of 35-mM Tris-HCl (pH 7.5), 24-mM KCl, 4-mM MgCl2, 2-mM dithiothreitol, 1.8-mM spermidine-HCl, 5% (v/v) glycerol, 200-nM bovine serum albumin, and 0.3-mM adenosine triphosphate (ATP) was added 10 µL of 30 nM oligonucleotide in buffer consisting of 150-mM sodium acetate (pH adjusted to 3.5 with glacial acetic acid) and 150-mM NaCl. Anisotropy was measured after 90 min with 485-nm excitation and 535-nm emission wavelengths. All operations were performed at ambient temperature.
Optimization of oligonucleotide length
The length of the triplex-forming oligonucleotide was optimized to maximize the difference in anisotropy with supercoiled and relaxed plasmids by adding one 3′ nucleotide at a time to the sequence TTCTTC, retaining the TTC repeat motif (
Optimization of Triplex-Forming Oligonucleotide Length
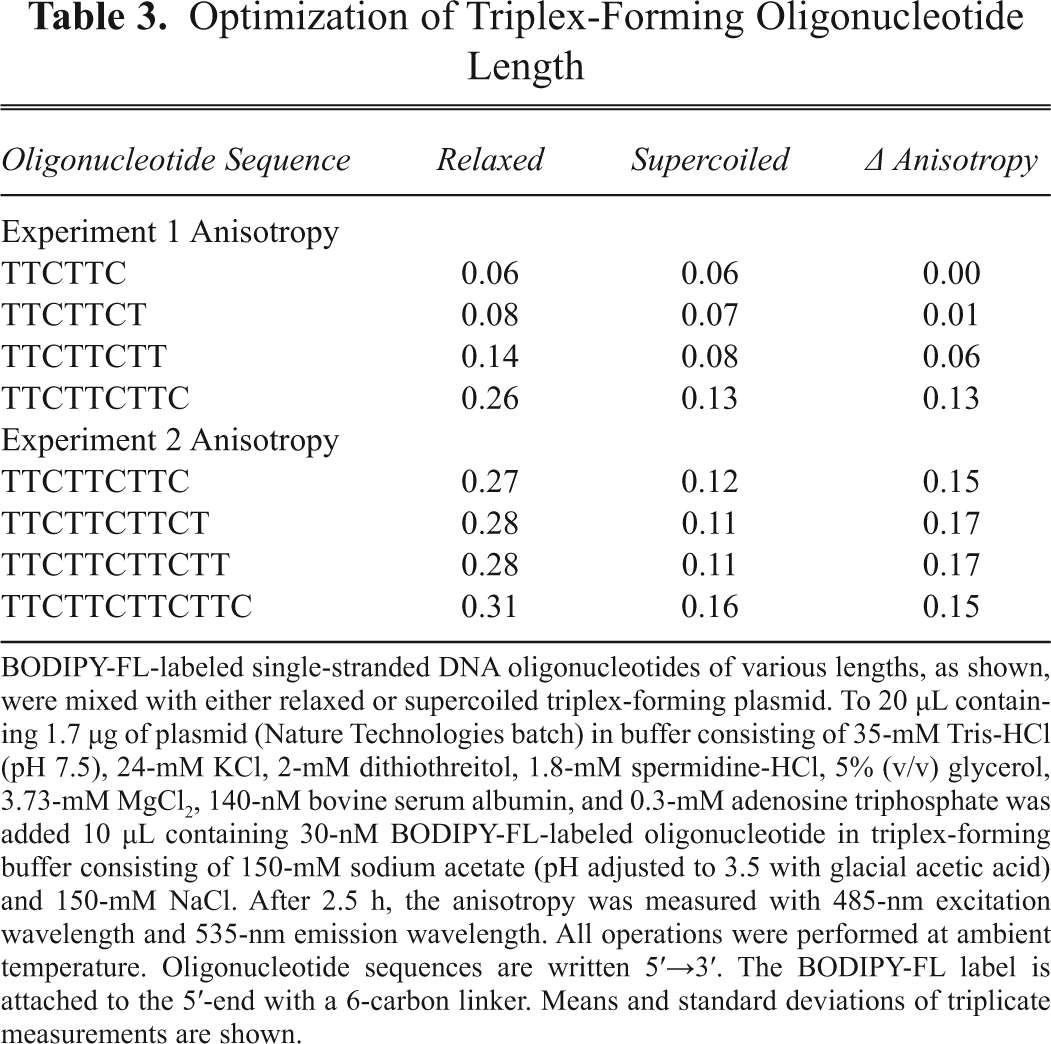
BODIPY-FL-labeled single-stranded DNA oligonucleotides of various lengths, as shown, were mixed with either relaxed or supercoiled triplex-forming plasmid. To 20 µL containing 1.7 µg of plasmid (Nature Technologies batch) in buffer consisting of 35-mM Tris-HCl (pH 7.5), 24-mM KCl, 2-mM dithiothreitol, 1.8-mM spermidine-HCl, 5% (v/v) glycerol, 3.73-mM MgCl2, 140-nM bovine serum albumin, and 0.3-mM adenosine triphosphate was added 10 µL containing 30-nM BODIPY-FL-labeled oligonucleotide in triplex-forming buffer consisting of 150-mM sodium acetate (pH adjusted to 3.5 with glacial acetic acid) and 150-mM NaCl. After 2.5 h, the anisotropy was measured with 485-nm excitation wavelength and 535-nm emission wavelength. All operations were performed at ambient temperature. Oligonucleotide sequences are written 5′→3′. The BODIPY-FL label is attached to the 5′-end with a 6-carbon linker. Means and standard deviations of triplicate measurements are shown.
Detection of topoisomerase-catalyzed relaxation and supercoiling of plasmid by fluorescence anisotropy
The ability of the fluorescence anisotropy assay to measure the activity of topoisomerases was demonstrated (a) for relaxation of supercoiled plasmid by a type 1 topoisomerase, E. coli TopA (
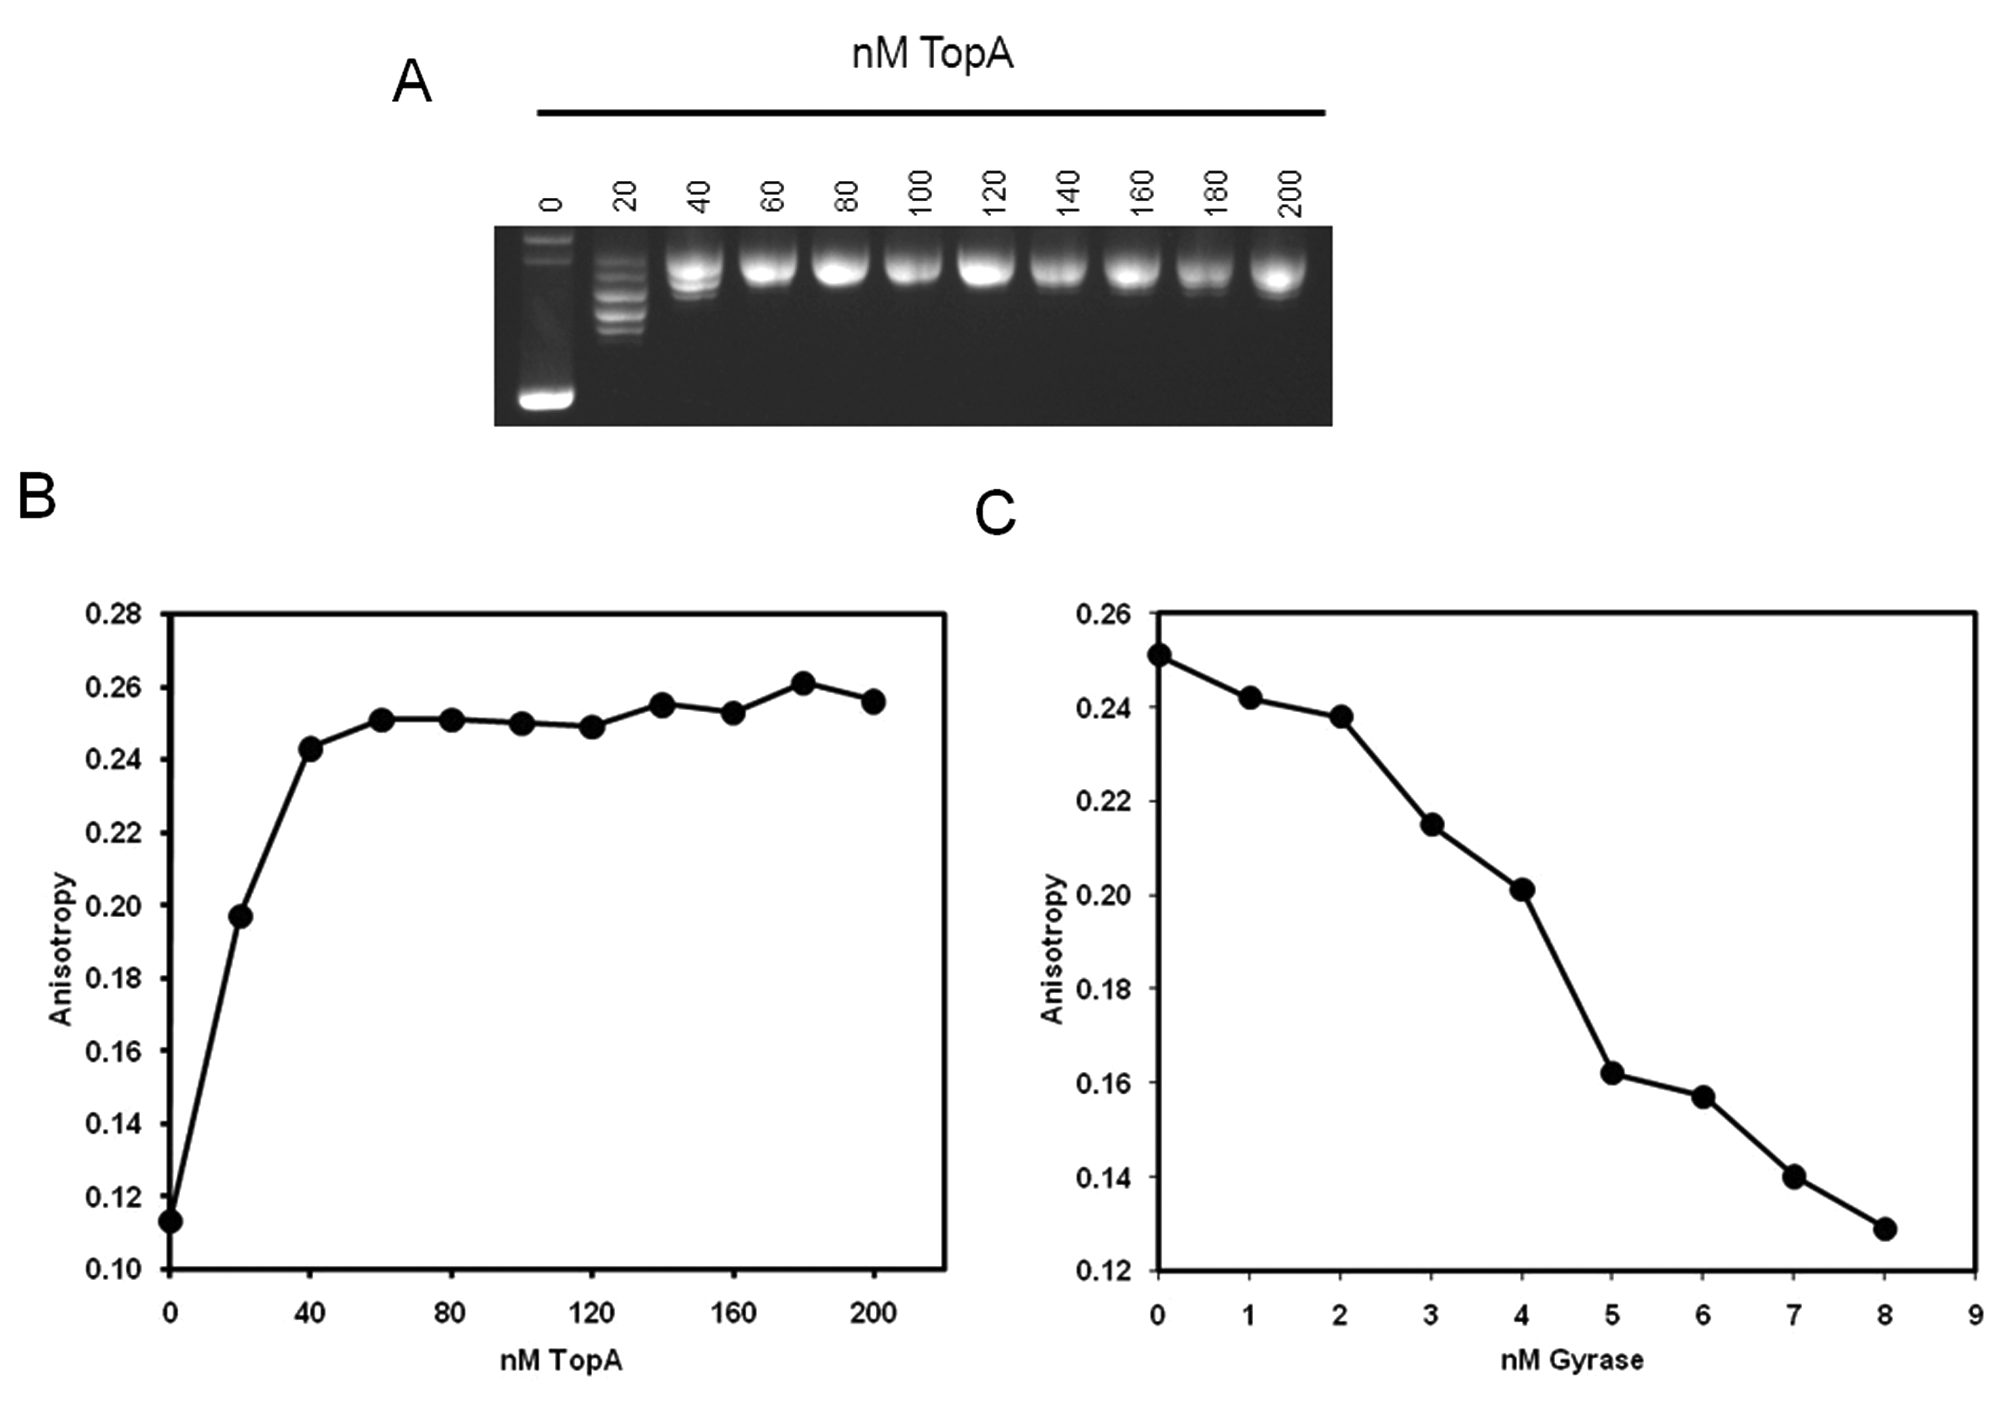
Relaxation of supercoiled triplex-forming plasmid using Escherichia coli TopA and supercoiling of relaxed plasmid using E. coli gyrase. (
Treatment of the supercoiled plasmid with TopA resulted in relaxation of the plasmid, as shown by gel electrophoresis (
The plasmid relaxed by TopA could subsequently be supercoiled again by treatment with gyrase in the presence of ATP (
Comparison of fluorescence anisotropy and gel assay of gyrase
To compare the results of the fluorescence anisotropy supercoiling assay to the measurement of supercoiling by agarose gel electrophoresis, relaxed triplex-forming plasmid was treated for various lengths of time with E. coli gyrase. The samples were analyzed by both gel electrophoresis and fluorescence anisotropy assay.
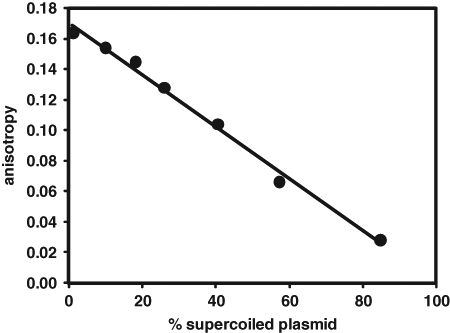
Correspondence between agarose gel electrophoresis measurement of supercoiling by Escherichia coli gyrase and fluorescence anisotropy assay. Gyrase-catalyzed supercoiling reactions of 30 µL contained 2-nM gyrase, 85-µg/mL triplex-forming plasmid (Nature Technologies batch), and 0.3-mM adenosine triphosphate (ATP) in buffer consisting of 35-mM Tris-HCl (pH 7.6), 24-mM KCl, 1-mM dithiothreitol, 4-mM MgCl2, 1.8-mM spermidine-HCl, 200-nM bovine serum albumin, 0.002% Brij-35 detergent, and 5% glycerol. Reactions were quenched after 0 (no gyrase), 2, 5, 10, 20, 40, or 80 min with 10 µL of solution containing 40-nM BODIPY-TMR-labeled TTCTTCTTC oligonucleotide in buffer consisting of 200-mM sodium acetate (pH adjusted to 3.5 with glacial acetic acid) and 200-mM NaCl. Fluorescence anisotropy was measured after 1 h. The percentage of supercoiled plasmid was measured by gel electrophoresis on 1% agarose in Tris-acetate-EDTA with integration of the fluorescence of the ethidium bromide–stained band of fully supercoiled plasmid. All operations were performed at ambient temperature.
Inhibition of gyrase
The suitability of the fluorescence anisotropy supercoiling assay for measuring the ability of compounds to inhibit topoisomerases was demonstrated by measuring the inhibition of E. coli gyrase by several fluoroquinolone antibacterial drugs and nalidixic acid (
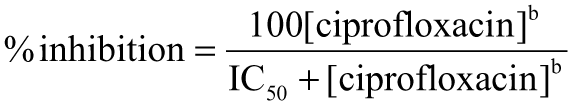
Comparison of concentration responses for inhibition of Escherichia coli gyrase by fluoroquinolones and nalidixic acid between the gel electrophoresis and fluorescence anisotropy assays. To 0.25 µL of inhibitor in dimethyl sulfoxide (DMSO) was added 15 µL of solution containing 600-µM adenosine triphosphate (ATP) and 15 µL of solution containing 0.17 mg/mL relaxed triplex-forming plasmid (Nature Technologies batch) and 4-nM E. coli gyrase. Both solutions were in buffer consisting of 35-mM Tris-HCl (pH 7.6), 24-mM KCl, 4-mM MgCl2, 1-mM dithiothreitol, 1.8-mM spermidine-HCl, 5% (v/v) glycerol, 200-nM bovine serum albumin, and 0.002% Brij-35 detergent. For fluorescence anisotropy measurements, the reactions were quenched with 10 µL of solution containing 40-nM BODIPY-TMR-labeled TTCTTCTTCT oligonucleotide, 200-mM NaCl, and 200-mM sodium acetate (pH 3.5). Fluorescence anisotropy was measured after 1 h using 535-nm excitation and 595-nm emission filters. For gel-based assays, the reactions were quenched with 6 µL of 0.5 M EDTA-NaOH (pH 8.0), followed after 10 min with 6 µL of a solution containing 40% sucrose, 100-mM Tris-HCl (pH 7.5), 1-mM EDTA, and 0.5 mg/mL bromphenol blue. Then, 12 µL was loaded onto 1% agarose in Tris-acetate-EDTA solution. Electrophoresis was at 28V for about 16 h. The gels were stained with 1 mg/mL ethidium bromide for 5 min and destained for several hours in water. All operations were performed at ambient temperature. The data were fit to the following Hill equation: where IC50 is the concentration of ciprofloxacin producing 50% inhibition and b is the Hill slope. (A) Inhibition of gyrase by levofloxacin, measured by gel electrophoresis (open circles, thick curve) and by the fluorescence anisotropy assay (solid circles, thin curve). (B) Comparison of IC50s for 6 gyrase inhibitors measured by gel electrophoresis and fluorescence anisotropy assays. The compounds, in order of increasing IC50 in the fluorescence anisotropy assay, are ciprofloxacin, sparfloxacin, levofloxacin, ofloxacin, enrofloxacin, lomefloxacin, and nalidixic acid.
Assay parameters for HTS
A frequently used statistic for describing the quality of an assay is the Z′. A useful assay requires a Z′ of at least 0.5. Z′ values were measured for the supercoiling assay using E. coli gyrase to supercoil relaxed plasmid and 4.2-µM ciprofloxacin to produce 100% inhibition. A reaction volume of 12 µL in low-volume 384-well plates was used to conserve reagents. Z′ values were in the range of 0.63 to 0.68. In 1 experiment, for example, the average MAX and MIN anisotropies and their standard deviations were 0.012 ± 0.005 and 0.140 ± 0.010, respectively. (The MAX, representing the signal for fully active gyrase, is lower than the MIN, representing the signal for fully inhibited gyrase, because the anisotropy decreases as the proportion of supercoiled plasmid increases.)
The length of time required for the signal to develop after adding the oligonucleotide at pH 3.5 and the subsequent stability of the signal were investigated using similar conditions as those used for the Z′ measurement. The maximal anisotropy difference between MAX and MIN was observed between 30 min and 2 h. At shorter times, the high anisotropy with relaxed plasmid had not fully developed, whereas at longer times, the anisotropy with supercoiled plasmid gradually increased. The slow, time-dependent increase in anisotropy of the MAX (supercoiled) plasmid may represent either slow binding of the oligonucleotide to the supercoiled plasmid or a gradual onset of damage to the supercoiled plasmid leading to its relaxation.
Discussion
Topoisomerases are targets for anticancer and anti-infective drug discovery because of their essentiality for cellular processes involving DNA. The lack of a practical high-throughput assay has been an impediment to automated screening of large compound collections containing hundreds of thousands of samples for novel inhibitors of topoisomerases using biochemical assays with purified enzymes. Maxwell et al. 12 showed that triplex formation could be used to distinguish quantitatively between relaxed and supercoiled plasmids. This method used plate-washing steps to remove relaxed plasmid that did not bind to the immobilized DNA oligonucleotide. In this article, we describe a fluorescence anisotropy assay based on triplex formation that eliminates the necessity of washing out unbound DNA and of immobilizing the oligonucleotide DNA. The new assay is therefore very well suited for fully automated, miniaturized HTS for topoisomerase inhibitors.
The fluorescence anisotropy assay could be used to search for any treatment that affects the degree of supercoiling of the plasmid, not just topoisomerases. For example, endonucleases that cause breakage of the DNA backbone would cause supercoiled DNA to become relaxed, an effect that could be monitored with the assay. Binding of proteins, such as histones, to the DNA would affect the topology of the plasmid, allowing such binding interactions to be monitored.
In the supercoiling assay described by Maxwell et al.,
12
supercoiling of the plasmid enhanced its binding to the triplex-forming oligonucleotide at pH 5 and 50 mM Mg2+. In our assay, the anisotropy of the BODIPY-FL-labeled oligonucleotide was higher with relaxed plasmid than with supercoiled plasmid, with the optimal differentiation at pH 3.5 and 2.7 mM final concentration of Mg2+. A plausible explanation for the anisotropy results is that relaxed plasmid bound preferentially to the oligonucleotide (
We begin by considering why the assay of Maxwell et al. 12 works as it does. First, the requirement for acidic pH for triplex formation is due to the necessity of protonating the cytosine base for Hoogsteen base pairing of the third strand in the major groove. 16,17 The effect of Mg2+ is believed to include shielding of the electrostatic repulsion between the 3 DNA backbones. Formation of a triplex between a plasmid containing a polypyrimidine (Y)–polypurine (R) sequence and a polypyrimidine oligonucleotide was first reported by Lyamichev et al. 13 They reported, however, that there was no difference in this interaction between linear, nicked, and supercoiled plasmids. If, in the Maxwell et al. 12 assay, the oligonucleotide simply formed a triplex with duplex DNA in the plasmid, it is unclear why this triplex was favored in supercoiled DNA.
The enhancement of intramolecular triplex formation by negative supercoiling, in contrast, has been described 18,19 (reviewed in Frank-Kamenetskii and Mirkin 17 and Wells et al. 16 ). In this so-called H-DNA structure, half of a Y-R mirror repeat forms a triplex with the other half of the Y sequence, leaving the other half of the R sequence single stranded. H-DNA formation also requires acidic pH for cytosine protonation. Localized melting of the duplex DNA is probably responsible for the enhancement of H-DNA formation by negative supercoiling. Interestingly, the lower the pH, the less supercoiling is required for H-DNA formation. 19
In the Maxwell et al. 12 assay, the formation of H-DNA in the supercoiled plasmid, but not the relaxed plasmid, would be expected to prevent its binding to the immobilized oligonucleotide by competition. This result would be opposite to the observed one. The solution to this paradox may lie with the single-stranded half of the R sequence in H-DNA, which is capable of Watson-Crick base pairing with a complementary oligonucleotide. 13,20 Rather than competing with the oligonucleotide for triplex formation, H-DNA may thus actually be the binding site for duplex formation with the oligonucleotide. Conditions that favor H-DNA formation within the Y-R sequence-containing plasmid, such as supercoiling, would therefore also favor oligonucleotide binding to the plasmid. We hypothesize that, under the high-Mg2+ concentration, pH 5 conditions of the Maxwell et al. 12 assay, H-DNA forms only with the supercoiled plasmid, explaining why the supercoiled plasmid, but not the relaxed plasmid, binds to the immobilized oligonucleotide. Consistent with this explanation, we observed higher anisotropy with supercoiled plasmid than with relaxed plasmid under the conditions of the Maxwell et al. 12 assay, although the anisotropy difference was smaller than the one of opposite sign obtained at pH 3.5 and low Mg2+ concentration. For example, in 1 experiment, the anisotropies with relaxed and supercoiled plasmids were 0.24 and 0.14, respectively, at pH 3.5 without added Mg2+ (difference = 0.10), whereas the anisotropies were 0.13 and 0.17 with relaxed and supercoiled plasmids, respectively, at pH 5.0 and 50 mM added Mg2+ (difference = −0.04).
To explain why we observed higher anisotropy with relaxed plasmid than with supercoiled plasmid in our assay, we hypothesize that both supercoiled and relaxed plasmids form H-DNA under the low-Mg2+ concentration, pH 3.5 conditions. Because both topoisomers have a duplex binding site for the BODIPY-labeled oligonucleotide, it should be able to bind to both. Higher affinity of the oligonucleotide for relaxed plasmid than supercoiled plasmid would result in greater binding of the oligonucleotide to the relaxed plasmid at the plasmid concentration used in the assay, hence higher anisotropy of the BODIPY oligonucleotide with the relaxed plasmid than the supercoiled plasmid. This difference in affinity probably arises from (1) a greater degree of steric hindrance of oligonucleotide binding to the more compact supercoiled plasmid than to the more extended relaxed plasmid and (2) a greater degree of electrostatic repulsion between the oligonucleotide and the compact supercoiled plasmid than the relaxed plasmid at the low-Mg2+ concentration. The latter explanation is consistent with the rise in the anisotropy with supercoiled plasmid as the Mg2+ concentration increased at pH 3.5 (
The supercoiling reaction catalyzed by gyrase is processive, with the result that a sample of relaxed plasmid treated with gyrase transitions to highly supercoiled plasmid with a relatively small amount of intermediately supercoiled topoisomers. This situation may be beneficial for the fluorescence anisotropy assay by allowing it to take maximal advantage of the anisotropy difference between supercoiled and relaxed plasmids.
We have demonstrated the ability of the fluorescence anisotropy assay to differentiate between relaxed plasmid and negatively supercoiled (underwound) plasmid, which is the type of supercoiling exhibited by DNA in vivo and also the type introduced by gyrase and by the binding of eukaryotic chromosomal DNA to histones. It cannot be excluded that the assay would not be able to distinguish between relaxed and positively supercoiled (overwound) plasmid. The reverse gyrase of thermophilic archaea are the only known topoisomerases capable of introducing positive supercoils. 21 The eukaryotic and eubacterial topoisomerases of concern as potential drug targets are capable of relaxing negatively supercoiled DNA or introducing negative supercoils. Therefore, the fluorescence anisotropy assay should be useful for measuring the activity of all topoisomerases of medical interest, even if it turns out that the assay is not useful for measuring the interconversion of relaxed and positively supercoiled DNA.
Some topoisomerases, such as topoisomerase IV, catalyze the decatenation of linked circular DNA molecules. 22 The assay described in this article is unable to measure that activity. Topoisomerase IV has ATP-dependent relaxation activity, however, using both positively and negatively supercoiled DNA substrates. 23 Thus, it would be possible to use the fluorescence anisotropy assay to measure the relaxation activity of topoisomerase IV.
It is crucial that the triplex-forming plasmid used in the fluorescence anisotropy supercoiling assay be free of any significant quantity of open circular plasmid (i.e., plasmid with 1 or more nicks in the DNA backbone) because nicked plasmid cannot be supercoiled. Nicked DNA can be repaired by treating it with DNA ligase. When used for measuring supercoiling of relaxed DNA, the plasmid substrate should be treated so as to render it as close to a fully relaxed state as possible to get the maximal anisotropy change upon supercoiling. We found when relaxing the plasmid with TopA that it was necessary to titrate the TopA concentration carefully. Too little TopA resulted in a smaller signal due to incompletely relaxed starting material. Too much TopA led to a requirement for a higher concentration of gyrase to achieve a given anisotropy signal. The latter effect may have been due to coating of the DNA with TopA, because we did not repurify the DNA after TopA treatment.
When screening compound collections with a fluorescence-based assay, such as the one described here, it is beneficial to use fluorophores with the longest possible excitation wavelength to minimize interference from compound fluorescence. 24 We have used both BODIPY-FL, excited by green light, and BODIPY-TMR, excited by red light, to label the triplex-forming, single-stranded DNA oligonucleotide. The fluorescence lifetimes of these 2 fluorophores are similar at 5.9 ns and 5.3 ns, respectively, 25 so the response of their anisotropies to plasmid binding should be about the same. As expected, the identity of the BODIPY fluorophore had no effect on the anisotropy difference between relaxed and supercoiled plasmids, about 0.15 in both cases. Thus, a high-throughput screen could use BODIPY-TMR instead of BODIPY-FL to reduce interference from test sample fluorescence.
The high throughput of the fluorescence anisotropy supercoiling assay is highly advantageous when screening large compound libraries for inhibitors or measuring the potencies of inhibitors using serial dilutions. This assay is not without drawbacks, however.
First, the assay requires a large amount of plasmid in a homogeneous topoisomeric state. The large quantity of plasmid is costly to produce. As isolated from cells, the plasmid is highly negatively supercoiled, making it suitable for use in an assay for relaxation activity. If gyrase supercoiling activity is to be measured, however, it is necessary to relax the plasmid as thoroughly as possible without introducing any backbone breaks. We have demonstrated an efficient method to do this using E. coli TopA, a type I topoisomerase. Single-stranded nicks prevent supercoiling, so if a significant amount of plasmid has such breaks, they must be repaired with DNA ligase.
The second disadvantage of the assay arises from the fact that there is no separation step, so that the compounds being tested for inhibition remain in the well during the measurement, potentially leading to interference in the measurement of fluorescence anisotropy. This problem would be especially acute for fluorescent compounds. Shapiro et al. 26 described a simple method to correct for compound interference in such circumstances, as long as it is not too great. The correction procedure requires a replicate plate of compound samples to which the labeled oligonucleotide is added under the same conditions as in the enzyme assay. The plasmid and target enzyme are not required. Compound fluorescence, if present, is measured in this “artifact plate” and subtracted from the fluorescence in the corresponding wells of the assay plate. If, on the other hand, the compound acts as a fluorescence quencher, a multiplicative quench correction factor is calculated and applied to the fluorescence in the assay plate. This process is done separately for parallel and perpendicular fluorescence intensity measurements, and the anisotropy is calculated from these corrected intensities. Another way to minimize the interference in the assay, as discussed above, is to maximize the wavelength of the fluorophores attached to the oligonucleotide because inhibitor autofluorescence is likely to decrease as the wavelength increases. 24
Footnotes
Acknowledgements
We thank Galen Loving for his early participation in this work, Kathy MacCormack for DNA sequencing, James Whiteaker for bacterial cell growth, Gunther Kern for assistance in procuring plasmid commercially, and Gautam Sanyal and Brian Noonan for their support.