
Abstract
RNA interference-based screening is a powerful new genomic technology that addresses gene function en masse. To evaluate factors influencing hit list composition and reproducibility, the authors performed 2 identically designed small interfering RNA (siRNA)–based, whole-genome screens for host factors supporting yellow fever virus infection. These screens represent 2 separate experiments completed 5 months apart and allow the direct assessment of the reproducibility of a given siRNA technology when performed in the same environment. Candidate hit lists generated by sum rank, median absolute deviation, z-score, and strictly standardized mean difference were compared within and between whole-genome screens. Application of these analysis methodologies within a single screening data set using a fixed threshold equivalent to a p-value ≤0.001 resulted in hit lists ranging from 82 to 1140 members and highlighted the tremendous impact analysis methodology has on hit list composition. Intra- and interscreen reproducibility was significantly influenced by the analysis methodology and ranged from 32% to 99%. This study also highlighted the power of testing at least 2 independent siRNAs for each gene product in primary screens. To facilitate validation, the authors conclude by suggesting methods to reduce false discovery at the primary screening stage. In this study, they present the first comprehensive comparison of multiple analysis strategies and demonstrate the impact of the analysis methodology on the composition of the “hit list.” Therefore, they propose that the entire data set derived from functional genome-scale screens, especially if publicly funded, should be made available as is done with data derived from gene expression and genome-wide association studies.
Keywords
Introduction
T
The human genome can be interrogated by expressed short-hairpin RNAs (shRNA) or transfected small interfering RNAs (siRNA). 3,4 In this study, we focus on synthetic siRNAs arrayed in microwell format. The evolution of RNAi screening to the genome scale parallels the emergence of high-density microarray technology. As RNAi technology joins the “omics” echelons, so does the need for analysis methodology to make sense of the enormous data sets generated from genome-scale loss-of-function studies. These data sets can range from the simple output of luminescence or fluorescence of a well to the generation of high-content cell-based data containing as many as a hundred separate parameters for each of the thousands of cells in the well. Multiple analysis methods have been used to generate the all important “hit list,” although none is considered standard procedure. 5
One specific field benefiting from genome-scale siRNA screening technology is the field of host-pathogen interactions. To date, multiple groups have pursued the identification of factors influencing viral propagation using genome-scale RNAi technology. Recently, 3 groups identified host factors supporting the HIV life cycle in human cells. However, upon comparison of the results, the significant dissimilarity between the proposed host factors posited more questions than any one project answered. 6-8 The low level of overlap among hit lists can be explained by the dissimilar methodologies employed, but it also raises a question that can be explored experimentally: to what degree would one expect RNAi-based genome-wide screens to agree?
Our study explores the effect of screening strategy and analysis methodology on the results of 2 genome-scale siRNA screens. These 2 screens used high-content cell-based imaging and analysis to score for siRNAs that inhibited yellow fever virus propagation in human cells. Both were performed using the same siRNA library, cell line, viral stock, equipment, and procedure but were separated by 5 months. We use these data to illustrate the advantages of testing independent siRNAs during the primary screen. In addition, we compare the performance of 4 accepted analysis methods with respect to the variability and overlap of intra- and interscreen hit lists. Our work defines multiple factors contributing to the variability between genome-scale siRNA screens.
Materials and Methods
siRNA screening
Both genomic screens to identify human host factors of yellow fever virus propagation were performed using the Qiagen Human Genome siRNA Library v1.0 at the Duke RNAi Screening Facility. HuH-7 cells were reverse transfected with 1.0 pmol siRNA in a total volume of 65 µL media. Briefly, assay plates were prearrayed from stock library plates using a Velocity11/Agilent Bravo precision liquid-handling robot (Velocity11, Menlo Park, CA). Then, 5 µL of dH2O containing 1.0 pmol of siRNA was dispensed into 384-well microplates (Corning 3712; Corning, Corning, NY) using the 384-channel ST head of the Bravo. Next, 10 µL of Opti-MEM I (GIBCO 11058; GIBCO, Carlsbad, CA) containing 0.5% RNAimax (Invitrogen 13778-150; Invitrogen, Carlsbad, CA) was dispensed to each well using a Matrix WellMate liquid dispenser (Matrix Technologies Corporation, Hudson, NH) and incubated for 30 min at room temperature in the presence of 1 pmol siRNA in 5 µL dH2O. After incubation, 1200 HuH-7 cells in 50 µL of Dulbecco’s modified Eagle’s medium (DMEM; GIBCO 11995) supplemented with 5% fetal bovine serum (FBS; GIBCO 16140) and 1% antibiotics (GIBCO 15140) was dispensed into each well using a Matrix WellMate.
Approximately 51 h after transfection, the HuH-7 cells were infected with yellow fever virus vaccine strain 17D at a multiplicity of infection (MOI) of 0.1 by addition of 20 µL of viral-containing media to each assay well using the 384-channel ST head of the Bravo followed by mixing by triteration. The virus infection was allowed to proceed for 42 h at 37°C. The cells were then immunostained for the viral envelope protein using the primary antibody 4G2 followed by Alexa 488–conjugated secondary antibodies. 9 Reagents were added using a Matrix automated 12-channel pipette, and wash steps were performed using a BioTek ELx405 automated plate washer (BioTek, Winooski, VT). Both genomic screens strictly adhered to a common protocol in which 11 batches of 14 plates per day were assayed within 27 days.
High-content imaging and cell-based assay
After fixation and staining, 2 of the 4 available fields in each assay well were imaged with a 10× objective using the Cellomics Array Scan VTI system (Cellomics, Pittsburgh, PA). The acquired images were analyzed using the vHCS Scan version 5.1.2 (Build 268). The Compartmental Analysis bioapplication was optimized to determine the percentage of HuH-7 cells that were infected by yellow fever virus. The vHCS View software package reports the number of cells as the valid object count (VOC), and the percentage of the analyzed cell population infected by the virus is reported as the “% selected” and henceforward referred to by the moniker percent infection.
Statistical analysis
Valid object count
Only genes in which both assay wells in a single genomic screen had a VOC ≥1.9 standard deviations less than the mean cell density of the population were analyzed.
The following analysis methodologies were performed treating the genomic data as a single data set of 21,853 pairs for GS1 and 21,843 pairs for GS2.
Sum rank (SR)
The SR p-value was calculated for each genomic screen separately.
10
The percent infection values for each set of siRNAs (AB, CD;
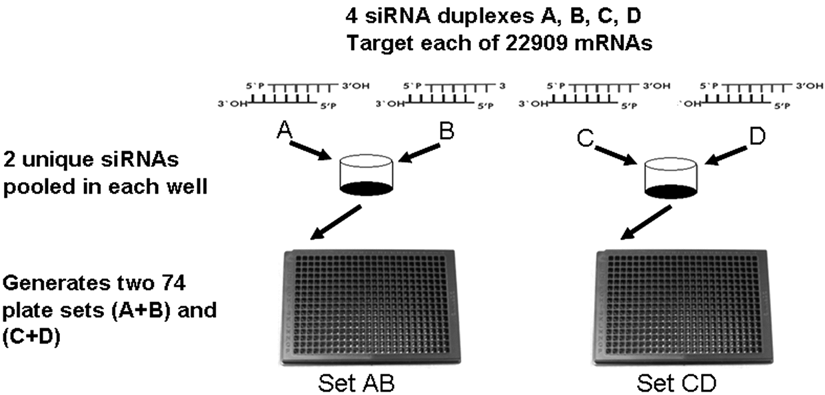
The human whole genome siRNA library design. The target gene is assayed by 4 unique siRNAs (A, B, C, D), which are pooled as 2 siRNAs per well (AB, CD) and arrayed in corresponding wells within 74 pairs (set AB, set CD) of 384-well assay plates.
Median absolute deviation (MAD)
The MAD was calculated as reported in the

The thresholds for the top 200 or top 500 populations were identified as the point in which the MAD n limit for set AB equaled the MAD n limit for set CD and the population within the limits contained 200 or 500 hits, respectively.
z-score
The calculation for z-score is reported in
Strictly standardized mean difference (SSMD)
The calculations for SSMD are reported in the
Results
Duplicate siRNA-based genomic screens
Two genome-scale siRNA screens were performed to identify host factors supporting yellow fever virus propagation in HuH-7 cells. Approximately 5 months separated the first genomic screen (GS1) and the second genomic screen (GS2). A high-content imaging and analysis platform quantified infection as described in Materials and Methods.
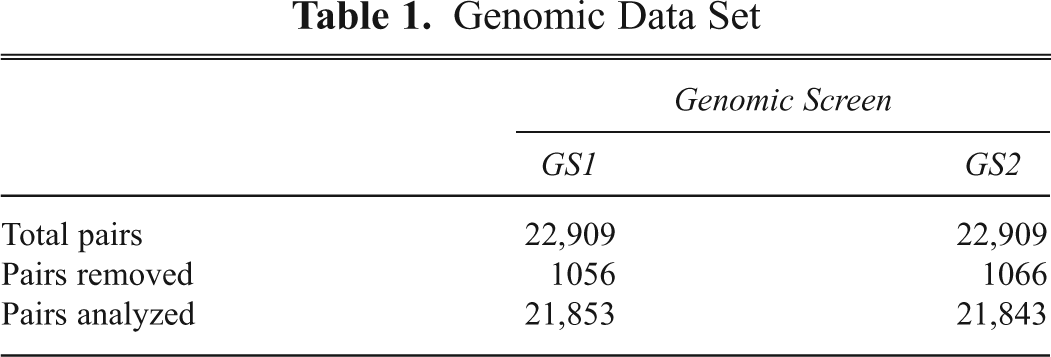
To eliminate unreliable data, we removed assayed pairs in which cells failed to proliferate after plating from further analysis. Of the 22,909 assayed pairs in each genomic screen, 95% of the pairs retained sufficient cell density to be further analyzed for percent infection (
Genomic Data Set
Library design and screening procedure to reduce false discovery rate
Four distinct siRNA duplexes denoted A, B, C, and D targeted each of the 22,909 predicted mRNAs assayed by a human whole genome siRNA library. We chose a 2 × 2 pooled siRNA screening format that consists of 2 distinct 74-plate sets, each containing 2 unique siRNA duplexes per well (SetAB, SetCD). This format results in 148 paired 384-well microplates (
We employed a total effective siRNA concentration of 15.4 nM for screening, resulting in each siRNA being present at 7.7 nM. This concentration of siRNA is significantly lower than that commonly used
The low siRNA concentration and the 2 × 2 screening strategy are designed to limit the false discovery rate in the primary screen. These criteria were selected to provide a high-confidence primary hit list, with minimal false positives for academic screeners who may face both personnel and financial constraints during assay validation.
Analysis of GS1 and GS2 control wells to assess behavior of the 2 screens
Twelve siRNA controls were arrayed on each assay plate. Four negative control wells targeted GFP (siGFP), a protein not present in our system. Four wells contained a nontargeting siRNA (siNSC) as a negative control (Qiagen, Valencia, CA). The remaining 4 wells contained a siRNA duplex that targeted a subunit of the vATPase (si-vATPase), which is required for flaviviral infection, and served as a positive control.
10,15,16
The mean and standard deviation of the percent infection in GS1 for the negative controls, siGFP and siNSC, was 78.6 ± 11.4 and 90.8 ± 6.3, respectively, whereas the mean and standard deviation of the percent infection for the positive controls was 7.5 ± 2.7 (
The behavior of the negative and positive controls across GS1 and GS2. For
Although the behavior of the controls was different between screens, when assessed individually, each screen performed very well.
A modified Z′ factor (Z′n) illustrates the power of replicate tests
Z′ factor (Z′) was developed as a common metric to classify the strength of high-throughput chemical screens and has been similarly applied to siRNA-based screens. 17 We chose to use the values of negative control siGFP to calculate the most conservative Z′. Z′ was calculated between the siGFP and si-vATPase to be 0.40 and 0.53 for GS1 and GS2, respectively. These Z′ factors indicated we could consistently differentiate the positive control wells from the negative controls wells within both respective siRNA screens.
In addition, the paired design of our screening format allowed us to improve the resolution of the assay by plotting the performance of the control wells from SetAB and SetCD as respective x and y coordinates. In
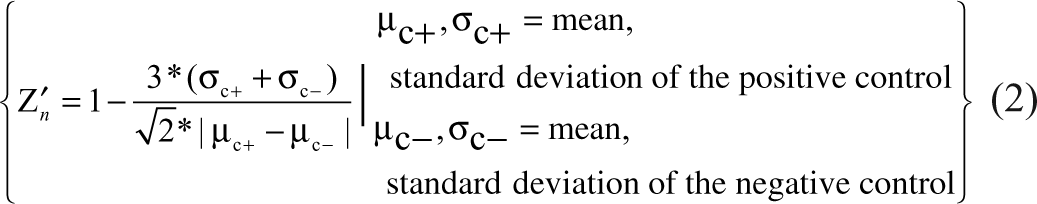
The adjustment of Z′ to Z′
n
quantifies the increased distance between the mean of the negative and positive controls in 2D space without increasing the standard deviations. It assumes that the mean and standard deviation along the x and y axes are equal for the respective control set and that there is no covariance for which to account. When those assumptions are fair, as described in
Calculation of the Z′ n factor for GS1 and GS2 results in 0.58 and 0.66, respectively. The increase of Z′ n factor relative to Z′ factor demonstrates the well-known positive influence replicate tests have on data quality.
The 2 × 2 pooled library design improved data integrity by providing independent tests
The increased resolution afforded by replicate tests and illustrated by the Z′ n factor would apply to any screening format performed in duplicate. Our 2 × 2 pooled library format fulfills this criterion, whereas additional power is achieved by using 2 unique pools of siRNAs and requiring the phenotype to reproduce with both pools. We demonstrated the effects of this format by comparing the VOC between screens in several ways. Initially, we limited the analysis to the first 3 plate pairs of each screen: GS11-3AB, GS11-3CD, GS21-3AB, and GS21-3CD.
First, we examined the behavior of the same plates between GS1 and GS2 by comparing the observed cell density as reported by VOC. A highly significant correlation was observed between the VOC for GS11-3AB and the VOC for GS21-3AB (r = 0.91;
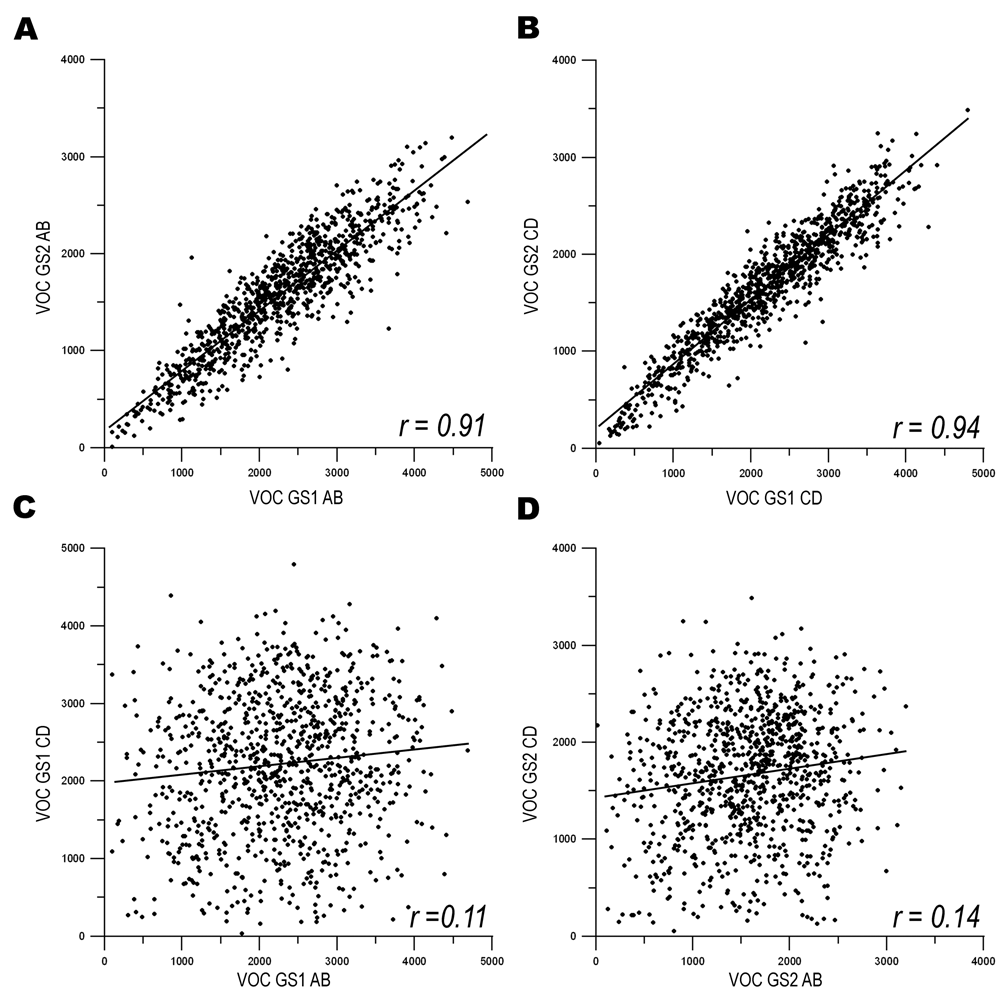
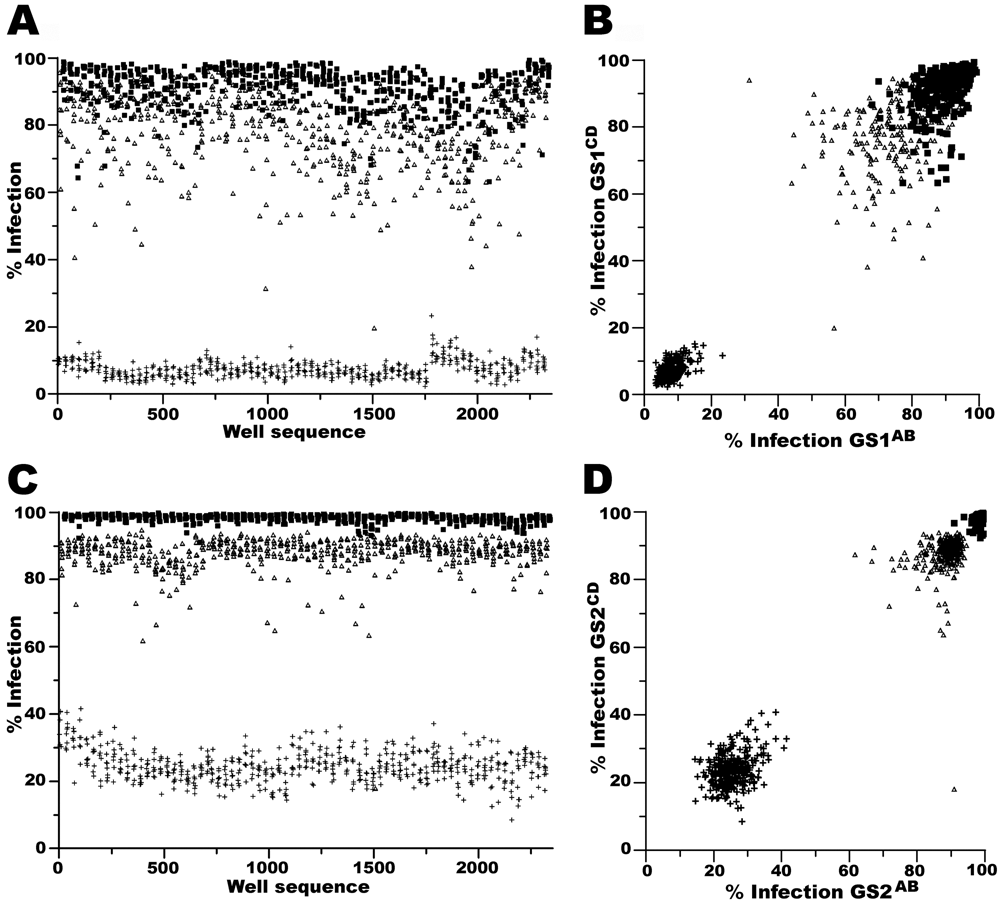
The correlation of a phenotype between identical siRNA pools and independent siRNA pools targeting a subset of genes within genomic screen 1 (GS1) and genomic screen 2 (GS2). (
The power of our 2 × 2 pooled screening strategy is demonstrated when the independent siRNA sets are compared within screens: GSl1-3AB versus GS11-3CD and GS21-3AB versus GS21-3CD. The correlation coefficient of the VOC of GSl1-3AB versus GS11-3CD was 0.11 (
Our assay system used percent infection to identify hits, and therefore effects on cell number can be considered an OTE of siRNA treatment. When assaying cell number as a surrogate of OTEs, our results demonstrate that testing the same siRNA pool multiple times produced similar results (
Four methods for hit selection resulted in significantly different hit lists
At our academic screening facility, we were interested in testing the reproducibility of siRNA screening on a genome-wide scale. As suggested by the behavior of the controls (
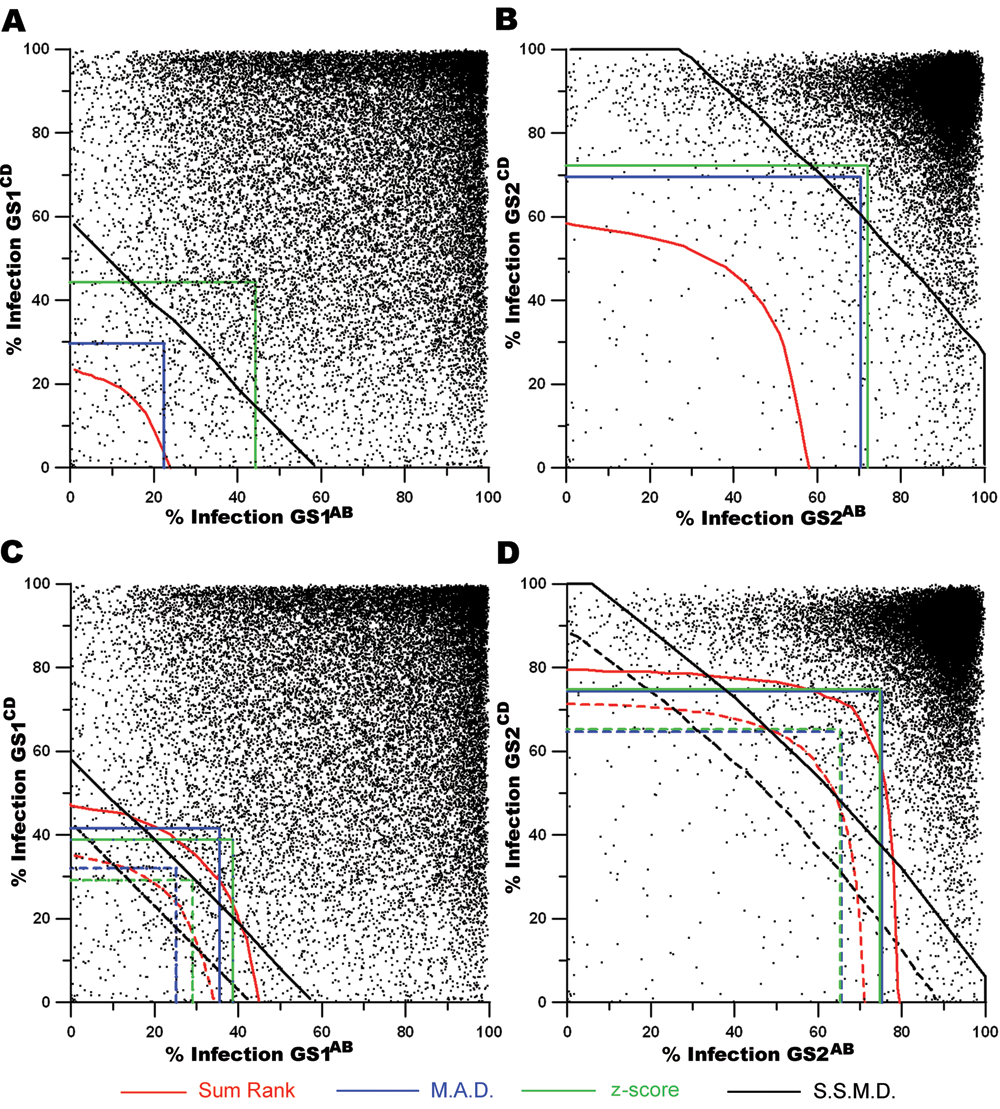
The illustrated thresholds from 4 statistical methodologies overlaid onto the associated genomic population. For
Analyses using parametric statistics assume that the population in question can be accurately described by an established probability distribution. The consistent behavior of the siGFP negative control wells within each genomic screen (
To arrive at comparable hit lists using the 4 methods, we initially sought to apply a consistent probability threshold to each. Three standard deviations greater or less than the mean of the negative control or the population median or mean is considered a robust threshold for hit detection.
5
We chose a z-score ≤ −3.000 and its corresponding probability threshold of p ≤ 0.001350 to meet this convention. The SSMD and MAD values −3.000 were both defined by the respective authors as being equivalent to a z-score of −3.000, whereas a p ≤ 0.001350 for SR could be used for analysis.
11-13
In the specific instance of the application of MAD to the GS1 data set, a −3.000 was inappropriate because this threshold exceeded the limits of the assay (−4.3%) for the GS1AB set. As advised by the method’s authors, we relaxed the MAD limit to k ≤ −2.000.
11
The Intra- and Interscreen Comparisons of Hit Lists
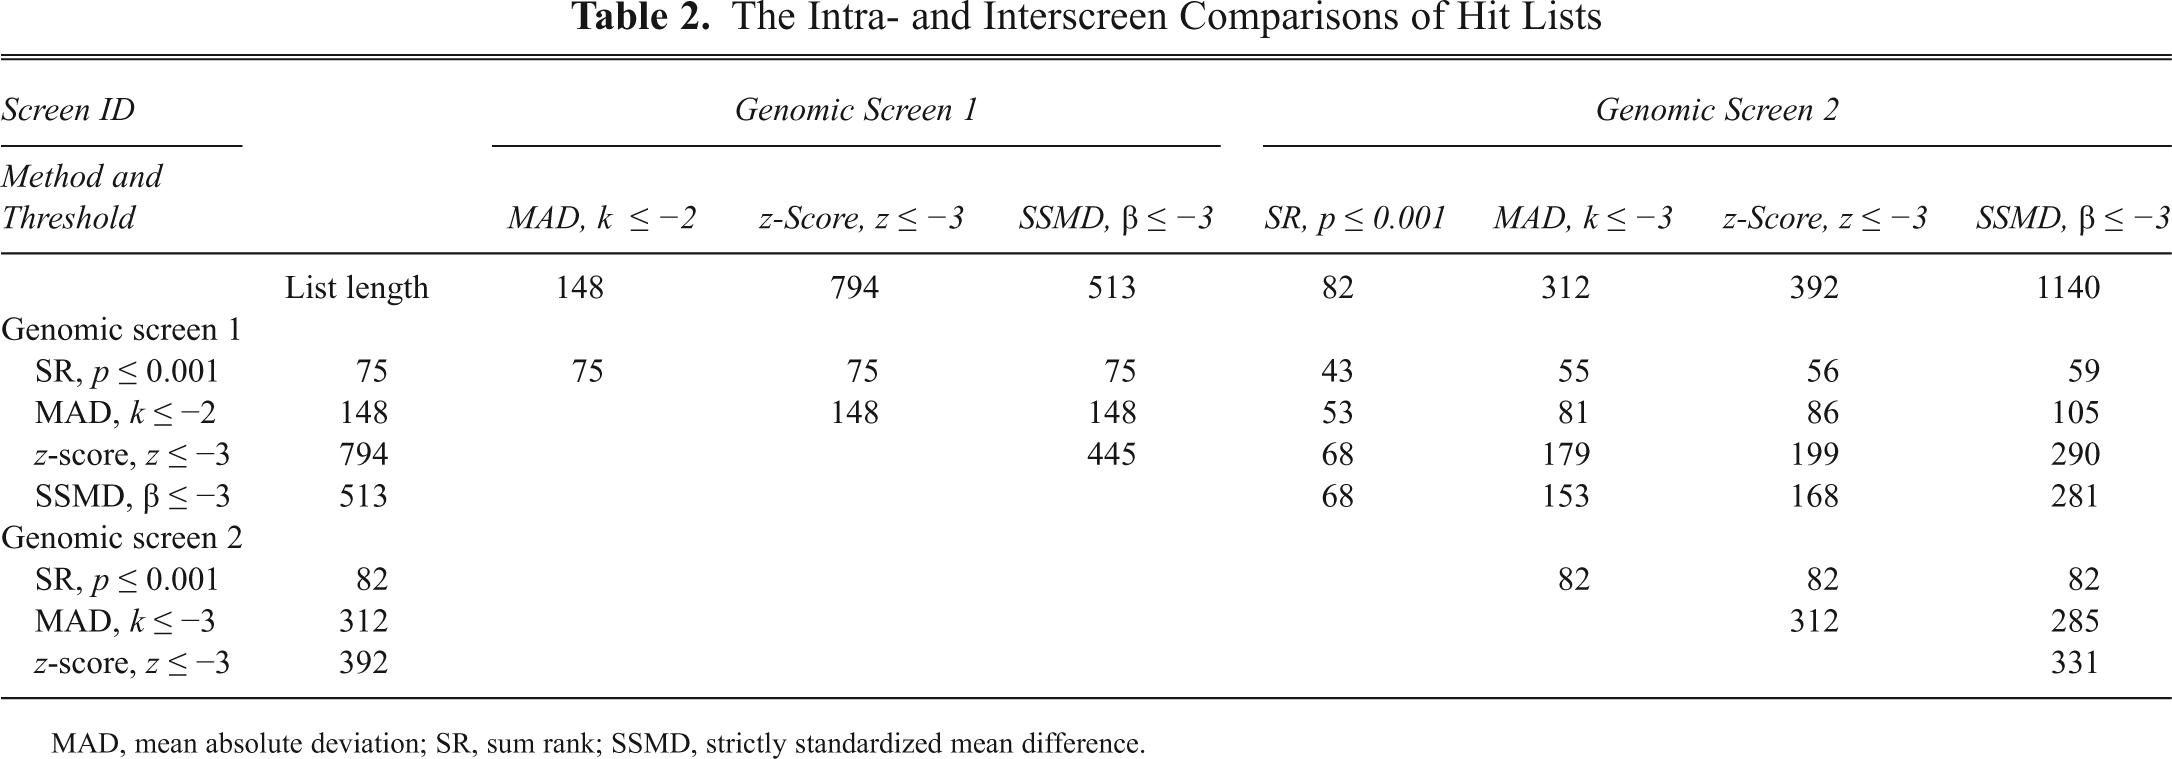
MAD, mean absolute deviation; SR, sum rank; SSMD, strictly standardized mean difference.
To better understand the wide range of hit list lengths generated using these analysis methods, we illustrated the limits defined by each strategy upon the GS1 and GS2 population (
Generation of GS1 and GS2 hit lists using fixed list lengths of 200 and 500 members
As an alternative to determining the overlap of hit lists of such divergent lengths, we applied a consistent rule to all statistical strategies that resulted in a fixed number of hits and then studied reproducibility from that perspective. We scanned the literature for whole-genome RNAi-based screens and considered the length of the primary hit lists. Primary hit lists for 13 different genome-wide screens ranged from 0.96% to 6.66% of the populations tested
Intrascreen Comparisons of the Top 200 or 500 Hits Identified by SR, MAD, z-Score, and SSMD for Genomic Screen 1

Values presented as n (%). MAD, mean absolute deviation; SR, sum rank; SSMD, strictly standardized mean difference.
For GS2, the SR, MAD, z-score, and SSMD thresholds with their illustrated limits are presented in
Intrascreen Comparisons of the Top 200 or 500 Hits Identified by SR, MAD, z-Score, and SSMD for Genomic Screen 2
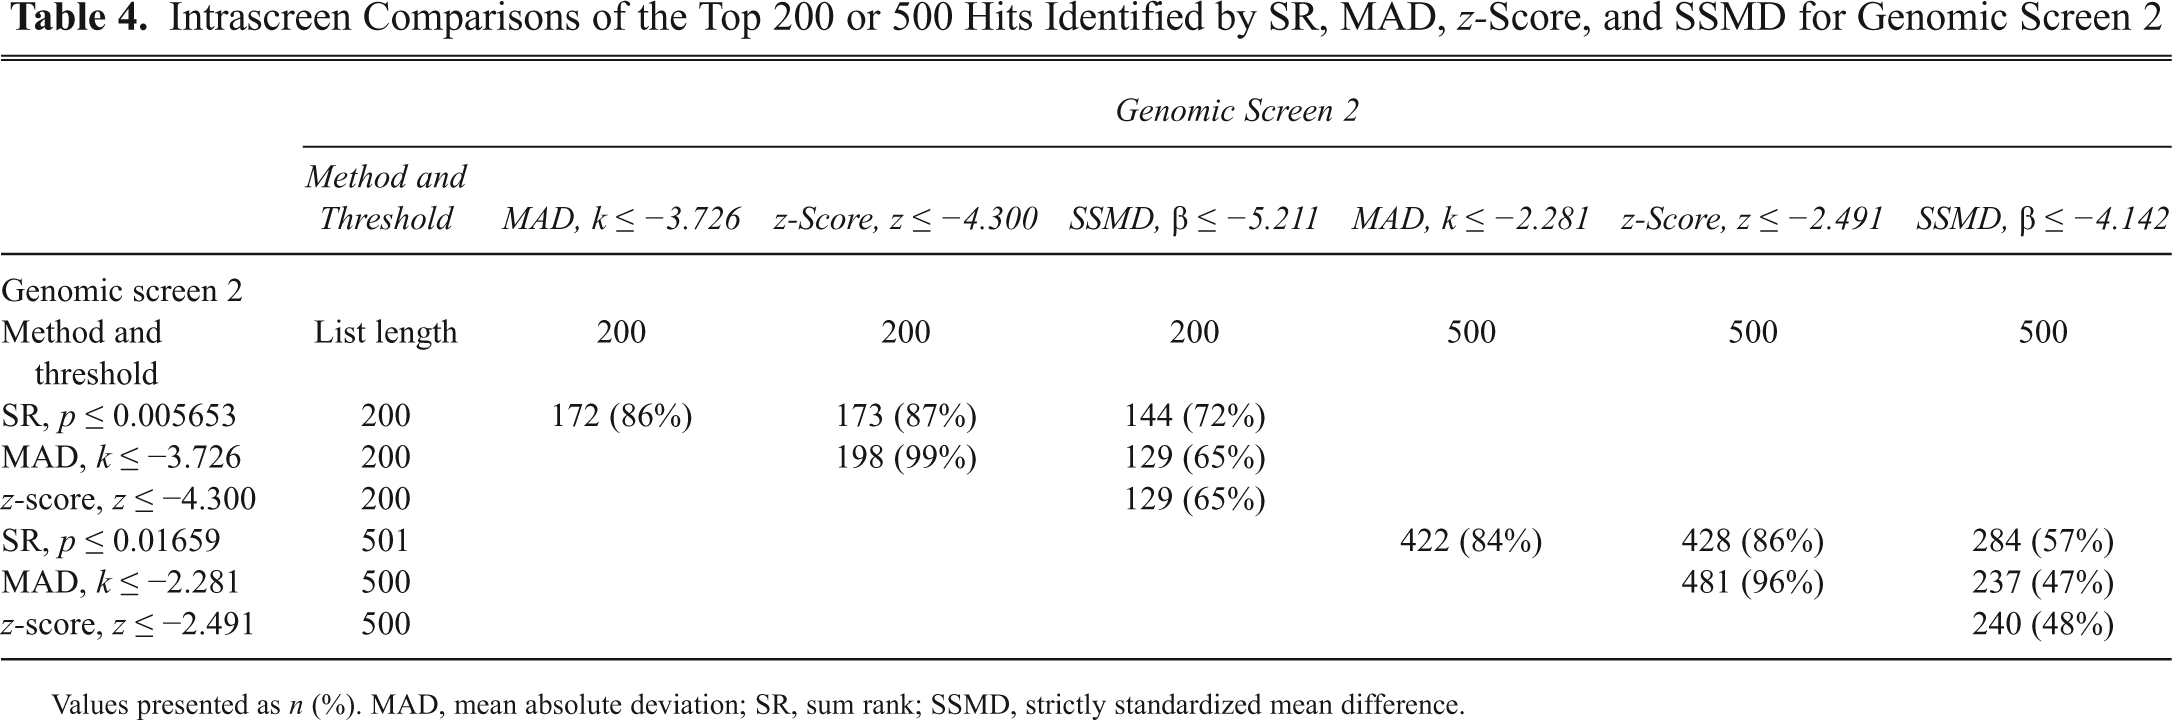
Values presented as n (%). MAD, mean absolute deviation; SR, sum rank; SSMD, strictly standardized mean difference.
Intrascreen comparison of analysis methods using fixed-length hit lists
To examine the impact of analysis methodology on the composition of hit lists, we determined the intrascreen overlap of identified targets using each method. Intrascreen overlap illustrates to what extent the results of differing analysis methods agree with respect to identifying the same factors. The thresholds determining the top 200 and top 500 hits lists for GS1 by the SR, MAD, z-score, and SSMD methods are illustrated in
The intrascreen overlap for the SR, MAD, z-score, and SSMD methods as applied to GS2 is tallied in
Overlap of the GS1 and GS2 hit lists
The interscreen reproducibility was measured by comparing the overlap of the top 200 and/or top 500 hits generated for each analysis method, SR, MAD, z-score, and SSMD, from GS1 to the top 200 and top 500 hit lists generated from GS2.
Interscreen Comparisons between Lists Identified by SR, MAD, z-Score, and SSMD for Either 200 or 500 Hits
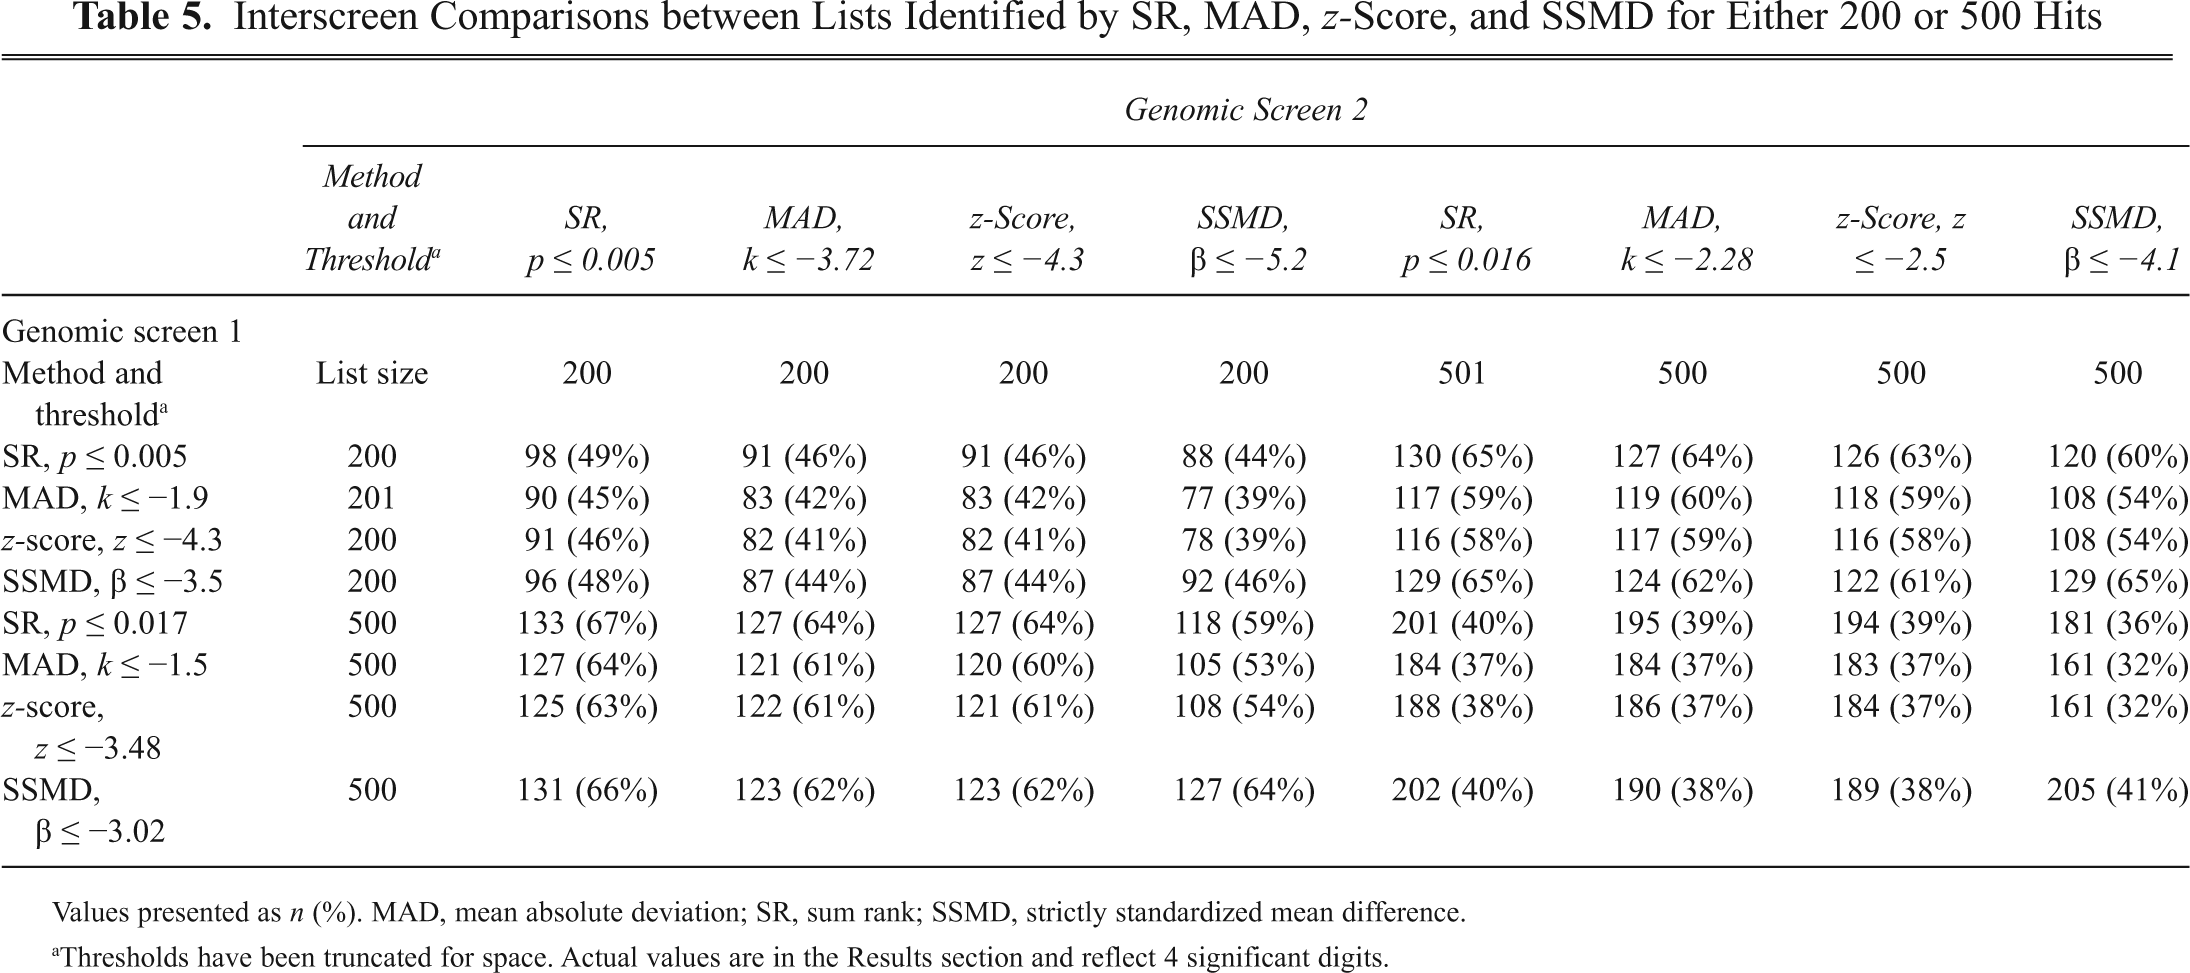
Values presented as n (%). MAD, mean absolute deviation; SR, sum rank; SSMD, strictly standardized mean difference.
Thresholds have been truncated for space. Actual values are in the Results section and reflect 4 significant digits.
Discussion
The work presented here is the first published study to experimentally define the factors that influence reproducibility between genome-scale siRNA screens. The high-throughput loss-of-function genomic screening community has reached a critical milestone in the application of this promising technology. Multiple teams have completed whole-genome siRNA-based screens for factors involved in the same biological system, and the obvious first reaction was to compare the overlap between related screens. 6-8 This seemingly straightforward task resulted in a marked lack of overlap among the published hit lists. A comprehensive meta-analysis attempted to reconcile the data from these substantially different assay systems and did produce some additional overlap of gene families. 19 Without a clear idea of the reproducibility expected, interpretation of the limited overlap was clouded. Our study attempts to shed light on the issue of the reproducibility of genome-scale siRNA screening and provide a context for interpretation of published screening data.
Within 6 months, 2 human whole-genome siRNA-based screens were completed. The genomic screens rigorously adhered to the same protocols, used the same instrumentation and the same batch of virus, and were performed by the same team. The only intentional difference was the 4 months separating the completion of GS1 and beginning of GS2. Variables that were not accounted for included changes in the batches of reagents and the passages of the cell line.
The 2 × 2 pooled library format described in
Off-target effects are defined as changes in gene expression for genes not intentionally targeted by the siRNA design. Jackson et al.
14
demonstrated that decreasing the effective concentration of siRNA targeting MAPK14 decreased OTEs while preserving the integrity of the target-specific knockdown. They also noted some OTEs could not be titrated away. Our assay conditions were designed to minimize OTE by using a relatively low effective siRNA concentration of 15.4 nM (7.7 nM for each siRNA) when compared to other published screens (
We addressed the impact of screening format on OTE as well as reproducibility by examining the effect of pooled siRNA duplexes on cell density. In this case, effects on cell density can be considered an unintended or OTE. The scatter plots from
Recently, Brass et al. 21 published a screen that identified factors influencing H1N1 propagation in a human model cell line that used 3 tests of the same pool of 4 siRNA duplexes. This study reported 334 targets from the primary screen, and a follow-up screen to deconvolute the pools resulted in 40% of the 334 putative hits being confirmed by at least 2 independent siRNAs. As a contrast, consider the screen by Zhang et al. 22 for modifiers of circadian cycle. The authors here used the pooled 2 × 2 format and followed up on hits that scored well in both independent tests. Of the 343 putative hits, 78% reconfirmed with 2 or more siRNAs eliciting a strong effect in a validation screen. Despite screening the genome 3 times, representing a 50% increase in the workload relative to Zhang et al., 22 Brass et al. 21 did not improve the resolution of the mRNA function.
Our study used the data from each of the four 74 plate sets—GS1AB, GS1CD, GS2AB, and GS2CD—as batches for analysis for several reasons. On each 384-well plate, 4 negative siGFP and 4 positive si-vATPase controls were arrayed. Both SSMD and z-score methods require a comparison to a negative control set, so the minimum data set for analysis must be 1 assay plate. Zhang et al.
23
demonstrated using SSMD how variability in control wells contributed strongly to the calculated assay performance. This indicated that opportunities to combine more plates into a single data set could mask the impact that normal variation in the negative control set had on the analysis. Furthermore, Qiagen manufactured its library in a systematic fashion. Consequently, 65% of the siRNA duplexes targeting the G-protein-coupled receptor (GPCR) family members were arrayed on a single plate, and the remaining ones were distributed on 2 adjacent plates. Other gene families are arrayed similarly. SR used the population to determine a hit, so any population with significant bias would inhibit the application of SR, and thus we chose larger data sets to provide protection from plating bias.
Genomic screening is costly. Significant resources are invested during assay development to determine how best to pursue factors involved in a biological system. It seems contradictory that the investment in the cell-based assay has not been complemented by an investment in understanding the interpretation of screening results. We measured the reproducibility between 2 genomic screens by directly testing how much overlap there was between specific analysis methods. Applying the statistical methods SR, MAD, z-score, and SSMD by following the recommendations of each method’s authors produced a broad range of overlap. 10-13 It would seem in some cases that there was little overlap between identical screens. Unfortunately, the length of the hit lists was dramatically different. For example, in the comparison between SSMD in GS1 and GS2, the potential overlap could include all 513 hits from GS1, but the potential overlap is only 45% of the 1140 hits in GS2. Furthermore, it was difficult to assess the reproducibility between hit lists within a single screen because the different analytical methods produced significantly different length lists.
To compare methodologies within and between genomic screens, we chose to compare lists composed of the same number of hits. The top 200 hits for any method produced between 39% and 49% overlap. Expanding the list to include the top 500 hits did not improve the apparent reproducibility as the range was 32% to 41% overlap. The best indication that genomic data are regularly reproducible was established by comparing the top 200 from any individual method to the top 500 from the alternate screen. This situation reflects the stochastic nature of biological assays. A subset of siRNA targets will always score particularly well because the siRNAs are robust, the gene is easily silenced, or the gene is simply at a critical juncture in a system or pathway. Other siRNAs that may score strongly in one assay but only moderately in a second assay demonstrate that some pathways may be more resistant or adaptable to change or some genes are not as efficiently silenced as others. Thus, a gene that strongly inhibited infection in one screen did not necessarily strongly inhibit infection in the other screen, but it was highly likely to perform well.
As a standard practice, when comparing genomic screens, one must consider the behavior of assay wells that did not make the top tier hit lists. Unlike other “-omic” technologies such as microarray analysis of gene expression, proteomic studies of protein abundance, and genotyping via deep sequencing, the results of siRNA loss-of-function studies are not directly quantitative. The relative strength of the “score” in the phenotypic assay may not be directly related to the abundance of a required target protein. Due to difference in effective concentration and stoichiometry of reactions involved, the strength of a complex phenotypic score is very unlikely to scale proportionally with protein levels. A target that scores only moderately in a screen may be absolutely required, but due to factors such as siRNA efficiency, protein half-life, and message abundance, the protein levels may only be reduced 30% in the course of the assay. This makes generation of “hit lists” a troubling facet of siRNA screening and certainly contributes to overlap and reproducibility. To alleviate these issues, the authors of screens should make available the performance of all the wells in a genomic screen at the time of publication, similar to what is currently done for microarrays.
The dual genomic screens identified reproducibility that exceeded 67%. This is the strongest published overlap for 2 complete screens. The 2 × 2 pooled siRNA library format and low siRNA concentration provided an efficient assay design to identify strong candidates without the costly validation screening. We demonstrated that each siRNA pool behaves quite reproducibly with respect to VOC and posit that independent siRNA pools tested against the same system would provide more robust final data sets. The best practice we can promote at this time is that researchers use several analysis strategies and that all relevant data from each control and each experimental well be provided to future researchers as is the case for microarray and genome-wide association studies.
Footnotes
Acknowledgements
The project described was supported in part by NIH grants to MGB (1 R21 AI064925 and U54 AI057157) from the Southeastern Regional Center of Excellence for Emerging Infections and Biodefense. Its contents are solely the responsibility of the authors and do not necessarily represent the official views of the NIH. The Duke RNAi Screening Facility was supported by NIH S10 1SA0RR024572-01, North Carolina Biotechnology Center, Duke Institute for Genome Sciences & Policy, Duke Comprehensive Cancer Center, and Duke School of Medicine.