
Abstract
This study describes the screening of a plant extract library for inhibitors of signal transduction pathways mediated by the cholecystokinin receptor, CCK1. CCK1 receptors are coupled to Gαq/11-proteins, localized mainly in the gastrointestinal tract, and implicated in the regulation of various digestive functions. A primary screen was performed using a cell-based assay that used the β-lactamase gene reporter controlled by the transcriptional activator NFAT. The assay was validated with the CCK1 receptor antagonist, lorglumide, and automated by the use of a liquid-handling robot MultiProbe II. Off-target hits were triaged by counterscreening against gene reporter cells activated by a combination of thapsigargin and phorbol ester. Purification of active compounds was guided by the β-lactamase gene reporter and Ca2+ mobilization assays. Pure compounds were characterized by Ca2+ mobilization, radioligand binding, inositol-1 phosphate formation, and Eu-GTP binding assays. The selectivity of inhibition was tested against a panel of Gαq/11, Gαs, and Gαi/0-coupled receptors. These studies led to the identification of a novel Gαq/11-selective inhibitor.
Introduction
A
In this article, we describe the screening of a plant extract library for inhibitors of signal transduction pathways mediated by the cholecystokinin receptor, CCK1. Cholecystokinin is a peptide hormone that is present in several forms, all derived from the 115 amino acid precursor. 6 One of the most predominant forms, the C-terminal sulfated octapeptide, CCK-8, was used in this study. Cholecystokinin is produced both in brain and in peripheral tissues. The biological actions of cholecystokin are mediated by 2 G-protein-coupled receptors, CCK1 and CCK2. Both receptors are predominantly coupled to Gαq/11 proteins, which activate phospholipase C and trigger formation of 2 second messengers, inositol 1,4,5-triphosphate (IP3) and 1,2- diacylglycerol, leading to the release of intracellular Ca2+ and the activation of protein kinase C. CCK2 receptors are present predominantly in the brain, whereas CCK1 receptors are localized mainly in the gastrointestinal tract, including the large bowel, pyloric and esophageal sphincters, and pancreas, where they regulate various digestive functions. CCK1 antagonists might have an application in the treatment of irritable bowel syndrome, gastroesophageal reflux disease, and pancreatic disorders. 7
This article describes the development and validation of a β-lactamase gene reporter assay to detect plant-derived inhibitors of CCK1 receptor signaling, primary screening and counterscreening strategies, bioassay-guided isolation of active compounds, and mechanism of action studies. These studies have led to the identification of a novel Gαq/11-selective inhibitor.
Materials and Methods
Cholecystokinin
Cholecystokinin octapeptide, sulfated, (CCK) was purchased from Peninsula Laboratories (#H-2080; San Carlos, CA). The peptide was first dissolved in 1 M NH4OH at a concentration of 5 mM, then diluted in water to 10 µM, aliquoted, and stored at −20°C.
Plant extract library
The plant extract library consisted of 4004 organic extracts and 2728 aqueous extracts. The library was generated as previously described. 3 Briefly, dried ground plants were extracted using the ASE 300 Extractor (Dionex, Sunnyvale, CA), first with a 1:1 mixture of dichloromethane/MeOH (organic extracts), followed by water (aqueous extracts). The organic extracts were dried by evaporation under reduced pressure in a rotary evaporator, whereas the aqueous extracts were freeze-dried. Dried organic and aqueous extracts were dissolved in DMSO and water, respectively, to a final concentration of 35 mg/mL. The initial fractionation of the crude extracts was performed using a Hitachi (Tokyo, Japan) high-throughput purification system. Organic extracts (400 mg) were loaded onto a prepacked silica gel column and eluted with a gradient mobile phase of (A) 50:50 EtOAc/hexane and (B) methanol from 100% A to 100% B. Eighty-eight fractions were collected for each extract, dried under low vacuum, and dissolved in 1.5 mL DMSO. Aqueous extracts (750 mg) were loaded onto prepacked C18 reverse-phase columns and eluted with a gradient mobile phase of (A) water and (B) methanol from 100% A to 100% B. The 88 fractions for each extract were collected, freeze-dried, and dissolved in 1.5 mL H20.
Assay-guided purification and identification of the compound 362-63-08
The plant Ardisia crenata (aerial part) was purchased from a local nursery in South Korea, and 200 g of starting material was prepared by extraction with 100% MeOH at 50°C. The extract was enriched by passing through a CG-161 flash column (TOSOHAAS). The column was washed first with 50% methanol and then with a 75% MeOH/0.1% NH4OH mixture. Then, 1.5 g of material containing the active compound was eluted by 100% methanol.
The enriched material was loaded onto a Luna C18 column (Phenomenex, Torrance, CA) and eluted at a 2-mL/min flow rate with the following gradient: 0 to 3 min, 70% MeOH/0.1% NH4OH; 3 to 5 min, 70% to 75% MeOH/0.1% NH4OH; 5 to 35 min, 75% to 100% MeOH/0.1% NH4OH; and 35 to 45 min, 100% MeOH. CCK inhibitory activity in each fraction was monitored by the β-lactamase gene reporter assay. Fractions containing active compound (64 mg) were combined and passed again through the same column under the same conditions, yielding 20 mg of pure active compound.
Nuclear magnetic resonance (NMR) data on pure compound 362-63-08 were collected on a Varian (Palo Alto, CA) VNMRS 500-MHz spectrometer. UV and MS spectra were obtained on a liquid chromatography mass spectrometry (LCMS; Hitachi M-8000) and photodiode array detector (PDA; Hitachi L-4500A) system.
CCK1-expressing cells
A full-length cDNA encoding human CCK1 was purchased from Open Biosystems (Huntsville, AL; IMAGE ID: LIFESEQ95000473CA2). The cDNA was amplified using the primers CACCATGGACTACAAGGACGATGATGACAAGAT GGATGTGGTTGACAGCCTTCTTG and TCACTGGGGT GGCACCGAGGCACTC, which introduced a FLAG epitope (DYKDDDDK) in-frame with the first methionine of CCK1. This fragment was subcloned into the pcDNA3TOPO expression vector (Invitrogen, Carlsbad, CA).
NFAT-bla-CHO-K1 cells containing the NFAT-β-lactamase reporter construct were purchased from Invitrogen (K1078). The cells were maintained in Dulbecco’s modified Eagle’s medium (DMEM) supplemented with insulin-transferrin-selenium-G supplement, minimum essential medium (MEM) nonessential amino acids, penicillin-streptomycin, and 10% dialyzed fetal bovine serum. The CCK1 expression construct was transfected using Effectene reagent (QIAGEN, Valencia, CA), and transfectants were selected with 500 µg/mL of G418. The cells that exhibited the strongest response to CCK were isolated using a fluorescence-activated cell sorter. Briefly, the cells were serum starved 1 day prior to the experiment and then stimulated with 10 nM CCK for 5 h. Then, 15 × 106 cells were trypsinized and resuspended in 15 mL of Ca2+, Mg2+-free Hanks buffered saline solution (HBSS) containing 1 mM HEPES, 2.2 µg/mL β-lactamase substrate CCF2-AM, and 1 mg/mL Pluronic F-127 for 2 h at room temperature. Cell sorting was performed by the ARIA cell sorter (Becton Dickinson, Franklin Lakes, NJ) equipped with a 405-nm laser and 450-nm and 525-nm emitters separated by a 505-nm long-pass dichroic mirror. The cells were sorted at 25 psi sheath pressure through a 100-µm nozzle. The cells that exhibited the brightest fluorescence in the blue channel (450 nm) were isolated, pooled, and expanded. Thereafter, the enriched population was resorted, and the clonal cell lines were established and scored by the β-lactamase gene reporter assay (see below).
To obtain cells with a high level of CCK1 expression, the CCK1 construct was transfected into HEK293A cells (Invitrogen). Cell maintenance and selection conditions were the same as those for the NFAT-bla-CHO-K1 cells. Stable transfectants were stained with FITC-conjugated anti-FLAG antibody m2 (Sigma-Aldrich, St. Louis, MO), and a subpopulation of high CCK1-expressing cells was isolated by 2 rounds of flow sorting.
β-lactamase gene reporter assay
CCK1-CHO-NFAT-bla cells were seeded 20 to 24 h prior to the experiment on black wall, clear-bottom, half-area 96-well plates (3882; Costar, Corning, New York, NY) in 45 µL of media and at a density of 10,000 cells/well.
Test reagents with or without agonists were formulated at 10× concentration in serum-free DMEM containing 5% bovine serum albumin (BSA). The final concentration of DMSO in the assay did not exceed 0.4% v/v. Plant extracts and test compounds were first diluted in V-bottom 96-well plates to 10× concentration in the media containing no stimulants, 10 nM CCK, or a mixture of 0.5 µM phorbol 12-myristate 13-acetate (PMA) and 0.5 µM thapsigargin. The plates were centrifuged for 10 min at 3000 g, and supernatants were collected. Then, 5 µL of 10× test reagents was added to the cell wells followed by incubation at 37°C for 6 h. Thereafter, the cells were equilibrated at room temperature for 20 min and loaded with 6× β-lactamase substrate CCF2-AM using the GeneBLAzer kit (K1032, Invitrogen), as outlined in the manufacturer’s protocol. Briefly, for one 96-well assay plate, the reagents were mixed in the following order: 10 µL of 1.1 mg/mL CCF2-AM in DMSO, 53 µL of 100 mg/mL pluronic-F127 and 0.1% acetic acid, 66 µL of 100 mM probenecid, and 1.11 mL 24% PEG400 and 18% TR40. Then, 10 µL of this mixture was added to the wells, and the cells were incubated for 2 h at room temperature in the dark.
Fluorescence was measured from the bottom of the plate using the microplate reader Victor2 (PerkinElmer, Waltham, MA) equipped with filter set APR1 from Chroma Technology (Rockingham, VT; excitation 405 nm, emission 460 nm and 530 nm). The response was calculated as the ratio of emission at 460 nm to emission at 530 nm.
Ca2+ mobilization assay
The effects of the test compounds on CCK-induced Ca2+ mobilization were evaluated using CHO-K1 or 293A cells stably transfected with CCK1. The cells were seeded 20 to 24 h prior to the experiment on 96-well poly-lysine-coated plates (354640, Becton Dickinson) in 80 µL of media, at a density of 5 × 10⁴ cells/well. Ca2+ mobilization was measured using the FLIPR Calcium 4 assay kit (R8142; Molecular Devices, Sunnyvale, CA). Then, 2× cell loading reagent was prepared by dissolving the contents of 1 vial in 10 mL of the assay buffer containing HBSS (Invitrogen), 0.8 mM CaCl2, 0.5 mM MgCl2, 0.4 mM MgSO4, 20 mM HEPES, and 1 mg/mL BSA. Thereafter, 100 µL of 100 mM probenecid was added to the vial; 80 µL of 2× cell loading reagent was added to the wells, and the cells were incubated for 1 h at 37°C followed by 15 min at room temperature. Thereafter, 20 µL of test compounds or assay buffer (control) was added to the wells. Test compounds were initially dissolved either in DMSO (crude plant extracts) or MeOH (pure compound 362-63-08). The final concentrations of DMSO (0.1%) and MeOH (0.2%) were kept constant across all samples and controls. After 20 min of incubation with test compounds, the assay plates were positioned on a GeniusPro plate reader (Tecan, Foster City, CA) equipped with injectors. The cells were stimulated by injecting 20 µL of CCK formulated in the assay buffer. Changes in fluorescent intensity were measured for 1 min at 1-s intervals. The results were expressed as the ratio of maximal fluorescent intensity observed within a 1-min period to fluorescent intensity of cells prior to CCK injection.
IP1 assay
The effect of compound 362-63-8 on CCK-induced formation of inositol 1-phosphate (IP1) was evaluated using the IP-One kit (homogeneous time-resolved fluorescence [HTRF]; CisBio, Bedford, MA). The assay is based on competition between natural and dye-conjugated IP1 for binding to the Eu-labeled anti-IP1 antibody. The specific signal is inversely proportional to the amount of IP1 produced by the cells. 293A cells stably expressing CCK1 were plated 20 h prior to the experiment in wells of a 384-well plate (Greiner 781080) at a density 6 × 10⁴ cells/well. Immediately prior to the experiment, the media were discarded and the wells replenished with 10 µL of the assay buffer, which included 10 mM HEPES (pH 7.4), 1 mM CaCl2, 0.5 mM MgCl2, 4.2 mM KCl, 146 mM NaCl, 5.5 mM glucose, and 50 mM LiCl. Thereafter, 10 µL of the following 2× test reagents in the assay buffer was added to the wells: 0.2% DMSO (negative control), 200 nM CCK in 0.2% DMSO (positive control), 10 µM compound 362-63-8 in 0.2% DMSO or mixture of 200 nM CCK, and 10 µM compound 362-63-8 in 0.2% DMSO. The cells were incubated for 6 h at 37°C. Thereafter, 7 µL IP1-dye conjugate (fluorescence resonance energy transfer [FRET] acceptor) followed by 7 µL anti-IP1 antibody-Eu conjugate (FRET donor) was sequentially added to the wells. Both conjugates were formulated in the cell lysis buffer of 50 mM phosphate buffer (pH 7.0), 0.8 M potassium fluoride, 1% Triton X100, and 0.2% BSA. As a blank (no acceptor), 7 µL of cell lysis buffer alone was used, instead of IP1-dye conjugate. After 60 min at room temperature, the fluorescence transfer was measured using a GeniusPro plate reader by excitation at 337 nm and emissions at 620 nm (donor emission) and 665 nm (acceptor emission). The response was calculated from the ratio of 665-nm emissions to 620-nm emissions and expressed as DeltaF% using the following formula: DeltaF% = [(Sample Ratio – Blank Ratio)/Blank Ratio] × 100%.
[125I]CCK binding
Membranes of CHO-K1 cells expressing CCK1 (4 µg protein) were incubated for 60 min at 22°C with 0.08 nM [125I]CCK in the absence or presence of the test compounds in the assay buffer containing 10 mM HEPES-KOH (pH 7.4), 5 mM MgCl2, and 0.02% bacitracin. Test compounds were dissolved in MeOH and diluted in the assay buffer. The final concentration of MeOH was kept constant at 0.2% across all samples. Nonspecific binding was determined in the presence of 1 µM cold CCK. Following incubation, the samples were filtered rapidly under vacuum through glass fiber filters (GF/B, PerkinElmer) and rinsed several times with ice-cold buffer containing 50 mM Tris-HCl and 0.5% BSA using a 96-sample cell harvester (Unifilter, PerkinElmer). The filters were dried and then counted for radioactivity in a scintillation counter (TopCount, PerkinElmer) using a scintillation cocktail (Microscint-0, PerkinElmer).
GTP-Eu binding assay
The effect of compound 362-63-8 on CCK-induced guanosine triphosphate (GTP) binding was evaluated using membranes prepared from 293A-CCK1 cells. The assay used the competitive energy transfer disruption method (HTRF, CisBio). To prepare membranes, the cells were detached from culture flasks with phosphate-buffered saline (PBS) containing 1 mM EDTA and 1 mM EGTA and centrifuged at 200 g for 10 min. Then, 3 × 10⁸ cells were resuspended in 10 mL of lysis buffer: 5 mM Tris-HCl (pH 7.5), 5 mM EDTA, 5 mM EGTA, and 100 µM phenylmethanesulfonylfluoride (PMSF). The cells were homogenized by sonication (3 × 10-s × 15-W bursts) at 4°C. The homogenate was centrifuged at 300 g for 10 min, and then the supernatant was collected and centrifuged at 29,000 g for 2 h at 4°C. The pellet was resuspended in 2 mL of 10 mM Tris-HCl (pH 7.5) to a concentration of 0.5 mg/mL, aliquoted, and stored at −70°C. The GTP binding assays were performed in U-bottom 96-well plates. The reaction was initiated by adding 20 µL (10 µg protein) of membrane suspension to 80 µL of reaction buffer containing 50 mM HEPES (pH 7.3), 6.25 mM MgCl2, 125 mM NaCl, 0.625 mg/mL saponin, and 12.5 µM guanosine diphosphate (GDP). Where indicated, the compound 362-63-08 in DMSO was added to a final concentration of 2.5 µM. The concentration of DMSO in the reaction buffer was kept at 0.625% across all samples. In some samples, the reaction buffer was also supplemented with 1.25 µM CCK. After 30 min of preincubation at room temperature with shaking, europium-labeled GTP (PerkinElmer) was added to a final concentration of 10 nM. Incubation was continued for another 30 min, after which the samples were transferred to AcroWell GHP filter bottom 96-well plates (Pall Life Sciences, East Hills, NY). The samples were passed through the filters by centrifugation at 2000 g. The filter plate wells were washed by centrifugation with ice-cold buffer (50 mM Tris-HCl [pH 7.5], 10 mM MgCl2). The bound GTP-Eu was measured with a microplate reader Victor2 (PerkinElmer) using the factory-set protocol for europium measurement. Nonspecific binding was determined by including 5 µM GTPγS in the reaction buffer.
The assays describing stimulation of Ca2+ mobilization by the bradykinin B1 and the adrenergic α1A receptors, inhibition of cAMP production by cannabinoid CB1 receptor, and stimulation of cAMP production by adrenergic B2 receptor can be found in the supplemental information online.
Results
Development of a β-lactamase gene reporter assay
The β-lactamase gene reporter assay 8 was used for primary screening. In this assay, target cells are loaded with the fluorescent substrate, CCF2-AM, which consists of 2 fluorophores, 7-hydroxycoumarin and fluorescein. In the absence of β-lactamase activity, excitation of coumarin at 405 nm results in FRET to fluorescein and emission of green fluorescence signal at 530 nm. β-Lactamase cleaves the linker between coumarin and fluorescein, disrupting FRET and shifting the signal toward the blue emission of coumarin with a maximum at 460 nm. The response of cells is calculated as the ratio of emission at 460 nm to emission at 530 nm.
CCK1 is a Gαq/11-coupled receptor that mediates intracellular signaling by activating phospholipase C. Activated phospholipase C hydrolyzes phosphatidylinositol 4,5-bisphosphate and produces 2 second messengers, inositol 1,4,5-trisphosphate, which releases Ca2+ from intracellular stores, and diacylglycerol, which activates protein kinase C. Both pathways converge on a transcriptional enhancer induced by nuclear factor of activated T cells (NFAT). CCK1 was stably expressed in CHO-K1 cells that contained a reporter construct with the β-lactamase reporter downstream of NFAT-activated transcriptional elements.
9,10
The most responsive clones were isolated by fluorescence-activated cell sorting. As shown in
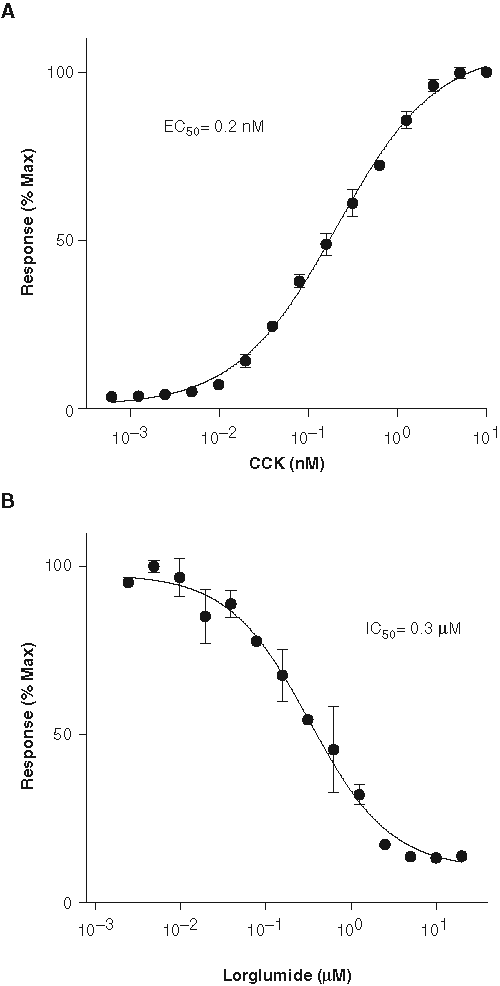
Validation of the β-lactamase gene reporter assay. (
Primary screen
The optimal dilution of the plant extracts was determined by testing 264 randomly chosen samples. Plant extracts that caused 50% or more inhibition of the CCK-induced response were considered positive. The hit rate was arbitrarily set at 5%. Accordingly, to achieve this hit rate, aqueous and organic extracts were used at final concentrations of 280 µg/mL and 140 µg/mL, respectively. The screen was automated using the liquid-handling robot MultiProbe II (PerkinElmer), and assays were performed in triplicate, with each plant library plate being dispensed to 3 assay plates (29, 29, and 30 plant extracts per assay plate). Each assay plate included 1 positive control (1 nM CCK) and 1 negative control (vehicle). In addition, some plant extracts were spiked with 5 µM of the reference antagonist lorglumide. To analyze primary screening data, we designed an Excel template that included 3 cutoff parameters: gene reporter activity (expressed as percentage of gene reporter activity in the positive control cells), coefficient of variation, and incorporation of β-lactamase substrate (expressed as percent substrate incorporation into positive control cells). If any sample did not conform to the set parameters, its value was automatically converted to zero using the “IF” operator in Excel. An example of the data analysis template is shown in
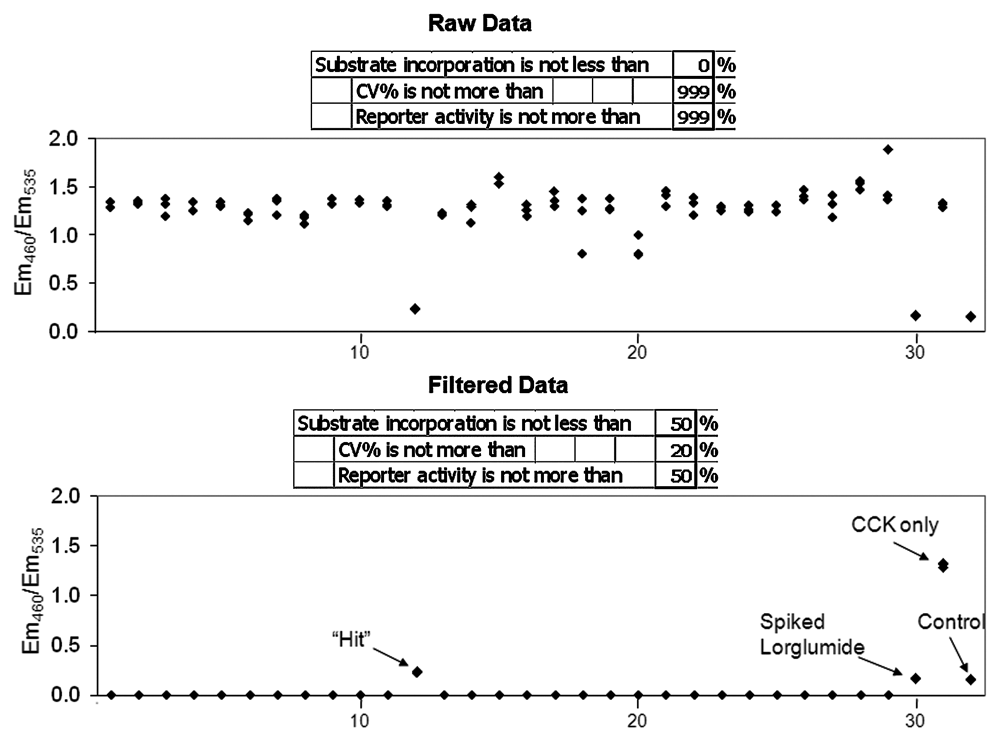
An example of the data analysis template. Twenty-nine organic plant extracts, representing 1 assay plate, were tested in triplicate for inhibition of the β-lactamase gene reporter induced by 1 nM CCK. Where indicated, some wells contained only vehicle (control), CCK but no plant extract (CCK only), or CCK plus 5 µM lorglumide (spiked lorglumide). Cutoff parameters set in the boxes above each scatter plot were substrate incorporation (expressed as percentage of substrate incorporated in CCK-only treated cells), percent coefficient of variation (CV%), and gene reporter activity (expressed as percent activity of CCK-only treated cells). The values of the samples that did not conform to any cutoff parameter were automatically converted to zero using the “IF” operator in Excel. Both scatter plots were obtained from the same set of samples. In the upper panel (Raw Data), the cutoff parameters were set liberally, whereas in the lower panel, the cutoffs used for the primary screen were more stringent (Processed Data). The numbers of samples are indicated along the x-axes.
Counterscreen
To triage off-target hits, the gene reporter was activated downstream of CCK1 by a combination of PMA, which activates protein kinase C, and thapsigargin, which raises cytosolic calcium. In combination, these agents mimic the downstream effects of phospholipase C and induce the NFAT-regulated gene reporter as efficiently as CCK. All the hits identified in the primary screen were retested in the presence of 1 of the 2 activators, either PMA, plus the thapsigargin mixture, or CCK (
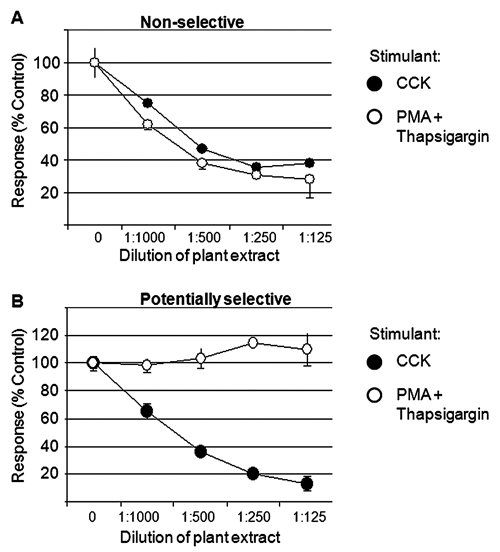
Examples from the counterscreen. (
Hit confirmation by Ca2+ mobilization assay
Two selective hits were next tested for the ability to inhibit CCK-induced Ca2+ mobilization. Because crude plant extracts often interfere with fluorescent Ca2+ mobilization assays, the extracts were first subfractionated into 88 fractions using low-resolution silica gel chromatography. The fractions that were the most potent in inhibiting the CCK-induced β-lactamase reporter were combined and retested by the Ca2+ mobilization assay (
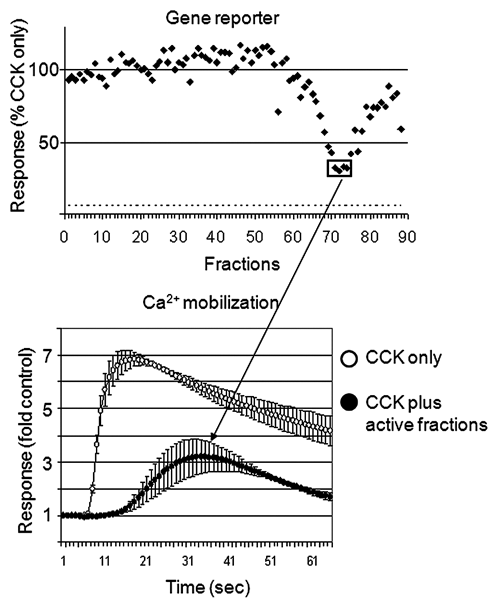
An example of hit confirmation. An organic extract that passed the counterscreen test was fractionated into 88 fractions using a silica gel column. Each fraction was tested individually for the ability to inhibit CCK-induced β-lactamase gene reporter (upper panel). The fractions that were the most potent inhibitors of the CCK-induced reporter were combined and tested for the ability to inhibit CCK-induced Ca2+ mobilization.
Testing of pure compounds
Active compounds were purified by a series of chromatography procedures guided by the gene reporter assay. The active ingredients in one extract were found to be a series of related polyphenol compounds and were not pursued further. Another extract from the Asian plant A. crenata contained a compound that inhibited a CCK-8-induced gene reporter with an IC50 value as low as 13 pM (
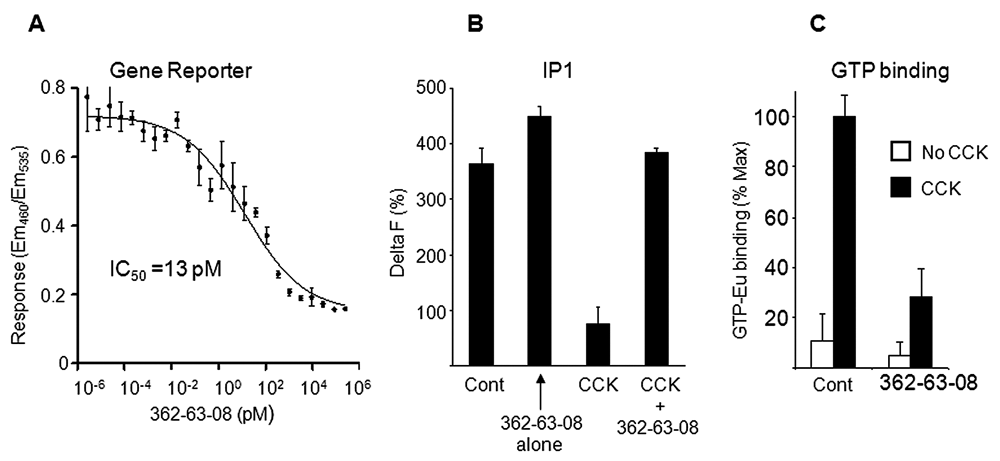
Inhibition of CCK-induced signal transduction by the compound 362-63-08. (
Compound 362-63-08 is an inhibitor of Gαq/11 protein
To decipher the mechanism of action for compound 362-63-08, different doses of the compound were tested against a single concentration of CCK (80 pM) in 2 parallel assays: receptor binding and Ca2+ mobilization. As shown in
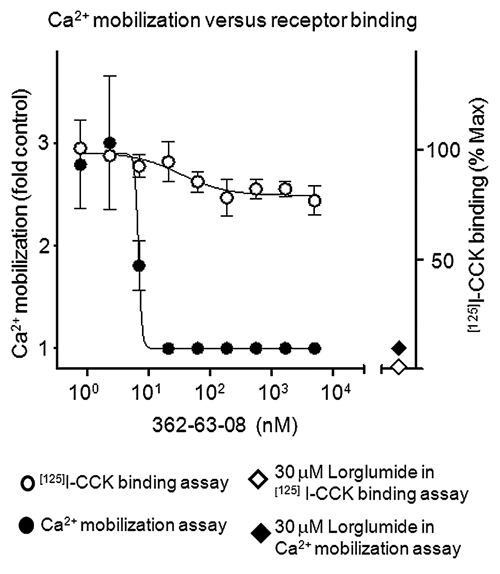
The effects of compound 362-63-08 on CCK receptor binding and CCK-induced Ca2+ mobilization. Closed circles: CHO-K1 cells stably expressing CCK1 receptor were treated with different amounts of the compound 362-63-08 and 0.08 nM of unlabeled CCK. CCK-induced Ca2+ mobilization is expressed as fold control and plotted along the left y-axis. Open circles: membranes of CHO-K1 cells stably expressing CCK1 receptor were treated with different amounts of the compound 362-63-08 and 0.08 nM of [125I]CCK. The amount of bound [125I]CCK expressed as percentage of maximal binding is plotted along the right y-axis. Where indicated, 30 µM lorglumide was used as a positive control for both Ca2+ mobilization (closed diamonds) and [125I]CCK binding (open diamonds) assays.
Together with the observation that compound 362-63-08 inhibited CCK-induced GDP for GTP exchange (
Structure determination of the compound 362-63-08 (
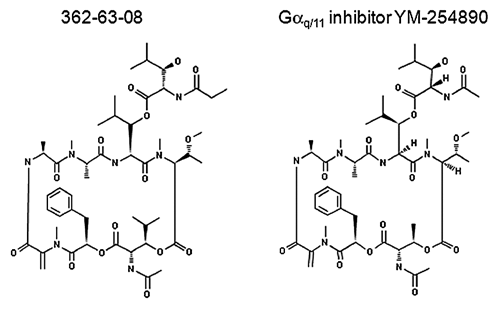
Molecular structures of compound 362-63-08 and Gαq/11-selective inhibitor YM-254890.
Discussion
Compounds that target cholecystokinin receptors have been pursued by a number of groups. These studies used both high-throughput screening and rational design approaches, 7,13,14 typically guided by receptor binding assays. To the best of our knowledge, β-lactamase-based gene reporter screens have not been used to search for inhibitors of CCK-induced pathways. The advantages of the β-lactamase assay include homogeneous format, physiological level of receptor expression, ratio-metric readout, and the ability to detect a broad spectrum of active compounds, including receptor antagonists, noncompetitive allosteric modulators, and inhibitors of receptor-mediated signaling pathways. In addition, due to the presence of a fluorescent quencher, this assay is relatively resistant to artifacts caused by fluorescent contaminants often found in crude plant extracts.
As in any assay where targets and readouts are functionally connected by several signal transduction events, gene reporter assays are prone to off-target hits. False-positive hits are commonly triaged by counterscreening against another receptor of the same class. We used an alternative approach, which did not require a different reporter cell line. For this purpose, we used the same reporter cells as those used in the primary screen, but we induced them downstream of CCK1 through a combination of PMA, which activates protein kinase C, and thapsigargin, which raises cytosolic calcium concentration. This approach allowed us to triage 385 of 387 (99.5%) primary hits. The validity of this counterscreening strategy was verified by measuring CCK-induced Ca2+ mobilization, a hallmark of activated Gαq/11-coupled receptors. Both plant extracts that passed the counterscreen test were also capable of inhibiting CCK-induced Ca2+ mobilization. In contrast, none of the 20 randomly chosen hits that were triaged by the counterscreen was active in this assay.
Altogether, of 6732 samples used in the primary screen, 2 plant extracts selectively inhibited both the CCK-induced gene reporter and Ca2+ mobilization. We used a gene reporter-guided purification to identify the active compounds in these 2 extracts. One extract was found to contain a series of polyphenol compounds that inhibited gene reporter only at relatively high concentrations. Because inhibitory effects of polyphenols are likely to be nonselective, these compounds were not studied any further. Another extract from the plant A. crenata contained cyclic depsipeptide, coded as 362-63-08, which inhibited the CCK-induced gene reporter with double-digit pico molar potency.
Several lines of evidence indicate that compound 362-63-08 is an inhibitor of trimeric Gαq/11 protein. First, compound 362-63-08 did not inhibit CCK receptor binding. At the same time, this agent inhibited all tested steps of the CCK-induced signal transduction cascade, including the very first step, in which GDT is exchanged for GTP. Second, compound 362-63-08 inhibited several Gαq/11-coupled receptors (activated by both peptide and nonpeptide agonists) but did not inhibit Gαi/0- and Gαs-coupled receptors. Third, the molecular structure of compound 362-63-08 closely resembles that of the bacterial metabolite YM-254890, a known Gαq/11-inhibitor. 12 It is noteworthy that the molecular structure of compound 362-63-08 was found to be identical to that of cyclic depsipeptide FR900359, 15 which was also extracted from A. crenata. Although the mechanism of action for compound FR900359 has not been defined, it has been shown to inhibit platelet aggregation and reduce blood pressure 15 in a manner comparable to that for YM-254890. 16-18 As such, by analogy with YM-254890, this agent might also have an application in the treatment of peripheral arterial disease and related vascular conditions. Despite its similarity to YM-254890, compound 362-63-08 features a unique amino acid composition, including the uncommon amino acid N-methyldehydroalanine and the novel amino acid N,O-dimethylthreonine. 15 It appears that compound 362-63-08 may be more potent than YM-254890 because it inhibits Ca2+ mobilization with an IC50 value around 7 nM, whereas the reported IC50 for YM-254890 is 180 nM. 12 It should be noted, however, that direct side-by-side testing of these 2 compounds is required to accurately compare their potencies.
In summary, this study describes the screening of an unfractionated plant extract library for functional inhibitors of a Gαq/11-coupled receptor. With minor modifications, this strategy can be applied to any other receptor that is coupled to a Gαq/11 protein.
Footnotes
Acknowledgements
We thank Drs. Jifu Zhao and Qi Jia at Unigen Pharmaceuticals, Inc. for helpful discussions.