
Abstract
Most assays used to monitor enzymatic activities can be considered detection-coupled assays (i.e., indirect measurement of an analyte by using another chemical reaction for detection). The major reason for this is that the analyte that indicates the activity of the reaction cannot be directly measured or specifically directly measured by conventional means, such as optical density, fluorescence, and so on. By coupling another reaction to the enzymatic reaction of interest, the activity of the reaction can be monitored without modification to the analyte itself. However, due to the additional coupling reaction between the analyte and the detection reagents, the dynamic range of the assay could be greatly limited by the coupling reaction, and the apparent parameters of the enzymatic reaction could be much different from its uncoupled counterpart, causing significant deviations for IC50 measurement for an inhibition reaction of the enzyme. By using exact solutions for both the enzymatic and the coupling reactions, the effects of the coupling reaction on the dynamic range and accuracy of the IC50 measurement are reviewed and evaluated. In addition, real examples are provided to further illustrate the problem and validate the analysis.
Introduction
C
However, when coupling assays are used for measuring activities of enzymatic reactions, the dynamic range of the original enzymatic reactions is superseded by the coupling reactions. Consequently, the reaction parameters of the enzymatic reactions, such as percentage conversion rate of the substrate and span of the steady state measured by the coupling assays, could be much different from their conventional sense. Therefore, quantification of a detection coupling assay can introduce deviations between the true values of interest and the measured ones. This is especially true for antibody-based detection technologies because the binding affinity between the detection reagent and the analyte is extremely high, and very low concentrations of the detection reagent are needed in comparison to the substrates of the enzyme. Up to now, the theoretical basis of coupling reactions and their effects on the quantification of the reaction of interest have not been thoroughly analyzed due to its mathematical complexity. This work is to provide detailed analysis of coupling assays using exact solutions and to review the limitations of coupling assays with useful benchmarks in assay development for IC50 measurements focusing on competitive inhibition of enzymatic reactions. In addition, real examples for positive and negative coupling assays are provided to demonstrate the problem and validate the analysis.
Materials and Methods
All calculations were performed using Microcal Origin 5.0 from MicroCal (Northampton, MA). Real examples of IC50 measurements for 2 kinases using the time-resolved fluorescence resonance energy transfer (TR-FRET) technology for both the positive and negative couplings were carried out in the Costar polystyrene 384-well black plates (Corning, Inc., Corning, NY). The measurements started with a 10.0-µL of a reaction mixture containing adenosine triphosphate (ATP), substrate, and a 2-fold titrated inhibitor, and then an equal volume containing the enzyme in the same buffer was added to the mixture at different times to obtain different reaction times for each IC50 curve. Finally, the reaction was stopped with the addition of 5.0 µL of the stopping/binding buffer containing the detection reagents, and the plates were read using the Envision multilabel plate reader (PerkinElmer, Waltham, MA). The IC50 values were calculated by fitting the data to equation (14) below.
For positive coupling, a known PKC inhibitor, 3 Ro-32-0432 (Calbiochem, San Diego, CA), was used as an example for the IC50 measurements. A kinase buffer (Molecular Devices, Sunnyvale, CA) containing 3.0 mM dithiothreitol (DTT; Pierce, Rockford, IL) and 5% DMSO (Merck, Gibbstown, NJ) was used for the kinase reaction, and a stopping/binding buffer (Invitrogen, Carlsbad, CA) containing 15.0 mM EDTA and 0.5 nM terbium (Tb)–labeled phosphospecific antibody (Invitrogen) was used for termination of the reaction and the detection. The components of the enzymatic reaction included 0.3 nM human PKC-η full-length enzyme (Invitrogen), 100.0 nM fluorescent-labeled substrate peptide, 5FAM-RFARKGSLRQKNV-OH (Molecular Devices), and 6.0 µM ATP (Sigma Aldrich, St. Louis, MO).
For the negative coupling, a dose-dependent inhibition of PI3Kβ by a known inhibitor, 4 PI 828 (Tocris Bioscience, Ellisville, MO), was carried out using the TR-FRET format previously described, 5 except a europium (Eu)–labeled antibody was used in this work. The components of the enzymatic reaction included 1.0 nM PI3Kβ enzyme (Upstate, Charlottesville, VA), 10.0 µM water-soluble diC8 form of phosphatidylinositol 4,5-bisphosphate as the substrate (Echelon Biosciences, Salt Lake City, UT), and 50.0 µM ATP. A fluorescent-labeled tracer (12.5 nM) Bodipy®-FL-labeled diC8 phosphatidylinositol 3,4,5-triphosphate (Echelon Biosciences) was also added to the reaction mixture to avoid biased binding to the detection reagent. The detection mixture contains 10.0 nM GST-Grp1 as described previously, 5 1.0 nM Eu-labeled anti–glutathione S-transferase (GST) antibody (Invitrogen), and 5.0 mM EDTA to terminate the enzymatic reaction.
Results
Generally speaking, IC50 measurements of most enzymatic reactions are based on the steady-state assumption. Conventionally, a percentage conversion rate within 30% of a limiting substrate will be considered validation of the steady-state assumption, and the deviations of IC50 measurements under this condition can be ignored. As a matter of fact, most coupling assays using antibodies as the detecting reagent require a very low percentage conversion rate of the substrate and are well within the steady-state limit for the enzymatic reaction; therefore, this has no effect on the measurements of IC50s.
To compare the difference between the IC50 from competitive inhibition of an enzymatic reaction and that from the measured value by a coupling reaction, one needs to analyze the concentration of the species representing the true activity of the enzymatic reaction and the concentration of the complex that provides the signal for detection from the coupling reaction.
Two coupling formats are commonly used in biomolecular assays as mentioned above. One is called positive coupling (i.e., coupling of the detection reagent to the analyte generates a positive signal for the detection). The other is negative coupling (i.e., coupling of the detection reagent to the analyte decreases the signal of the detection [competitive displacement]).
Inhibition of an enzymatic reaction
For a competitive inhibition reaction during steady state, the competition reaction between the substrate and the inhibitor can be approximated as a rapid equilibrium, 6 and the overall reaction can be represented as the following equations:


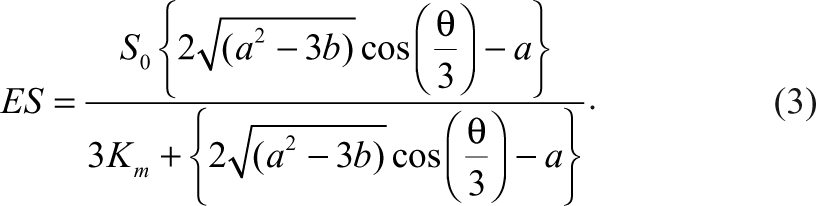
E, S, I, and P represent enzyme, substrate, inhibitor, and the product, respectively. ES and EI represent the corresponding complexes between the enzyme and the substrate and the inhibitor. All the symbols of the species also indicate their corresponding concentrations. When the Michaelis-Menten constant, K m , of the substrate and the dissociation constant, K i , of the inhibitor are known, the species, ES, can be expressed as the following equation according to Wang 7 :
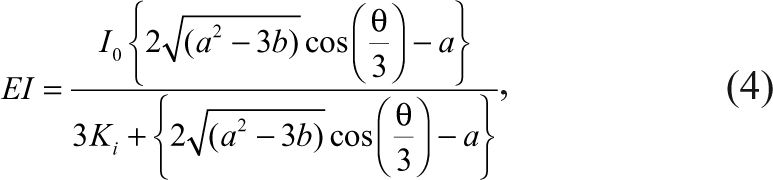
Similarly, the concentration of the complex between the enzyme and the inhibitor, as well as the concentration of the free enzyme, can also be expressed as
where


E 0, S 0, and I 0 are the initial concentrations of the enzyme, substrate, and the inhibitor, respectively.
When steady state is maintained, the velocity of the enzymatic reaction is proportional to ES, and so is the concentration of the product:

where x is the proportionality constant that indicates the percentage conversion rate for the substrate.
For a dose-dependent reaction of an inhibitor, the distributions of the enzyme species (i.e., ES, EI, and E) can be shown in Figure 1 according to equations (3) to (5). When the inhibitor concentrations are low as indicated in the left-hand side of the plot, the major species of the enzyme are substrate-bound ES and free enzyme E, and the concentration of EI is very low. As the inhibitor concentration increases, both ES and E will decrease and EI will increase and become the dominating species, indicating higher degree of inhibition.
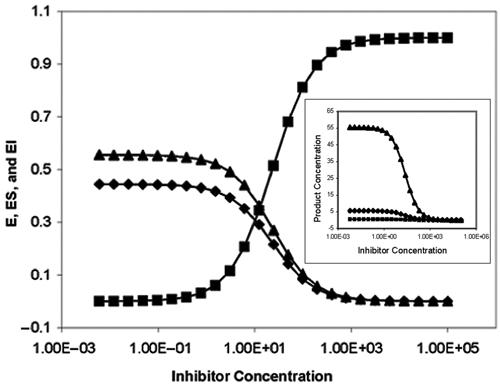
Distributions of ES, E, and EI in a competitive inhibition reaction. S 0 = 8000, K m = 10,000, K i = 10, E 0 = 1.0. Distribution of ES (▲); E (♦); EI (■). Inset: Distributions of the product with different conversion rates: 1 ES (■), 10 ES (♦) and 100 ES (▲).
The distribution of the product with different conversion rates is proportional to ES during steady state, as shown in the inset. The reaction parameters and conditions are indicated in the figure legends. The IC50 values for all 3 percentage conversion rates are 22.7, exactly the same based on the product distribution.
Positive coupling
The simplest case of positive coupling is the formation of a bimolecular complex between the product and the detection reagent D, represented by the following reaction:

Then PD is expressed in terms of total reagent concentrations as the following equation 8 :
P and D 0 present the total concentration of the product and detection reagent, respectively, and K d is the dissociation constant of PD. Taking equation (10) into account, then equation (12) becomes
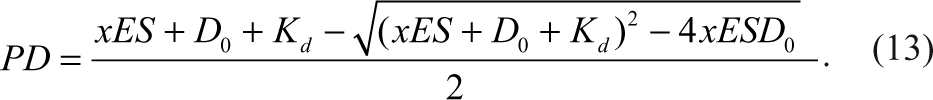
When a constant concentration of D 0 is added to the enzymatic reaction system, we will reach the formation of the signaling complex PD, representing the dose-response curve of an inhibitor with different percentage conversion rates, as shown in Figure 2 according to equation (13). The most obvious observation is that these inhibition curves have different maximum signals (i.e., different detection dynamic ranges). A higher percentage conversion rate yields a larger dynamic range and vice versa. Because P is the analyte for the assay, it is critical to keep P the limiting reagent (i.e., keeping the percentage conversion rate low enough to not saturate the detection reagent D). However, in practice, the concentration of the detection reagent is fixed to a certain value, D 0, and as long as it binds to the product P, it will be saturated to a certain degree. As an assay for measuring the IC50 of an inhibitor, it can be shown that the accuracy is related to the dynamic range of the assay (i.e., the degree of saturation of the detection reagent).
Inhibition curves of the enzymatic reaction as shown in Figure 1 with different conversion rates indicated by percentage effective concentrations based on positive coupling mode: EC10 (■), EC50 (♦), and EC90 (▲). Inhibitor with K i = 10, detection reagent D 0 = K d = 1. Inset: IC50 dependence on percentage effective concentration of the detection complex with different K d s based on the positive coupling mode: K d = 5 (▲), K d = 1 (♦), and K d = 0.5 (■). Inhibitor with K i = 10, detection reagent D 0 = 1.
Practically, a quantity called percentage effective concentration (EC%), such as EC50 or EC80, is used to define the dynamic range of an assay. EC% is defined as the concentration of the limiting reagent that yields a certain percentage of the assay signal relative to the maximum signal (i.e., total saturation of the detection reagent). This value represents the percentage of the detection reagent that is in the form of the signaling complex. For example, if 10 µM of a limiting reagent produces 60% of the maximum signal intensity, then we say the effective concentration of 60% (EC60) of the reagent is 10 µM.
The IC50s of these inhibition curves are calculated using a 4-parameter sigmoid model conventionally used in the pharmaceutical industry as given below:
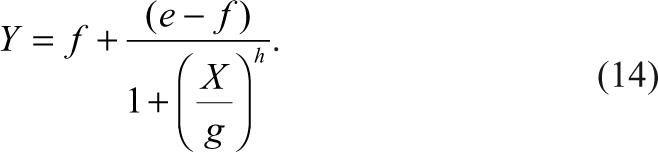
Y is the response of the assay signal, X is the concentration of the inhibitor, e and f are the upper and lower plateaus of the sigmoid dose-response curve, g is the IC50, and h is the slope factor.
It is obvious that the IC50s of the curves with different percentage conversion rates of the substrate lead to different dynamic ranges of the assay, which in turn yield different IC50 values. A higher percentage conversion rate of the substrate yields a larger dynamic range for the assay and therefore a higher IC50 value compared to the true IC50 value. In other words, assay coupling will cause a decrease in the accuracy of the assay, and it always produces a positive deviation.
Besides percentage conversion of the substrate, other factors such as K d and D 0 will also influence the accuracy of a coupling assay. The dependence of IC50 on EC% with different K d s is plotted in the inset of Figure 2 . It is clear how EC% affects the observed IC50 values. When EC% is smaller than 60%, the IC50 values are within 2-fold of the true value, and the deviation increases rapidly as EC% increases. Under the same detection reagent concentration and the same conversion rate of the substrate, the IC50 values decrease as K d decreases, indicating that higher binding affinity between the product and detection reagent will increase the accuracy of the assay.
In general, higher concentrations of the detection reagent will increase the accuracy of the assay by increasing its dynamic range. However, the concentration of the detection reagent is limited by other factors, such as cost and availability.
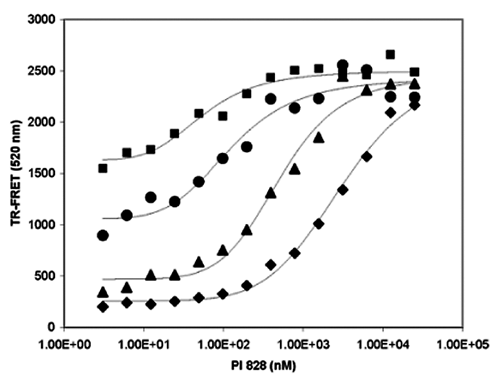
A real example for a positive coupling inhibition is provided to show how IC50 values change when different percentage effective conversion rates were used. The inhibition reactions of the PKC-η full-length enzyme by Ro-32-0432 were started at different time points to achieve different EC% values of 45%, 55%, 70%, 85%, and approaching 100% with IC50 values of 4.2, 5.2, 6.0, 12.6, and 29.5 nM, respectively, as shown in Figure 3 . It is clear that the longer reaction times produced larger dynamic ranges and vice versa. However, the IC50 values increased significantly after the EC% value was beyond 70.
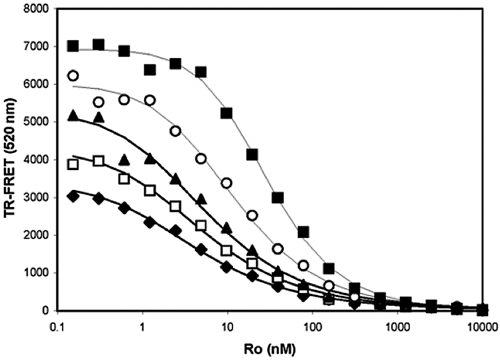
A real example of a positive coupling assay. Each IC50 curve represents a different percentage conversion of the substrate and therefore produces different EC% values of 45% (♦), 55% (□), 70% (▲), 85% (○), and 100% (■) and IC50 values of 4.2, 5.2, 6.0, 12.6, and 29.5 nM, respectively.
Negative coupling
A negative coupling will cause a reduction of the detection signal due to the displacement of one of the detection reagents by the analyte, which is usually the product of an enzymatic reaction. Generally speaking, the detection reagents provide the maximal signal by using a labeled tracer T, which binds to the detection reagent D, and the complex produces the signal for detection. When the enzymatic product binds to the same detection reagent at the same binding site, it replaces the tracer, causing the reduction in the detection signal. This competitive displacement can be represented as the following equation:

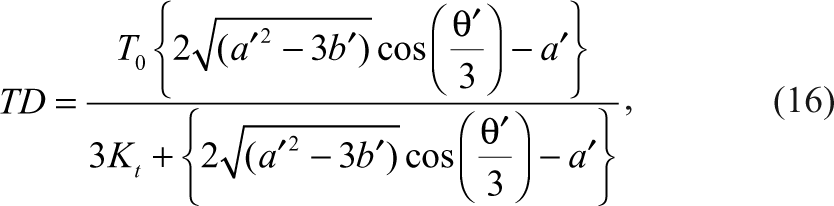
Similar to the inhibition of the enzymatic reaction above, TD can be expressed in the following equation:
where


K t and K p are the dissociation constants of TD and PD, respectively. T 0 and D 0 are the initial concentrations of the tracer and the detection reagent.
It is very common for negative coupling assays that the tracer and the product have the same dissociation constant (K t = K p ) for the detection reagent. Then the cubic equation in terms of TD is reduced to a quadratic equation and can be solved easily. Therefore, the above equation for TD can take a simpler form as follows:
When the tracer is competing with the enzymatic product for binding to the detection reagent, the final assay signal calculated from equation (16) is plotted in Figure 4 . Similar to that for the positive coupling, the IC50s also show the same dependence on the percentage conversion rates (i.e., the IC50 increases with higher percentage conversion rates).
Inhibition curves of the enzymatic reaction as shown in Figure 1 with different conversion rates based on negative coupling mode: EC10 (▲), EC50 (♦), and EC90 (■). Inhibitor with K i = 10, tracer with T 0 = K d = K d ′ = D 0 = 1. Inset: IC50 dependence on percentage effective concentration of the detection complex with different K d s based on the negative coupling mode: K p = 5 (▲), K p = 1 (♦), and K p = 0.5 (■). Inhibitor with K i = 10, tracer with T 0 = D 0 = 1.
It is worth pointing out that the effect of K p on the accuracy of IC50 measurement for negative coupling is reversed to that of the positive coupling, indicating higher binding affinity between the product and detection reagent will decrease the accuracy of the assay. Similarly, the dependency of IC50s on both EC% and K p s is plotted in the inset of Figure 4 . It is clear that the IC50 values increase as the percentage effective concentration increases for all 3 K p s. However, for the same percentage effective concentration, a larger K p produces more accurate IC50s than a smaller K p , which is opposite compared to that of positive coupling assays.
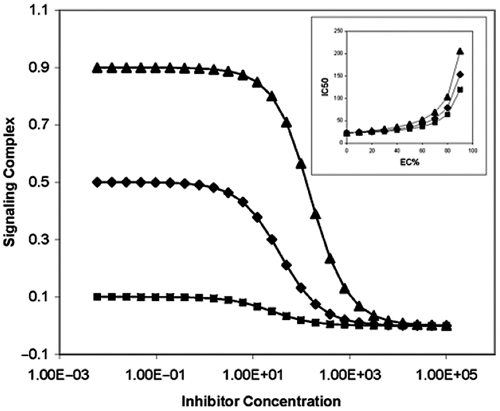
The inhibition of PI3Kβ by a known inhibitor PI 828 is provided to show how IC50 values change when different EC% values are used for a negative coupling assay. Again, the inhibition reactions were started at different time points to achieve different EC% values of 45%, 65%, 90%, and approaching 100% with IC50 values of 47, 110, 610, and 2250 nM, respectively, as shown in Figure 5 . Opposite from positive coupling, the longer reaction time produced larger dynamic range by achieving a lower background, and shorter reaction time produced smaller dynamic range by having higher background. Another important difference compared to positive coupling is that the EC% values for negative coupling assays are usually based on partial saturation of the detection reagent or the tracer, and that for positive coupling is based on 100% saturation of the detection reagent. This is why positive coupling is more efficient than negative coupling assays and should be considered preferentially when conditions permit. However, negative coupling is totally capable of using 100% of dynamic range defined by the limiting reagent of either the tracer or the detection reagent.
A real example of a negative coupling assay. Each IC50 curve has different percentage conversion of the substrate and therefore produces different EC% values of 45% (■), 65% (●), 90% (▲) and 100% (♦) with IC50 values of 47, 110, 610, and 2250 nM, respectively.
Discussion
When a coupling assay is used for measuring IC50s for enzymatic reactions, the measured IC50 value through the coupling assay will depend on the percentage conversion rate of the substrate, and the measured value will always be higher than the true value as demonstrated above. The higher the percentage conversion rates, the more deviation will be produced in the IC50 values. On the other hand, higher percentage conversion rates will lead to larger dynamic ranges and provide higher signal-to-noise ratios for the assay. Therefore, it is a fine line between choosing a larger dynamic range and the accuracy for the assay. There is no perfect solution to this problem because the dynamic range and the accuracy of an assay are inversely related to each other for coupling assays. However, a benchmark for developing coupling enzymatic assays is to limit EC% values around 50% to 70%. In this range, the IC50 values measured should be within 2- to 3-fold of the true value and without sacrificing too much for dynamic range. More important, one should always keep the nature of coupling assays in mind and take the effect into account when using IC50 values, especially in calculation of K i s and comparison with IC50s from other assay formats.
Besides the percentage conversion rate of the substrate, the concentrations of the detection reagent and the tracer will be another factor to influence the accuracy of IC50 measurements. For positive coupling assays, there is only one detection reagent, and higher concentrations will have larger dynamic ranges and therefore lead to higher accuracy in the measurements. However, higher detection reagent concentration will decrease the sensitivity of the assay. Obviously, higher concentrations will also increase the cost of the assay itself. Generally speaking, a concentration around the K p value is a preferable starting point for assay optimization.
For negative coupling assays, the situation is more complicated. Either higher tracer concentration or higher detection reagent concentration will increase the accuracy of the measurements but decrease the sensitivity. Higher tracer concentration will increase the difficulty for the product to compete for binding to the detection reagent, and higher detection reagent concentration will increase the difficulty for the product to compete with the tracer by depleting the product concentration through binding. However, increasing either the tracer or the detection reagent concentration to increase the dynamic range is less efficient than increasing both the concentrations of the trace and the detection reagent because if one concentration is increased, the other will be limited, and the increase may not be linear. Therefore, a stoichiometrically equal concentration of the tracer and detection reagent around the K t value will be a preferable choice and will provide a maximum signaling complex concentration of about 40% of the K t . It should be emphasized here that there is no limitation on this equal concentration of the tracer and the detection reagent, and it could be much higher than K t .
In addition to the factors mentioned above, the dissociation constant of the detection reagent to the product also affects the accuracy of the IC50 measurements, although to a lesser degree. For positive coupling assays, a smaller dissociation constant between the product and the detection reagent produces more accurate IC50s. However, a larger dissociation constant has more tolerance to the accuracy (i.e., deviates less from its true value for negative coupling assays).
Footnotes
Acknowledgements
The author gratefully acknowledges the input and support from Dr. Neil Wolfman for the preparation of this manuscript.