
Abstract
Protein aggregation is a major obstacle in recombinant protein production as it reduces the yield of soluble polypeptides. Also, the formation of aggregates occurring in the soluble fraction is more common than formerly expected, and the prevalence of these entities might significantly affect the average quality of the soluble protein species. Usually, the formation of soluble aggregates remains unperceived because analytical methods such as dynamic light scattering are not routinely applied as quality control procedures. The authors have developed a methodologically simple and fast procedure, based on microdialysis and image processing, that reveals the aggregation tendency of a given protein in a specific environment. Because they also show a good correlation between macroscopic aggregation and soluble aggregate formation, the microdialysis approach also permits an estimation of the occurrence of soluble aggregates.
Introduction
T
We have developed a methodologically simple analytical procedure that qualitatively determines the aggregation tendency of a given protein. Because intriguingly, protein deposition correlates with the size of soluble aggregates, we propose microdialysis as a routine screening method of both protein solubility and conformational quality of the soluble version under different experimental conditions.
Materials and Methods
Protein production and purification
R9-GFP-H6 is a modular eGFP 15 version of 30 kDa containing cationic peptides at both amino and carboxy ends—namely, 9 arginines (R9) and 6 histidines (H6), respectively. The chimerical gene was obtained by a standard cloning procedures in which 2 complementary synthetic oligonucleotides from TIB MOLBIOL SL, encoding the R9 cationic peptide, were inserted in a pET-21b(+)-derived GFP-H6-encoding vector at the 5′ end of the gfp gene. Precise details of this construction will be given elsewhere. R9-GFP-H6 was produced in Rosetta BL21 (DE3) Escherichia coli cells under the control of the T7 promoter. NLSCtHis is a recombinant β-galactosidase derived from NLSCt 16 in which a his-tag was added at the C-terminal end of the NLSCt recombinant gene. This was achieved by inserting synthetic oligonucleotides from TIB MOLBIOL SL, coding for 6 histidines at the 3′ end of the NLSCt gene, in the pTNLSCt vector. NLSCtHis was produced in E. coli BL21 (DE3). Bovine serum albumin (BSA; ref 10735078001) was purchased from Roche (Basel, Switzerland).
Bacteria were cultured in 750 mL of Luria-Bertani (LB) medium (10 g/L tryptone Scharlau 07-489, 10 g/L sodium chloride Scharlau S00227, 5 g/L yeast extract Scharlau 07-079) at 37 °C in shaker flasks until OD = 0.5 was reached, and gene expression was then induced by adding 1 mM isopropyl β-
Microdialysis
Several drops (20 µL each) of model proteins at 0.1 mg/mL in elution buffer were deposited on VSWP02500 Millipore (Billerica, MA) membrane filters floating on 25 mL of each buffer described in Table 1 for 30 min. Dialyzed drops were collected and centrifuged, and the soluble fractions were used in dynamic light-scattering (DLS) analysis.
Summary of R9-GFP-H6 Aggregation Data upon Dialysis in Front of Different Buffers
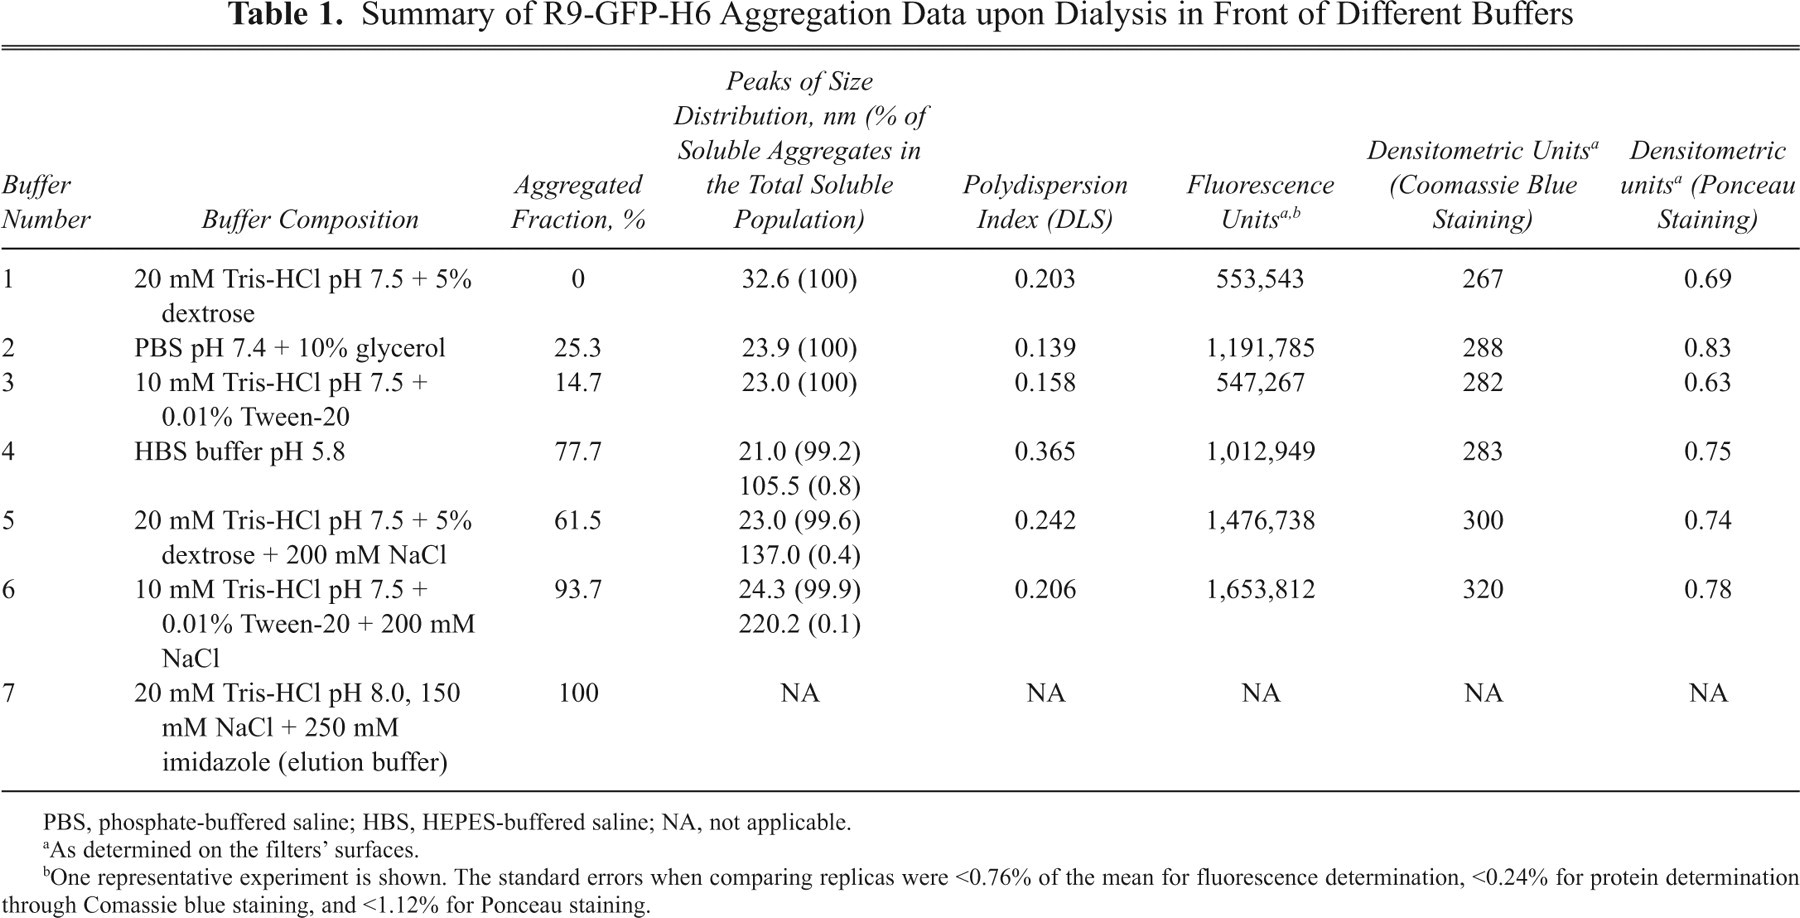
PBS, phosphate-buffered saline; HBS, HEPES-buffered saline; NA, not applicable.
As determined on the filters’ surfaces.
One representative experiment is shown. The standard errors when comparing replicas were <0.76% of the mean for fluorescence determination, <0.24% for protein determination through Comassie blue staining, and <1.12% for Ponceau staining.
In situ determination of fluorescence and total protein amounts
After removal of dialyzed protein, membranes were further air dried. Aggregated R9-GFP-H6 deposited on them was determined by measuring direct fluorescence in a Versa Doc Imaging System 4000MP (BioRad, Hercules, CA), or after Coomassie or Ponceau staining, by using the GS-800 Calibrated Densitometer (BioRad). Data were obtained in triplicate as relative density units/mm2 using the Quantity One program (BioRad).
Dynamic light scattering
Volume size distributions of aggregates in the soluble fraction were measured using a DLS analyzer at the wavelength of 633 nm, combined with noninvasive backscatter technology (NIBS; Zetasizer Nano ZS, Malvern Instruments Limited, Malvern, UK). Particle size dispersions of R9-GFP-H6 in different buffers were measured at 22 °C after centrifugation (at 11,148 g for 15 min).
Statistical analysis
Linear regression analyses were performed by using the SigmaPlot software (Version 10.0; Systat Software, San Jose, CA), from which the obtained confidence levels (p) are shown.
Results and Discussion
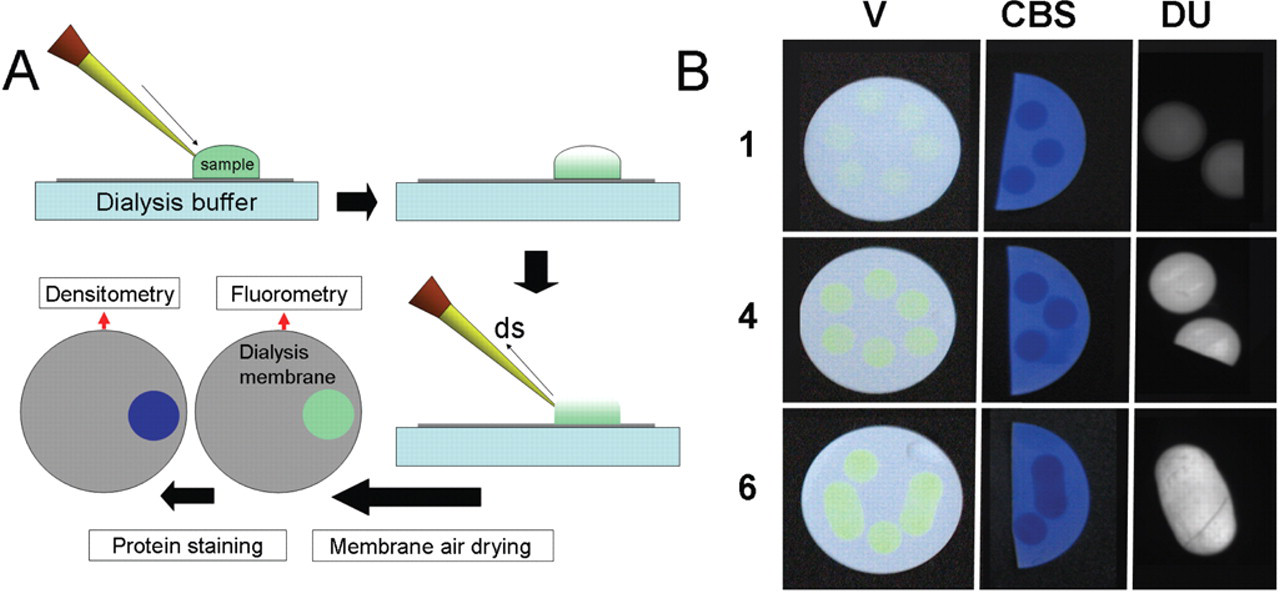
In our routine laboratory practice, we had commonly noted protein deposition on membrane filters when performing drop microdialysis, and we wondered if this fact could be related with the extent of protein aggregation in a given buffer. To evaluate this possibility, we explored the potential connection between protein deposition and aggregation by using an aggregation-prone fluorescent protein (R9-GFP-H6) as a model. For that, upon production in E. coli, drops of freshly purified R9-GFP-H6 were microdialyzed ( Fig. 1A ) against 6 different buffers commonly used for protein storage and handling ( Table 1 ). The dialyzed material was centrifuged at 14,841 g, and the protein remaining in the soluble fraction was quantified to determine the extent of aggregation, which ranged from undetectable levels to essentially 100% of the total protein ( Table 1 ). This indicated that buffer composition dramatically influences R9-GFP-H6 solubility in an extremely wide range and pointed out buffer selection as a critical issue regarding solubility of aggregation-prone proteins. Interestingly, the low-salt buffers 1 and 3 were the most convenient to keep R9-GFP-H6 in a soluble status.
(
To test the value of microdialysis as a convenient screening method for protein aggregation, we determined the amounts of R9-GFP-H6 protein deposited on the membrane dialysis indirectly by fluorescence emission and directly by Coomassie blue and Ponceau staining methods ( Fig. 1A ). The visual appearance of the unstained and stained membranes was highly consistent in different aliquots of the same protein sample but dissimilar when comparing different buffers ( Fig. 1B ). Fluorescence emission and Coomassie blue staining values correlated, at acceptable levels of confidence, with the fraction of insoluble R9-GFP-H6 (p = 0.0518 and p = 0.0576, respectively) found in the respective buffers ( Table 2 ). In fact, fluorescence emission and Coomassie blue staining data evolved in parallel in different samples showing a good lineal correlation between them (p = 0.0136; not shown). This indicated a sufficient robustness in the determination of protein amounts deposited on the filters. However, protein amounts determined by Ponceau staining were less reliable as indicators of protein aggregation (p = 0.3521; Table 2 ), indicating that in our hands, Ponceau measurements are less quantitative regarding protein amounts.
Correlation between the Percent of Aggregation of 3 Different Proteins (Expressed as p Values from a Regression Analysis) Dissolved in Different Buffers and the Protein Amounts on Membranes Determined by Alternative Procedures upon Microdialysis
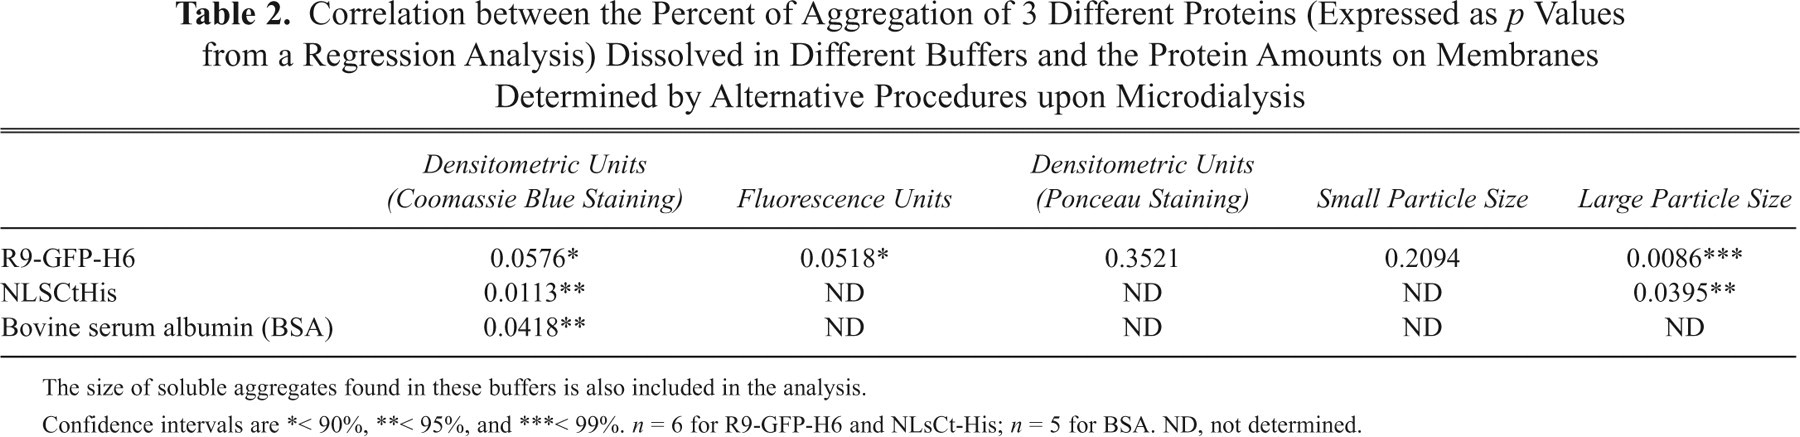
The size of soluble aggregates found in these buffers is also included in the analysis.
Confidence intervals are *< 90%, **< 95%, and ***< 99%. n = 6 for R9-GFP-H6 and NLsCt-His; n = 5 for BSA. ND, not determined.
The good correlation between protein amounts deposited on the filters (determined by Coomassie blue staining) and the aggregation propensity was confirmed by using 2 additional (nonfluorescent) proteins structurally differing from green fluorescent protein (GFP)—namely, the extensively engineered E. coli β-galactosidase NLSCtHis, an structurally complex tetrameric protein (p = 0.0113), and a wild-type commercial BSA, an essentially soluble protein (p = 0.0418; Table 2 ). This fact prompts consideration of microdialysis as a reliable method for the fast screening of protein solubility, as its applicability is irrespective of the nature of the tested protein.
At this stage, we wondered if the occurrence of macroscopic aggregation could be linked to the formation of soluble aggregates, a possibility that, as far as we know, had not been explored so far. In this regard, we explored by DLS the eventual presence of soluble R9-GFP-H6 and NLSCtHis oligomers and their size. Solutions of R9-GFP-H6 recurrently showed major peaks at between 20 and 30 nm and, in some cases, microaggregates of between 100 and 250 nm ( Fig. 2A ). Although sizes of the smaller R9-GFP-H6 particles did not correlate with the extent of protein aggregation (p = 0.2094; Table 2 ), the sizes of the large particle population (>100 nm) showed good correlation with the extent of R9-GFP-H6 in the insoluble fraction (p = 0.0086; Table 2 ) and therefore also with Coomassie blue staining and fluorescence emission data (p = 0.0212 and p = 0.0422, respectively; not shown). The prevalence of the 20- to 30-nm particles is due to a self-organized clustering of R9-GFP-H6 driven by the hanging R9 peptides, 18 whereas the larger particles seem to represent an evolving population of protoaggregates.
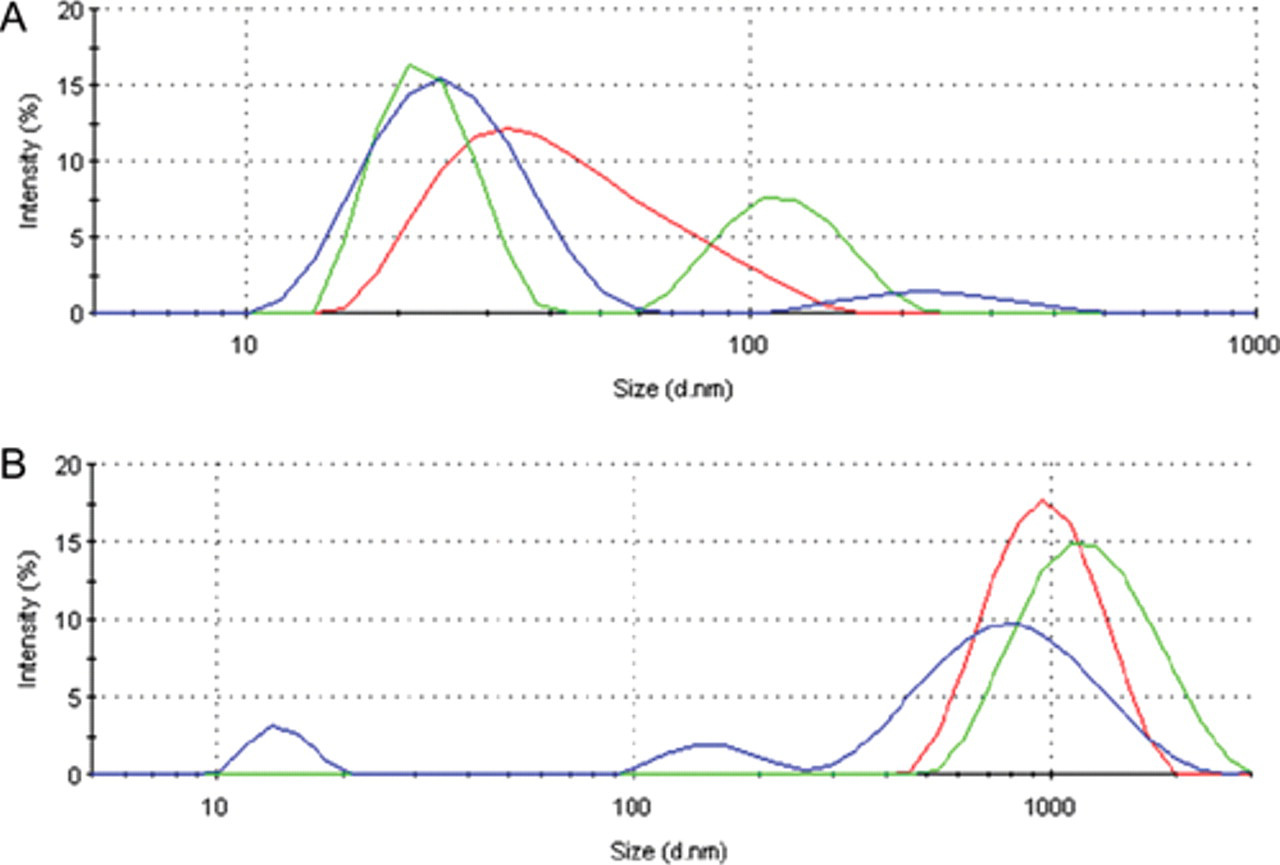
Aggregate size distributions of soluble (
On the other hand, soluble NLSCtHis peaks at around 15 nm, the size of the β-galactosidase tetramer ( Fig. 2B ). Larger particles of between 100 and 1000 nm are observed in some buffers ( Fig. 2B ), their size showing good correlation with the extent of protein aggregation (p = 0.0395; Table 2 ). The coincidence between size of soluble aggregates and the extent of insoluble protein aggregation suggests that the soluble supramolecular entities are intermediates in the protein aggregation process, leading to protein deposition as insoluble protein clusters.
In the context of the growing concerns about recombinant protein quality, 1,19 simple analytical approaches for the routine screening of protein aggregation tendency would be highly convenient. As the performance of microdialysis and further protein determination represented around 90 min in full, and these simple procedures can be applied in parallel to a high number of samples, microdialysis is proposed here as a novel high-throughput, simple, and fast prospective method appropriate for the comparative screening and monitoring of protein aggregation tendency and, indirectly, of the conformational quality of the residual population of soluble protein represented by the occurrence of soluble aggregates. 14
Footnotes
Acknowledgements
We are indebted to Marta Nadal and Carmen Arnan for technical assistance in DLS analysis. We appreciate the financial support received for the design and production of recombinant proteins for biomedical applications from MICINN (BI02007-61194 and EUI2008-03610), AGAUR (2009SGR-108), and CIBER de Bioingeniería, Biomateriales y Nanomedicina (CIBER-BBN), Spain. AV has been distinguished with an ICREA ACADEMIA award.