
Abstract
Superoxide affects many normal and pathogenic cellular processes, and the detection of superoxide produced by cells is therefore of interest for potential therapeutic applications. To develop a high-throughput cell-based assay for the detection of extracellular superoxide production that could be run in a 384-well or 1536-well format, 2 luminescent reagents, Lucigenin and Diogenes, and one fluorescent reagent, Oxyburst Green BSA, were tested. HL-60 cells, which had been differentiated to a neutrophil-like phenotype with DMSO and frozen in large batches, were used in assays. All 3 superoxide detection reagents performed well statistically in terms of IC50 reproducibility and met a desired Z′ value requirement of >0.4. When tested against a 1408-compound test set at 5 or 10 µM compound concentration, a higher hit rate was obtained with the 2 luminescent reagents compared with that obtained with the fluorescent Oxyburst Green BSA reagent. The Oxyburst Green BSA assay was ultimately chosen for compound profiling and high-throughput screening activities. This 1536 superoxide detection assay using cryopreserved differentiated HL-60 cells represents a shifting paradigm toward the utilization of more therapeutically relevant cells in early drug development activities.
Introduction
C
Numerous reagents have been used to detect superoxide in cells using spectroscopic, fluorescent, or luminescent readouts. 6-12 Although most of the published work has been with low-throughput instrumentation such as fluorescent microscopy or single cuvettes, Oxyburst Green 7 and cytochrome C 6 have been used in the 96-well plate format. To our knowledge, higher density plate format (384- and 1536-well) superoxide detection assays for high-throughput screening (HTS) have not been previously described in the literature.
In this report, we have used cryopreserved stocks of DMSO-differentiated HL-60 cells to evaluate commercially available reagents that measure superoxide production in 384- and 1536-well formats. HL-60 cells are a human promyelocytic leukemia cell line that can be differentiated into mature neutrophil-like granulocytes following DMSO treatment. 13,14 DMSO-differentiated HL-60 cells produce superoxide and can kill bacteria when treated with phorbol myristate acetate (PMA). 13 Although cryopreservation of nondifferentiated HL-60 cells is common, immediate production of reactive oxygen species postthaw in all-transretinoic-acid differentiated HL-60 cells has been published only recently. 15
Three different commercially available reagents were selected to examine, in addition to a traditional cytochrome C assay in initial studies; 2 luminescent reagents, Diogenes and Lucigenin, and 1 fluorescent reagent, Oxyburst Green BSA. The cytochrome C assay detects a change in the absorbance of cytochrome C at 550 nm upon its reduction in the presence of superoxide. The luminescent reagent Diogenes is an enhanced luminol (5-amino-2,3-dihydrophthalazine-1,4-dione)–based reagent, which is described by the vendor (National Diagnostics, Atlanta, GA) as having a 106-fold sensitivity to superoxide over peroxide. The other luminescent reagent tested, Lucigenin (bis-N-methylacridinium nitrate), is described by the vendor (Invitrogen, Carlsbad, CA) as a specific reagent for superoxide detection and produces luminescence upon interaction with superoxide ion. The fluorescent Oxyburst Green BSA reagent consists of bovine serum albumin (BSA) covalently linked to dihydro-2,′4,5,6,7,7′-hexafluorofluorescein (Invitrogen), which is oxidized in the presence of reactive oxygen species (ROS), becoming a more highly fluorescent species. This fluorescent reagent is described as ideal for the detection of extracellular superoxide because of its inability to penetrate the cell membrane (Invitrogen Web site, www.invitrogen.com) and has been used in cell-based assays. 7,16 Although Oxyburst Green BSA is not thought to be cell permeable, it has been shown to enter cells over time via an endocytic pathway and was used in one report to detect intracellular superoxide production in lysosomes. 17
Here, we describe the characteristics of the assays using the reagents described above, including assay kinetics, dose-dependent PMA-induced responses, signal-to-background ratios, Z′ statistics, signal inhibition IC50, and compound hit rates. In addition, the results from an Oxyburst Green HTS are reported.
Materials and Methods
Reagents
Diogenes was purchased from National Diagnostics (catalog CL-202), Lucigenin and Oxyburst Green H2HFF BSA were from Invitrogen (catalog L6868 and O-13291, respectively), and cytochrome C, superoxide dismutase (SOD), and CHAPS were from Sigma (St. Louis, MO; catalog C7758, S8409-15KU, and C5070, respectively). PMA and diphenyleneiodonium (DPI) were purchased from Biomol International (Plymouth Meeting, PA; catalog PE-160 and CN-240, respectively), and Hank’s Balanced Salt Solution (HBSS), phosphate-buffered saline (PBS), and Iscov’s media were purchased from Mediatech (Herndon, VA). Fetal bovine serum (FBS) was purchased from GIBCO (Grand Island, NY). Cell culture stacks, cryopreservation vials, and sterile centrifuge tubes were purchased from Corning (Acton, MA). Various 384-well and 1536-well plates were purchased from Greiner (Monroe, NC) or Corning (Lowell, MA).
Preparation of the frozen differentiated HL-60 cells
HL-60 cells were grown in Iscov’s media supplemented with 20% FBS in 6360-cm2 cell stacks. For differentiation toward neutrophil-like cells, cultures were incubated in growth media supplemented with 1.3% DMSO for 6 days. At the end of the differentiation time, cells were harvested by centrifugation at 1100 rpm (250 g) for 10 min in a Beckman Coulter J6-MI centrifuge. Harvested cells were then resuspended in freezing medium consisting of 90% FBS and 10% DMSO. For cryopreservation, cells were frozen in either 1-mL or 5-mL volumes in screw-cap vials using a controlled rate freezer (Planer KRYO 10 series III) with the following temperature ramping protocol: hold at 4°C for 7 min, cool 1°C/min to −5°C, cool 3°C/min to −12°C, cool 5°C/min to −14°C, cool 7.5°C/min to −20°C, cool 6.5°C/min to −25°C, hold 2 min at −25°C, warm 3°C/min to −20°C, cool 1°C/min to −50°C, and cool 10°C/min to −130°C. After the freeze ramp protocol, vials were stored in a liquid nitrogen cryo tank (Custom Biogenic Systems Isothermal V1500 series from Gieserlab, Chestertown, MD, or MVW 810 Eterne from Chart Industries, Cleveland, OH). For use in assays, frozen cell vials were thawed at 37°C, transferred to sterile 50-mL conical centrifuge tubes, diluted to a volume of 10 to 50 mL in culture medium, centrifuged, resuspended in assay buffer (~10 mL for every 2 mL of frozen cells), and counted on a Cedex cell counter (Roche Innovatis AG, Bielefeld, Germany). Viable cell counts from the Cedex were used to determine the number of cells/mL in the cell suspension. The cells were then diluted to the desired cell density in assay buffer for dispensing into 384-well or 1536-well assay plates. Cells were dispensed into assay plates with either a Multidrop 384 or a Multidrop Micro (both from Thermo Scientific, Waltham, MA). The optimum number of cells per well for assays was determined by testing various cell numbers per well in assays and comparing the responses and assay statistics at the different cell numbers per well (data not shown); the cell numbers per well tested in the different assay formats ranged from 2000 to 50,000 cells/well.
Cytochrome C assay
For PMA dose-response curves, PMA was serially diluted 3-fold in DMSO with a Biomek FX instrument (Beckman Coulter, Fullerton, CA), and then 250 nL was delivered into black 384-well low-volume assay plates (Corning #3540) with a Cartesian Hummingbird instrument (Digilab Genomic Solutions, Holliston, MA). In assays where SOD, DPI, or compounds were included, they were prepared in DMSO and added with the Hummingbird using the same procedure as for the PMA. Cells and cytochrome C were prepared in assay buffer, consisting of calcium- and magnesium-free HBSS, plus 0.1% glucose. Cytochrome C at a final assay concentration of 100 µM was added in assay buffer in 24 µL to the plates with a Multidrop. Then, 24,000 HL-60 cells per well were added in the 24-µL assay buffer with a Multidrop, and the OD at 550 nm was measured on a SpectraMax plate reader (Molecular Devices, Sunnyvale, CA) at 37°C for 2 to 3 h at 30-s intervals.
Diogenes assay
Compounds (robustness set compounds or DPI for control columns) dissolved in DMSO were dispensed in 50 nL into white 1536-well plates (Greiner 782075) or 384-well plates (Greiner 784075) with a Hummingbird. The Diogenes reagent was made up according to the package directions in deionized water, and PMA was added to the complete Diogenes Reagent at 520 nM (final assay concentration 250 nM) for inhibition assays. The Diogenes + PMA mix was added to the plate at a 2.5-µL volume, followed by the addition of 5000 cells/well in 2.5 µL; both additions were done with a Multidrop Micro. PMA dose-response curves were prepared in DMSO in 384-well polypropylene plates (Greiner 781280) with a Biomek FX instrument in 3-fold serial dilutions. The curves were dispensed like other compounds in 50 nL with a Hummingbird into white 384-well plates (Greiner 784075), followed by 2.5 µL Diogenes and 2.5 µL cells in assay buffer, as described above. Luminescent readings were taken following 80 min at room temperature for endpoint assays or at the time points indicated with a ViewLux instrument (PerkinElmer, Waltham, MA).
Lucigenin assay
First, 100-nL volumes of stock compounds in DMSO were dispensed from source plates into white low-volume 384-well plates (Greiner #784075) with a Hummingbird. Lucigenin was then prepared in deionized water and added to the assay plates in 10 µL with a Multidrop Combi to give a 5-µM final assay concentration. Differentiated HL-60 cells were thawed and resuspended in assay buffer as described. For inhibition assays, the PMA EC80 was added to the cell suspension and incubated at room temperature for 5 min, and then CHAPS was added to the cell/PMA mix to a final concentration of 0.01%. PMA dose-response curves were prepared in DMSO in 384-well polypropylene plates (Greiner 781280) on a Biomek FX. PMA curves were dispensed (like compounds) in 100 nL into the assay plates and the cell/CHAPS mixture dispensed subsequently onto the PMA curve in the plate. Cell mixtures were dispensed into plates at 12,000 cells/well (or at 5000 cells/well for the early assay development fresh vs frozen assays described) in 10 µL using a Multidrop. The plates were spun for 10 s at 1000 rpm and read on a ViewLux at time points listed in the figure legends.
Oxyburst Green assay
For 384-well assays, compounds, PMA, and DPI were prepared in DMSO and dispensed in 100-nL volumes into black low-volume 384-well plates (Greiner 784076) with a Hummingbird. Cells were resuspended in assay buffer, CHAPS (0.01% final) and Oxyburst Green BSA (10 µg/mL final) were added, and the mixture was dispensed into assay plates in 10 µL to give 10,000 cells/well. Stock solutions of Oxyburst Green BSA were prepared according to the package insert (1 mL PBS added to the 1 mg in the vial for a 1-mg/mL stock). For endpoint assays, plates were incubated at room temperature for 100 min and then read at excitation 485/ emission 530 settings on an Analyst instrument (Molecular Devices). For time courses, the plate was read multiple times over the course of the incubation; see figure legends for particular time points.
For HTS, the assay was miniaturized down to a final volume of 5 µL in a 1536-well plate format; 50 nL test compounds in DMSO (1-mM compound stocks) was added to 1536-well plates (Greiner FluoTrac 200, catalog #782076) with a Hummingbird, and 50 nL 10 µM DPI in DMSO was added to inhibition control wells with an Echo 555 (Labcyte, Sunnyvale, CA) prior to screening. Both cell suspension (4 µL) and PMA (1 µL) were then added using a Multidrop Combi. Reaction mixtures contained 5000 cells/well and were read using a ViewLux instrument after incubating for 100 min at room temperature in the dark. Hit confirmation studies included a secondary assay consisting of identical reaction mixtures but with compounds added at the end of incubation time to eliminate compounds identified as hits that were interfering with the detection system.
Data analysis
Z′ calculations 18 were done using equation (1):
Z′ = 1 – 3[(standard deviation highs + standard deviation lows)/(average highs − average lows)],
where highs and lows represent the high-signal and low-signal data in the assays. For the superoxide assays, highs equal data from PMA EC80 challenge wells, and lows represent data from assay wells containing only buffer with the same amount of DMSO as all other wells (no PMA).
For cytochrome C assay data analysis, Vmax-transformed data were selected as an output in the SpectraMax software, and these numbers were used in data analysis. Assay times with data of 50 min or longer were chosen to plot PMA dose-response curve data for the cytochrome C assay.
All PMA dose-response curves and DPI IC50 curves were fit using GraphPad Prism (GraphPad, San Diego, CA), with a standard sigmoidal dose-response curve fit selection in the software (www.graphpad.com).
Hits in the HTS were selected using robust statistics. 19
Results
HL-60 cells were maintained and expanded in suspension growth cultures and, prior to use in assays, were differentiated into neutrophil-like cells by exposure to DMSO for 6 days. 14,20,21 For convenience, large batches of differentiated HL-60s were prepared and cryopreserved as stocks of assay-ready cells for use in experiments, where they were stimulated with the phorbol ester PMA. In the early phases of assay development, freshly grown and differentiated HL-60 cells were compared with frozen differentiated cells in side-by-side assays with the Lucigenin reagent. Data from these experiments indicated that the PMA dose responses were similar in both fresh and frozen differentiated cells, giving EC50s of 17 and 15 nM, respectively, at a 30-min time point in a same-day comparison of activities. DPI IC50s were also similar in fresh and frozen cells, giving values of 83 and 70 nM, respectively, in assays run on the same day (data from assays run with 5000 cells/well). In addition, the amplitude of the PMA responses and degree of inhibition observed for fresh and frozen cells were similar. Because the performance of the frozen cells was similar to that of freshly prepared cells, and the goal for HTS would be to use frozen cells, all subsequent work was done with the frozen cells.
Initial testing of the HL-60 cells using cytochrome C
For the cytochrome C assay, quantification of superoxide has been described as the SOD-inhibitable reduction of cytochrome C. 22 To confirm that the PMA-stimulated response detected with cytochrome C in the differentiated HL-60 cells was due to the generation of superoxide, the assay was run in the presence of SOD to show that the signal could be abolished under these conditions. Shown in Figure 1A are PMA dose-response curves, run both in the absence (top panel) and in the presence (bottom panel) of SOD. The inhibition of the PMA response by SOD confirmed that the HL-60 cells were producing a PMA-specific superoxide burst and validated the assay. Having confirmed activity in this assay, the 3 other superoxide detection reagents of interest were evaluated.
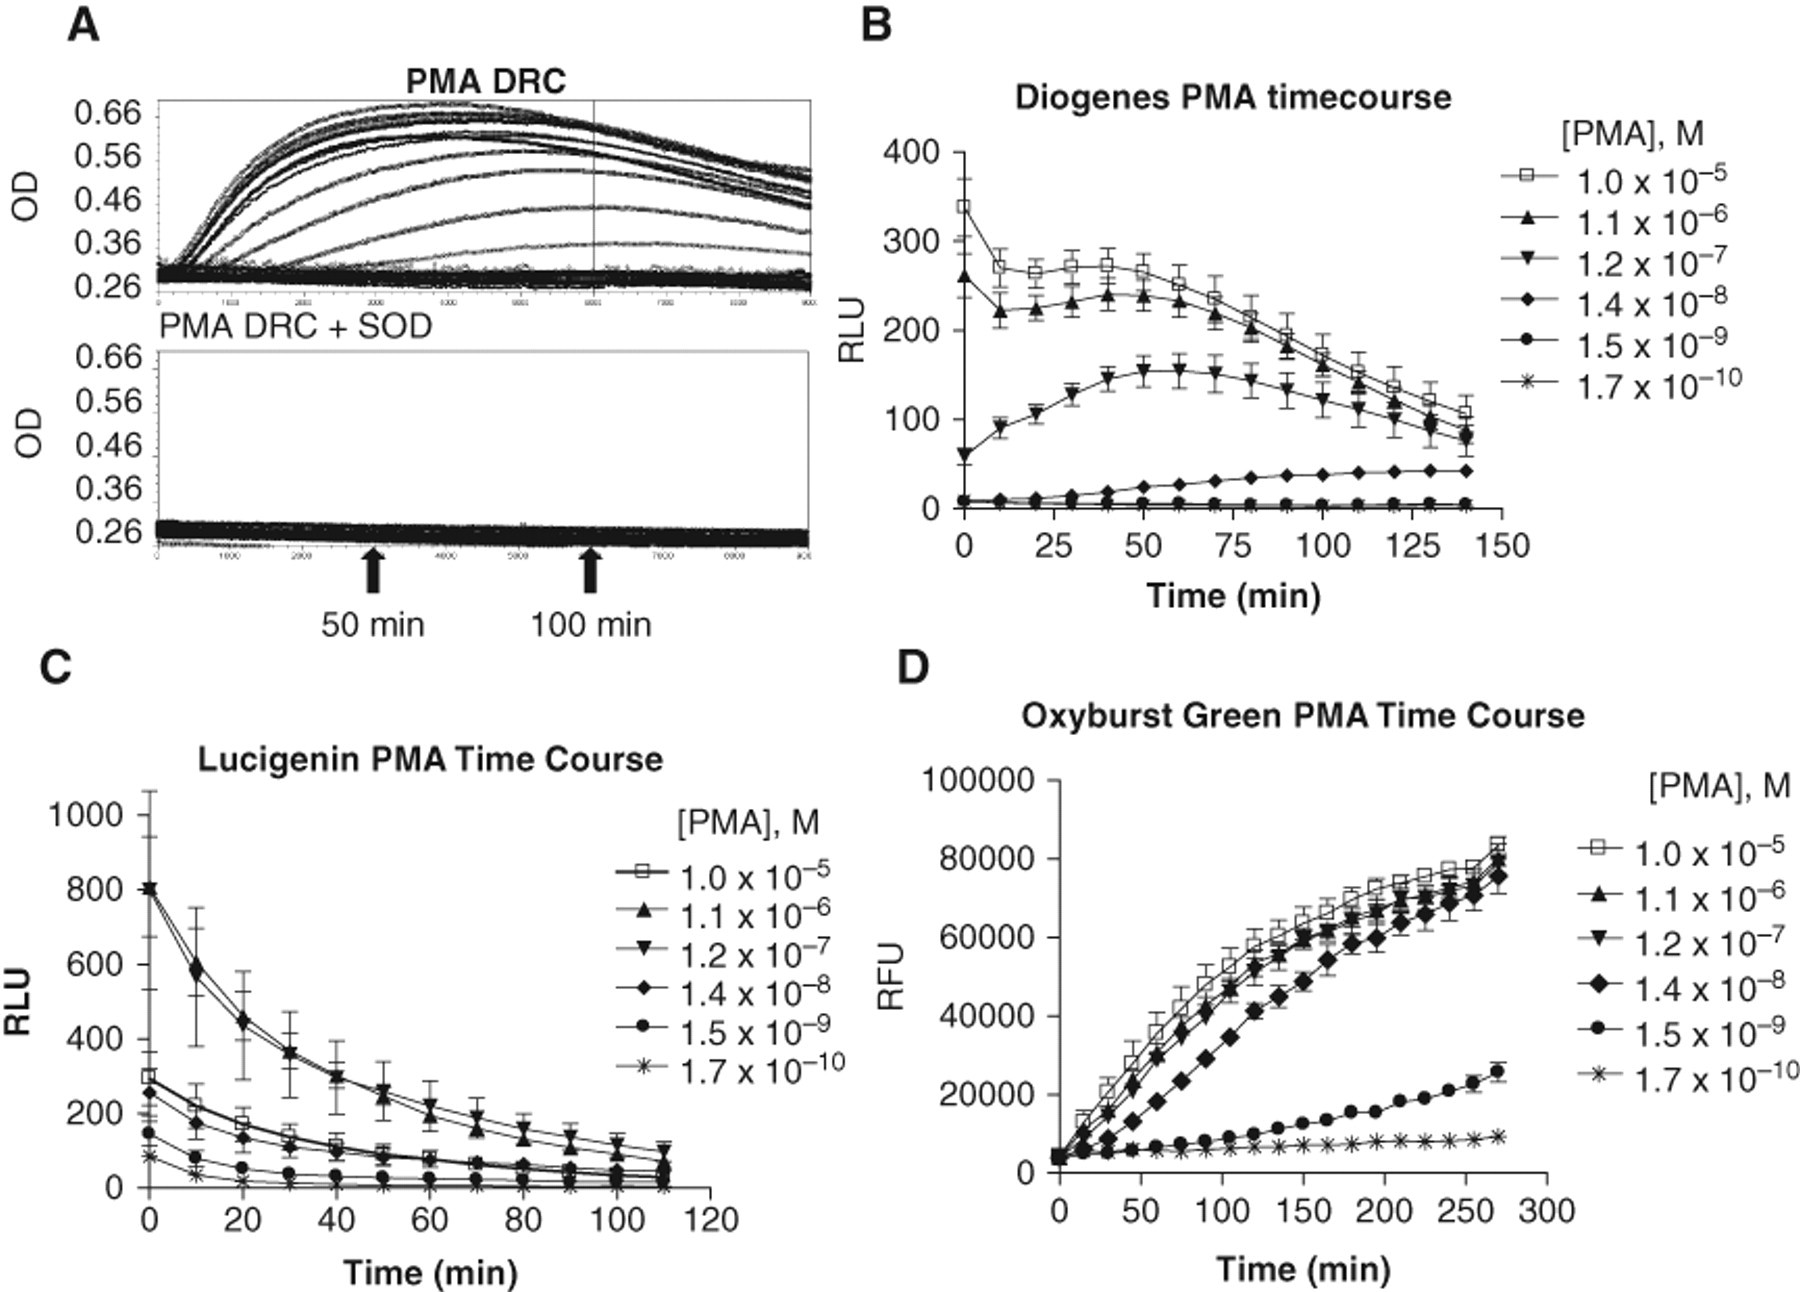
Phorbol myristate acetate (PMA) time course data: responses to PMA are shown from typical assays for the 4 reagents tested. (
Assay kinetics for each format
In initial evaluations of each detection reagent, time course experiments on PMA dose-response curves were performed to examine the assay kinetics and to determine the optimal endpoint times for each different format. The representative cytochrome C assay PMA response traces shown in Figure 1A indicate that the signal in the cytochrome C assays plateaued at approximately 50 min of reaction time and then began to slowly decay but was still relatively stable out to 100 min. For the luminescent reagent Diogenes, shown in Figure 1B , an initial burst in the response was observed at the highest PMA doses, which was followed by a reduction in the response up to approximately 20 min; the signal then increased over time up to approximately 50 min. For the lower PMA doses, the signal did not show the initial burst and drop, but simply increased over time up to approximately 50 min, after which point it began to decay. Figure 1C shows PMA responses obtained with the Lucigenin reagent, where the signal was highest at the earliest time point and then continued to decay over time, up to 110 min. The Lucigenin assay displayed an atypical dose response to PMA (see also Fig. 2 and associated text) where the highest signals in the assay were observed at intermediate concentrations of PMA, not at the highest. For the Oxyburst Green BSA assay shown in Figure 1D , the PMA response signal steadily increased in a linear fashion over time up to approximately 100 min and then began to slowly plateau, out to 270 min.
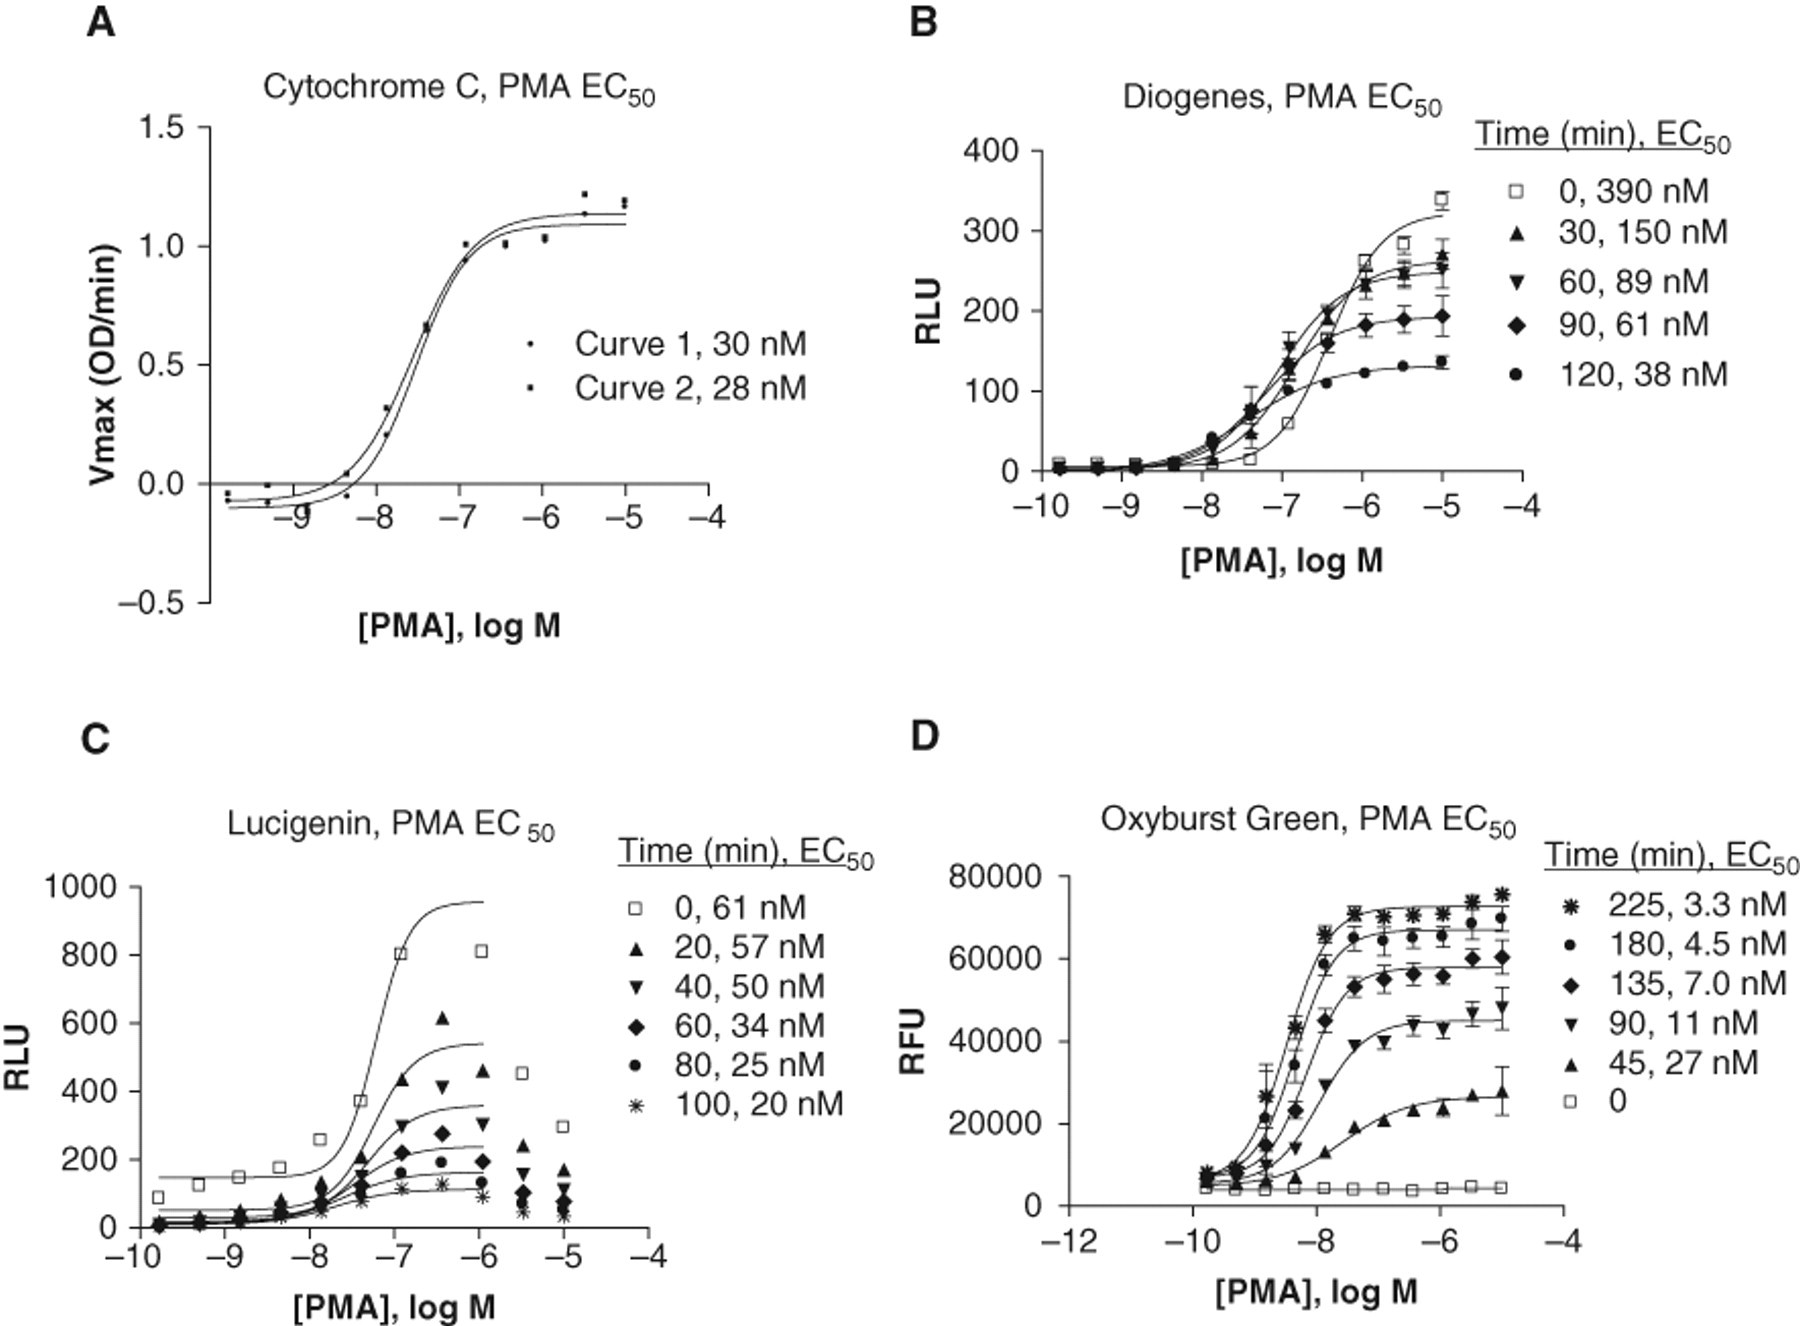
Phorbol myristate acetate (PMA) EC50 dose-response curves. Data from the time course experiments were plotted using a 4-parameter logistic fit in GraphPad Prism software. Calculated EC50 values for the various time points are indicated in each graph. (
PMA EC50 curves
PMA dose-response data from the cytochrome C assay are shown in Figure 2A . Using a 50-min time point, PMA EC50s of approximately 30 nM were observed. For the other reagents tested, different subsets of data from the same experiments shown in Figure 1 were selected from the larger data sets and plotted as EC50 curves at various time points. The Diogenes EC50 curves shown in Figure 2B indicated that the PMA EC50 shifted over time, becoming lower (higher potency) as time increased. In the typical experiment shown, EC50s for PMA ranged from 390 nM to 38 nM in the 0- to 120-min time points shown. It is likely that the early “0” time point EC50 value was inaccurate because of the initial burst discussed above; once the signal leveled out into the second slower response peak, the EC50 values remained more consistent (e.g., comparing the 60-min and 90-min values of 89 nM and 61 nM, respectively).
The dose-response curves for the Lucigenin assay, shown in Figure 2C , were bell-shaped curves, where the signal increased with increasing PMA concentrations up to a point and then decreased again at the highest concentrations. This effect was sometimes less pronounced but was consistently observed. The bell-shaped dose-response data could be fit using the standard curve fit formula in GraphPad Prism software only when the top 2 to 3 points were excluded from the analysis for each curve. The resulting PMA EC50 values in the assay shown ranged from 61 to 20 nM for the 0- to 100-min time points.
The Oxyburst Green BSA assay data plotted as dose-response curves shown in Figure 2D gave PMA EC50 values ranging from 27 to 3.3 nM in the 45- to 225-min time points shown. Although this range of values represents almost a 10-fold range, once a more stable signal was established during the later time points, the EC50 values remained relatively stable, as we observed for the Diogenes assay. For example, the 90-min PMA EC50 value of 11 nM was very close to the 135-min time point value of 7.0 nM.
DPI inhibitor IC50 assays
After assessing each reagent and determining some of the basic assay conditions for each of them, IC50 values were determined for DPI, a nonspecific inhibitor of various NADPH-using flavoproteins. DPI has been used to inhibit the oxidative burst in many different cell types, including neutrophils, macrophages, and differentiated HL-60 cells. 6 Figure 3 shows a typical DPI IC50 determination from each of the different assay formats. Relatively consistent IC50 values were observed day to day, although the Lucigenin assay was more variable than the other formats in general. The cytochrome C and Oxyburst Green assays gave DPI IC50 values of 200 and 270 nM, respectively, as shown in Table 1 . The 2 luminescent formats, Diogenes and Lucigenin, gave slightly lower DPI IC50 values than those observed in the other 2 formats, at 40 and 25 nM, respectively. In all cases, a PMA challenge concentration at the estimated EC80 for the assay was used for IC50 testing, based on results from previously run PMA EC50 curves.
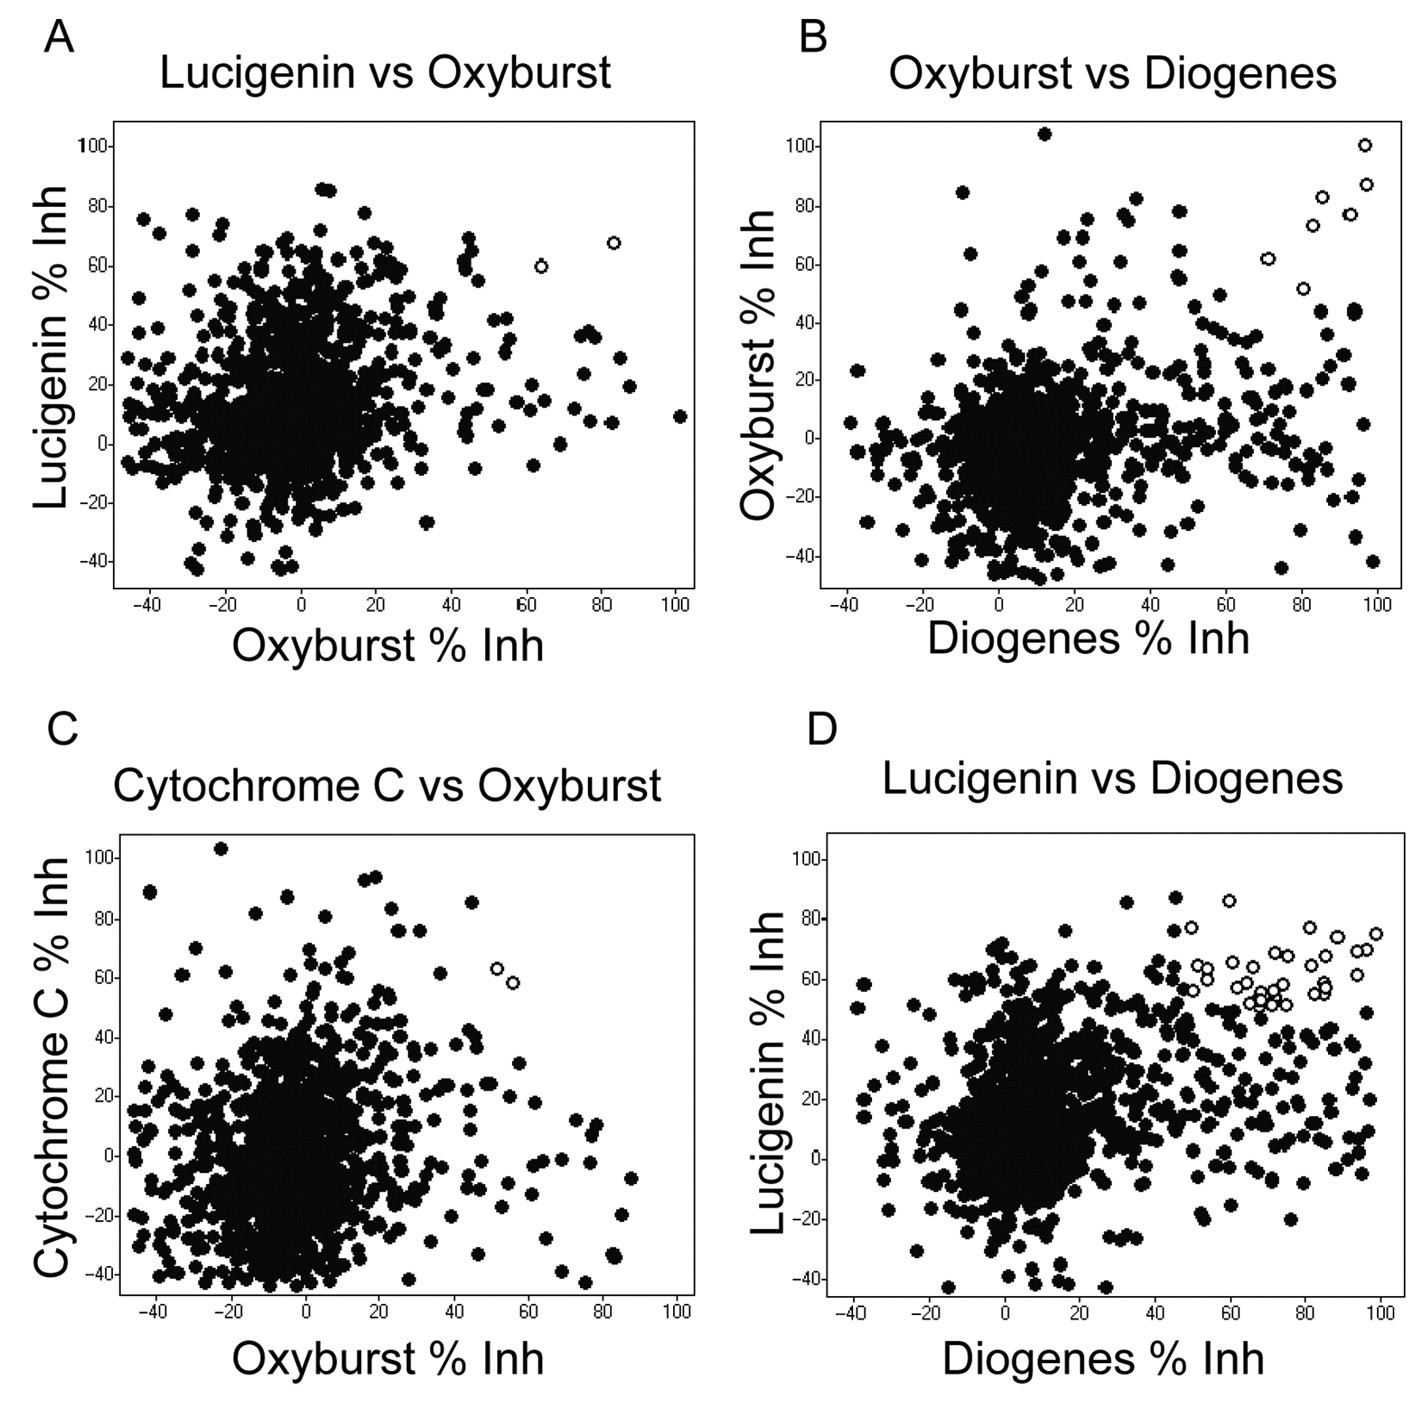
Pairwise comparison of robustness set data in scatterplots. Percent inhibition data from the robustness sets are displayed as pivoted scatterplots, generated in Spotfire software. The spots with white centers indicate the overlapping hits for both assays in the pair, using ≥50% inhibition as the cutoff.
DPI IC50 Values
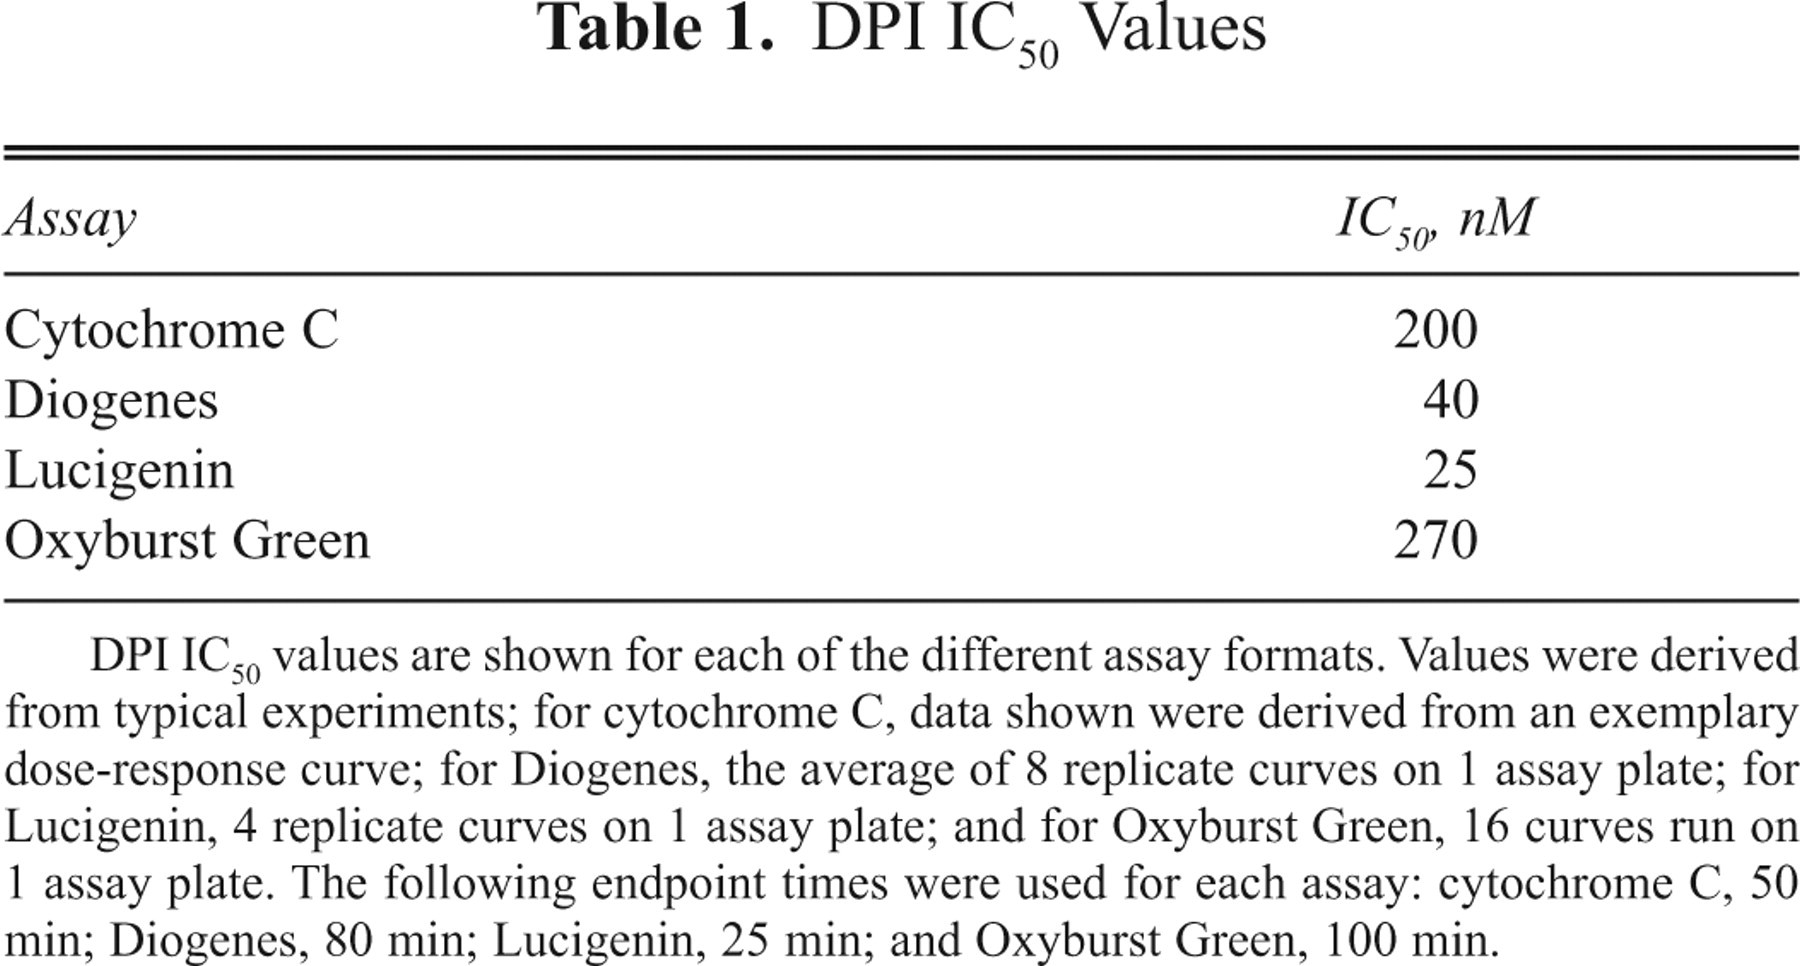
DPI IC50 values are shown for each of the different assay formats. Values were derived from typical experiments; for cytochrome C, data shown were derived from an exemplary dose-response curve; for Diogenes, the average of 8 replicate curves on 1 assay plate; for Lucigenin, 4 replicate curves on 1 assay plate; and for Oxyburst Green, 16 curves run on 1 assay plate. The following endpoint times were used for each assay: cytochrome C, 50 min; Diogenes, 80 min; Lucigenin, 25 min; and Oxyburst Green, 100 min.
Z′, signal to background, and compound hit rates
For each assay type, a compound set of 1408 compounds, referred to as the robustness set, was tested. The compounds are a random subset of the large HTS collection (> 1 million), which was used to generate a preliminary assessment of assay statistics. This pre-HTS compound set helps identify undesirable assay statistics in the presence of compounds before assays are put into full HTS production mode. The data collected from robustness sets also help determine assay fitness for HTS. The compounds were dispensed into a set of 4 plates for 384-well assays and into 1 plate for 1536-well assays. Each compound was tested at 1 final assay concentration of 10 µM for all assays except the Lucigenin assay, where the final assay compound concentration was 5 µM. The compound testing assays were run in antagonist format, testing for the ability to inhibit an EC80 PMA response. The percent inhibition of each compound was calculated, based on control EC80 and DMSO-only wells, which were included in each assay plate. Duplicate robustness sets were tested in all assay formats except for the cytochrome C assay, where only 1 set was run.
So that all data sets could be directly compared, a hit cutoff rate of 50% inhibition was used to calculate the number of hits obtained in each assay format; hits were defined as compounds showing 50% or greater inhibition in the assay. Tables 2 to 4 show robustness set data for each of the 4 assay formats. A Z′ value was calculated for each assay plate to assess well-to-well variability (shown in Table 2 ). Z′ values were calculated using 1 column of controls for each of the high and low conditions in each plate (or 2 columns each in the 1536-well plates), where the “high” wells were PMA EC80 challenge responses and the “lows” contained no PMA. In addition to the robustness set plates, additional DMSO plates that did not contain any compounds were also included in the experiments.
Robustness Set Z′ Values
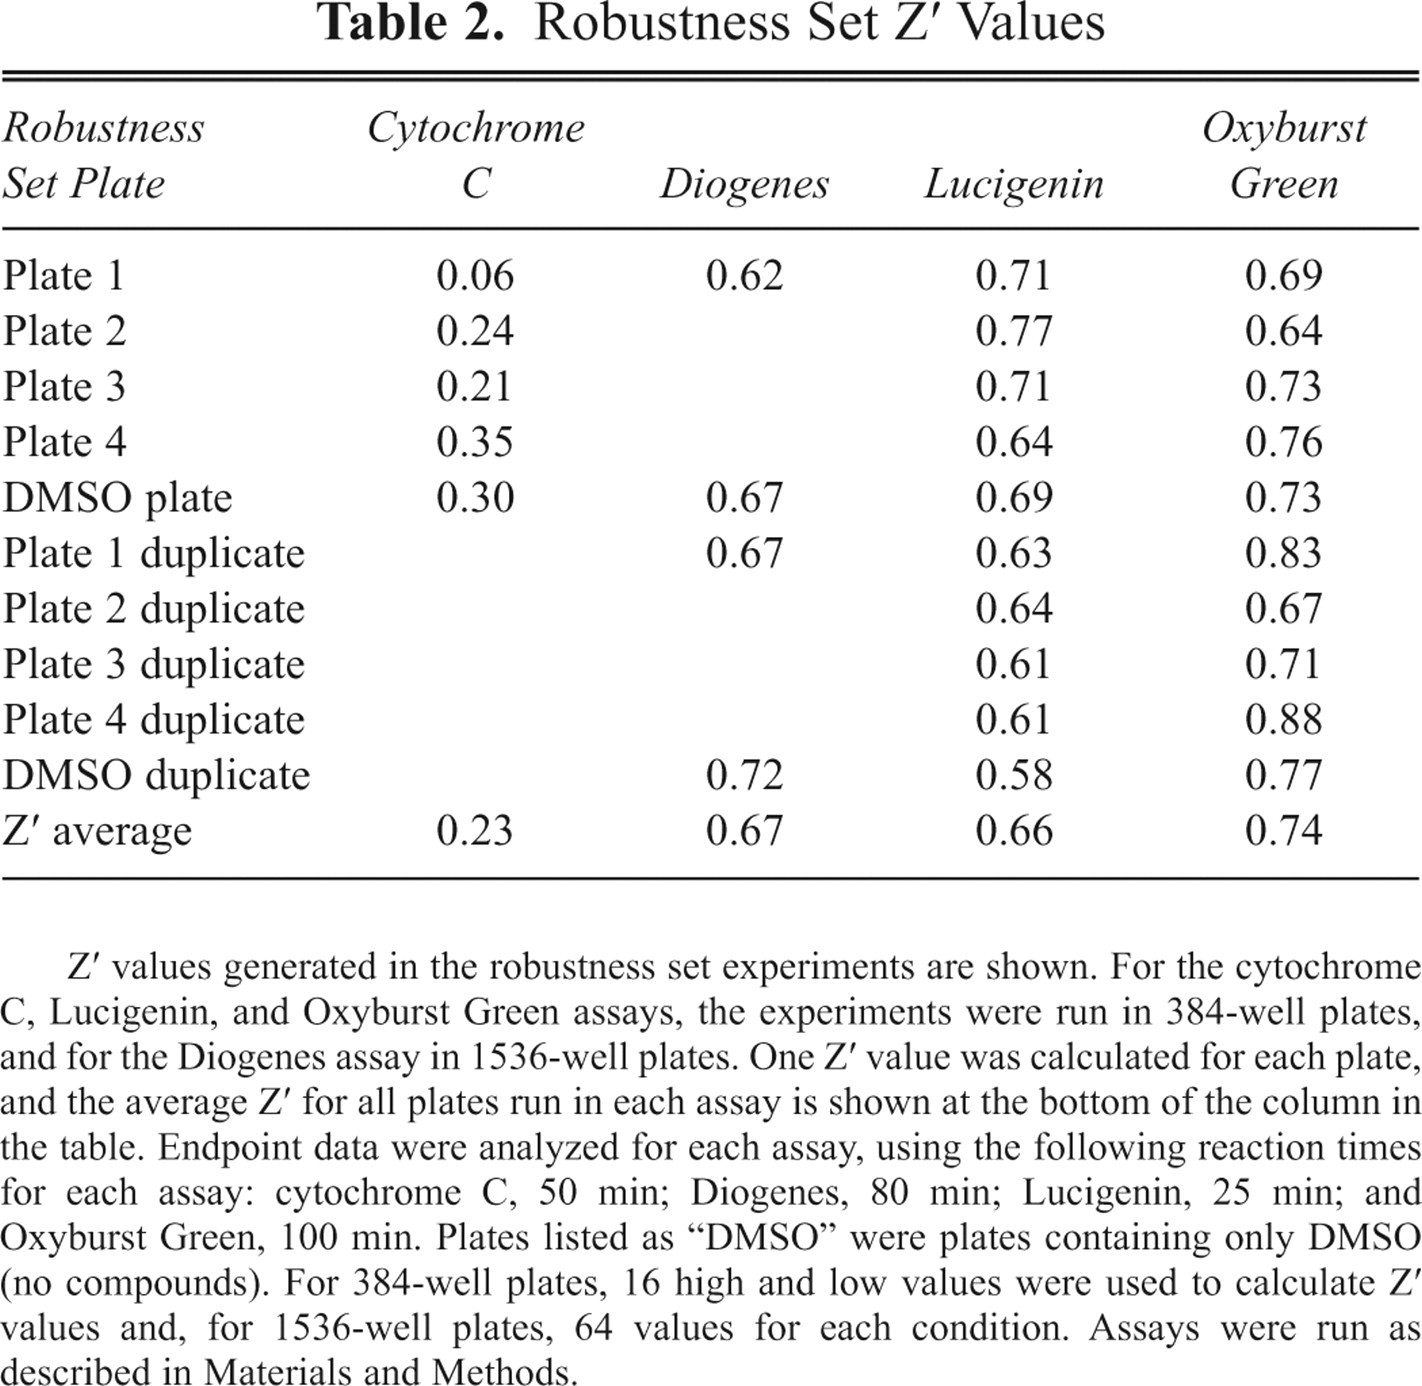
Z′ values generated in the robustness set experiments are shown. For the cytochrome C, Lucigenin, and Oxyburst Green assays, the experiments were run in 384-well plates, and for the Diogenes assay in 1536-well plates. One Z′ value was calculated for each plate, and the average Z′ for all plates run in each assay is shown at the bottom of the column in the table. Endpoint data were analyzed for each assay, using the following reaction times for each assay: cytochrome C, 50 min; Diogenes, 80 min; Lucigenin, 25 min; and Oxyburst Green, 100 min. Plates listed as “DMSO” were plates containing only DMSO (no compounds). For 384-well plates, 16 high and low values were used to calculate Z′ values and, for 1536-well plates, 64 values for each condition. Assays were run as described in Materials and Methods.
Signal/Background Values from Robustness Sets
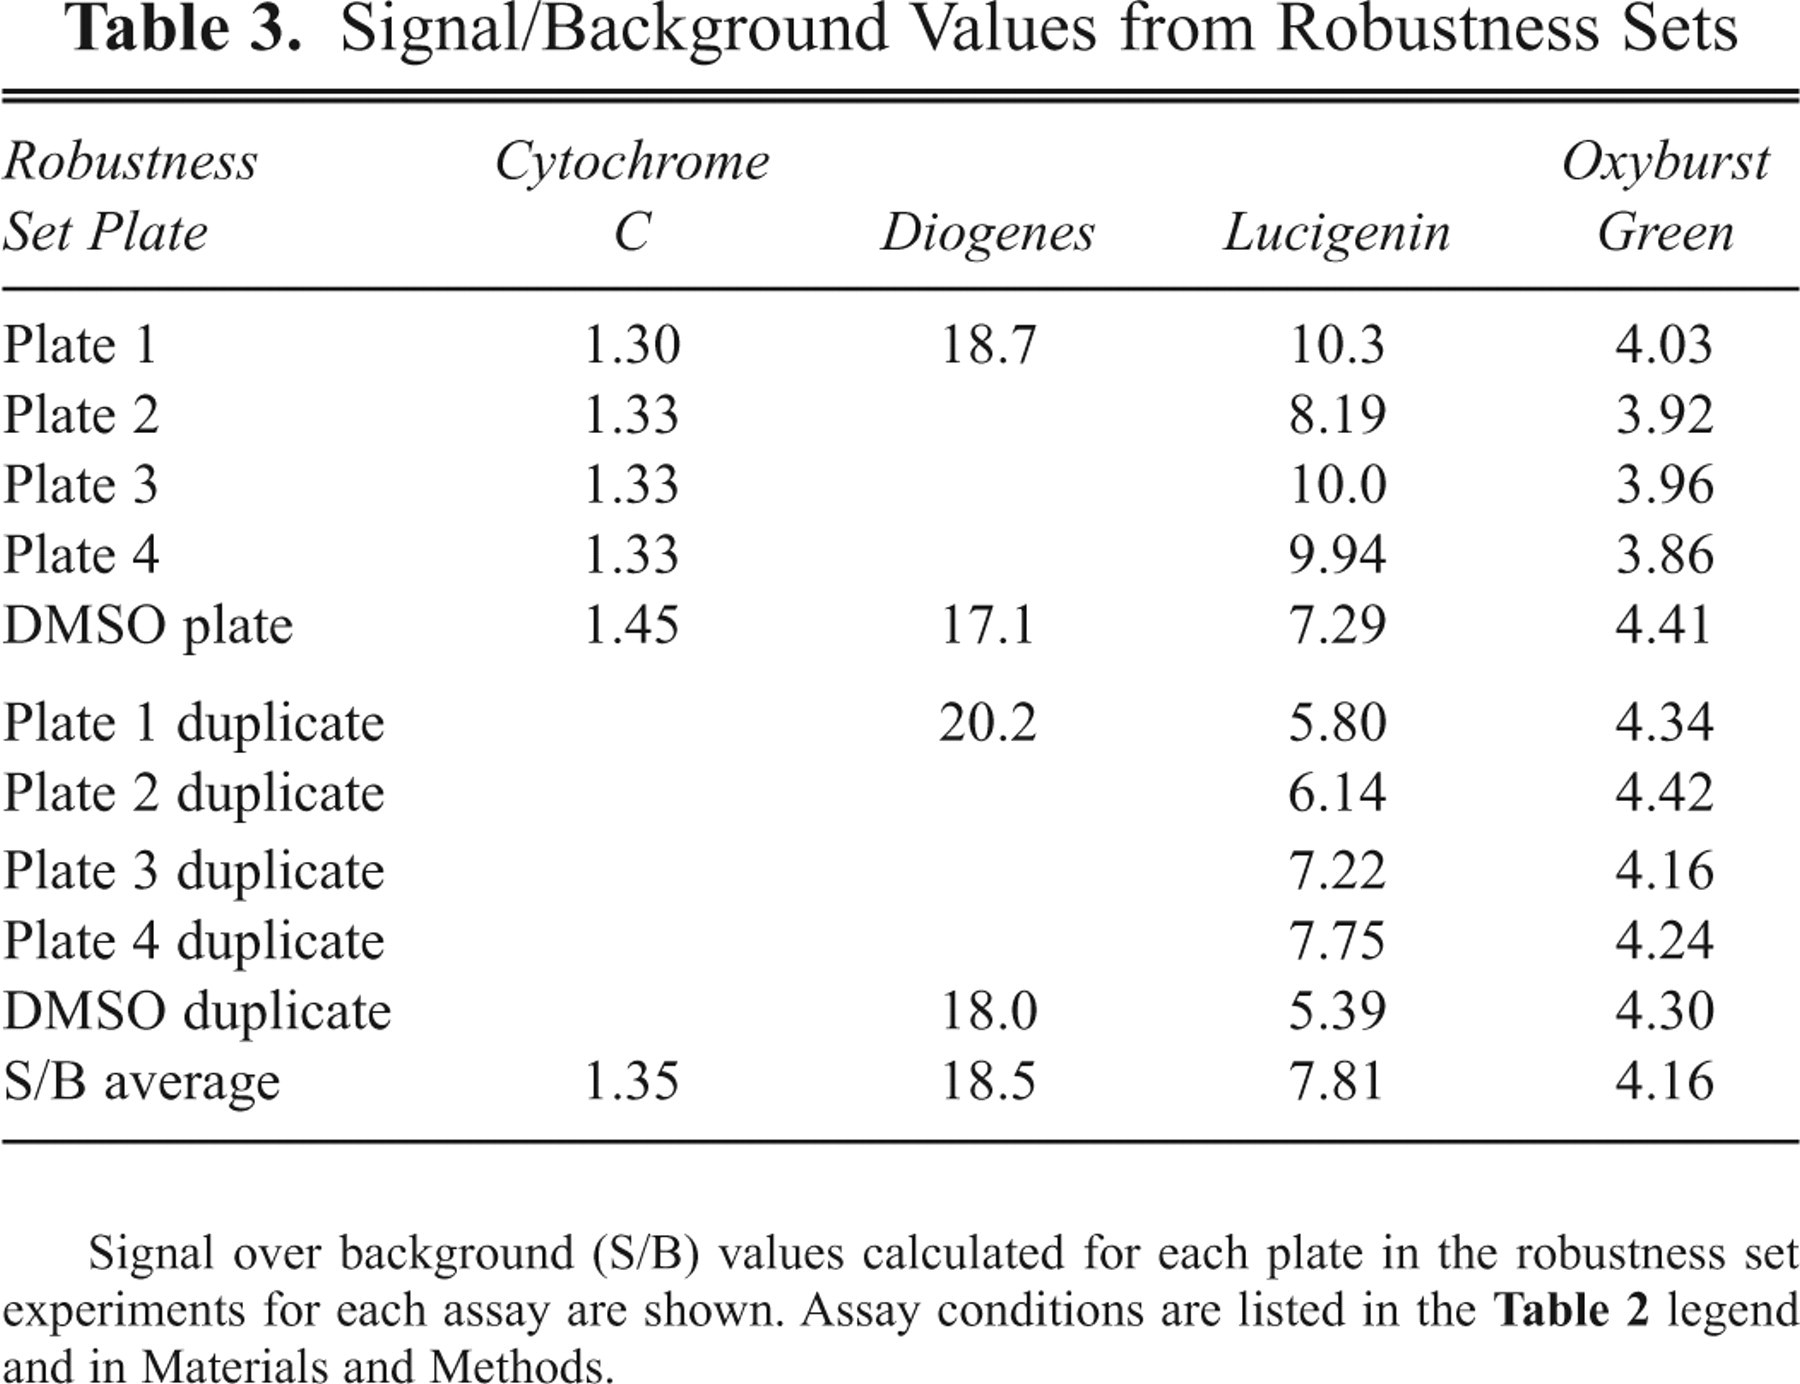
Signal over background (S/B) values calculated for each plate in the robustness set experiments for each assay are shown. Assay conditions are listed in the Table 2 legend and in Materials and Methods.
Robustness Set Hit Rates at 50% Inhibition
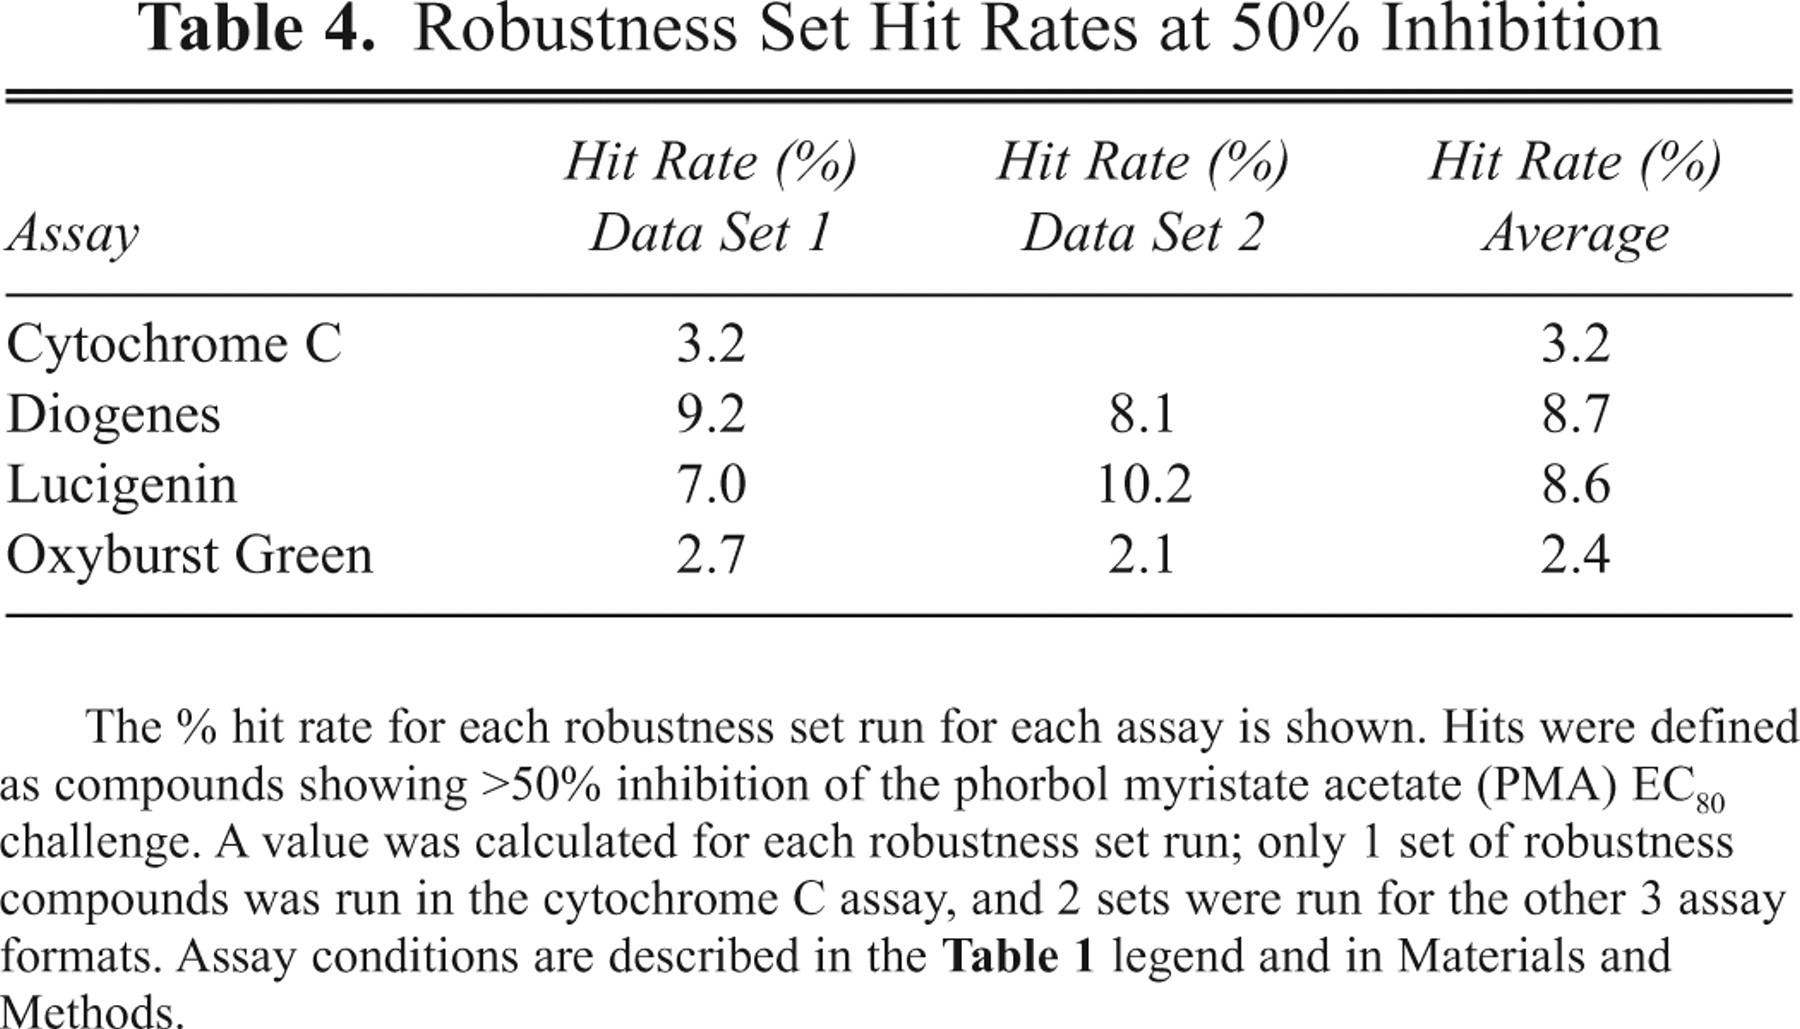
The % hit rate for each robustness set run for each assay is shown. Hits were defined as compounds showing >50% inhibition of the phorbol myristate acetate (PMA) EC80 challenge. A value was calculated for each robustness set run; only 1 set of robustness compounds was run in the cytochrome C assay, and 2 sets were run for the other 3 assay formats. Assay conditions are described in the Table 1 legend and in Materials and Methods.
The cytochrome C assay was the only assay that did not meet the Z′ assay performance target of >0.4 ( Table 2 ). This was likely because of the small dynamic range and the low signal/background (S/B) values observed in the assay (see Table 3 ). Because of this higher well-to-well variation, the cytochrome C assay was not suitable for high-throughput single-dose screening in the assay volumes and methodologies tested, although it was an acceptable assay for lower throughput experiments and for dose-response testing.
In contrast, typical Z′ values for the Diogenes, Lucigenin, and Oxyburst Green assays were greater than 0.65. The Diogenes assay produced the highest S/B results, averaging 18.5 in the assays shown, compared with 7.8 for Lucigenin and 4.2 for Oxyburst Green BSA. From the robustness set data shown in Tables 2 to 4 , and repeated assessment of assay Z′ and S/B values (at least 4 more assays for each of the 3 assay formats, where results were similar to those shown in Tables 2 and 3 were obtained; data not shown), the Diogenes, Lucigenin, and Oxyburst Green BSA assays were statistically robust enough to consider for use in high-throughput single-dose screening.
Table 4
shows the robustness set compound hit rate analysis for each of the assay formats. For the 2 luminescent formats, Diogenes and Lucigenin, hit rates averaging approximately 9% (8.7% and 8.6%, respectively) were observed, using a 50% inhibition cutoff to define hits. For the cytochrome C assay, the observed hit rate was 3.2%, and for the Oxyburst Green assay, it was 2.4%. When the percent inhibition results for the assays were pivoted against each other (
Fig. 3
), the number of overlapping hits in any 2 assays was always a smaller number of hits than in each assay alone. For example, in the Lucigenin versus Oxyburst (
Fig. 3A
) and cytochrome C versus Oxyburst (
Fig. 3C
) pivots, only 2 hits were the same, corresponding to a 0.14% hit rate. For Oxyburst versus Diogenes (
Fig. 3B
), 7 hits overlapped, corresponding to a 0.5% hit rate. For Lucigenin and Diogenes (
The HTS campaign
After validating the Oxyburst Green assay and estimating assay quality indicators and hit rate in a 1536-well format, 1.53 million compounds were screened at a 10-µM final concentration in 4 working days. A hit rate of 1.35% was observed, applying robust statistics. 19 All 20,374 primary hits were subjected to single-shot (10-µM) confirmation studies, and 14,944 (73.3%) reproduced inhibitory activity in duplicate. Some false positives were eliminated according to results from a secondary assay where compounds were added at the end of the incubation time, to eliminate compounds that interfered with the detection system. Dose-response studies were performed on 3777 confirmed hits that were deemed to sufficiently represent the chemical diversity. Of the compounds tested in the dose-response format, 95% showed detectable activity, and 1271 compounds were found to show pIC50s of 6 or greater.
Discussion
In assessing the 3 reagents for potential use in HTS, the Diogenes, Lucigenin, and Oxyburst Green BSA reagents all performed well in terms of IC50 reproducibility and Z′ values using cryopreserved differentiated HL-60 cells.
The more transient responses in the luminescent assays agreed with previously reported results with Lucigenin in terms of the decreased signal observed within 100 min or less. 23,24 The transient nature of the luminescent signal was confirmed by adding the DPI inhibitor at the end of the Diogenes assay with PMA-treated cells; in this case, the signal was completely lost (not shown). We presumed that once the superoxide generation was inhibited, the previously generated signal was lost within the time between adding DPI and reading the plate.
With the Lucigenin assay, we did not attempt to determine why bell-shaped PMA dose-response curves were obtained, but it is possible that the reaction by-products became inhibitory at the higher PMA concentrations or that reagent depletion was occurring. It is likely that further experiments would reveal conditions that could minimize or eliminate this effect, but these avenues were not explored.
The PMA EC50 values observed with all reagents were generally comparable, although the Oxyburst Green assay did give slightly lower EC50 values (higher potency) than the other technologies at later time points ( Fig. 2 ). The 2 luminescent formats gave higher potency DPI IC50 values than the cytochrome C and Oxyburst Green assays ( Table 1 ); the reasons for the differences are not clear but could be related to the signal stability differences between the assays.
For the Diogenes and Lucigenin luminescent assays, the instability of the signals generated could make these reagents particularly well suited for time course studies or other experiments where detection and characterization of a transient signal would be desirable. Both luminescent assays may reflect a more real-time activity of superoxide production in cells, compared with the stable Oxyburst Green BSA assay signal. Therefore, the type of detection reagent used should be tailored to the particular question at hand and carefully considered in the experimental design. We chose to run the high-throughput screen with Oxyburst Green BSA because of the statistics observed and its overall amenability to HTS. There are also many other available reagents for the detection of superoxide in cells that we did not test, 8,25 and we cannot comment on their suitability for HTS or compound profiling activities.
Based on the robustness hit rate data and the pivot plots comparing the hits from each detection method, it was clear that most hits defined by any method would be nonspecific (not related to PMA-driven superoxide generation); identification of mostly nonspecific hits in HTS is common, and experimental strategies such as reagent-only testing or compound addition at the end of the incubation time must be used to identify true hits within a larger pool of initial hits identified in the HTS. With the lowest hit rate, the Oxyburst Green assay offered an advantage for HTS by reducing the number of compounds that would need to be tested in these follow-up assays. The Oxyburst Green assay was also simpler to perform and displayed more signal stability and PMA EC50 response consistency, allowing flexibility in endpoint time point selection. In mounting a cell-based assay onto an automated robotic screening platform, flexible time points and larger acceptable time ranges for assay steps simplify the liquid handling and plate handling schemes required.
The HTS run in the 1536-well format with the Oxyburst Green BSA reagent showed excellent statistics and an acceptable and relatively low 1.35% hit rate for a cell-based screen. The speed with which it was carried out was enabled because of the miniaturization of the assay into the 1536-well format and through the use of frozen cells in the assay. The excellent results obtained with the frozen differentiated HL-60 cells represent a new direction for cell-based screening, as we attempt to model our cell systems more closely to therapeutically relevant cell types in early drug discovery activities.
Footnotes
Acknowledgements
We thank Ben Schwartz, Jeff Gross, and Anthony Jurewicz at GSK and Jeff Kitzler at National Diagnostics for helpful discussions.