
Abstract
Aim:
This study aimed to provide a representative indication of the accessibility of both adult and child ADHD assessments in Australia for psychologists, psychiatrists, and paediatricians. Accessibility was considered in terms of clinician availability, wait times for an initial session, initial session costs, and total assessment costs across Australian states and territories, remoteness areas, and socioeconomic ranges.
Methods:
Using a secret shopper design, researchers posed as potential consumers seeking an ADHD assessment for themselves and/or their child. A total of 736 clinicians were contacted via telephone between May and August 2024.
Results:
Fifty-nine percent of clinicians responded, and 49.8% of respondents were available to book an ADHD assessment. The average wait times for psychologists, psychiatrists, and paediatricians were 7, 16, and 31 weeks, respectively (Mdn = 3, 15, and 26; IQR = 7, 16, and 31). The average initial session costs and estimated total assessment costs were $266 and $1,622 for psychologists (Mdn = 250 and 1,625; IQR = 57 and 929), $748 and $1,163 for psychiatrists (Mdn = 750 and 1,086; IQR = 340 and 555), and $500 and $598 for paediatricians (Mdn = 495 and 585; IQR = 123 and 739).
Conclusion:
This study identified substantial barriers to ADHD assessment accessibility in Australia. Low clinician availability, long wait times, and high costs for assessments are all factors contributing to healthcare access inequality. Policy changes and investment, as well as further research into contributing factors, are needed to improve availability and accessibility.
Keywords
Introduction
ADHD is a neurodevelopmental condition affecting approximately 8% of children (Ayano et al., 2023) and 6.76% of adults globally (Song et al., 2021). In Australia, ADHD affects approximately 6% to 10% of children and 2% to 6% of adults (Graetz et al., 2001; Lawrence et al., 2015; Sawyer et al., 2018). Due to the negative social, health, and educational outcomes associated with misdiagnosed, late diagnosed, and undiagnosed ADHD (American Psychiatric Association, 2022; Lebowitz, 2016; Mannuzza et al., 1993; Nguyen & Hinshaw, 2020; Senate Standing Committees on Community Affairs, 2023; Wiener et al., 2012), timely and accessible assessment is necessary.
Clinician availability, long wait times, and costs have been identified as significant barriers to accessible ADHD assessments in Australia (Sawyer et al., 2004; Senate Standing Committees on Community Affairs, 2023). While there are a minority of other practitioner types qualified to diagnose ADHD (e.g., general practitioners with additional training), the vast majority qualified to assess for ADHD in Australia are psychologists, psychiatrists, and paediatricians (Australian ADHD Professionals Association, 2023; Deloitte Access Economics, 2019; NSW Government, 2025; Senate Standing Committees on Community Affairs, 2023). There are 125 psychologists, 16 psychiatrists, and 7 paediatricians per 100,000 Australians (Australian Bureau of Statistics, 2021a; Australian Institute for Health and Welfare, 2023; Jobs and Skills Australia, 2023). Data on the availability of these clinicians is absent as not all working clinicians are available for new referrals or appointments, or not all provide ADHD assessments (Australian Psychological Society, 2023). Previous research on Australian clinician accessibility found that 32% of psychologists, 46.7% of psychiatrists, and 15.2% of paediatricians were unavailable to book appointments for children across Victoria and South Australia in 2019, with the main reason being too many current clients (Mulraney et al., 2021).
Globally, wait times for ADHD assessments are a significant concern, with wait times over 12 months in Scotland (Maciver et al., 2025), and varying between 5 weeks and 8.5 years in the United Kingdom (ADHD UK, 2023). Across a range of healthcare conditions, 28% of Australians reported waiting longer than they felt acceptable to see a general practitioner (primary care physician), with 28.6% waiting longer than acceptable for medical specialist appointments (Australian Bureau of Statistics, 2024a). A Senate Committee recently reported that wait times for ADHD assessments are typically between 6 and 18 months for an initial appointment, with some reports of wait times exceeding 2 years (Senate Standing Committees on Community Affairs, 2023).
A lack of regulation on the cost of ADHD assessments has also been noted, resulting in substantial variation (Senate Standing Committees on Community Affairs, 2023). Australia’s universal healthcare scheme, Medicare, covers the total cost of public hospital services and provides rebates for eligible services provided by healthcare practitioners (Australian Government Department of Health, Disability an Ageing, 2025). While the rebate for services such as ADHD assessments is fixed, practitioners may charge additional fees to be paid by the consumer (Australian Government Department of Health, Disability an Ageing, 2025). A previous study by Mulraney et al. (2021) found that the costs of initial sessions with psychologists and paediatricians increased with higher levels of socioeconomic disadvantage. This is a substantial barrier to accessing assessments and raises concerns for healthcare access equality in Australia (Senate Standing Committees on Community Affairs, 2023).
While these concerns regarding accessibility have been noted, up-to-date nation-wide data on availability, wait times, and costs for ADHD assessments is needed. The current study provides naturalistic consumer-facing information about the availability and accessibility of ADHD assessments in Australia. Clinician availability will be assessed, with comparisons made between clinician types (psychologists, psychiatrists, and paediatricians) and between remoteness categories (Major City, Inner Regional, Outer Regional, and Remote) for wait times, initial appointment costs, and total assessment costs to assess the impact of these factors. The potential impact of socioeconomic disadvantage on these variables will also be assessed. This data may assist the identification of bottlenecks, informing providers and policymakers of unmet needs, and increasing awareness and understanding of barriers to ADHD assessment.
Method
Sample
For each state and territory, the numbers of psychologists, psychiatrists, and paediatricians registered or estimated for 2021 for each remoteness category were gathered from the Australian Institute for Health and Welfare (2023) and the Australian Government’s Labour Market Insights (2023). Based on relative workforce size and previous research (Mulraney et al., 2021), the sample size for paediatricians was approximately half of psychiatrists, with psychologists representing the vast majority. The target sample ranges were 402 to 441 psychologists, 142 to 180 psychiatrists, and 99 to 133 paediatricians.
Shapefiles for Postal Areas 2021 and Remoteness Areas 2021 from the Australian Bureau of Statistics (2021b) were integrated using the Geopandas Python library (Jordahl et al., 2020) to classify postcodes according to remoteness categories (Major City, Inner Regional, Outer Regional, Remote, and Very Remote). Data from the most recent available Census (2021) indicated that 72.2% of Australia’s population live in Major Cities, 17.9% in Inner Regional areas, 8.1% in Outer Regional areas, 1.1% in Remote areas, and 0.7% in Very Remote areas (Australian Bureau of Statistics, 2022). Socio-Economic Indexes for Areas (SEIFA) Postal Area Indexes were assigned to each postcode (Australian Bureau of Statistics, 2021c). Clinician density and remoteness information was proportionally mapped to inform target sample sizes for telephone calls in each category (clinician type, state, remoteness).
Publicly accessible directories were used to compile a representative contact sample of psychologists, psychiatrists, and paediatricians. These included Yellow Pages (439), Australian Psychological Society (40), Your Health In Mind (62), HealthShare (105), HealthEngine (4), Australasian Society for Developmental Paediatrics (74), and targeted Google searches (12). Searches combined the clinician type with “ADHD” and were refined by state and postcode to match remoteness classifications. Duplicate contacts were removed prior to calls being made, and disconnected numbers were replaced with clinician type and remoteness-matched alternatives.
Data Collection
Secret shopper studies (also referred to as mystery shopper or simulated customer studies) involve researchers posing as clients to collect information about a service from a consumer perspective, without disclosing the research intent to the provider (Rankin et al., 2022; Rhodes & Miller, 2012). This method enables the collection of realistic and unbiased data from service providers (Rankin et al., 2022). Research in primary care settings has shown that physicians often overestimate their capacity to accept new patients when hypothetically asked in questionnaires (Coffman et al., 2016), a finding supported by a comparative study of surveys and secret shopper methodology in orthopaedic surgeries (Kim et al., 2015).
In accordance with recommended methodological practices (Rankin et al., 2022), two researchers (CO and JF) conducted telephone calls using prepared scripts and standardised responses, posing as a parent seeking an assessment for themselves and/or their child. Each clinic was first asked if they conducted ADHD assessments, before being asked what age groups they would assess. This determined which vignette would be utilised, involving the parent and/or their son, a 7-year-old boy with suspected ADHD. For clinics which provided assessments for both adults and children, separate data (wait time and cost) was collected for each. If a referral was requested, researchers responded that one would be arranged prior to the assessment. Where basic demographic information (i.e., name and date of birth) was required, it was provided. If additional information was requested, the researchers declined to answer, explaining that they were not yet ready to book an appointment. If asked about scheduling limitations appointments, researchers stated there were none.
Phone calls were made using a mobile phone with caller identification disabled, ensuring that the researcher’s area code was not visible to clinics. To maintain anonymity, voicemail messages were not left, and email or booking portals were not utilised. Telephone calls were made between May 10th 2024 and August 9th 2024 on weekdays between 8 am and 5 pm. Each clinic was contacted a maximum of two times. If the initial call was not answered, but researchers were able to gain information about contact hours (e.g., answering machine stating open days/times), a second call was made within these times. Where an appointment was offered, researchers declined to proceed, stating they would call back when ready. No appointments were scheduled.
Additional data about assessment content and the number of sessions required for an assessment were also collected but are not reported here.
Statistical Analysis
Statistical analyses were conducted using JASP 0.19.3 (JASP Team, 2025). Shapiro-Wilk was utilised to test the assumption of normality, and non-parametric tests were used for analyses if this was violated. For all analyses α = .05. Bonferroni adjustments were applied within each family of related comparisons (i.e., post hoc analyses) to control the familywise error rate. Statistical testing of cost data was performed on pricing without rebates, rather than with rebates, as less data on rebates was available from clinicians. Additionally, as the total cost needs to be paid before a rebate would be provided, if available from the provider and the client was eligible, the total cost without rebate represents a more relevant barrier to accessibility.
Ethics Approval
The research protocol was approved by the University of Wollongong Research Ethics Committee (Protocol number 2023/256).
Results
Sample
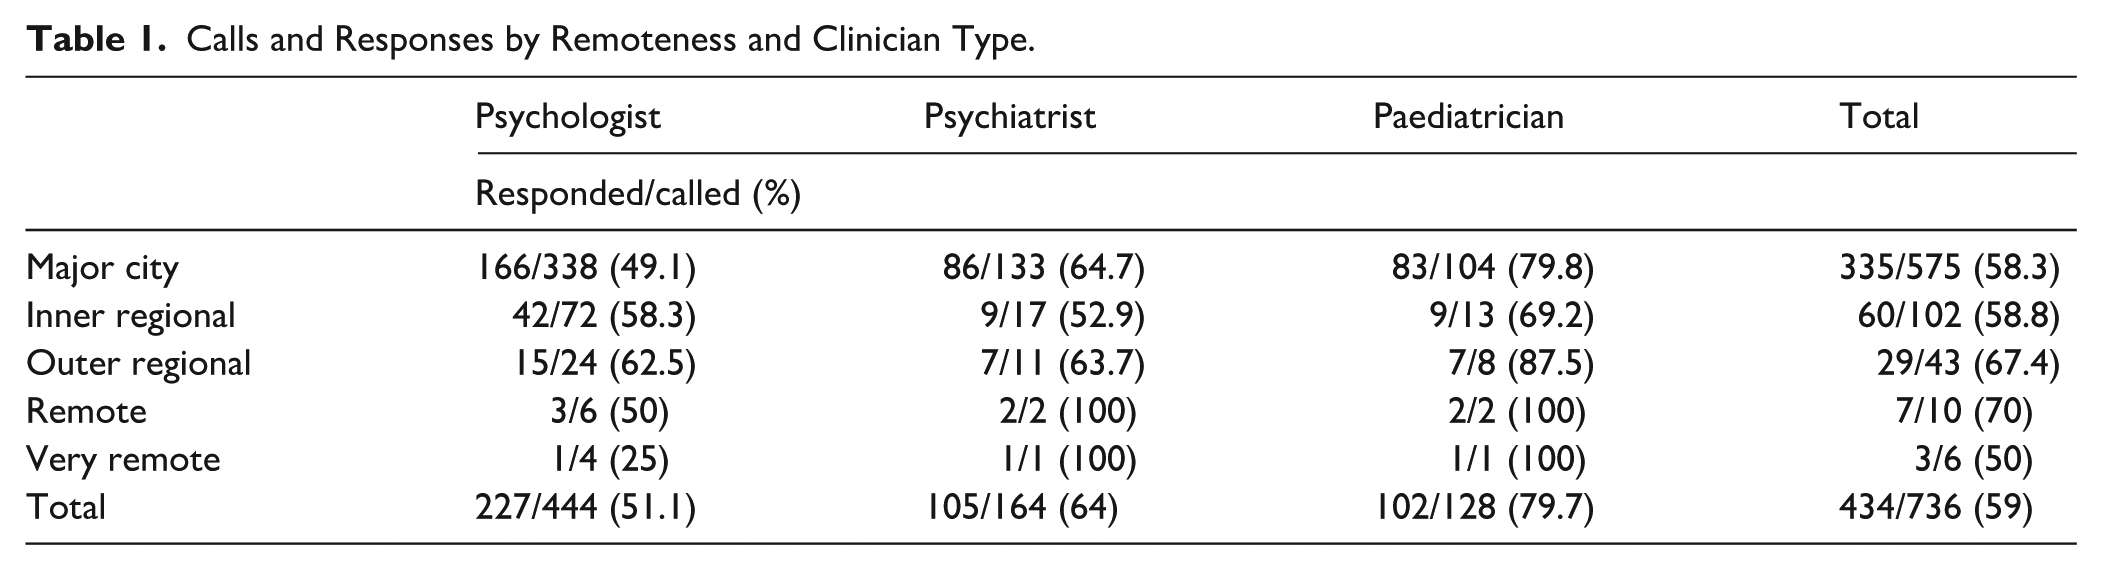
A total sample of 736 clinicians were called, including 444 psychologists, 164 psychiatrists, and 128 paediatricians. Of the 736 clinicians called, 434 responded within two calls (58.97%). Response rates were 51.13% for psychologists (n = 227), 64.02% for psychiatrists (n = 105), and 79.69% for paediatricians (n = 102). See Table 1. A Pearson’s chi-square test of contingencies compared the response rates between clinician types. The results of a chi-square test indicated significantly higher than expected response rates for paediatricians, and lower than expected response rates for psychologists (χ2 (2, N = 736) = 35.728, p < .001, Cramer’s V = .220). There was no significant difference in expected and observed values for psychiatrists (Bonferroni adjusted standardised residuals <±2.64).
Calls and Responses by Remoteness and Clinician Type.
Clinician Availability
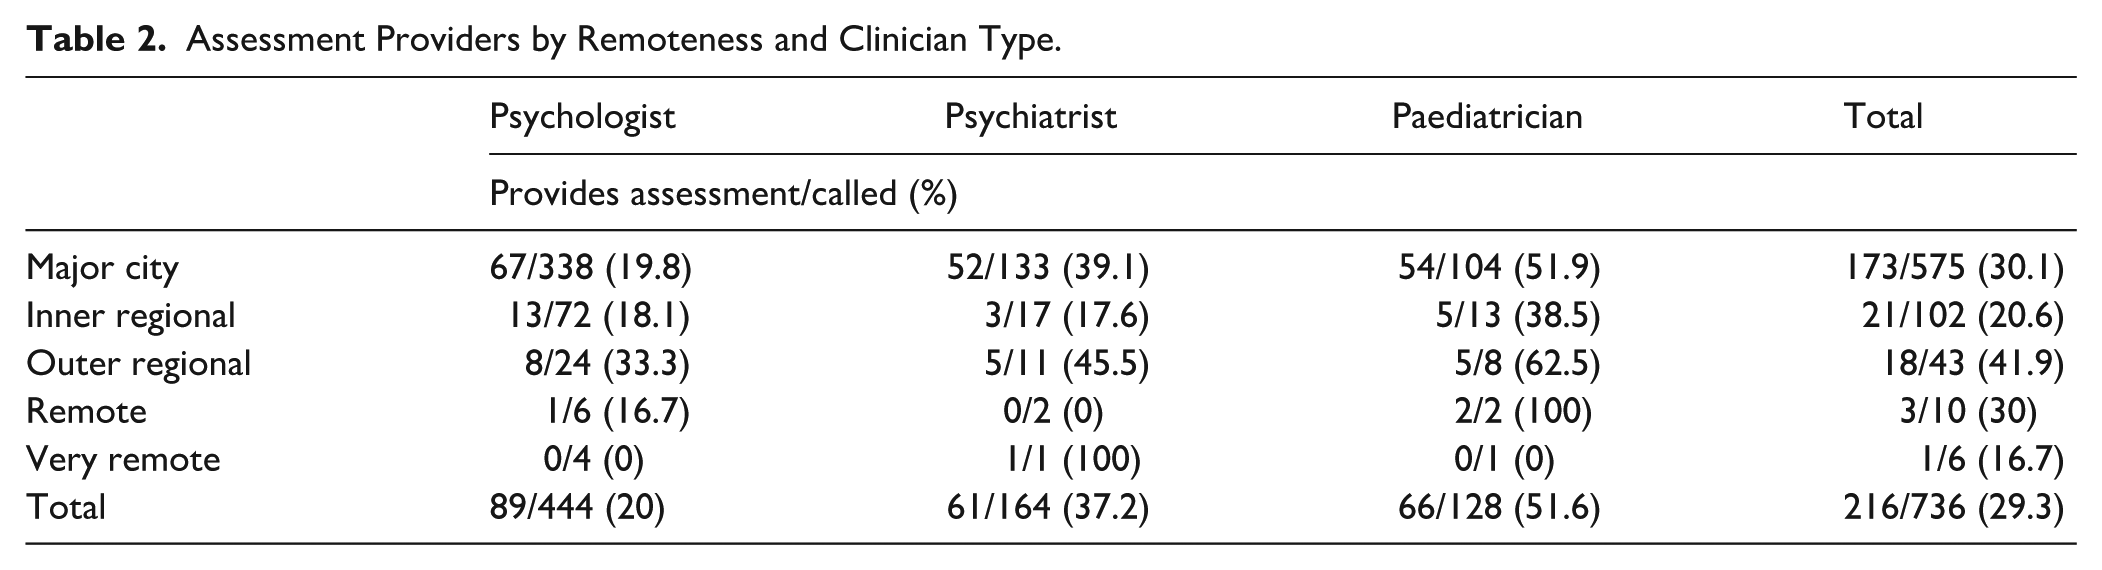
Of those who responded, 49.77% provided ADHD assessments (n = 216), including 39.21% of psychologists (n = 89), 58.1% of psychiatrists (n = 61), and 64.71% of paediatricians (n = 66). See Figure 1. Reasons given for unavailability included clinicians being on leave (n = 7), the clinic being closed (n = 18), or the clinic having its books closed to new referrals (n = 41). The proportion of respondents that did not provide ADHD assessment services (while listing ADHD as a specialty), as opposed to providing assessments but being unavailable, was not able to be determined due to limitations of the script (n = 152). Across clinician types, 132 provided assessments for adults (psychologists: 76 and psychiatrists: 56), and 159 provided assessments for children (psychologists: 77, psychiatrists: 16, and paediatricians: 66). See Table 2.
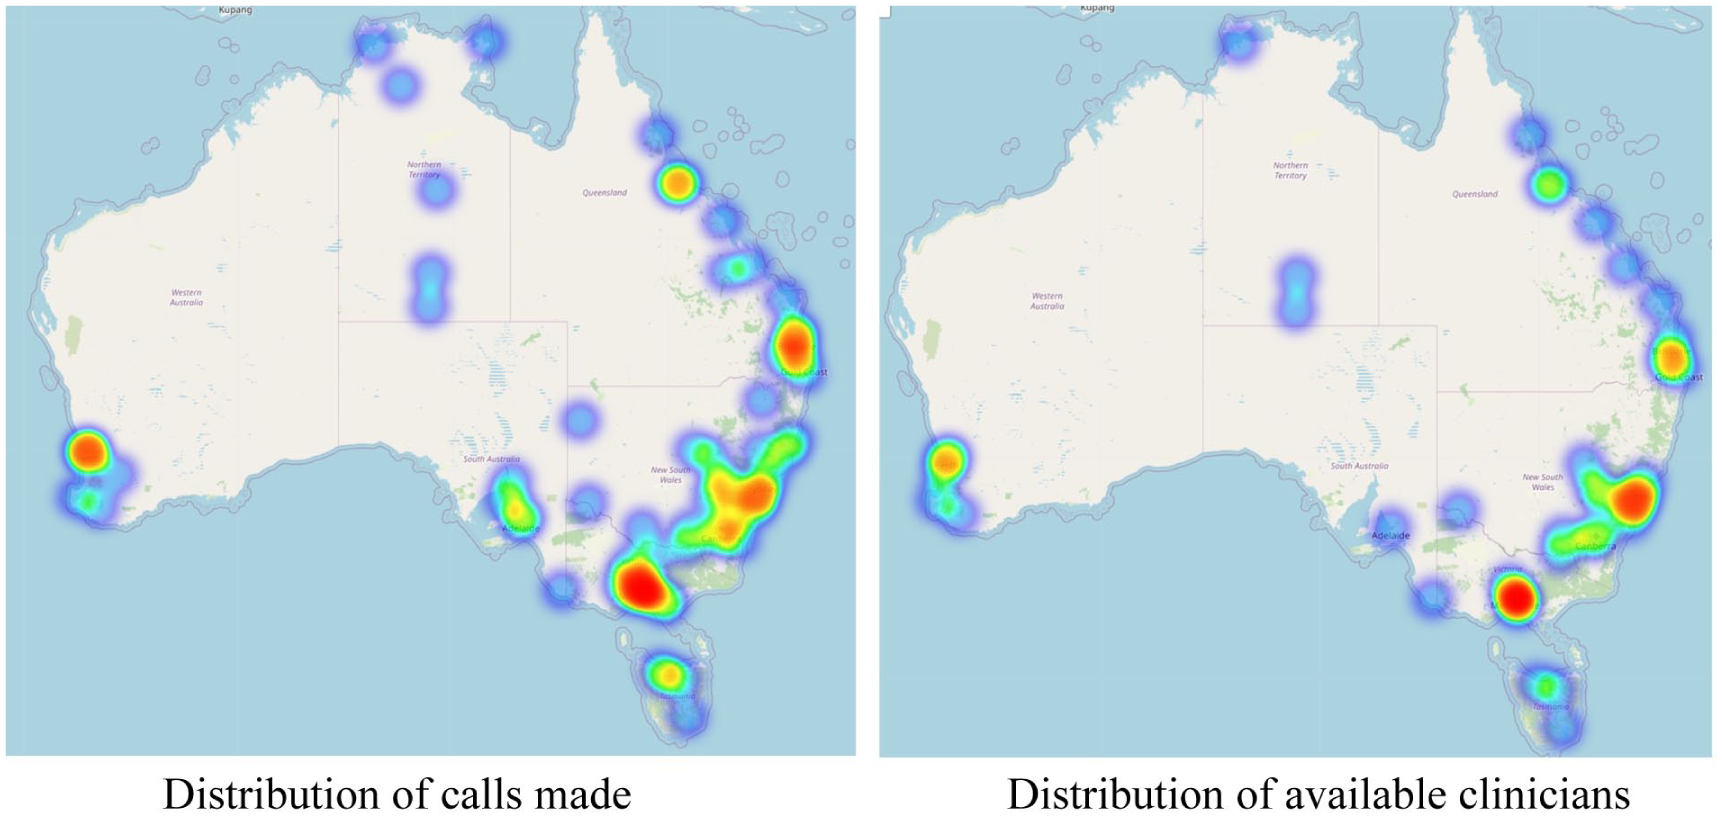
Mapped distribution of calls and available clinicians.
Assessment Providers by Remoteness and Clinician Type.
Initial Session Wait Time
As wait times were often provided as a range (e.g., 4–8 weeks), the average of the range was used for calculations aside from minimum and maximum values. There was no significant difference in wait times between clinicians who responded after one call compared to two calls (U = 2,913, p = .271).
Adults
The average wait time for an initial assessment appointment for an adult across clinician types and remoteness categories was 10.24 weeks (Mdn = 6.5, IQR = 12.75; SD = 10.16, range: 1 day–1 year). Figure 2 shows adult wait times across remoteness categories for psychologists and psychiatrists, with further detail in Table 3. A Kruskal-Wallis test found no significant difference in initial adult assessment wait times between remoteness categories (H (2) = 4.169, p = .124).
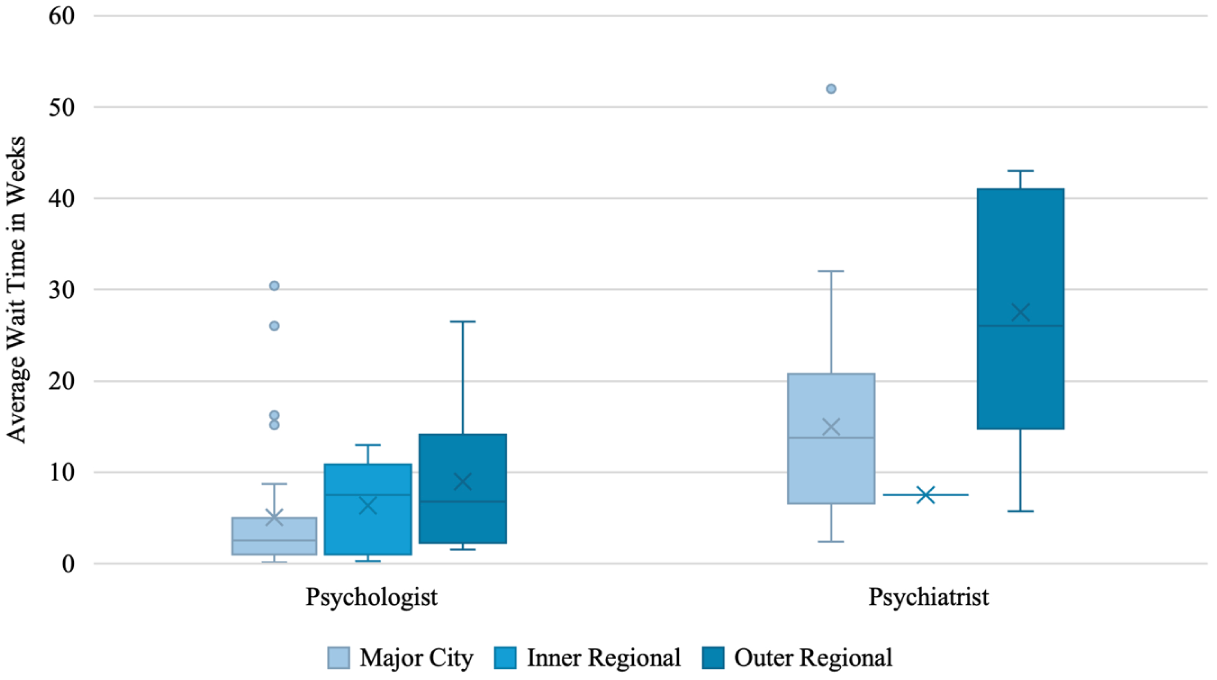
Initial assessment wait times for adults by remoteness and clinician type.
Initial Assessment Wait Times for Adults by Clinician Type.
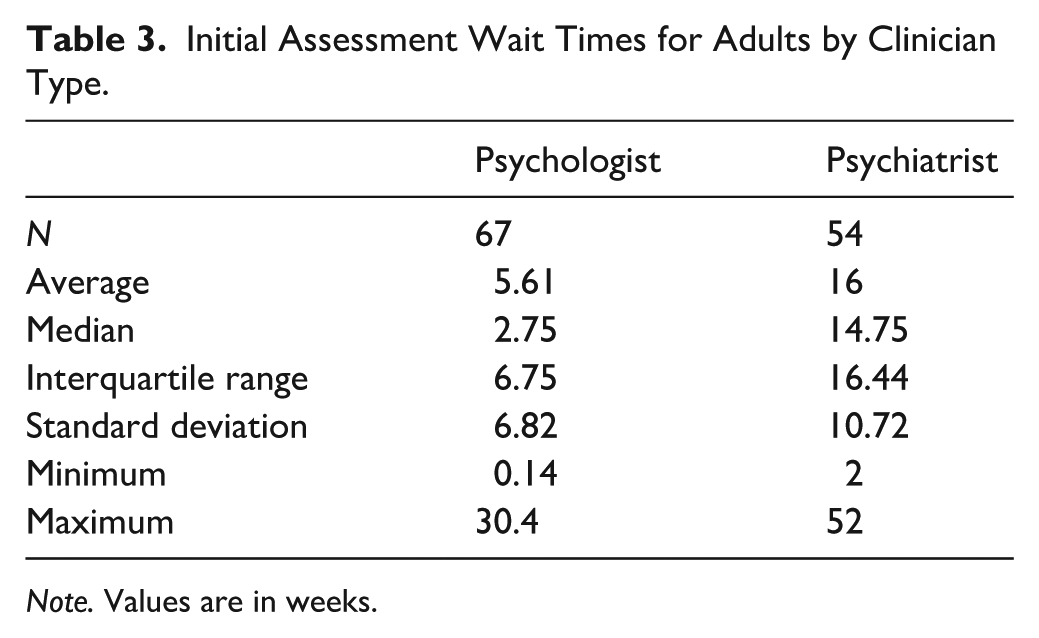
Note. Values are in weeks.
A Kruskal-Wallis test found a significant difference in initial adult assessment wait times between clinician types (H (1) = 41.504, p < .001), demonstrating significantly higher wait times for psychiatrists than psychologists. Wait time in weeks and socioeconomic disadvantage were not correlated (ρ (118) = .121, p = .190).
Children
The average wait time for an initial assessment appointment for a child across clinician types and remoteness categories was 19 weeks (Mdn = 10, IQR = 22.5; SD = 21.87, range: 1 day–2 years). Figure 3 shows child wait times across remoteness categories for psychologists, psychiatrists, and paediatricians, with further detail in Table 4. A Kruskal-Wallis test found no significant difference in initial child assessment wait times between remoteness categories (H (2) = 1.984, p = .371).
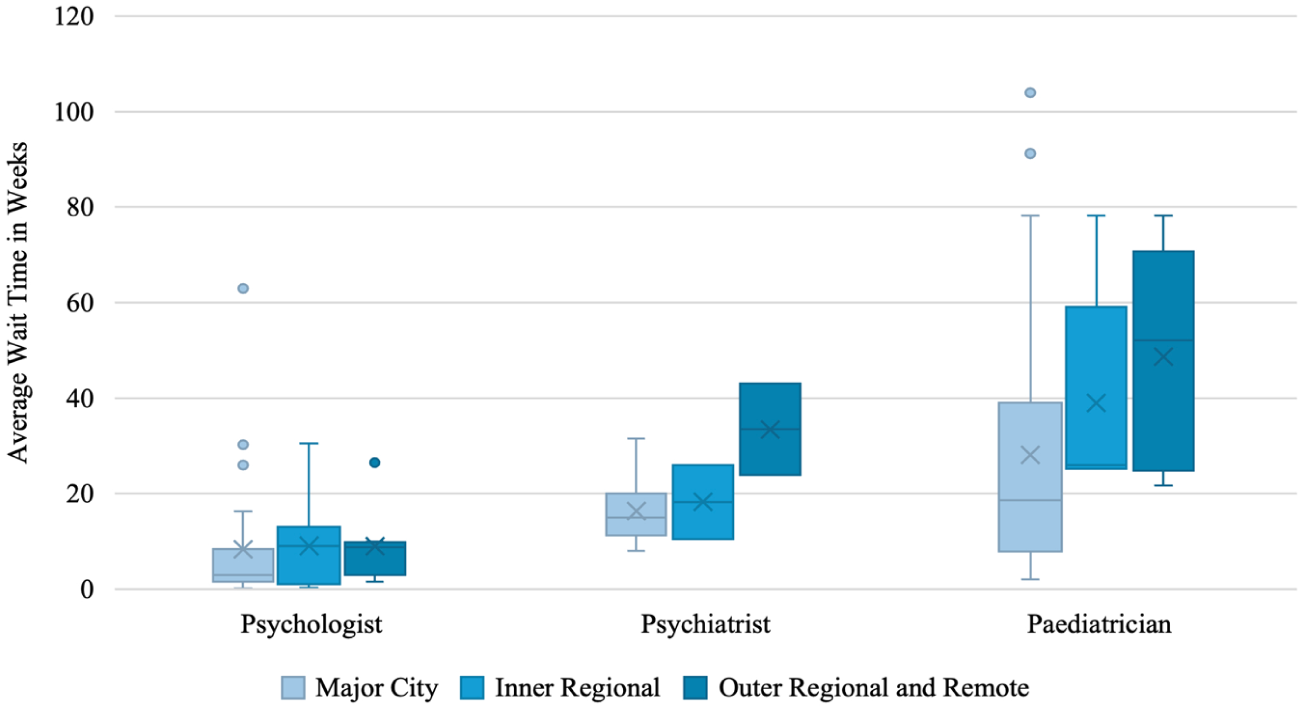
Initial assessment wait times for children by remoteness and clinician type.
Initial Assessment Wait Times for Children by Clinician Type.
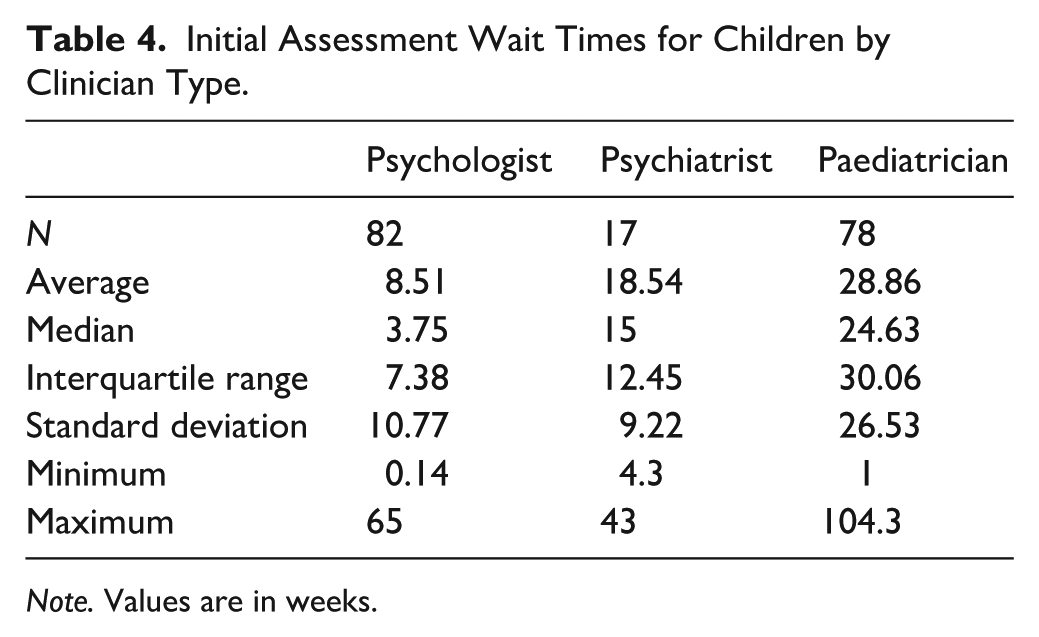
Note. Values are in weeks.
A Kruskal-Wallis test found a significant difference in initial child assessment wait times between clinician types (H (2) = 55.388, p < .001). Dunn’s post hoc comparisons demonstrated significantly higher wait times for psychiatrists and paediatricians than psychologists for child assessments (p < .001). Tested against a Bonferroni-adjusted α of .0167, both contrasts remained significant. Wait time in weeks and socioeconomic disadvantage were not correlated (ρ (140) = 0.016, p = .852).
Initial Session Cost
As initial session costs were often provided as a range (e.g., $300–$400), the average of the range was used for calculations aside from minimum and maximum values. There was no significant difference in the cost of initial appointments between clinicians who responded after one call compared to two calls (U = 1,874, p = .638).
Adults
The average initial session cost for an adult across clinician types and remoteness categories without rebates was $532.65 (Mdn = 510, IQR = 495.63, SD = 287.07, range: 170–1,350). With rebates, the average initial session cost for an adult across clinician types and remoteness categories was $418.10 (Mdn = 406.5, IQR = 293.78, SD = 251.69, range: 0–1,095). Figure 4 shows adult initial session costs across remoteness categories for psychologists and psychiatrists, with further detail in Table 5. A Kruskal-Wallis test found no significant difference in initial session costs between remoteness categories for adult assessments (H (2) = 4.158, p = .125).
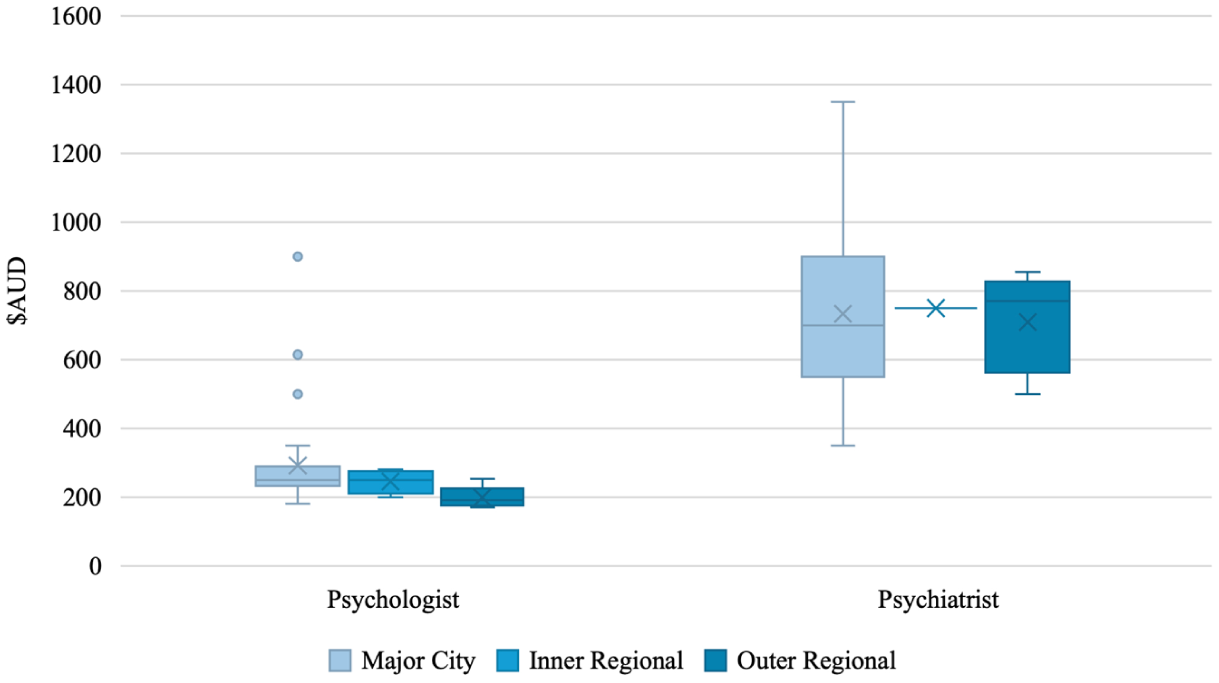
Adult average initial session cost by remoteness and clinician type.
Initial Session Cost for Adults by Clinician Type.
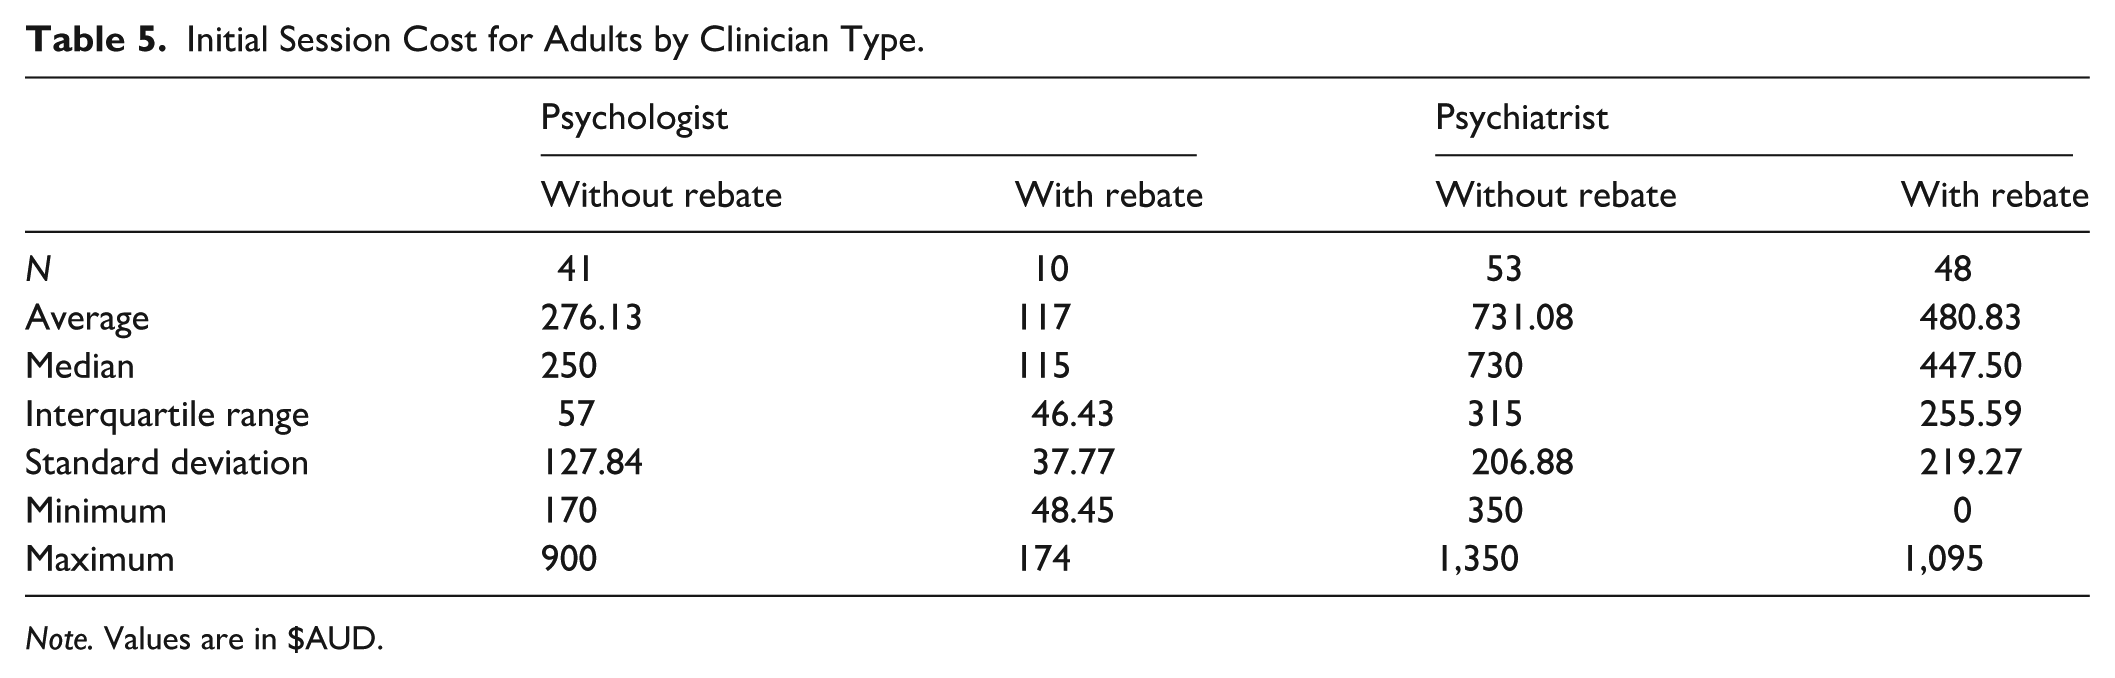
Note. Values are in $AUD.
A Kruskal-Wallis test found a significant difference in initial session costs without rebates between clinician types (H (1) = 60.526, p < .001), demonstrating significantly higher initial session costs for psychiatrists than psychologists.
Figure 5 shows the costs for the initial adult ADHD assessment session by SEIFA socioeconomic disadvantage decile rank, with a lower ranking indicating higher socioeconomic disadvantage. Initial session costs were higher in geographic regions with residents who had greater socioeconomic advantage (ρ (91) = .223, p = .032).

Initial session cost for adults by SEIFA socioeconomic disadvantage decile rank.
Children
The average initial session cost for a child across clinician types and remoteness categories without rebates was $457.49 (Mdn = 450, IQR = 304.50, SD = 223.92, range: 0–1,350). With rebates, the average initial session cost for a child across clinician types and remoteness categories was $271.61 (Mdn = 221, IQR = 190, SD = 216.59, range: 0–1,095). Figure 6 shows child initial session costs across remoteness categories for psychologists, psychiatrists, and paediatricians, with further detail in Table 6. A Kruskal-Wallis test found no significant difference in initial session costs between remoteness categories for child assessments (H (2) = 4.174, p = .124).
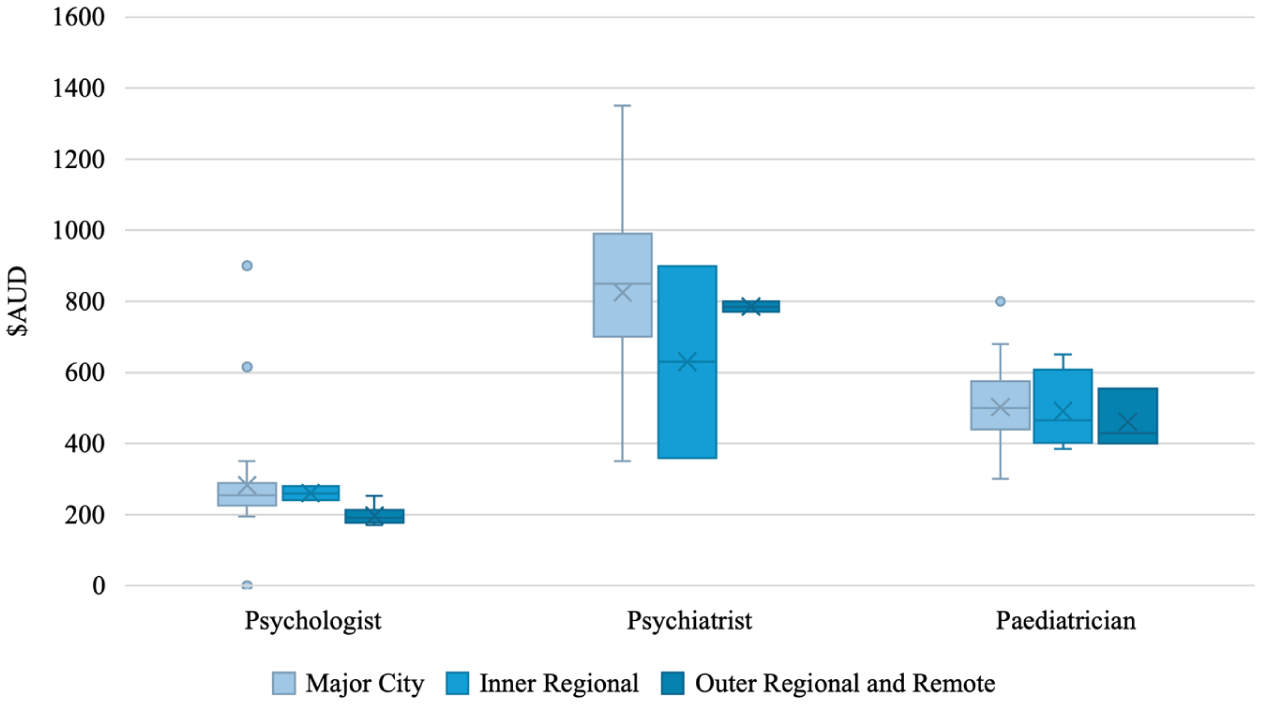
Initial session cost for children by remoteness and clinician type.
Initial Session Cost for Children by Clinician Type.
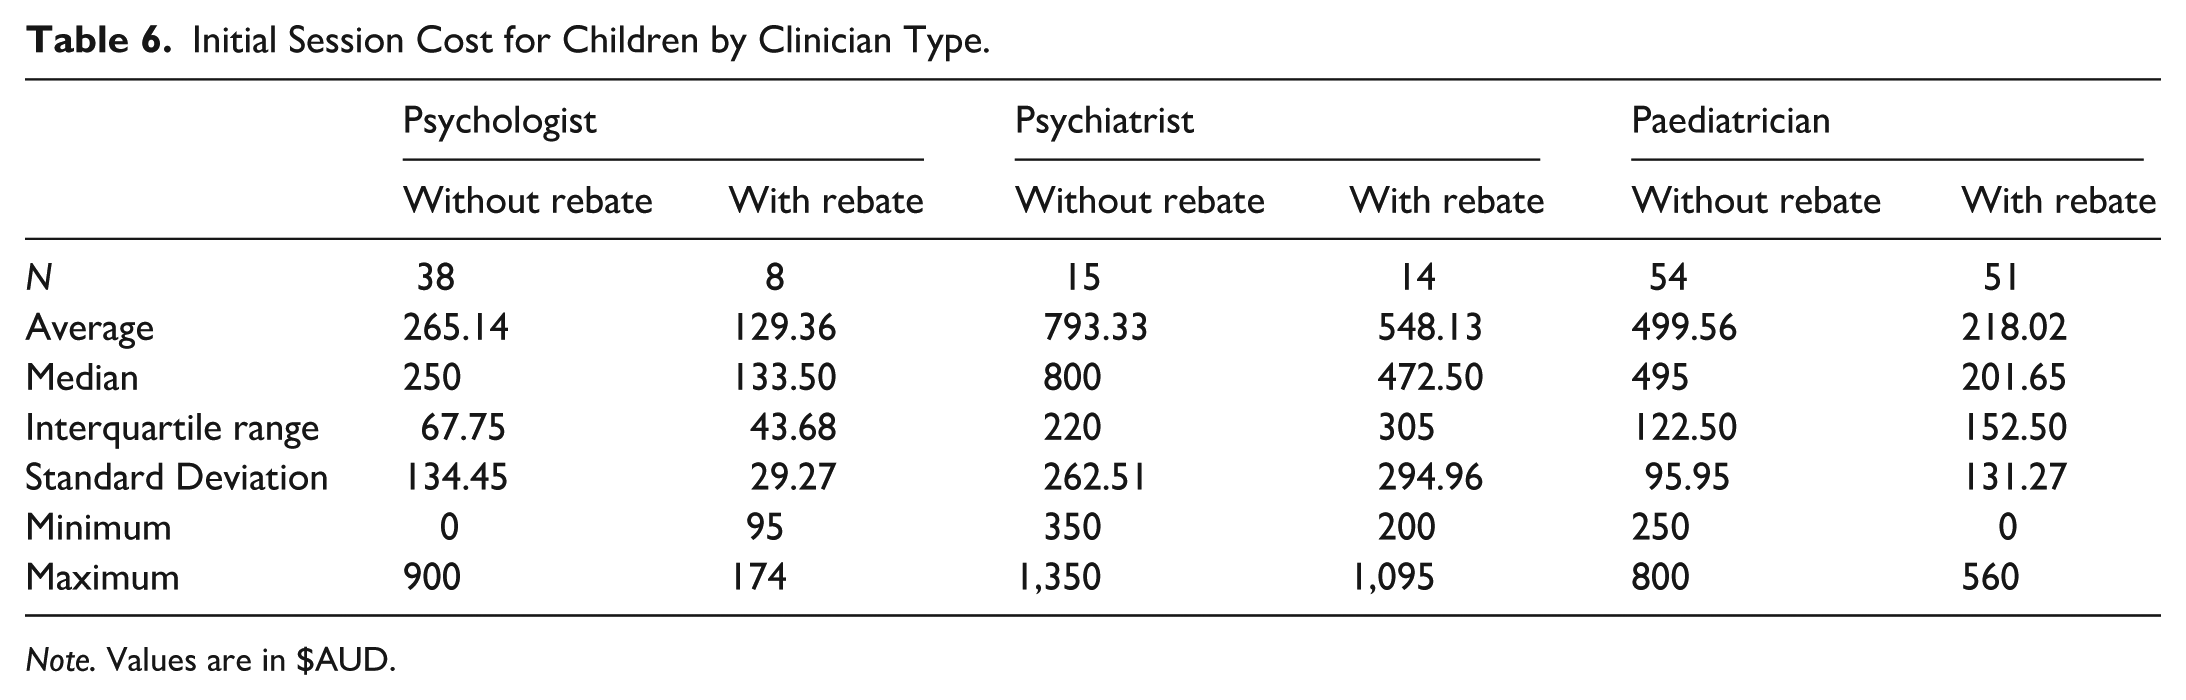
Note. Values are in $AUD.
A Kruskal-Wallis test found a significant difference in initial session costs without rebates between clinician types (H (2) = 66.502, p < .001). Dunn’s post hoc comparisons demonstrated significantly higher initial session costs for psychiatrists than paediatricians (p = .009) and psychologists (p < .001). Paediatricians had higher initial session costs than psychologists for child assessments (p < .001). Tested against a Bonferroni-adjusted α of .0167, all contrasts remained significant.
Figure 7 shows the initial session costs for child ADHD assessments by SEIFA socioeconomic disadvantage decile rank, with a lower ranking indicating higher socioeconomic disadvantage. Initial session costs were higher in geographic regions with residents who had greater socioeconomic advantage (ρ (102) = .236, p = .016).
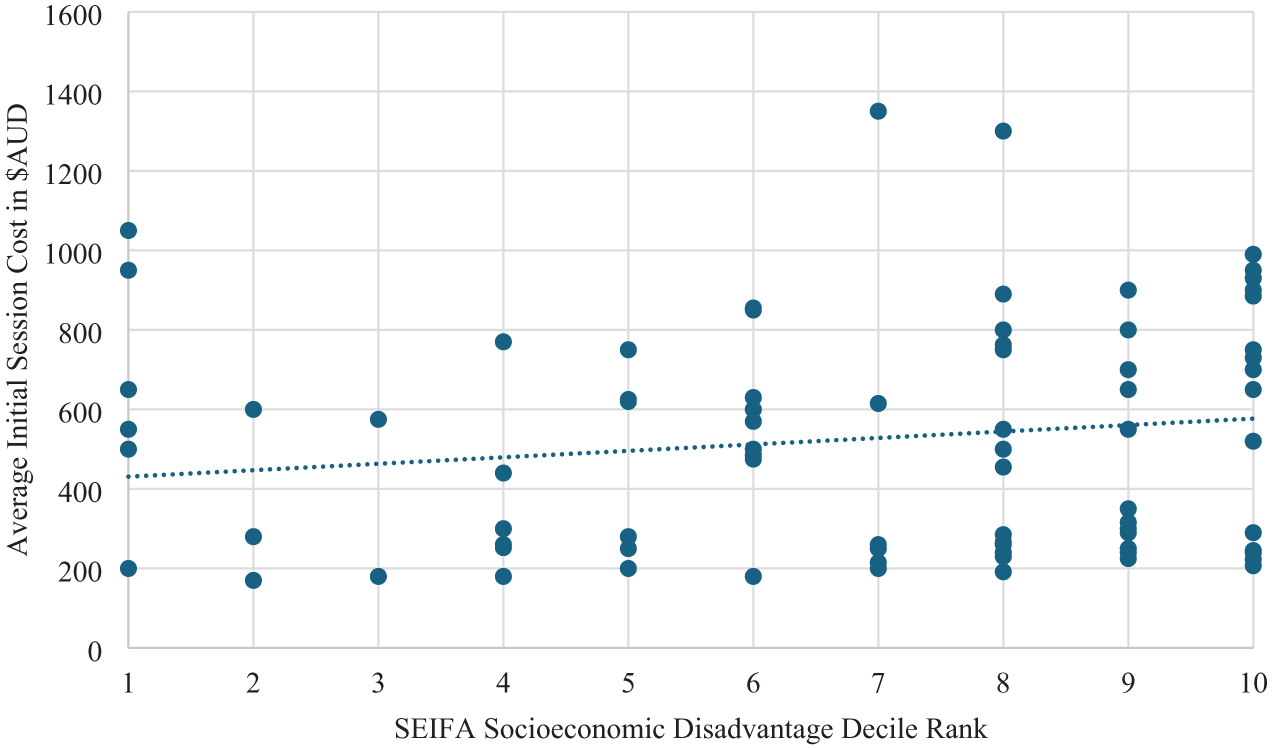
Initial session cost for children by SEIFA socioeconomic disadvantage decile rank.
Total Assessment Cost
As total assessment costs were often provided as a range (e.g., $500–$700), the average of the range was used for calculations aside from minimum and maximum values. There was no significant difference in total assessment cost between clinicians who responded after one call compared to two calls (U = 2,527, p = .319).
Adults
The average total assessment cost for an adult across clinician types and remoteness categories with rebates was $1,387.29 (Mdn = 1,325, IQR = 945, SD = 687.73, range: 230–3,915). With rebates, the average total session cost for an adult across clinician types and remoteness categories was $774.14 (Mdn = 675, IQR = 545, SD = 435.33, range: 0–1,917). Figure 8 shows adult total assessment costs across remoteness categories for psychologists and psychiatrists, with further detail in Table 7. A Kruskal-Wallis test found no significant difference in total assessment costs between remoteness categories for adult assessments (H (2) = 2.869, p = .238).
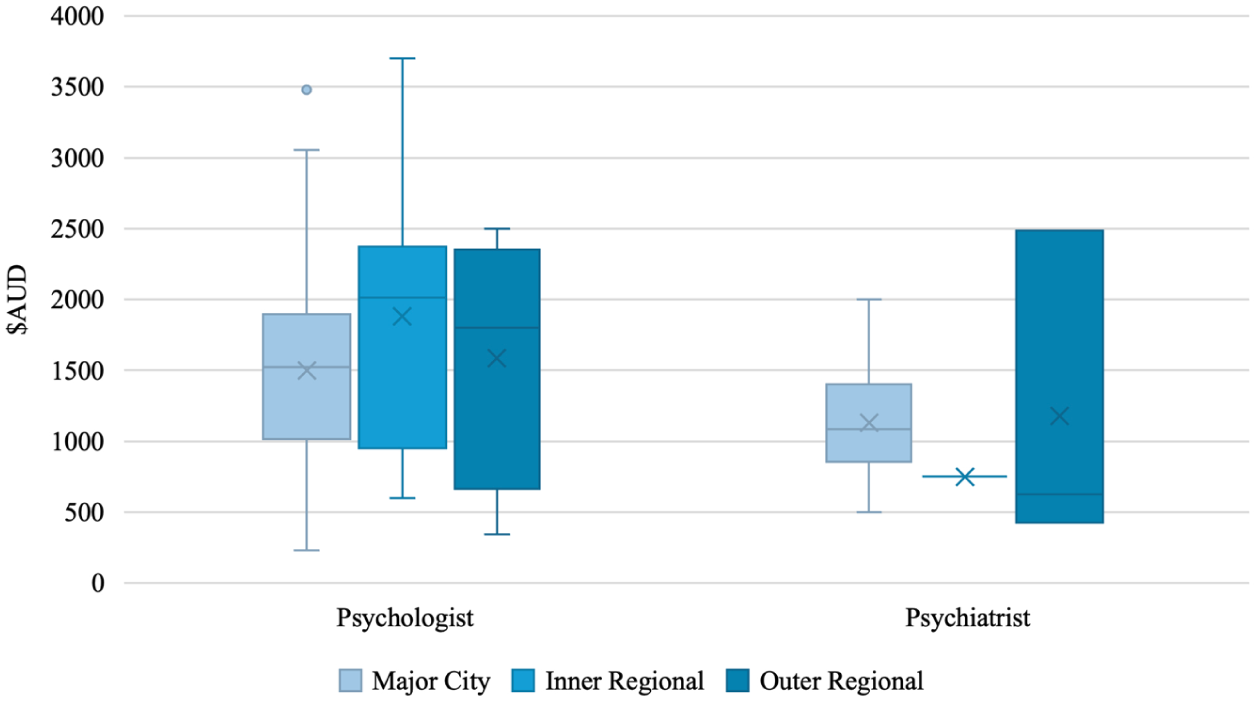
Total assessment cost for adults by remoteness and clinician type.
Total Assessment Cost for Adults by Clinician Type.
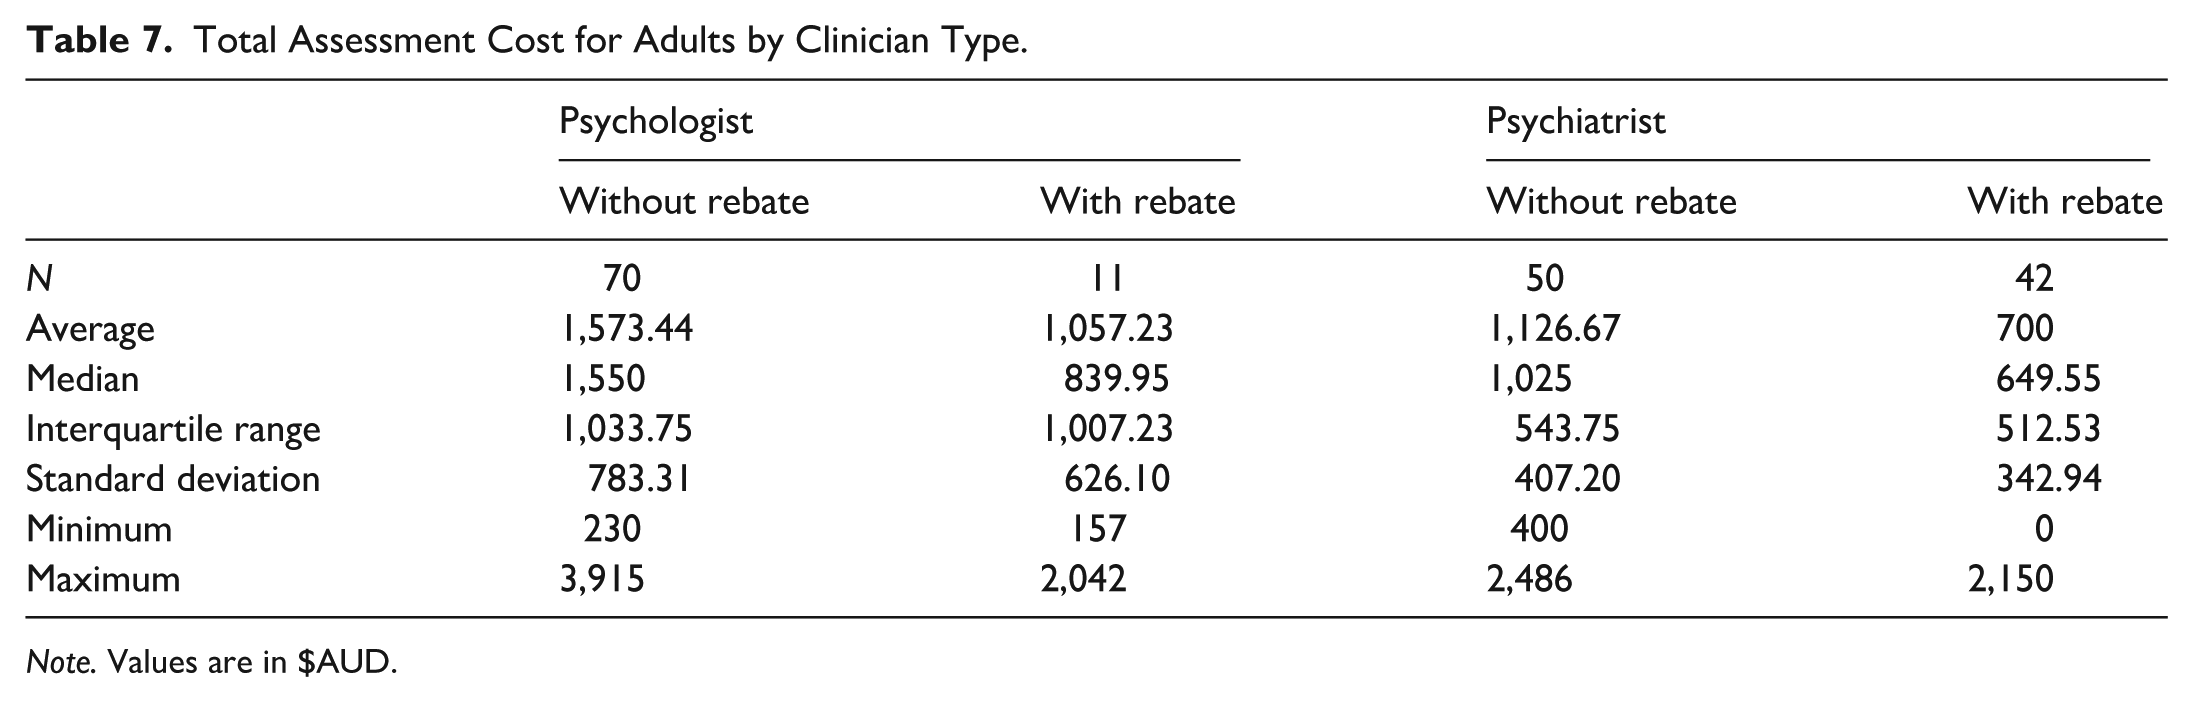
Note. Values are in $AUD.
A Kruskal-Wallis test found a significant difference in total assessment costs without rebates between clinician types (H (1) = 11.845, p < .001), demonstrating significantly higher total assessment costs for psychologists than psychiatrists. Total assessment costs and socioeconomic disadvantage were not correlated (ρ (118) = −.010, p = .913).
Children
The average total assessment cost for a child across clinician types and remoteness categories without rebates was $1,393.85 (Mdn = 1,372.50, IQR = 1,115.63, SD = 732.75, range: 100–3,915). With rebates, the average total session cost for a child across clinician types and remoteness categories was $724.55 (Mdn = 485, IQR = 765, SD = 531.10, range: 0–2,220). Figure 9 shows child total assessment costs across remoteness categories for psychologists, psychiatrists, and paediatricians, with further detail in Tables 8 and 9.
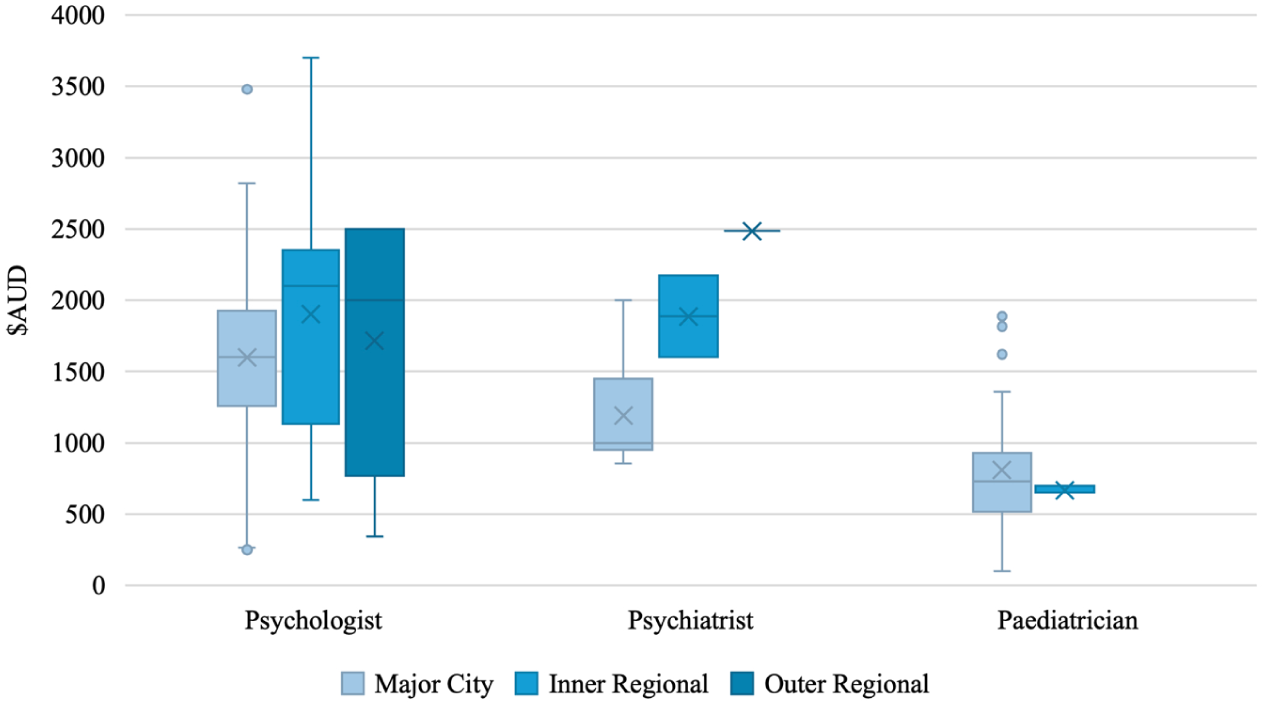
Total assessment cost for children by remoteness and clinician type.
Total Assessment Cost for Children by Remoteness.
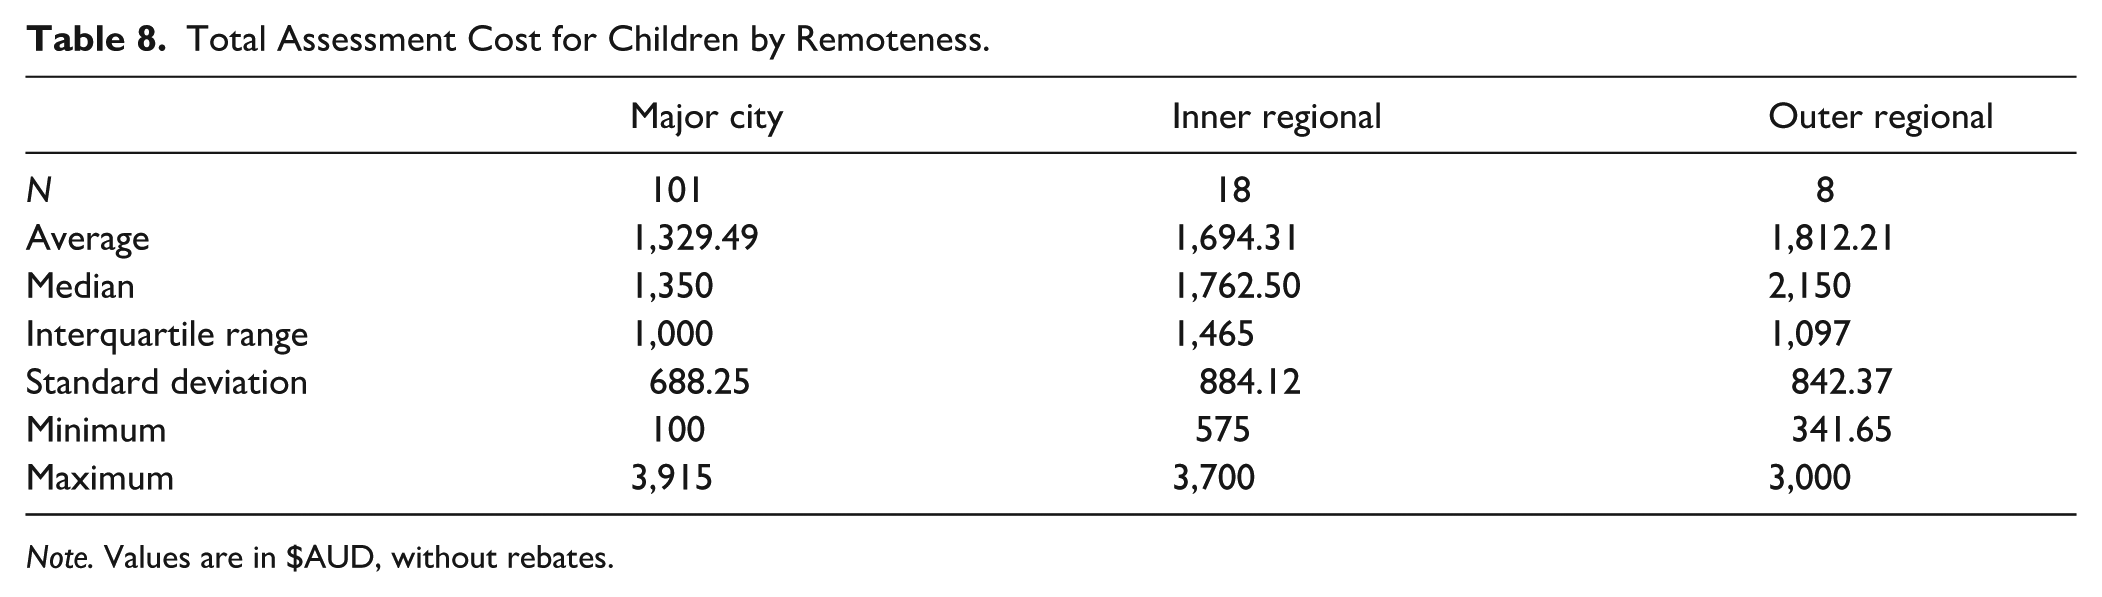
Note. Values are in $AUD, without rebates.
Total Assessment Cost for Children by Clinician Type.
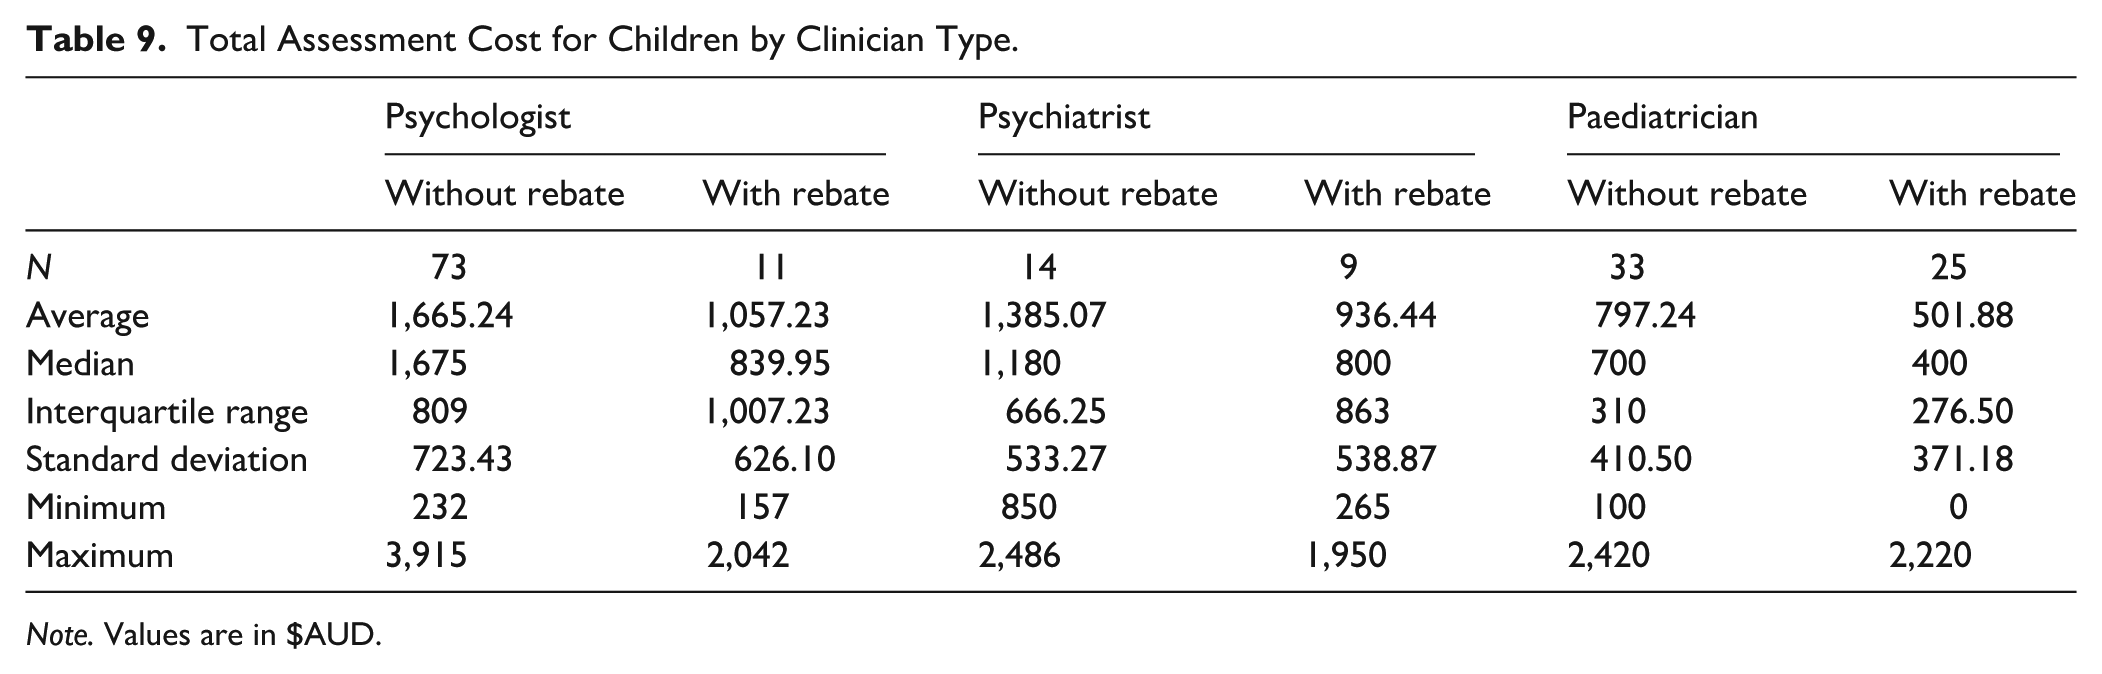
Note. Values are in $AUD.
A Kruskal-Wallis test found a significant difference in total assessment costs without rebates between remoteness categories for child assessments (H (2) = 6.496, p = .039). Dunn’s post hoc comparisons did not reach significance.
A Kruskal-Wallis test found a significant difference in total assessment costs without rebates between clinician types (H (2) = 33.845, p < .001). Dunn’s post hoc comparisons demonstrated significantly higher total assessment costs for psychiatrists (p = .004) and psychologists (p < .001) than paediatricians for child assessments. Tested against a Bonferroni-adjusted α of .0167, all contrasts remained significant. Total assessment costs and socioeconomic disadvantage were not correlated (ρ (118) = −.052, p = .573).
Discussion
This study aimed to provide an up-to-date representative indication of ADHD assessment accessibility across Australia, utilising a naturalistic secret shopper methodology. The generalisability of the results is increased through the use of remoteness and clinician density in determining the clinician sample, and inclusion of the three most common clinician types assessing for ADHD (Deloitte Access Economics, 2019). The importance of adult ADHD assessments is increasingly recognised (Senate Standing Committees on Community Affairs, 2023) and highlights the need to expand research beyond children. This study’s inclusion of adult and child clients offers a novel contribution to the field and improves our understanding of ADHD across the lifespan.
The results have demonstrated substantial barriers to ADHD assessment in the areas of availability, wait times, and costs, consistent with previous research in Australia, and internationally (ADHD UK, 2023; Maciver et al., 2025; Mulraney et al., 2021; Sawyer et al., 2004; Senate Standing Committees on Community Affairs, 2023). The lack of response within two telephone calls by 41.03% of clinicians is of concern. The administrative burden this places on consumers may be exacerbated by executive dysfunction difficulties typical of ADHD (Boonstra et al., 2005; Senate Standing Committees on Community Affairs, 2023), inhibiting accessibility for those who may need it most. Significantly lower than expected response rates were found for psychologists (51.13%), in contrast to the expected response rate for psychiatrists (64.02%). As both psychologists and psychiatrists have similar rates of part-time workers (39% and 36%, respectively; Jobs and Skills Australia, 2024a, 2025), higher administrative support for psychiatrists may account for this difference. Paediatricians were found to respond at higher than expected rates (79.69%), which may be explained by a lower proportion of part-time workers (25%; Jobs and Skills Australia, 2024b) and administrative support.
Across clinician types, 49.77% of respondents provided ADHD assessments for either adults or children, with the lowest rate for psychologists (39.21%) and the highest rate for paediatricians (64.71%). In comparison to Mulraney et al. (2021) findings on clinician availability for child appointments (for ADHD and anxiety), similar rates are found for psychologists (39.21 to 32%) and psychiatrists (58.1% to 46.7%), with far higher availability of paediatricians in the current study (64.71% to 15.2%). As all clinician searches included the key word “ADHD,” the lower rate of availability from psychologists may be due to an increased provision of treatment but not assessment for ADHD. In remote and very remote areas, the number of available services is low. Some states had no listed clinicians in these remoteness categories, and three quarters of remote or very remote clinicians who were contacted either did not respond (37.5%) or were not available to provide an assessment (37.5%).
The most common reason for clinicians being unavailable was being closed to new referrals, which is consistent with previous findings from Mulraney et al. (2021). This reflects an imbalance of demand and supply of qualified clinicians to provide services (Senate Standing Committees on Community Affairs, 2023). The Senate Standing Committee noted that this imbalance contributes to higher costs and longer wait times for assessments as the capacity of the system is under strain (Senate Standing Committees on Community Affairs, 2023).
No significant difference was found in average wait times across remoteness. For adults, psychiatrists had significantly longer wait times than psychologists which may be due to the substantially lower volume of working psychiatrists than psychologists (16 and 125 per 100,000 Australians, respectively; Australian Institute for Health and Welfare, 2023). Wait times for children also seemed to reflect scarcity of clinicians between types, as wait times were significantly longer for paediatricians than psychiatrists and psychologists (28.86, 18.54, and 8.51 weeks, respectively; Australian Institute for Health and Welfare, 2023; Jobs and Skills Australia, 2023). Previous Australian research across healthcare conditions found average wait times of 11 weeks for psychiatrists (Yang & Zhang, 2025), and 6 weeks for paediatricians (Mulraney et al., 2021). Further, 80% of Australians seeking mental health support waited less than three months for an appointment (Healthengine & Patients Australia, 2025). In comparison, the current findings indicate longer wait times for ADHD assessments from these providers. In comparison to reports from the Senate Standing Committees on Community Affairs (2023), wait times for ADHD assessments were generally shorter than the stated 6-to-18-month delay. However, average wait times for psychiatrists and paediatricians were between 4 and 6 months, with maximum wait times across clinicians ranging from 7 months to 2 years. These wait times are consistent with the Committee’s findings and indicate a significant barrier for those without alternative options. No significant association between socioeconomic disadvantage and child or adult wait times was found.
Initial session costs did not significantly differ by remoteness. For adults, psychiatrists had significantly higher initial session costs, but lower total assessment costs ($731.08 and $1,126.67), relative to psychologists ($276.13 and $1,573.44). For children, psychologists reported a significantly lower initial session cost but the highest average total assessment cost ($265.14 and $1,665.23). Child psychiatrists provided a significantly more expensive initial session ($793.33) but non-significantly different total assessment cost ($1,385.07). However, child clients could also access paediatricians, who reported an average initial session cost of $499.56, and a significantly less expensive total assessment cost at $797.24. These differences between clinicians may be due to differences in assessment practices and required sessions for a complete assessment, as fewer more expensive sessions may decrease the average cost.
Variations in available Medicare (Australia’s publicly funded universal healthcare scheme) subsidies may also influence the post-rebate cost of assessments between practitioners. A lack of clarity in the applicability of mental health care plans, and an apparent underutilisation of Medicare items for the assessment of neurodevelopmental conditions is a significant concern (Derrick et al., 2024). While consumers may be entitled to a rebate, they may not be aware of them, and their clinician may not apply them to their appointment costs. To be eligible for a Medicare rebate for ADHD assessments conducted by a psychologist, a referral from a psychiatrist or paediatrician is required, which complicates the process and increases the potential cost (Services Australia, 2024). While Medicare rebates can be of significant assistance in improving economic access to ADHD assessments, clients are still required to pay the total pre-rebate cost upfront to access the appointment, and often need to pay the remaining fee gap, limiting accessibility (Mulraney et al., 2021). Rebates are also not available for adults over 25 years old (Services Australia, 2024).
Consistent with Mulraney et al. (2021), a significant positive correlation was found between socioeconomic disadvantage and initial session costs, for both adults and children (ρ = .223 and .236). Areas of higher socioeconomic disadvantage were found to have lower initial session costs, which should increase the accessibility of these assessments. However, as no significant correlation was found between adult or child total assessment costs and socioeconomic disadvantage, paying for the total assessment is no more accessible in these areas.
As the cost of living increased for all household types in June 2024 (Australian Bureau of Statistics, 2024b), and rose between 2.5% and 4% in the 12 months before December 2024 (Australian Bureau of Statistics, 2024c), this data was collected during a period of increasing economic pressure. The median personal income for Australians was $55,062 in 2021 to 2022 (Australian Bureau of Statistics, 2024d), with the median weekly earning for employees in August 2024 of $1,396 (Australian Bureau of Statistics, 2024e). As such, the expenses associated with ADHD assessments reported here may not be realistic for a substantial proportion of the population. Economic limitations on access to ADHD assessment can have significant flow-on effects, limiting treatment accessibility and ultimately resulting in a lower quality of life (American Psychiatric Association, 2022; Lebowitz, 2016; Mannuzza et al., 1993; Nguyen & Hinshaw, 2020; Senate Standing Committees on Community Affairs, 2023; Wiener et al., 2012)—effects which disproportionately affect Australians on lower incomes.
The current study has several limitations. As a secret shopper study, actual wait times and costs could not be assessed. Due to cancellations, wait times for initial appointments may be overestimated in comparison to real-world outcomes. Similarly, changes to assessment procedures based on client presentation may affect total assessment costs. While the current study provides an accurate representation of available consumer-facing data before the assessment, these outcomes may vary in practice. While clinicians were contacted based on their listing of ADHD as a speciality, data was not collected to clarify if all unavailable clinics provided ADHD assessments and were unavailable, or did not provide assessments. The collection of data for this study took place between May and August 2024. Variation in demand across the year due to funding applications and school considerations may influence clinician availability and wait times (Mulraney et al., 2021). Data was not available for all remoteness categories due to limited available clinicians and response rates. As the study protocol did not include leaving messages for return calls, successful contact rates may have been reduced, particularly for clinicians with lower administrative support. As data is only available from clinicians who responded within two phone calls, there is potential for response bias. Clinics that were available to take calls may have shorter wait times, leading to an underestimation of true wait times. Clinics which rely solely on online booking or provide online-only assessments were not included in the current study but may differ in accessibility.
Future research is needed to investigate assessment practices in ADHD assessment across Australian clinicians, to better understand differences between clinicians and factors which may be contributing to accessibility. Investigating client and clinician perspectives on current ADHD assessment practices and accessibility would also be valuable in order to utilise these stakeholders’ knowledge to improve this area of practice.
In conclusion, this study found substantial barriers to the accessibility of ADHD assessments in Australia. Low clinician availability, long wait times, and high costs for assessments are all factors contributing to healthcare access inequality in this area. Improved accessibility through policy changes and investment, as well as further research into contributing factors, is needed to improve outcomes.
Footnotes
Ethical Considerations
This study was approved by the University of Wollongong Social Sciences Human Research Ethics Committee (Protocol number 2023/256) on the November 28, 2023.
Consent to Participate
Consent to participate has been waived by the committee.
Funding
The authors disclosed receipt of the following financial support for the research, authorship, and/or publication of this article: This research was supported by an Australian Government Research Training Program (RTP) Scholarship doi.org/10.82133/C42F-K220.
Declaration of Conflicting Interests
The authors declared no potential conflicts of interest with respect to the research, authorship, and/or publication of this article.
Data Availability Statement
Due to limits of ethics approval, data was not able to be made publicly available.