
Abstract
Objective:
Experiences of “auditory hyper-reactivity” and decreased sound tolerance, which can be separated into phenotypes such as hyperacusis and misophonia, are prevalent in autism and ADHD and impact quality of life and wellbeing. Furthermore, atypical patterns of attention regulations—including hyper-focus and inattention—are common in both autism and ADHD. Prior research also suggests sensory hyper-reactivity can cause anxiety, and anxiety can be associated with hyper-vigilance. It is currently unclear whether hyper-focusing on stimuli, having one’s attention captured by them, or being hyper-vigilant toward them could lead to sensory hyper-reactivity. Therefore, this study investigates relationships among hyper-focus, inattention, hyper-vigilance, auditory hyper-reactivity, and anxiety.
Method:
Four hundred ninety-two adults (122 ADHD-only, 130 autistic-only, 141 autistic + ADHD, and 99 comparison) completed questionnaires indexing hyper-focus, inattention, and various forms of auditory hyper-reactivity; participants also completed a psychoacoustic measure by rating the pleasantness of misophonic trigger sounds.
Result:
Per questionnaires, auditory hyper-reactivity was markedly elevated in both autistic and ADHD participants relative to comparison participants (.46 ≤ Cliff’s δ ≤ .84), whereas differences between autism and ADHD alone were small (.05 ≤ |Cliff’s δ| ≤ .21) and not consistent in sensitivity analyses. Path analysis suggested hyper-vigilance, hyper-focus, and inattention were related to auditory hyper-reactivity, which was related to anxiety, which was related to hyper-vigilance, potentially reflecting a cyclic relationship. However, psychoacoustic misophonia was only modestly related to self-reported misophonia scores (.22 ≤ Spearman’s ρ ≤ .31), and contributed little to the auditory hyper-reactivity composite included in the path analysis.
Conclusion:
These findings generally support the idea that attention may be connected to many neurodivergent people’s auditory hyper-reactivity, but also emphasize the need for improved measurement of sensory experiences.
Introduction
Atypical sensory experiences and behaviors are common in both Attention Dysregulation Hyperactivity Development (ADHD) 1 and Autism Spectrum Development (ASD). In autism, studies examining autism diagnostic measures and health/educational records have reported prevalence estimates of 72% to 74% (Carson et al., 2021; Kirby et al., 2022), and studies using dedicated sensory measures often report considerably higher prevalences (Crane et al., 2009; Dellapiazza et al., 2018). There is reason to believe that differences from typical sensory processing could be more pronounced in autism than ADHD (Little et al., 2015; Salah et al., 2024; Schulz et al., 2022)—after all, sensory reactivity differences are part of the autism diagnostic criteria but not the ADHD diagnostic criteria. Research priorities related to sensory differences have been articulated for autism (e.g., Cage et al., 2024; Whitehorne-Smith et al., 2023), but not, to our knowledge, for ADHD (Gaynes et al., 2014; Jacobson et al., 2016; Stephens et al., 2025) despite the apparently larger extant autism (Ben-Sasson et al., 2019) than ADHD (Jurek et al., 2025) sensory literature. However, other studies find no or only modest sensory differences between autism and ADHD (Cheung & Siu, 2009; Clince et al., 2016; Dellapiazza et al., 2021; Huang et al., 2024; Itahashi et al., 2020; Scheerer, Pourtousi, et al., 2024). Unfortunately, these common neurodivergent experiences of sensory discomfort and distress often have serious disabling consequences. Indeed, sensory processing appears to be associated with (Lin & Huang, 2019) or an aspect of (McConachie et al., 2020) autistic people’s quality of life. In both autism and ADHD, sensory processing appears to interfere with participation in activities (Engel-Yeger & Ziv-On, 2011; Ismael et al., 2018; Little et al., 2015) and be related to sleep (Dwyer, Ferrer, et al., 2022; Lufi & Tzischinsky, 2014; Mimouni-Bloch et al., 2021; Tzischinsky et al., 2018) and anxiety (Bitsika et al., 2020; Lane & Reynolds, 2019; Normansell-Mossa et al., 2021).
Sensory Phenotyping
Many sensory measures index generalized constructs such as “hyper-reactivity” or “hyper-sensitivity” in neurodivergent people, along with other general constructs like hypo-reactivity and sensory seeking (Baranek et al., 2006; Lai et al., 2019; Robertson & Simmons, 2013). 2 However, there are likely multiple distinct constructs underlying hyper-reactivity (Williams et al., 2023), even in single sensory modalities such as hearing (Jastreboff & Jastreboff, 2015; Williams, He, et al., 2021). Unfortunately, it is presently unclear how these more specific sensory constructs might differ across autism and ADHD.
One aspect of auditory “hyper-reactivity” might be auditory distractibility: the capture of attention by sounds, interfering with people’s ability to concentrate on tasks, which has been reported in both autism (Howe & Stagg, 2016; Landon et al., 2016) and ADHD (Cassuto et al., 2013; Johnson, 2014; Oja et al., 2016). Such experiences of auditory distractibility need not necessarily be uncomfortable or distressing.
There also appear to be multiple varieties of decreased sound tolerance, including misophonia (Jastreboff & Jastreboff, 2015; Williams, He, et al., 2021). Misophonia is characterized by strong emotional and autonomic reactions, including irritation, anger, and disgust, toward specific trigger sounds; the reactions are driven not only or primarily by the intensity of the sounds but by the patterns and meanings of sounds (Cavanna & Seri, 2015; Ferrer-Torres & Giménez-Llort, 2022; Swedo et al., 2022) and they accordingly require sound identification (Savard et al., 2022). Repetitive oral/nasal sounds (e.g., chewing) appear to be particularly common or strong triggers, but other human-generated and non-human-generated sounds can also elicit misophonic reactions (Enzler, Loriot, et al., 2021; Hansen et al., 2021).
A further form of decreased sound tolerance is hyperacusis, which is sometimes defined as reduced tolerance of sounds that are generally perceived as normal (e.g., Adams et al., 2021), although more precise definitions of hyperacusis focus on stimulus properties such as intensity or frequency (Jastreboff & Jastreboff, 2015), for example, by describing hyperacusis as being characterized by diminished sound tolerance at intensity levels that are tolerated well by most people, resulting in experiences of increased loudness (Williams, He, et al., 2021). Such experiences are evident in both autism (Khalfa et al., 2004) and ADHD (Lucker et al., 1996). Furthermore, a subset of individuals appear to experience pain hyperacusis, or physical pain in the ears caused by loud sounds (Scheerer, Boucher, et al., 2024; Williams, He, et al., 2021). Autistic and ADHD people also report experiences of sensory overload (Scheydt et al., 2017), a construct which might often be difficult to disentangle from the reduced tolerance of loud sounds characteristic of hyperacusis. In sensory overload, either excessive stimulus intensity or an excessive number or diversity of stimuli can cause people to become overwhelmed and to struggle to process information (Scheydt et al., 2017). This can lead to internally distressing experiences of “shutdown” or provoke externalizing “meltdown” reactions (Belek, 2018).
Yet another form of decreased sound tolerance is phonophobia, a specific phobia toward some sounds, which is associated with anticipatory anxiety and avoidance (Williams, He, et al., 2021). Although some authors conceptualize phonophobia as a form of misophonia (Jastreboff & Jastreboff, 2015), the anticipatory fear and anxiety characterizing phonophobia appear distinct from anger and disgust reactions in misophonia (Williams, He, et al., 2021). However, sensory discomfort and distress, including misophonia (Jager et al., 2020) appear to contribute toward anxiety (Carpenter et al., 2019; Green et al., 2012). Thus, in practice, phonophobia may sometimes be difficult to disentangle from other forms of decreased sound tolerance (Jacquemin et al., 2024).
Attention and Sensory Experiences
Many theories have been advanced in an effort to explain, cognitively or neurobiologically, the origin of atypical sensory behaviors and experiences in neurodevelopmental disabilities (Ward, 2018). Some views suggest that attention plays a crucial, and perhaps neglected, role (Green & Wood, 2019; Liss et al., 2006; Murray et al., 2005; Thielen & Gillebert, 2019).
Interestingly, although ADHD is canonically associated with distractibility and inattention, ADHD people can also exhibit attentional hyper-focus, particularly in highly engaging activities, such as “screen time” (Grotewiel et al., 2023; Hupfeld et al., 2019; Ozel-Kizil et al., 2016; Sedgwick et al., 2019). Meanwhile, autism is associated with slowness to disengage attention (Sacrey et al., 2014) and with focused, intense interests (Uljarević et al., 2022), and it is often considered to be closely linked to hyper-focusing of attention (Rapaport et al., 2024; Russell, Kapp, et al., 2019). Indeed, the autistic-developed monotropism theory (Garau et al., 2023; Murray et al., 2005), postulating that autism is fundamentally characterized by a narrow focusing of attention on a small range of targets of intense interest to a given autistic individual, attracts broad support in communities of autistic adults (Warren, 2021). However, autistic people can also display enhanced processing of background stimuli (Remington et al., 2019; Remington & Fairnie, 2017) and a susceptibility toward exogenous, stimulus-driven capture of attention (Allenmark et al., 2021; Keehn et al., 2019; Poole et al., 2018; Venker et al., 2021). Thus, contrary to stereotypes, both autism and ADHD can be associated in different contexts with hyper-focus and with susceptibility toward distraction/inattention.
These atypical attentional styles could be related to atypical sensory experiences (Goldknopf, 2013). The developers of the monotropism account insightfully noted this possibility, suggesting that autistic experiences of hypo-sensitivity to stimuli might reflect stimuli falling outside the focus of attention, while sensory discomfort might sometimes reflect hyper-attention to stimuli or stimuli exogenously disrupting a focused attention tunnel (Murray et al., 2005; see also Goldknopf, 2013; Liss et al., 2006). Similarly, diminished interoception might sometimes reflect reduced attention toward bodily signals, whereas anxiety or other factors might result in heightened attention to bodily sensations and lead toward somatization (Trevisan et al., 2021). We speculate that both hyper-focus and susceptibility toward distraction/inattention could be related to sensory hyper-reactivity: that hyper-reactivity may partly reflect susceptibility toward noticing and exogenously directing attention toward distracting or distressing stimuli, after which hyper-focusing of attention and difficulty disengaging could exacerbate the experience. This is consistent with some evidence from sound tolerance literature: heightened attention to detail has been reported in people with misophonia (Andermane et al., 2023; Simner et al., 2021) and trigger sounds appear to capture attention and interfere with task performance (da Silva & Sanchez, 2019).
Furthermore, it seems possible that sensory experiences then shape attention. Sensory hyper-reactivity appears to precede and predict later anxiety (Carpenter et al., 2019; Green et al., 2012). Indeed, it seems quite reasonable for someone who routinely experiences distressing sensory experiences to become anxious that the experiences will recur (see also Verhulst et al., 2022). However, anxiety is in turn intertwined with attentional threat biases and hyper-vigilance: anxiety appears to lead individuals to spread their attention more widely across their environment in case a sign of threat might appear, and if a threatening stimulus is detected, to focus on it (Eysenck et al., 2007). Unfortunately, if the threat is an uncomfortable sensory stimulus, noticing and focusing attention on it could then increase one’s discomfort (Green & Ben-Sasson, 2010). Moreover, literature also provides some reason to believe that vigilantly scanning for threats may, in general, tend to worsen anxiety (Burris et al., 2019). If experiencing anxiety and hyper-vigilance around sensory distress indeed makes one more likely to have distressing sensory experiences, then sensory distress might be particularly likely to cause a vicious circle of spiraling anxiety (see also Green & Ben-Sasson, 2010).
Present Study
The present study aims to characterize the auditory sensory experiences of autistic-only; ADHD-only; autistic + ADHD; and non-autistic, non-ADHD people, with particular focus on auditory distractibility, misophonia, and loudness discomfort. Furthermore, it aims to evaluate convergence between questionnaire and psychoacoustic measures of misophonia. Finally, it aims to explore relationships between auditory sensory experiences and measures of hyper-focus and inattention, as well as anxiety and hyper-vigilance. We hypothesize that:
Loudness discomfort and misophonia will be elevated in the autistic-only and autistic + ADHD groups relative to ADHD-only individuals, and in the ADHD-only group relative to comparison participants.
Auditory distractibility will be elevated in the autistic + ADHD and ADHD-only groups relative to autism-only, and in the autistic-only group relative to comparison participants.
Questionnaire misophonia scores will converge robustly with the psychoacoustic misophonia measure.
Auditory hyper-reactivity will be separately associated with inattention, hyper-focus, and hyper-vigilance.
Auditory hyper-reactivity will also be associated with anxiety, and anxiety will in turn be associated with hyper-vigilance.
Methods
Participants
The study sample and recruitment procedures have been described in more detail by Dwyer et al. (2024). We recruited four groups of participants from the United States: autistic people who were not ADHD (autistic-only), ADHD participants who were not autistic (ADHD-only), participants who were both autistic and ADHD (autistic + ADHD), and comparison participants who were neither autistic nor ADHD (comparison).
Both neurodivergent and comparison participants were recruited from CloudResearch (Litman et al., 2017) and Prolific (Palan & Schitter, 2018). Furthermore, many autistic participants were recruited from SPARK Research Match (Feliciano et al., 2018). Prolific participants were able to see the study if they were potentially eligible based on their demographics. Two thousand two hundred ninety-six SPARK participants were informed about the study, of whom 416 agreed to share their information with the research team.
One thousand thirty-eight unique, complete screening responses were received (63 CloudResearch, 649 Prolific, and 325 SPARK). Self-identifications as autistic or ADHD were accepted, but participants whose ASRS-6 ADHD trait scores were not consistent with these identifications as described below were not invited to return to the full study (n = 96). Participants with uncorrected hearing loss (n = 44) or who missed attention checks (n = 26) were also not invited to return, as were comparison participants with first- or second-degree autistic or ADHD relatives (n = 53).
Upon being re-invited, a total of 609 unique participants provided responses to the full survey; however, some participants were removed due to poor or discrepant data (n = 82) or RAADS-14 autistic trait scores inconsistent with their group assignment (n = 35). This left a final sample of 492 participants (Table 1): 99 comparison (10 CloudResearch and 89 Prolific), 122 ADHD-only (7 CloudResearch and 115 Prolific), 130 autistic-only (38 Prolific and 92 SPARK), and 141 autistic + ADHD (1 CloudResearch, 37 Prolific, and 103 SPARK). All participants received $15 USD for completing the final survey. CloudResearch and Prolific participants additionally received $0.55 for the screening survey.
Demographic Characteristics of Participants.
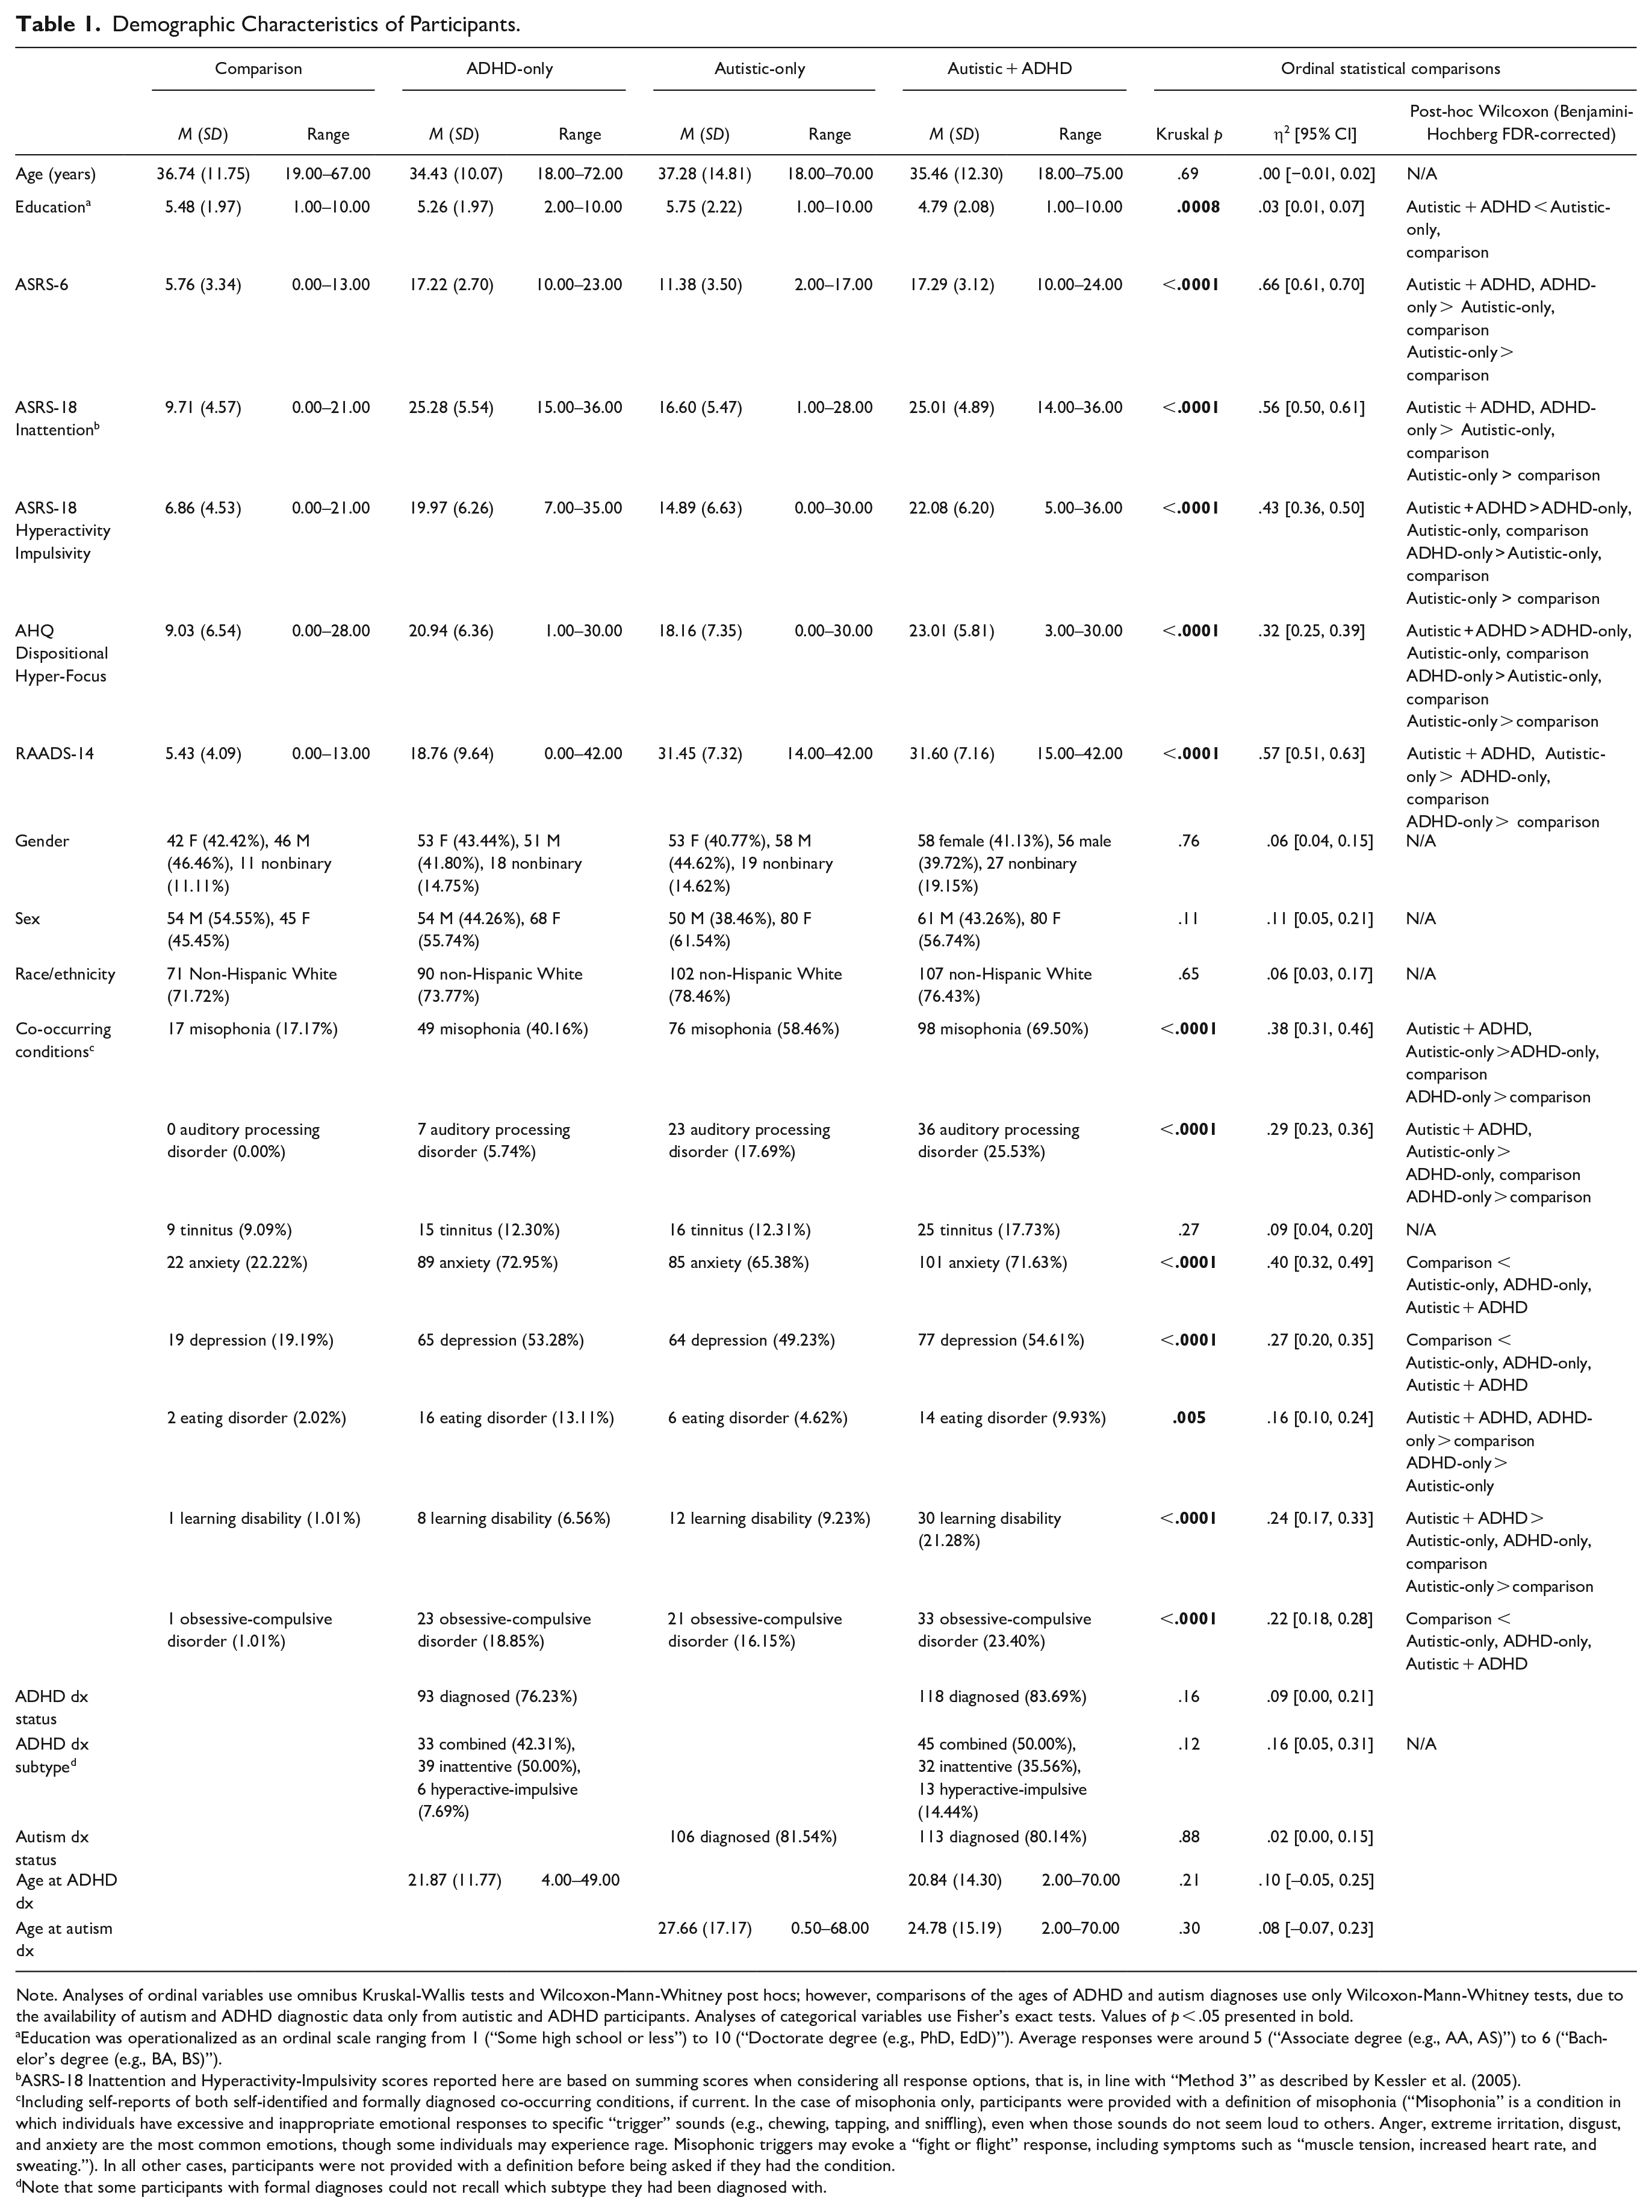
Note. Analyses of ordinal variables use omnibus Kruskal-Wallis tests and Wilcoxon-Mann-Whitney post hocs; however, comparisons of the ages of ADHD and autism diagnoses use only Wilcoxon-Mann-Whitney tests, due to the availability of autism and ADHD diagnostic data only from autistic and ADHD participants. Analyses of categorical variables use Fisher’s exact tests. Values of p < .05 presented in bold.
Education was operationalized as an ordinal scale ranging from 1 (“Some high school or less”) to 10 (“Doctorate degree (e.g., PhD, EdD)”). Average responses were around 5 (“Associate degree (e.g., AA, AS)”) to 6 (“Bachelor’s degree (e.g., BA, BS)”).
ASRS-18 Inattention and Hyperactivity-Impulsivity scores reported here are based on summing scores when considering all response options, that is, in line with “Method 3” as described by Kessler et al. (2005).
Including self-reports of both self-identified and formally diagnosed co-occurring conditions, if current. In the case of misophonia only, participants were provided with a definition of misophonia (“Misophonia” is a condition in which individuals have excessive and inappropriate emotional responses to specific “trigger” sounds (e.g., chewing, tapping, and sniffling), even when those sounds do not seem loud to others. Anger, extreme irritation, disgust, and anxiety are the most common emotions, though some individuals may experience rage. Misophonic triggers may evoke a “fight or flight” response, including symptoms such as “muscle tension, increased heart rate, and sweating.”). In all other cases, participants were not provided with a definition before being asked if they had the condition.
Note that some participants with formal diagnoses could not recall which subtype they had been diagnosed with.
Survey Measures
Adult ADHD Self-Report Scale (ASRS)
The six-item World Health Organization Adult ADHD Self-Report Scale (ASRS-6; Kessler et al., 2005, 2007) was collected in the screening survey. The ASRS-6 offers multiple cut-off scores (10, 14, and 18) with varying sensitivity and specificity (Kessler et al., 2007). We varied cut-offs for different groups due to phenotypic overlap between autism and ADHD (Krakowski et al., 2021; Vaidya & Klein, 2022), as well as based on whether participants had formal diagnoses or were self-identified. The following participants were considered eligible:
diagnosed or self-identified autistic participants who indicated that they were non-ADHD, and whose ASRS-6 scores fell under the least sensitive ADHD cut-off (18);
participants who indicated that they were non-ADHD and non-autistic, and whose ASRS-6 scores fell under the middle cut-off (14);
participants who self-identified as ADHD, but had no formal diagnosis, and whose ASRS-6 scores met or exceeded the middle cut-off (14);
participants who had formal ADHD diagnoses and whose ASRS-6 scores met or exceeded the most sensitive cut-off (10); and
non-autistic participants who reported formerly (but not currently) being ADHD, but whose ASRS-6 scores met or exceeded the middle cut-off (14).
In the full survey, we collected the longer 18-item version of the ASRS, the ASRS-18 (Kessler et al., 2005). As this included the six ASRS-6 items, we re-calculated ASRS-6 scores and excluded participants who no longer met criteria for inclusion based on their second ASRS-6 score.
Ritvo Autism and Asperger Diagnostic Scale (RAADS-14)
The 14-item Ritvo Autism and Asperger Diagnostic Scale (RAADS-14; Eriksson et al., 2013) was collected in the full survey. Autistic participants were excluded if they did not have RAADS-14 scores at or exceeding cut-off (14). Comparison participants were excluded if they scored at or above cut-off. As ADHD-only participants often exceeded the autism cut-off in the validation sample (Eriksson et al., 2013), we did not exclude ADHD-only participants based on RAADS-14 scores.
Adult Hyperfocus Questionnaire (AHQ)
We presented a shortened version of the Adult Hyperfocus Questionnaire (AHQ) developed by Hupfeld et al. (2019). Participants answered items about the frequency of having experiences of hyper-focus in general (dispositional hyper-focus). The measure was based upon an understanding of hyper-focus that included six primary dimensions or indicators; the original measure includes doublet pairs of similar items—two for each indicator (Hupfeld et al., 2019). To reduce data collection demands, we, in consultation with Kathleen Hupfeld, removed one item from each doublet. This left six dispositional hyper-focus items.
The AHQ, as administered in the present study, also included items asking about experiences of school, hobby, and screen time hyper-focus, as well as the valence of hyper-focus experiences; these data are described by Dwyer et al. (2024).
Multidimensional Inventory of Sound Tolerance-Adult (MIST-A)
The Multidimensional Inventory of Sound Tolerance-Adult (MISTA-A) is a measure of decreased sound tolerance developed to quantify multiple dimensions of sound intolerance and screen for clinically significant decreased sound tolerance in the adult population; this measure is specifically designed to be applicable for use in autistic adults, as well as other neurodivergent and non-neurodivergent adults experiencing decreased sound tolerance (Williams, Cascio, & Woynaroski, 2021). 26 items (28 in the development version used in the present study) invite participants to report the frequency of experiences of decreased sound tolerance within the previous month; 24 of these items are grouped into four dimensions: Misophonia, Hyperacusis (i.e., loudness hyperacusis and auditory overwhelm, including some anticipatory anxiety), Fear/Panic (reactions to sounds, not anticipatory phobia of them), and Pain (i.e., pain hyperacusis; Williams, 2024). Using a free online calculator (https://asdmeasures.shinyapps.io/MISTA_score/), the MIST-A or any subset of its items can be scored using item response theory to produce normed T-scores (based on 1,348 US general population adults) for each of these four dimensions. These scores converge well with other measures of sound tolerance constructs, including semi-structured diagnostic interviews to assess for the major sound tolerance disorders (Williams, 2024). T-scores >60 are considered indicative of clinically elevated sound intolerance, and scores >70 suggest severe difficulties. Note that the first nine MIST-A items are used for screening; when respondents endorse never having experiences of sound intolerance on all screening items, the remaining MIST-A items do not need to be presented, and T-scores are calculated based only on the administered items.
In addition, two sets of supplemental items from the MIST-A development version (not published with the official scale but administered as part of the present study) ask participants to report the frequency of sound-evoked physical symptoms (15 items; two subscales of hyperacusis-related symptoms and non-specific symptoms), and provide ratings of sound-tolerance related functional impairment/quality of life (8 items). Raw scores on these subscales are presented in Supplemental Appendix A, and associations involving them are included in Supplemental Appendix E.
Vanderbilt Auditory Distractibility Questionnaire (VADQ)
The Vanderbilt Auditory Distractibility Questionnaire (VADQ) is a brief, 7-item, unidimensional measure of auditory distractibility originally developed for use with autistic adults (Williams, 2021).
Overall Anxiety Severity and Impairment Scale (OASIS)
The OASIS (Norman et al., 2006) is a 5-item measure asking about the frequency and impact of anxiety experiences. The measure’s response options are accompanied by clear descriptions, potentially making it particularly suitable in neurodivergent populations.
Brief Hypervigilance Scale (BHS)
The BHS (Bernstein et al., 2015) is a 5-item measure inviting participants to rate items about hyper-vigilance on a 5-point scale from “Not At All Like Me (never true)” to “Very Much Like Me (always true).”
Sound Rating Measures
Core Discriminant Sounds (CDS)
A version of the Core Discriminant Sounds (CDS) misophonia measure developed by Enzler et al. (2021) was implemented in Qualtrics. Participants first listened to a white noise stimulus and were asked to adjust the volume “until it is playing at a clear, comfortable volume: neither too low nor too high.” Participants then listened to practice sounds (“marimba” and “squeaking door”) and were given opportunities to adjust the volume. Once volume was adjusted, participants were asked not to change their system sound level. Several types of sound were presented, including 10 common misophonia triggers, consisting of mouth sounds (“chewing 1,” “chewing 2,” and “slurping”), breathing/nasal sounds (“breath running,” “sniffling,” and “snoring”), throat sounds (swallowing” and “throat clearing”), and repetitive sounds ( “keyboard,” and “pen clicking”). We also presented four canonically unpleasant sounds (“clapping,” “fingernails on chalkboard,” “fork scratch plate,” and “scream”), and seven canonically pleasant sounds (“birds,” “fountain,” “harp,” “laugh,” “ocean,” “piano,” and “underwater”), using stimuli from prior research (Enzler, Fournier, et al., 2021; Enzler, Loriot, et al., 2021). Sounds were presented twice in a randomized order, with a short break between blocks, at an equal root mean square intensity. Participants pressed a button to play each sound, after which a horizontal 101-point visual analogue scale (VAS) from “pleasant” to “unpleasant” was presented with the instruction that, “If the sound is very pleasant, you should click on the far left of the scale. If the sound is very unpleasant, you must click on the far right of the scale. If the sound is neutral, you should click in the middle of the scale.” Scores ranged from 0 (very pleasant) to 100 (very unpleasant). Participants could replay the sound before giving an answer.
We examined median ratings for canonically pleasant, unpleasant, and misophonia trigger sounds as an outcome in the present study. Following Enzler, Loriot, et al. (2021), we also calculated Core Discriminant Sound Misophonia (CDS-M) scores for misophonic trigger sounds, which reflect positive differences between a participant’s median rating for a sound and the 75% quantile rating from control participants (defined here as non-autistic, non-ADHD participants reporting no current or historical misophonia), divided by the maximum possible value (the largest possible difference between a participant’s rating and the 75% quantile), multiplied by 100. Sound-specific CDS scores were then averaged to produce the CDS-M total score, as well as CDS scores for mouth, breathing/nose, throat, and repetitive sounds. Sounds with 75% quantile ratings >90 (extremely negative) in control participants were excluded from computation of CDS scores, to avoid magnifying minute differences (Supplemental Appendix B; Supplemental Table B.1). As a result, reactions to chewing sounds are not included in the CDS.
Data Analysis
All statistical analyses were conducted in R Studio, version 4.2.2.
Group Comparisons
Groups were compared on continuous variables using two-way ordinal probit regression (Harrell, 2022; Ripley et al., 2022), with autism and ADHD as separate independent variables. Significant interactions were probed using Wilcoxon-Mann-Whitney tests to compare all groups, with a Benjamini-Yekutieli false discovery rate correction for multiple comparisons (Benjamini & Yekutieli, 2001). Cliff’s δ (Cliff, 1993; Torchiano, 2022) is reported as an effect size. Delta values of approximately ±.11, ±.28, and ±.43 are equivalent to Cohen’s benchmarks of “small,” “medium,” and “large” effect sizes (i.e., d of 0.2, 0.5, and 0.8, based on parametric equivalency between d and δ under normality; McGraw & Wong, 1992).
Comparisons of groups on misophonia CDS scores also used ordinal probit regression, but with the additional independent variable of self-reported misophonia status (currently vs. never having misophonia), as well as autism and ADHD status. Participants who reported historical but not current misophonia were excluded from this analysis.
Because of the extent of diagnostic overshadowing in the autism and ADHD communities, we conducted sensitivity analyses to check whether group differences would be maintained when different RAADS and ASRS criteria were used to define groups. These sensitivity analyses are presented in Supplemental Appendices C and D.
Associations of Misophonia Measures
Associations among misophonia measures were examined using Spearman’s ordinal correlation coefficient separately in each group; a Benjamini-Yekutieli false discovery rate correction for four multiple comparisons (four groups) was applied.
Path Analysis
Before exploring relationships among auditory hyper-reactivity, inattention and hyper-focus, anxiety, and hyper-vigilance, we first reduced the number of auditory hyper-reactivity dimensions by conducting a principal components analysis (PCA) on scaled, Z-scored MIST-A items from the four sound tolerance experience frequency subscales, VADQ items, and mean ratings (across the two repetitions of the sound) of each CDS misophonic trigger sound.
We then used path analysis (Rosseel, 2012) to explore direct and indirect relationships between AHQ Dispositional Hyper-Focus and ASRS Inattention scores and auditory hyper-reactivity dimensions from the PCA, between hyper-reactivity and OASIS Anxiety scores, and between Anxiety and BHF Hyper-Vigilance scores. We also tested whether hyper-vigilance then predicted auditory hyper-reactivity, as well as whether autism and ADHD status moderated relationships between hyper-focus/inattention and auditory hyper-reactivity. All continuous variables were converted to scaled ranks before this path analysis.
To confirm the outcome of the path analyses remained similar under altered inclusion criteria, we conducted sensitivity analyses (Supplemental Tables C.4 and D.4). Furthermore, Spearman’s correlation matrices among variables from this study, as well as further variables presented by Dwyer et al. (2024), are reported in Supplemental Appendix E, Supplemental Tables E.1 to E.8.
Results
Group Comparisons
Decreased Sound Tolerance and Auditory Distractibility
As described in Table 2, we observed main effects of autism and of ADHD on T-scores from each of the four MIST-A experience subscales (Misophonia, Figure 1(A); Hyperacusis, Figure 1(B); Fear/Panic, Figure 1(C); and Pain, Figure 1(D)), driven by elevated scores in autistic and ADHD people relative to non-autistic and non-ADHD people (large effects). However, we also observed interactions, complicating interpretation of the main effects. Post-hoc tests in Table 2 found higher scores in autistic + ADHD than ADHD-only on all subscales (small to medium effects), while autistic + ADHD people reported higher scores than autistic-only on Hyperacusis, Fear/Panic, and Pain (small to medium effects). Furthermore, autistic-only participants reported more Hyperacusis and auditory Pain than ADHD-only participants (small effects), but there was little to suggest autistic-only people differed from ADHD-only people in experiences of Misophonia or auditory Fear/Panic. All neurodivergent groups had higher scores than comparison participants on all MIST-A experience subscales.
Results of Ordinal Probit Regression Analyses, As Well As Benjamini-Yekutieli FDR-Corrected Wilcoxon-Mann-Whitney Post-hoc Tests, Comparing Groups on MIST-A T-scores, VADQ Total scores, and Median Ratings From the CDS Task.
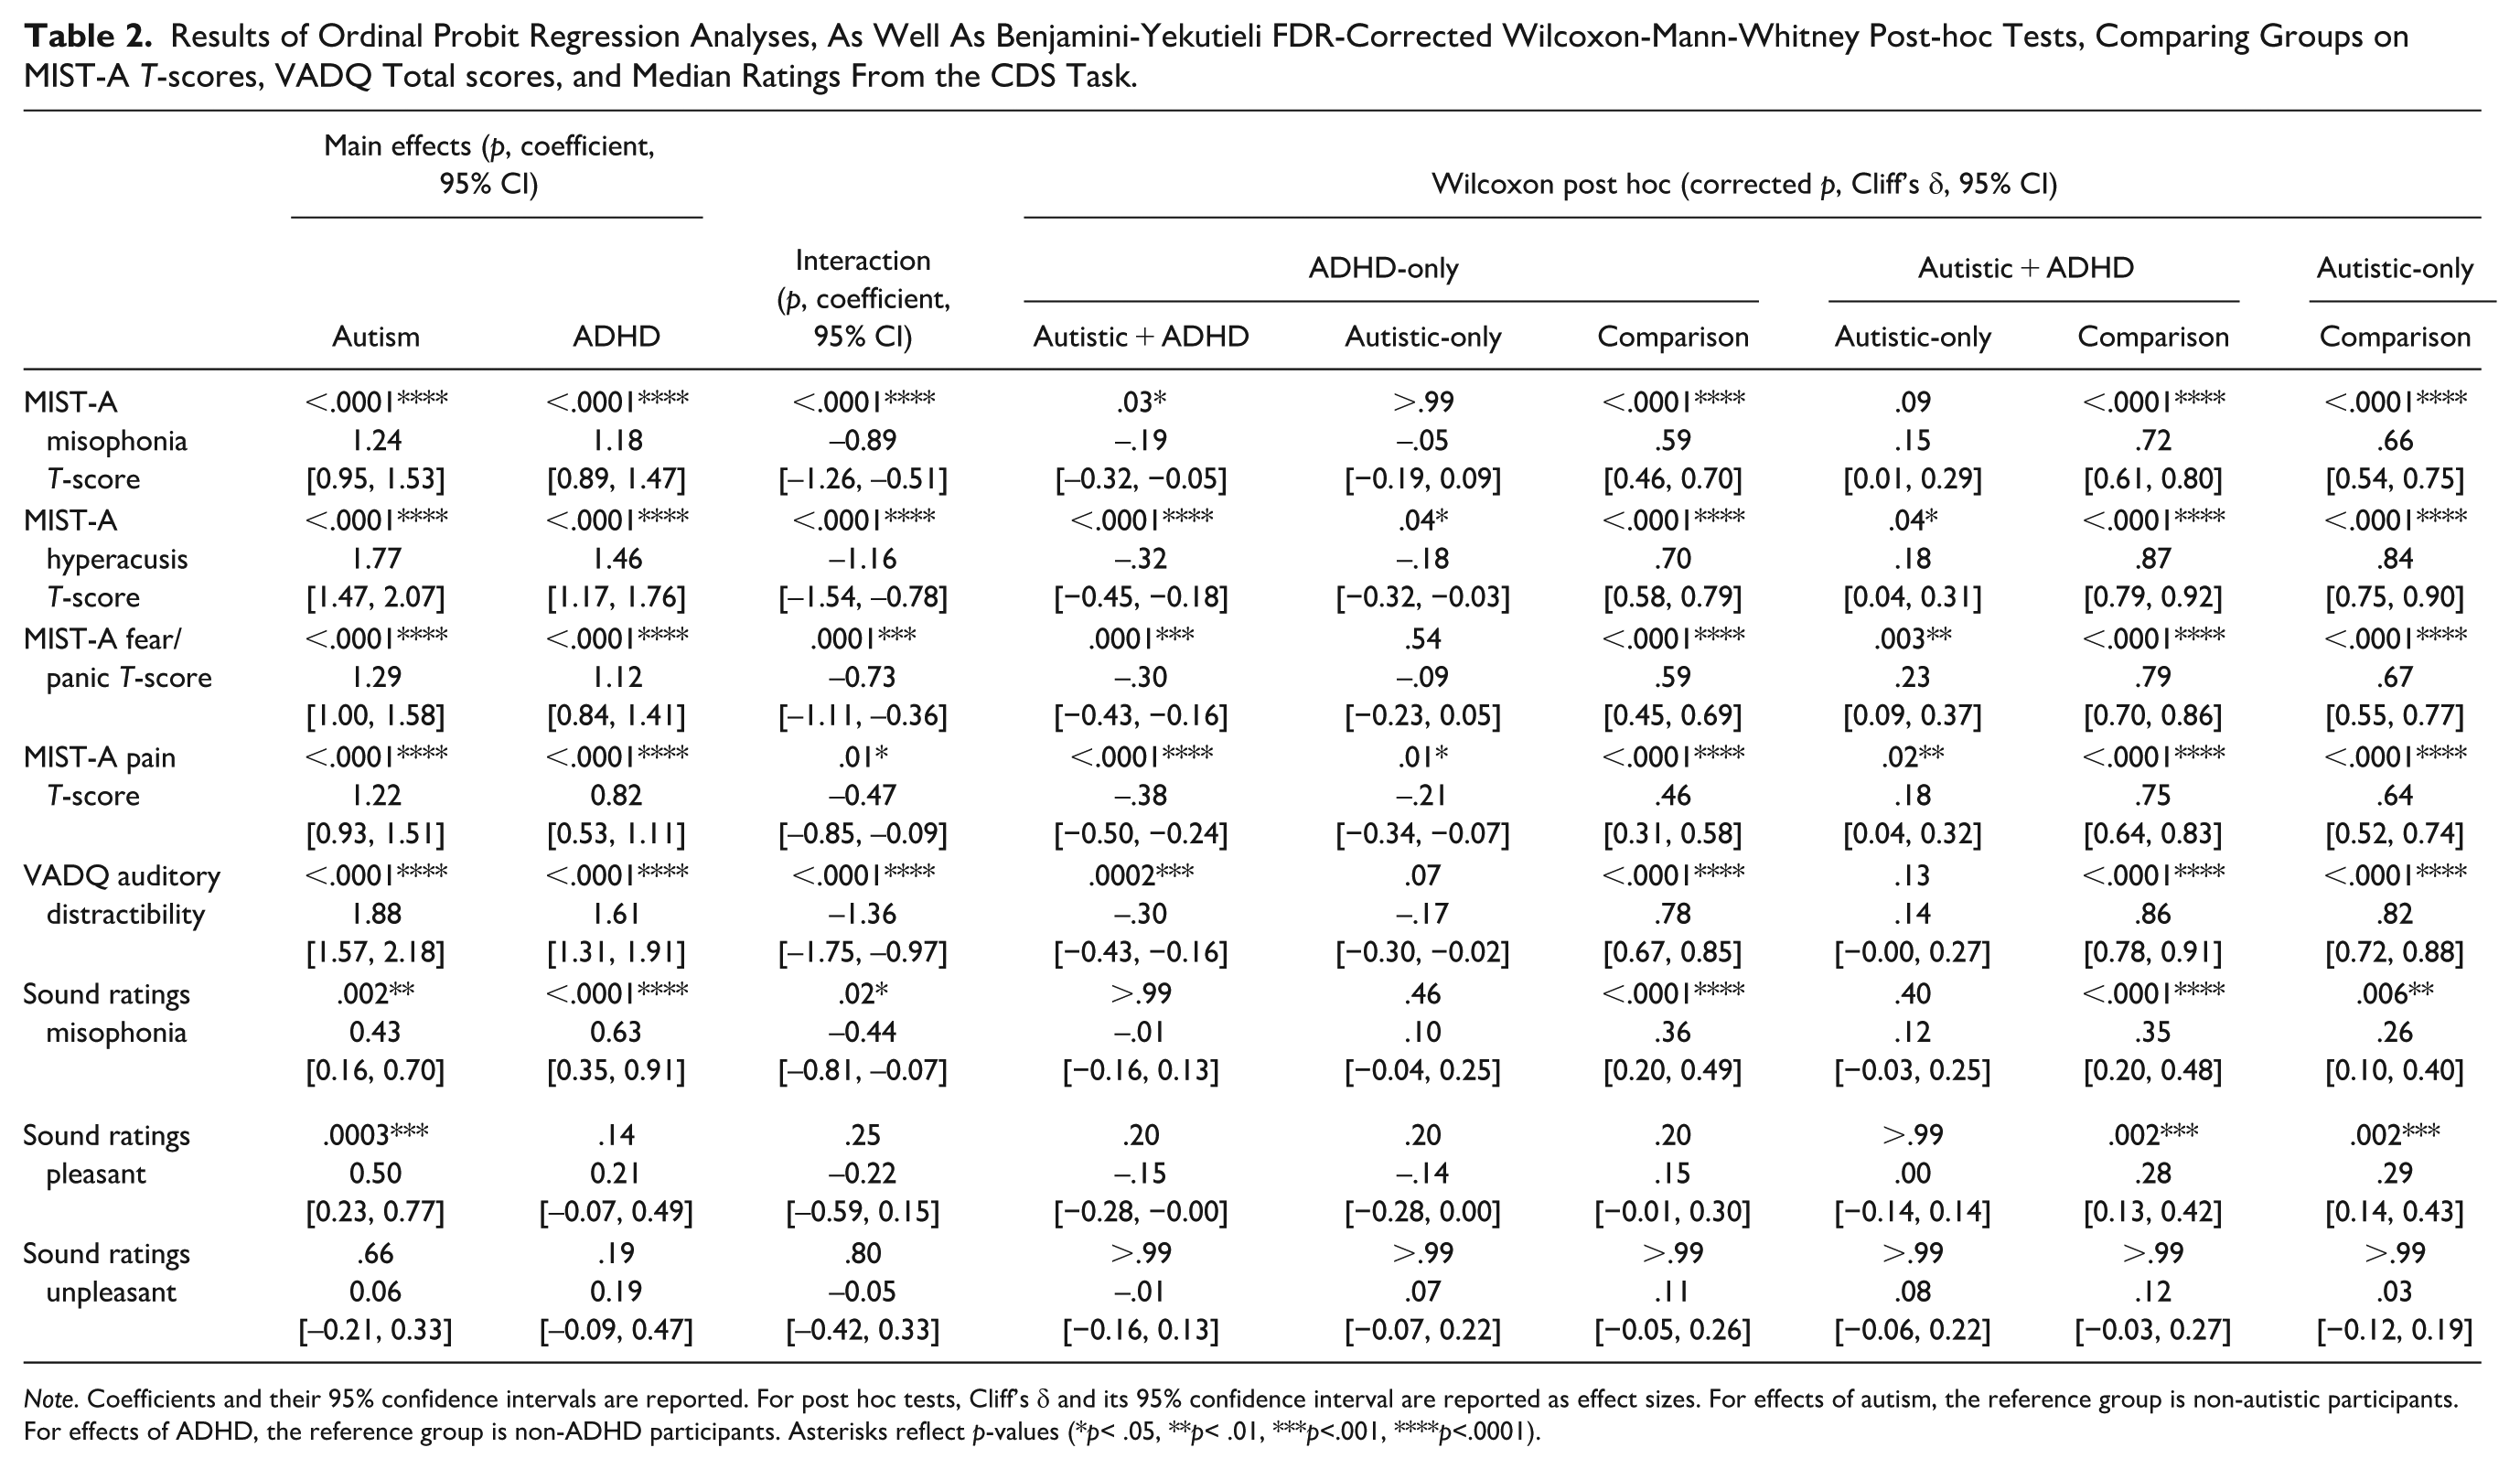
Note. Coefficients and their 95% confidence intervals are reported. For post hoc tests, Cliff’s δ and its 95% confidence interval are reported as effect sizes. For effects of autism, the reference group is non-autistic participants. For effects of ADHD, the reference group is non-ADHD participants. Asterisks reflect p-values (*p< .05, **p< .01, ***p<.001, ****p<.0001).
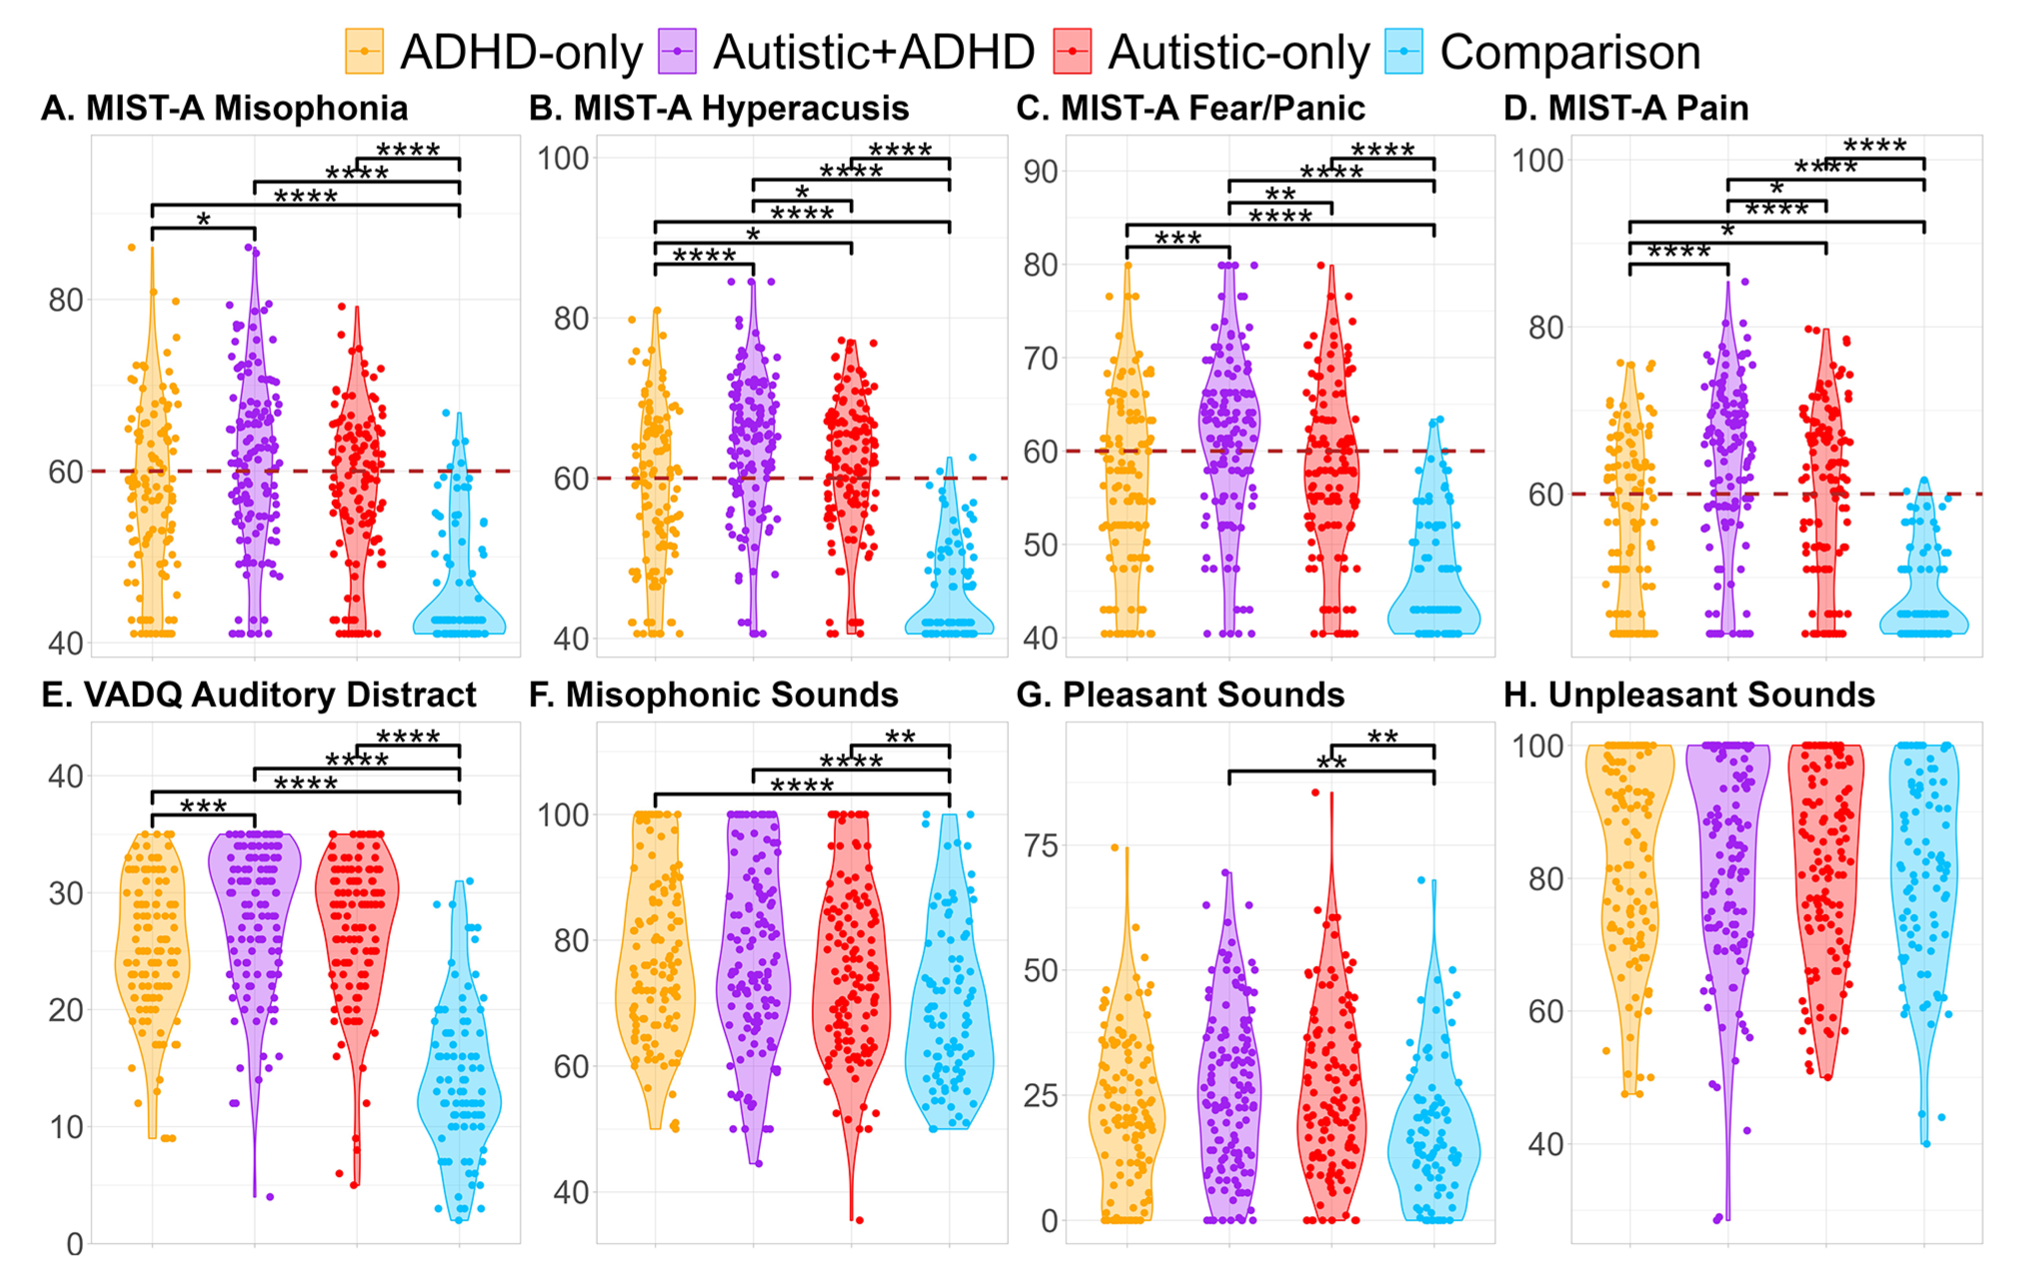
Violin plots, with overlaid horizontally jittered data points, depicting scores on the MIST-A and VADQ, and CDS ratings, as a function of group. Panels A-D depict MIST-A experience subscale T-scores; the dotted line at 60 represents the cut-off for scores indicative of clinical difficulties. Panel E depicts VADQ scores. Finally, Panels F-H depict median ratings of misophonic trigger, pleasant, and unpleasant sounds from the sound ratings task. Pairwise comparisons use Benjamini-Yekutieli-corrected Wilcoxon-Mann-Whitney tests, as in Table 2. Asterisks reflect p-values (*p< .05, **p< .01, ***p<.001, ****p<.0001)
There were main effects of autism and ADHD on Auditory Distractibility (Figure 1(E)), with greater Auditory Distractibility in autistic and ADHD people relative to non-autistic and non-ADHD people, but an interaction of autism and ADHD was also apparent. Post-hoc tests in Table 2 found elevated scores in autistic + ADHD people (medium effect), and at a trend level in autistic-only people, relative to ADHD-only participants. All neurodivergent groups reported more auditory distractibility issues than participants in the comparison group (large effects).
There were also main effects of autism and ADHD on ratings of misophonic trigger sounds in the sound ratings task, with autistic and ADHD participants giving higher (i.e., more unpleasant) ratings than non-autistic and non-ADHD participants (Figure 1(F)). An interaction of autism and ADHD was also observed; the neurodivergent groups did not significantly differ from one another in post-hoc tests, but there were medium differences between each and the comparison group (Table 2).
As reported in Table 2, there was a main effect of autism on ratings of canonically pleasant sounds in the sound ratings task, with autistic participants giving higher (i.e., less pleasant) ratings to canonically pleasant sounds than non-autistic participants (Figure 1(G)).
There were no main effects or interactions of autism and ADHD on ratings of canonically unpleasant sounds (Figure 1(H)).
Raw scores on MIST-A Symptom and Impairment subscales are presented in Supplemental Table A.1.
However, it should be noted that patterns of sound tolerance differences among the neurodivergent groups depended upon the RAADS and ASRS autistic and ADHD cut-offs used to include and exclude participants; more rigorous ADHD trait criteria could increase sound tolerance issues in ADHD participants relative to autistic participants (Supplemental Table C.2), while more rigorous autistic trait criteria could reverse some of these changes (Supplemental Table D.2).
Core Discriminant Sound (CDS) Scores
When psychoacoustic Core Discriminant Sound (CDS) scores were calculated from misophonic trigger sounds in the sound rating task, both chewing sounds from Enzler, Loriot, et al. (2021) were excluded due to control 75% quantiles >90. All other misophonic trigger sounds were included.
There were main effects of self-reported misophonia on CDS Misophonia (CDS-M) total, CDS mouth sound, and CDS repetitive sound scores, with self-identified participants with misophonia having higher (i.e., more misophonic) scores than participants without misophonia (Figure 2; Table 3). There were also main effects of ADHD on CDS-M total and CDS breathing/nasal sound scores, with ADHD participants having higher scores than non-ADHD participants, and a main effect of autism on CDS repetitive sound scores, with autistic participants having higher scores than non-autistic participants.
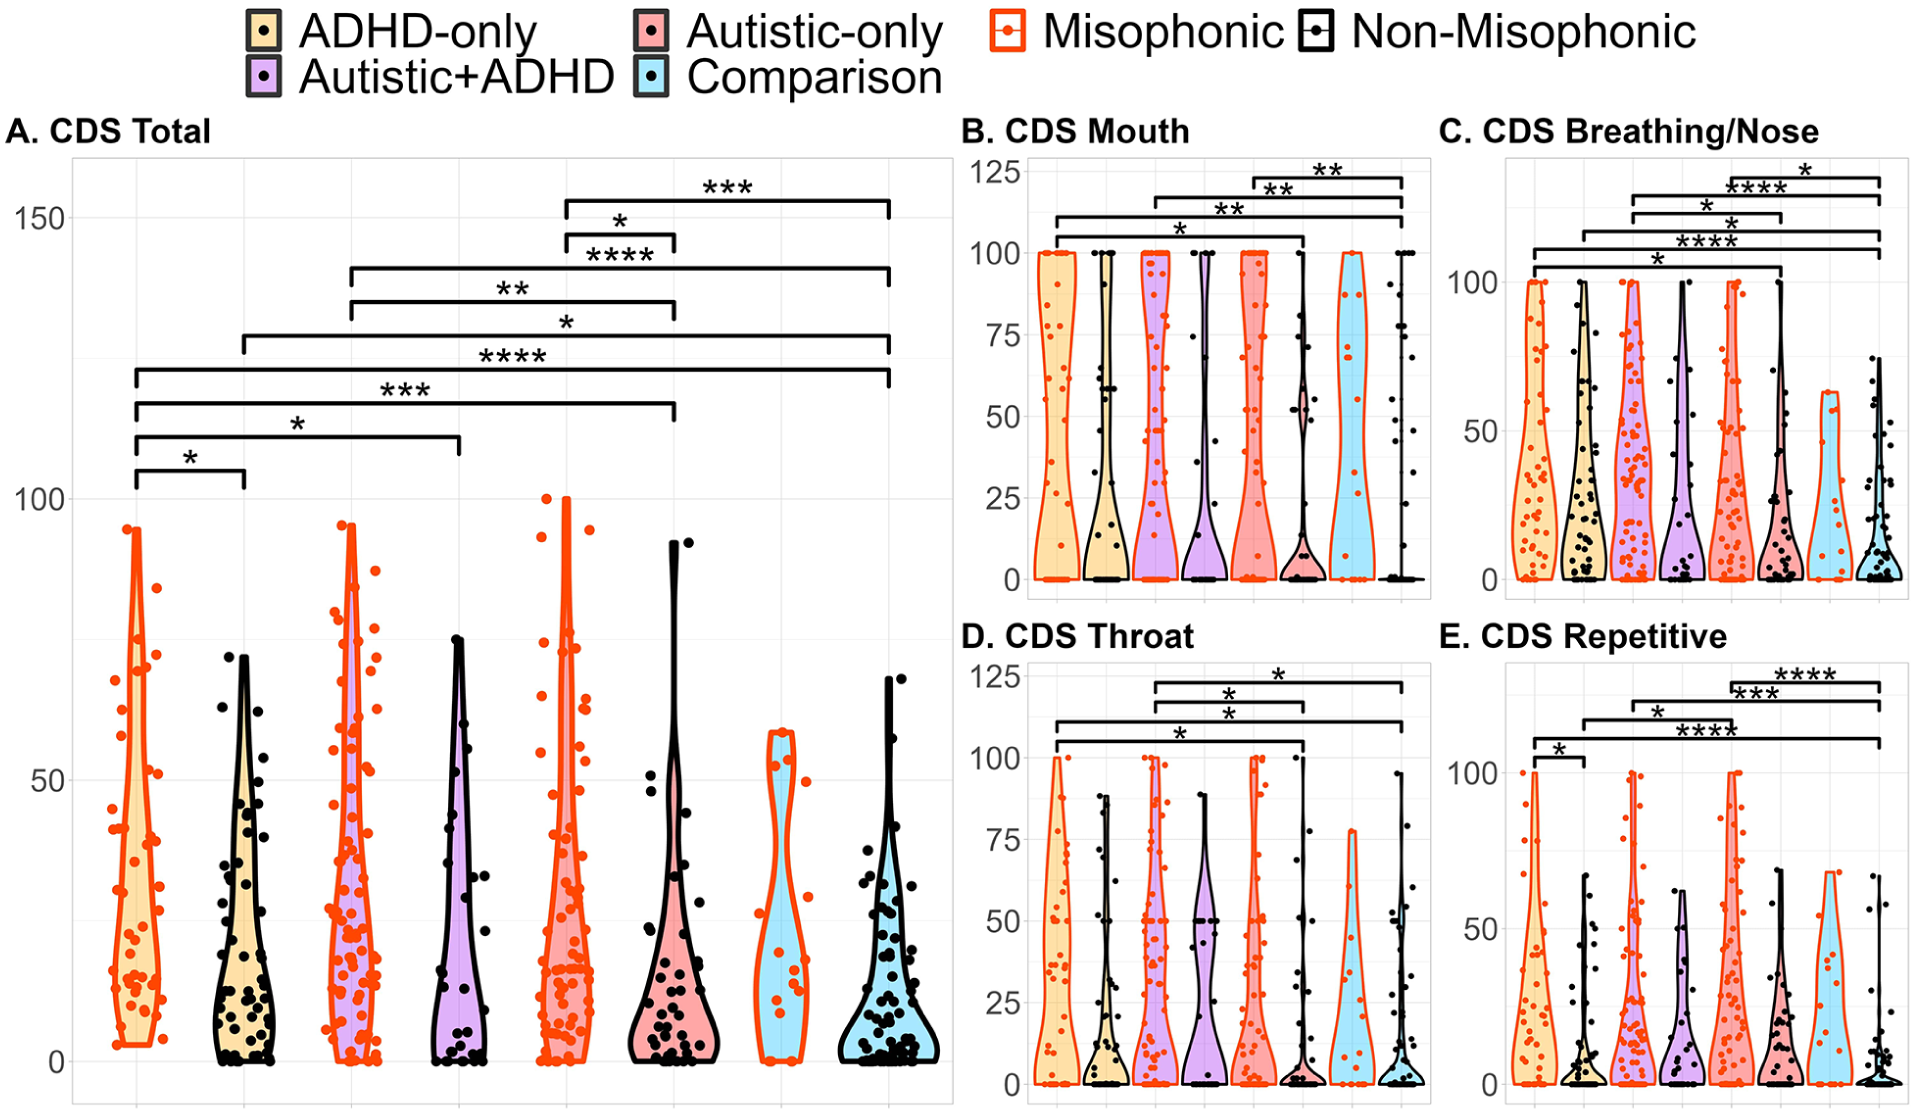
Violin plots, with horizontally jittered data points, depicting CDS scores as a function of group (ADHD-only, autistic + ADHD, autistic-only, and comparison) and self-reported misophonia status (currently vs. never having misophonia; historical misophonia was excluded). CDS scores, averaged across sounds, are based on taking the positive differences between a participant’s rating of a sound and the 75% quantile of non-autistic, non-ADHD, non-misophonic participants’ ratings, then rescaling those differences on a scale of 0 (i.e., the participant’s rating of the sound was equal to or less than the 75% quantile, i.e., as or more pleasant than the 75% quantile rating) to 100 (i.e., the participant’s rating was the maximum possible unpleasantness rating). Pairwise Wilcoxon tests use a Benjamini-Yekutieli FDR correction for 28 comparisons; asterisks reflect p-values (*p< .05, **p< .01, ***p<.001, ****p<.0001).
Results of Ordinal Probit Regression Analyses Comparing Groups on CDS Misophonia (CDS-M) Total Scores.
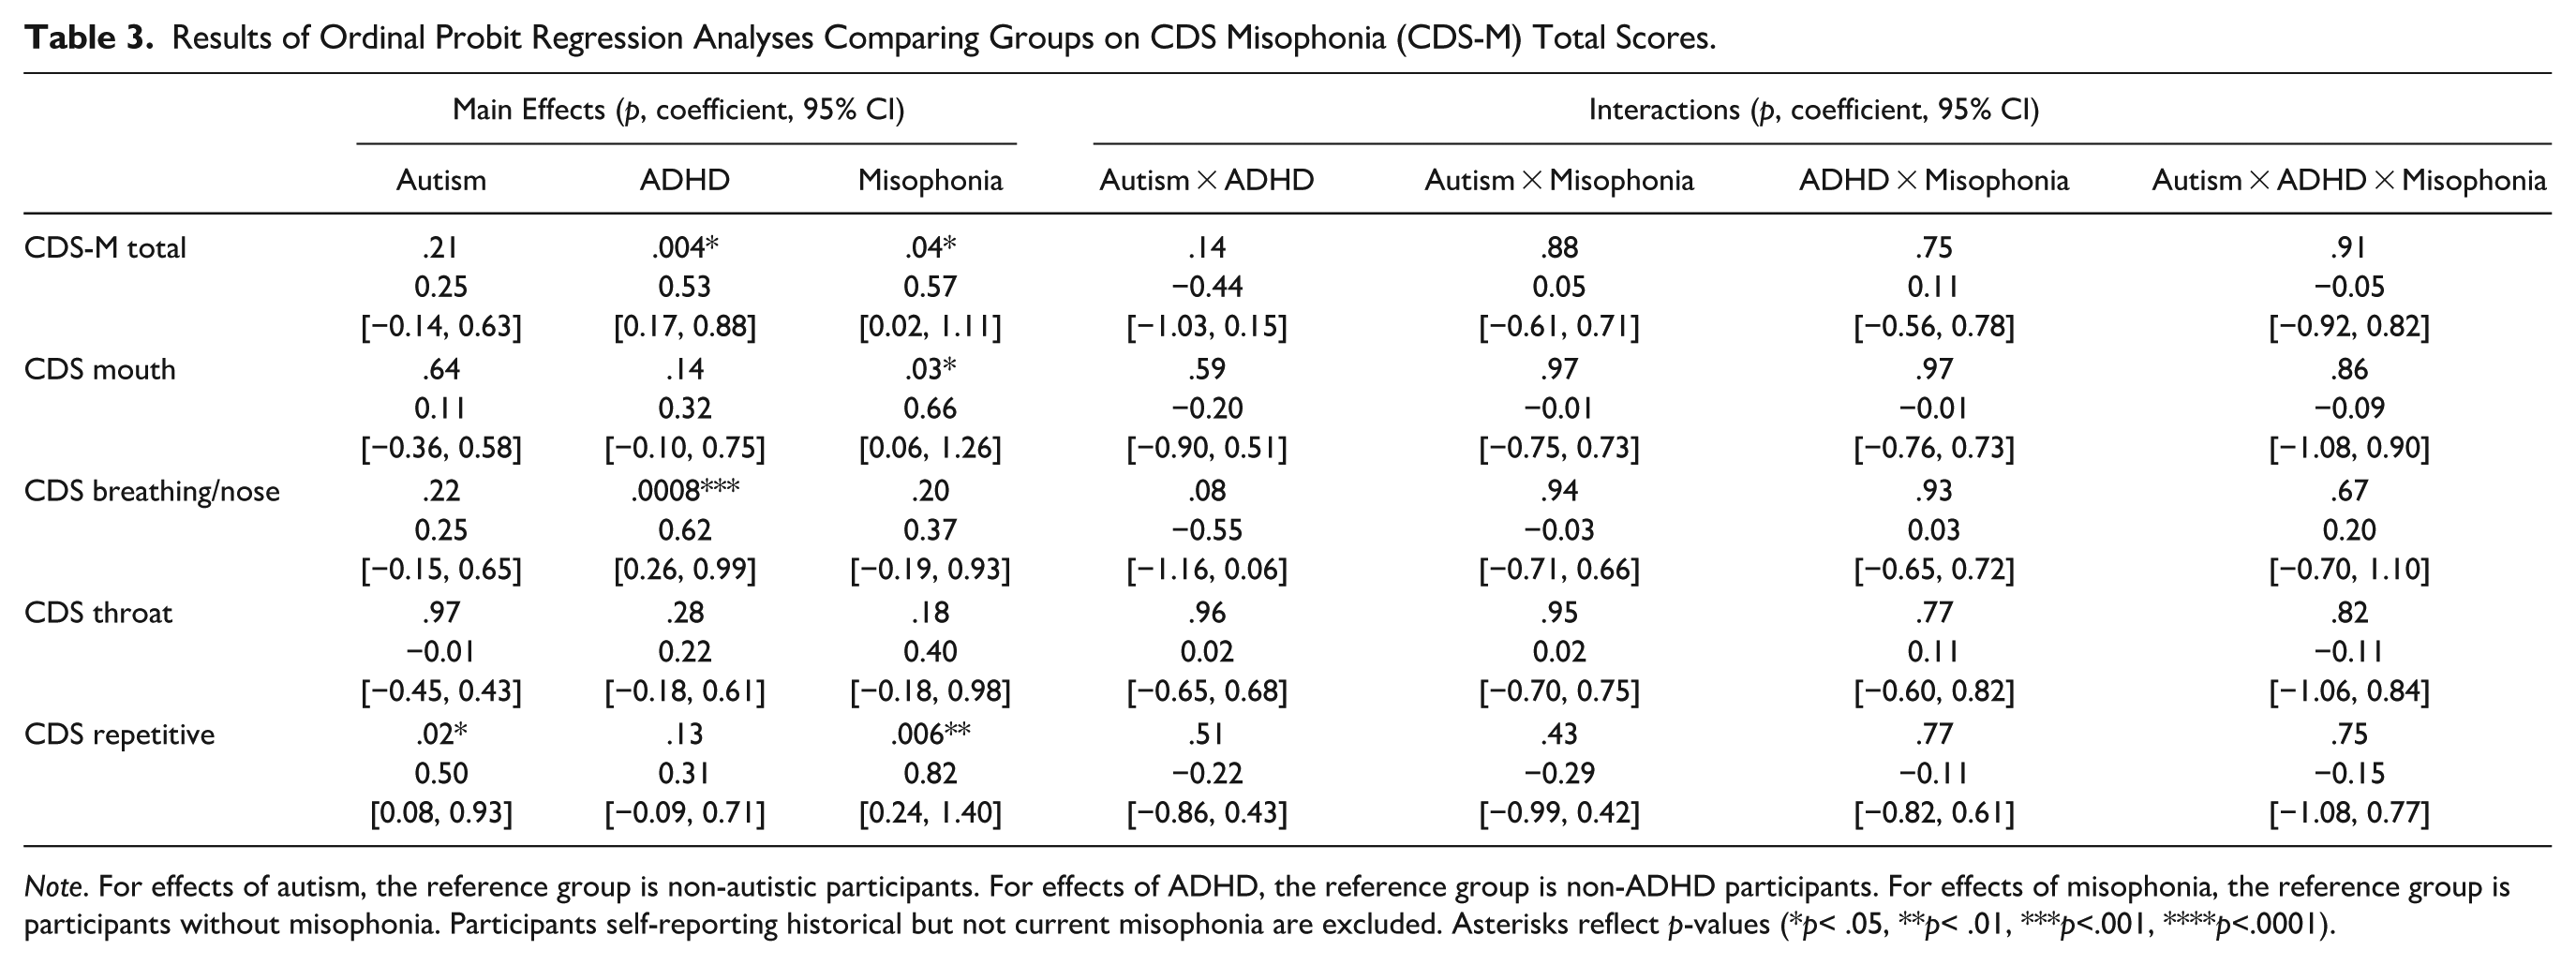
Note. For effects of autism, the reference group is non-autistic participants. For effects of ADHD, the reference group is non-ADHD participants. For effects of misophonia, the reference group is participants without misophonia. Participants self-reporting historical but not current misophonia are excluded. Asterisks reflect p-values (*p< .05, **p< .01, ***p<.001, ****p<.0001).
Convergence of Misophonia Measures
MIST-A Misophonia T-scores and CDS-M scores were significantly and positively correlated in all four groups: ADHD-only, Spearman’s ρ = .26, corrected p = .006, 95% CI [0.08, 0.42]; autistic + ADHD, ρ = .25, corrected p = .006, 95% CI [0.09, 0.41]; autistic-only, ρ = .22, corrected p = .01, 95% CI [0.05, 0.38]; and comparison participants, ρ = .31, corrected p = .006, 95% CI [0.11, 0.48] ( Supplemental Figures B.1–B.2 ). However, effect sizes were only weak to moderate.
Principal Components Analysis
The first dimension obtained in the PCA carried out on MIST-A items from the four experience frequency subscales, VADQ items, and pleasantness ratings of CDS misophonic trigger sounds—that is, on measures of various kinds of auditory hyper-reactivity—contributed the largest share of the variance (39.6%) by a considerable margin ( Supplemental Figure F.1 ); it was largely influenced by MIST-A and to some extent VADQ items, with ratings of CDS sounds contributing little to this dimension ( Supplemental Figure F.2 ). CDS ratings dominated dimension 2 ( Supplemental Figure F.3 ), but this was much smaller, accounting for only 8.7% of the variance. Dimension 3 ( Supplemental Figure F.4 ), representing just 6.1% of the variance, appeared to be a continuum between MIST-A anger/misophonia items and VADQ items ( Supplemental Figure F.5 ). All other components included less than 4% of the variance ( Supplemental Figure F.1 ).
Path Analysis
In the path analysis, we examined relationships between hyper-focus, inattention, and hyper-vigilance and auditory hyper-reactivity variables from the PCA, between hyper-reactivity and anxiety, and between anxiety and hyper-vigilance, as well as whether relationships between hyper-reactivity and inattention/hyper-focus were moderated by autism and ADHD status. We compared models including only the largest auditory hyper-reactivity PCA dimension, Dimension 1 ( Supplemental Figure G.1 ; Supplemental Table G.1) to models incorporating the second, CDS-dominated dimension ( Supplemental Figure G.2 ; Supplemental Table G.2) as well as models with the third PCA dimension ( Supplemental Figure G.3 ; Supplemental Table G.3). The latter models contributed few additional effects. An exploratory model incorporating just the CDS confirmed that CDS misophonia scores were not related to self-reported inattention or hyper-focus, although they were slightly associated with hyper-vigilance ( Supplemental Figure G.4 ; Supplemental Table G.4; see also Supplemental Table E.9). To further reduce the complexity of the model with only Auditory Hyper-Reactivity PCA Dimension 1 (Supplemental Table G.1), nonsignificant effects were dropped, improving fit (Table 4).
Path Analysis Model Depicted in Figure 3.
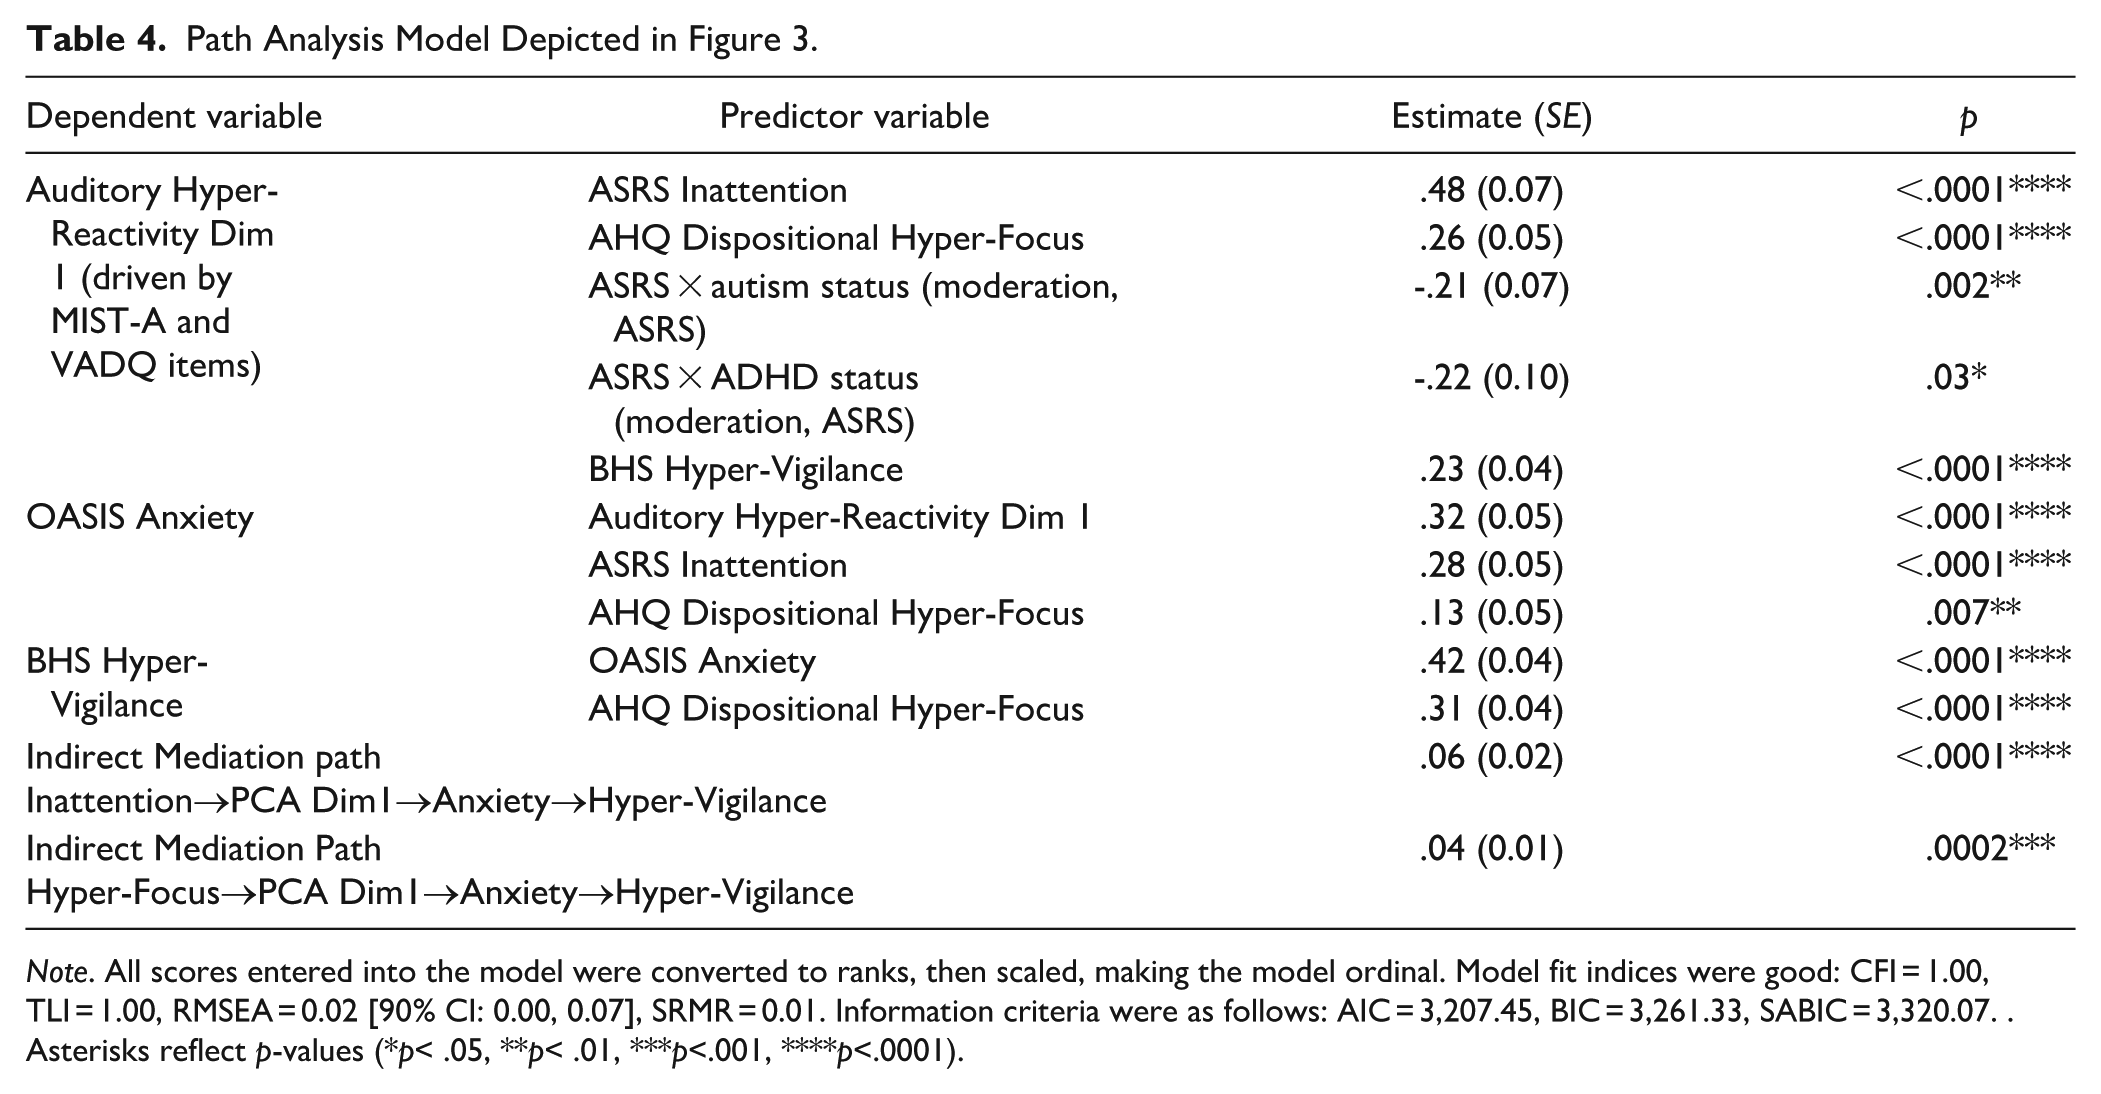
Note. All scores entered into the model were converted to ranks, then scaled, making the model ordinal. Model fit indices were good: CFI = 1.00, TLI = 1.00, RMSEA = 0.02 [90% CI: 0.00, 0.07], SRMR = 0.01. Information criteria were as follows: AIC = 3,207.45, BIC = 3,261.33, SABIC = 3,320.07. . Asterisks reflect p-values (*p< .05, **p< .01, ***p<.001, ****p<.0001).
In the resultant model, AHQ Dispositional Hyper-Focus scores were related to Auditory Hyper-Reactivity PCA Dimension 1, p < .0001, as were BHS Hyper-Vigilance scores, p < .0001 (Figure 3; Table 4).Moreover, ASRS Inattention scores were also associated with Auditory Hyper-Reactivity, p < .0001. The Inattention effect was moderated by autism status, p = .002, and ADHD status, p = .03.
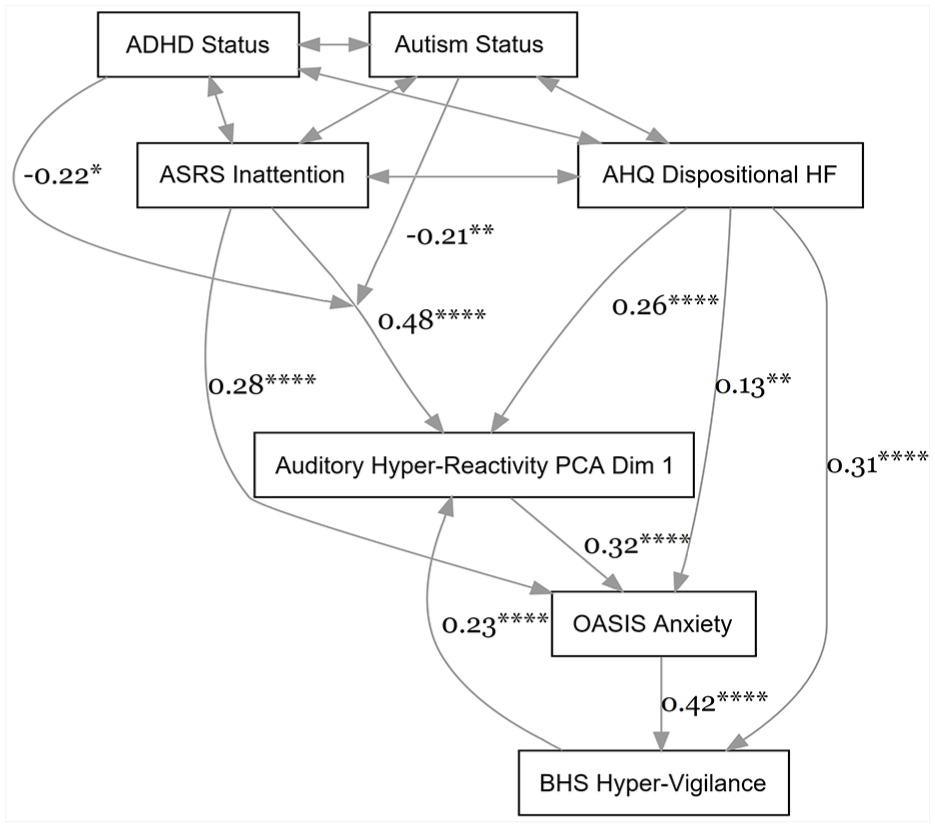
Path analysis showing that hyper-focus and inattention are associated with auditory hyper-reactivity, which is related to anxiety, which is related to hyper-vigilance. Hyper-vigilance is then related to hyper-reactivity. The association between inattention and hyper-reactivity was moderated by autism and ADHD status. The direct relationship between inattention and hyper-vigilance, and moderation effects involving the AHQ, were nonsignificant and were dropped from this model (see Supplemental Figure G.1 , Supplemental Table G.1 for a model including them). All scores entered were converted to ordinal, scaled ranks. Asterisks reflect p-values (*p< .05, **p< .01, ***p<.001, ****p<.0001)
Path analysis models within each group suggested that there was something of a trade-off between inattention and hyper-focus effects ( Supplemental Figures G.5–G.8 ; Supplemental Tables G.5–G.8; see also bivariate correlations in Supplemental Figures E.3–E.4 ; Supplemental Table E.10). In autistic-only participants, the model suggested both hyper-focus and inattention were slightly associated with auditory hyper-reactivity, p’s ≤ .04 ( Supplemental Figure G.5 ; Supplemental Table G.5), and in autistic + ADHD participants, hyper-focus was significantly related to auditory hyper-reactivity, p = .0003, but inattention was not, p = .44 ( Supplemental Figure G.7 ; Supplemental Table G.7). In ADHD-only participants and comparison participants, inattention was significantly related to auditory hyper-reactivity, p’s ≤ .007, but hyper-focus was not, p’s ≥ .18 ( Supplemental Figures G.6, G.8 ; Supplemental Tables G.6, G.8). Across groups, hyper-vigilance was consistently associated with auditory hyper-reactivity, p’s ≤ .03 ( Supplemental Figures G.5–G.8 ; Supplemental Tables G.5–G.8).
Returning to the omnibus model including all groups, Auditory Hyper-Reactivity PCA Dimension 1 was then related to OASIS Anxiety, p < .0001, which was related to BHS Hyper-Vigilance, p < .0001 (Figure 3; Table 4). Consequently, as shown in Table 4, there were significant indirect relationships between both inattention and hyper-focus and hyper-vigilance, mediated by hyper-reactivity and anxiety, both p’s < .0001.
The model also contained direct relationships between ASRS Inattention and OASIS Anxiety, p < .0001, AHQ Hyper-Focus and Anxiety, p = .007, and Hyper-Focus and Hyper-Vigilance, p < .0001 (Figure 3; Table 4).
Sensitivity path analyses applying the altered inclusion criteria from in Supplemental Appendixes C and D yielded essentially similar findings, with no changes in statistical significance of the effects compared to those in Table 4 (Supplemental Tables C.4 and D.4).
Because Auditory Hyper-Reactivity PCA Dimension 1 accounted for only 39.6% of the variance in the auditory hyper-reactivity items included in the PCA, we conducted additional supplementary analyses to determine whether similar findings could be obtained for each MIST-A subscale and for VADQ Auditory Distractibility scores ( Supplemental Figures G.9–G.13 ; Supplemental Tables G.9–G.13). Patterns of findings were generally similar to those in the main text. Admittedly, the effects of Dispositional Hyper-Focus on MIST-A subscales did not attain significance ( Supplemental Figures G.9–G.12 ; Supplemental Tables G.9–G.12), but this partly reflected shared variance among the attention variables: bivariate relationships between hyper-focus and MIST-A subscores attained significance in multiple groups ( Supplemental Figures E.3–E.4 ; Supplemental Table E.10). The model with MIST-A Pain T-scores appeared most divergent, with autism status moderating the (overall nonsignificant) relationship between hyper-focus and MIST-A Pain, but even that model was generally similar to the main text model (see Supplemental Figure G.12 ; Supplemental Table G.12).
See Supplemental Tables E.1 to E.8 for fuller association matrixes from this dataset.
Discussion
The present study explored auditory sensory phenotypes and their relation to hyper-focus and inattention in autistic, ADHD, autistic + ADHD, and general population participants. Participants filled out a multidimensional questionnaire indexing a variety of distinct forms of decreased sound tolerance, as well as questionnaires regarding auditory distractibility issues, hyper-focus, inattention, anxiety, and hyper-vigilance. Furthermore, study participants rated the pleasantness of various sounds, including common misophonia trigger sounds. We investigated group differences in decreased sound tolerance, auditory distractibility, and sound ratings; convergence of questionnaire-based and sound-rating-based misophonia measures; and relationships between attention indices, auditory hyper-reactivity, and anxiety.
Group Differences in Decreased Sound Tolerance and Auditory Distractibility
Questionnaire Measures
Group differences on questionnaire-based sensory measures were large and robust; in particular, autistic and ADHD participants reported more experiences of all sound tolerance problems indexed by the MIST-A than did non-autistic and non-ADHD people. They also reported more auditory distractibility.
Moreover, there were small-to-moderate statistical differences among the three neurodivergent groups (autistic-only, ADHD-only, and autistic + ADHD), though these were sometimes subtler and less consistent. As predicted by Hypothesis 1, autistic-only people reported more experiences of hyperacusis than ADHD-only participants. However, in supplementary analyses, this effect was not consistently maintained when higher levels of autistic and ADHD traits were required for inclusion in the study. Meanwhile, although Hypothesis 1 had also predicted more misophonia in autistic than ADHD-only participants; however, autistic-only and ADHD-only participants did not statistically differ in their reported MIST-A experiences of anger/misophonia (which largely excluded the influences of co-occurring hyperacusis).
Interestingly, while we had expected to find more auditory distractibility issues in ADHD than autism, due to the overlap between auditory distractibility and ADHD traits, this hypothesis—Hypothesis 2—was not supported by the data. There was even a trend for autistic-only people to report more susceptibility to auditory distraction than ADHD-only people, though this disappeared in supplementary analyses with more stringent inclusion criteria.
Patterns on other subscales were similar: in the analysis presented in the main text, autistic-only people reported more auditory pain relative to ADHD-only participants, but these effects were not consistently maintained in supplementary analyses with more stringent inclusion criteria. ADHD-only and autistic-only people did not differ in proneness to auditory fear/panic.
In general, then, sensory questionnaire scores seemed to highlight similarities between autism and ADHD, and appeared consistent with the idea that sensory discomfort and distress could be an important transdiagnostic phenotype in multiple neurodevelopmental disabilities.
However, statistical differences between autistic + ADHD people and all other groups were clearer. Autistic + ADHD people reported the greatest sound tolerance challenges on most scales, such as the MIST-A Hyperacusis experiences scale, even compared to autistic-only and ADHD-only participants, and these effects were largely maintained in supplementary analyses with different inclusion/exclusion criteria. While interactions imply the effects of autism and ADHD are not strictly additive/cumulative, their sensory impacts certainly appear to build on one another. Whether this appears to be an effect of “general neurological disability” or a more specific factor that can be traced to a common autism, ADHD, or neurodevelopmentally-linked etiology remains to be seen and should be the subject of future research into individual differences.
Sound Ratings
We also explored sensory phenotypes by asking participants to rate the pleasantness of short sounds canonically considered to be misophonia triggers, pleasant sounds, or unpleasant sounds.
Ratings of canonical misophonia triggers were used to derive Core Discriminant Sound Misophonia (CDS-M) scores, with nonzero scores reflecting ratings of specific sounds that exceeded the 75% quantile of non-misophonic general population participants’ ratings. As one might expect, CDS-M scores were elevated in participants with misophonia compared to participants without misophonia, suggesting that participants with misophonia made valid self-identifications. This effect was obtained even though chewing sounds, a common misophonia trigger, were deleted from the CDS-M battery due to participants without misophonia frequently also reporting negative (albeit less negative) reactions to them. Apropos thereof, after reading a definition of misophonia, participants in the neurodivergent groups were more likely than comparison participants to identify themselves as having misophonia, and autistic participants were more likely to identify as having misophonia than ADHD-only participants. However, interestingly, ADHD people also had higher CDS-M scores than non-ADHD people, controlling for self-reported misophonia status. While this effect was not consistently maintained in all supplementary analyses with altered inclusion criteria, it does imply that ADHD people might sometimes experience misophonia symptoms without identifying themselves as people with misophonic, even if they are exposed to information about misophonia. When we examined specific types of misophonia trigger sounds, ADHD affected CDS scores for breathing/nasal sounds, and there was an effect of autism on CDS scores for repetitive sounds, such as a pen clicking.
We also examined responses to canonically pleasant and unpleasant sounds. Interestingly, autistic people rated canonically pleasant sounds (e.g., ocean sounds and bird chirping) more negatively than non-autistic people, and this effect was maintained consistently in supplementary analyses with more rigorous inclusion criteria. In prior research, people with hyperacusis have rated pleasant sounds negatively (Enzler, Fournier, et al., 2021); however, as participants themselves adjusted the volume of sound presentation for comfort in the present study, loudness discomfort was probably not the main cause of these negative ratings. A seemingly more plausible explanation might be idiosyncratic, misophonia-like reactions to certain canonically-pleasant sounds in some autistic people, with participants finding them irritating or uncomfortable. However, per the correlation matrix in Supplemental Table E.3, there were trends (nonsignificant after correction) for autistic-only people who rated misophonic sounds negatively to rate canonically-pleasant sounds more positively. Future studies, carefully controlling the intensity of presented stimuli, will be better-suited to investigate why autistic people had less enthusiastic reactions to pleasant sounds.
Convergence of Sound Ratings and Questionnaires
We examined associations between CDS-M scores and MIST-A Misophonia scores, finding positive correlations in all four groups, as predicted by Hypothesis 3. Nevertheless, these correlations were only modest in size; they did not support the convergent validity of the two measures. The correlation coefficients were also smaller than those reported in prior research using a similar online approach to present misophonic trigger sounds (Enzler, Loriot, et al., 2021). It is possible that this reflects our use of the misophonia subscale of a multidimensional sound tolerance questionnaire, rather than a misophonia-specific tool, and the lack of chewing sounds in the CDS misophonia scores from the present study. Additionally, while Enzler et al.’s study was primarily focused on misophonia, the present study aimed to understand auditory processing and attention more generally in neurodivergent groups recruited from registries. Many participants still reported misophonia, but it is possible that their misophonia phenotypes were less extreme than a self-selected online sample, which might have attenuated correlations. Regardless, the limited convergence emphasizes both the difficulty and the importance of reconciling sensory measures from different modalities (Uljarević et al., 2017). Future studies incorporating more misophonia-specific tools may be better able to clarify the relationships between measures; future studies should also consider extending the duration of sounds and/or presenting trigger sounds alongside other stimuli, more closely replicating real-world conditions.
Attention, Anxiety, and Sensory Phenotypes
Finally, the present study examined whether hyper-focus, hyper-vigilance, and inattention were related to auditory hyper-reactivity, whether hyper-reactivity was in turn related to anxiety, and whether anxiety was then related to hyper-vigilance.
As predicted by Hypothesis 4, there was evidence that all three attentional variables we examined—inattention, hyper-focus, and hyper-vigilance—were related to auditory hyper-reactivity. This supports the idea that attention could contribute toward experiences of sensory discomfort and distraction. As noted by the developers of the monotropism account, hyper-focusing on unpleasant stimuli might lead to sensory distress and decreased sound tolerance (Murray et al., 2005). Meanwhile, a susceptibility to inattention and distraction might increase people’s chances of noticing unpleasant or uncomfortable stimuli in their environments, and hyper-vigilance might play a similar role except with people being even more likely to focus on a threatening or adverse stimulus if it appears. The magnitude of these relationships did seem to depend upon group: the relationship between inattention and hyper-reactivity was moderated by autism and ADHD status. Further investigation of models within each group suggested that the relationship between inattention and hyper-reactivity was strongest in ADHD-only and comparison participants, drowning out any effect of hyper-focus. In contrast, hyper-focus was related to hyper-reactivity in autistic-only and in autistic + ADHD participants.
One important alternative interpretation of inattention effects, given that they were obtained from an ADHD screening measure, is that they might not reflect attention per se, but rather ADHD traits or some third variable associated with ADHD. To name just one possibility, a substantial literature discusses emotion regulation difficulties in ADHD (Christiansen et al., 2019), and misophonia is fundamentally concerned with emotion. Path analysis models in each group suggested inattention was related to auditory hyper-reactivity in autistic-only and ADHD-only participants but not in autistic + ADHD participants, which would be an unexpected pattern if inattention reflected ADHD traits, although bivariate associations in Supplemental Appendix E suggest there was some shared variance between inattention and hyper-focus. Regardless, an interpretation focused on ADHD traits would not discount all of this study’s findings related to attention-sensory relationships: those between sensory reactivity and hyper-focus were observed despite the path analysis model effectively controlling for inattention, and those with hyper-vigilance were consistent across groups.
Interestingly, when MIST-A Pain scores were examined alone in Supplemental Appendix G, we found that they too were associated with attention. This finding is arguably surprising, as it is not clear that focusing attention on one’s hearing could generate auditory pain. However, focusing attention on pain might increase salience of and discomfort from pain, or some respondents might be interpreting “pain” in the questionnaire as pertaining to sensory distress more broadly.
Further research could endeavor to better understand the precise nature of these relationships by using cognitive and developmental tasks to isolate more specific attentional processes and phenotypes that could be involved in both neurodivergent sensory experiences and experiences of hyper-focus and/or inattention, such as attention disengagement (Baranek et al., 2018) or salience-driven attention capture.
As predicted by Hypothesis 5, we also observed that auditory hyper-reactivity was related to anxiety, which was in turn related to hyper-vigilance. Although this study’s cross-sectional design cannot test causality, since hyper-vigilance was in turn related to hyper-reactivity, this pattern suggests the possibility of a vicious cycle. Specifically, individuals could, on having a distressing sensory experience, become anxious about the possibility of further negative sensory experiences. This anxiety might lead people to vigilantly scan their environments for potential triggers of sensory distress, which could unfortunately ensure that aversive sensory stimuli are noticed and focused on. This suggests great need for caution in exposing neurodivergent people to distressing sensory stimuli. Conversely, ensuring neurodivergent people can, if necessary, control or escape from stimulation might help to limit this sort of anxiety and hyper-vigilance (see, e.g., MacLennan et al., 2022; Robertson & Simmons, 2015; Smith & Sharp, 2013).
There was one way in which Hypothesis 4 was not supported: the present study did not observe associations between attention measures and CDS scores. This raises the possibility that the observed associations, which largely were based on self-report measures, might have reflected shared variance due to the common method (Choi & Pak, 2005); for example, some participants may have been biased to use certain ranges of response options on Likert-type questions. Fortunately, the MIST-A and AHQ both have clearly-defined response options (e.g., an experience arises one to two times per month), which may reduce the subjectivity of responses. Instead, a key factor may be that the attention and sensory questionnaires both invited participants to reflect on their real-world experiences. Real-world environments are often complex and multisensory, and people are often simultaneously presented with many different possible targets of attention. In contrast, the sound rating tasks presented participants with a single stimulus at a time, so participants would have had little option but to focus their attention on that stimulus. Including multiple stimuli, such as presenting misophonia triggers amidst recordings of conversations or other stimuli, might have more closely replicated real-world conditions, perhaps allowing attention allocation to shape individual differences in response patterns.
Limitations
Although the present study benefits from a large sample size, good gender representation, specific measurement of different forms of decreased sound tolerance, and participant groups that are statistically equivalent in key demographic characteristics, this study also has limitations.
As noted by Dwyer et al. (2024), the online nature of this study made verifying diagnostic group assignments difficult. ASRS-6 and RAADS-14 scores were used to exclude participants whose questionnaire responses appeared inconsistent with their reported diagnoses and identities. However, setting inclusion and exclusion criteria was challenging. ADHD people often obtain high RAADS-14 autistic trait scores (Eriksson et al., 2013), preventing us from excluding ADHD-only participants based on autistic traits. To address this issue, we conducted supplementary analyses using different inclusion and exclusion criteria; we suggest that group differences which were not observed reasonably consistently across both the main text and these supplementary analyses should be regarded with caution and may not generalize.
Similarly, because misophonia is a relatively novel category, community access to misophonia diagnoses and information is limited, and a consensus on diagnostic assessment procedures is lacking (Ferrer-Torres & Giménez-Llort, 2022; Williams, 2022), we presented participants with a definition of misophonia and asked them whether they considered themselves to have misophonia per that definition. Due to the brevity of the definition, some participants may not have realized it applied to them, or may have misunderstood it. We also did not collect any information about participants’ misophonia triggers and the overlap between these and the canonical misophonic triggers from the sound ratings task.
Furthermore, we recognize the present study sample contains a disproportionately high number of non-Hispanic White participants, thereby contributing to the exclusion of racialized minorities from research. Our sample also appeared unusually well-educated and contained almost no participants with intellectual disabilities, contributing to under-representation of that population in autism research (Russell, Mandy, et al., 2019) and, likely, ADHD research as well. Study participants’ high average ages at autism or ADHD diagnosis also appear generally consistent with the idea that individuals with more readily apparent differences and disabilities may be under-represented, limiting generalizability. Thus, it is unclear how well our findings apply to many multiply marginalized neurodivergent communities.
One important limitation of our path analysis is that cross-sectional datasets such as the present study cannot be used to resolve the directionality of the relationships tested. Our path analysis is ultimately motivated by arguments and assumptions concerning the directionality of the relationships in question (Hernán, 2018), and as such we offer the path analysis as a potential model for continued investigation, but ultimately, the empirical data in this article only demonstrate the existence of associations among the variables. Longitudinal data would be required to draw firmer conclusions about causal relationships.
Finally, the sound rating task as administered in this study is not without limitations. Chewing sounds were so widely disliked that there was not sufficient variability to include reactions to them in the computation of misophonia scores; more nuanced or quieter stimuli might help to avoid similar ceiling effects in future research. Given the present study’s findings regarding sensory-attention relationships, and prior studies suggesting that people with misophonia can struggle to attend to other tasks and information when exposed to trigger sounds (da Silva & Sanchez, 2019; Daniels et al., 2020; Edelstein et al., 2013), it is also possible that measures embedding misophonic sounds inside other, more putatively pleasant sounds might yield more variable ratings. Moreover, participants in the sound rating task were instructed to play all sounds at a consistent level, but we cannot verify whether some participants might have adjusted their speaker volume partway through the task. We assume that different participants likely played the sounds at different intensities from one another, but we lack information about what those intensities might have been.
Conclusions
Both autistic and ADHD people reported much higher levels of multiple forms of auditory hyper-reactivity relative to the general population. Within neurodivergent groups, statistical differences between autistic-only and ADHD-only participants sometimes appeared or disappeared depending on the inclusion criteria employed, but autistic + ADHD people consistently experienced more auditory reactivity than autistic-only and ADHD-only people.
Self-reported attention variables—hyper-focus, inattention, and hyper-vigilance—appeared to be associated with a composite auditory hyper-reactivity dimension drawn largely from self-report measures. Thus, attention might influence sensory experiences. Furthermore, auditory hyper-reactivity was associated with anxiety, which in turn was associated with hyper-vigilance, setting up a possible vicious cycle if hyper-vigilance then exacerbates hyper-reactivity. Overall, these findings suggest attention can play an important role in neurodivergent people’s real-world experiences of sensory hyper-reactivity, but longitudinal research is needed to resolve whether our suggestions regarding the directionality of these relationships are accurate.
We also observed group differences when participants completed sound rating tasks. Unsurprisingly, self-identified misophonic participants, who were often neurodivergent, rated misophonic trigger sounds more negatively than non-misophonic participants. Interestingly, autistic people also rated canonically pleasant sounds more harshly than non-autistic people. Scores based on ratings of misophonic trigger sounds did converge with questionnaire reports of misophonia, but only modestly; likewise, we saw relatively limited evidence these scores were related to attention. Future research could investigate whether tasks featuring multiple stimuli competing for attention, in order to more closely resemble real-world environments, might converge more closely with questionnaire-based measures.
Supplemental Material
sj-docx-1-jad-10.1177_10870547251361226 – Supplemental material for A Trans-Diagnostic Investigation of Attention and Diverse Phenotypes of “Auditory Hyperreactivity” in Autism, ADHD, and the General Population
Supplemental material, sj-docx-1-jad-10.1177_10870547251361226 for A Trans-Diagnostic Investigation of Attention and Diverse Phenotypes of “Auditory Hyperreactivity” in Autism, ADHD, and the General Population by Patrick Dwyer, Zachary J. Williams, Wenn Lawson and Susan M. Rivera in Journal of Attention Disorders
Footnotes
Acknowledgements
We thank other researchers who contributed to this project, particularly Arnaud Noreña and Falco Enzler, who generously shared the stimulus files and MATLAB code for the Core Discriminant Sounds and provided us with advice as we implemented a new version of the task on Qualtrics. We also thank Kathleen Hupfeld, who unhesitatingly shared the latest unpublished versions of the Adult Hyperfocus Questionnaire (AHQ), as well as advice regarding further modifications of the measure. We thank Clifford D. Saron for overall guidance and support to PD in his graduate research, including in relation to the present study. Most importantly, we thank participants in the present study for their time and for making this study possible, and we particularly thank pilot participants for their valuable feedback. Finally, we thank the Simons Foundation and SPARK Research Match for supporting recruitment in the present study, as they generously provided this service to us free of any costs or charges.
Data Availability Statement
Data and materials are available from the authors on reasonable request.
Declaration of Conflicting Interests
The author(s) declared the following potential conflicts of interest with respect to the research, authorship, and/or publication of this article: ZJW has received consulting fees from F. Hoffman Laroche Ltd. ZJW and PD have received consulting fees or honoraria from Autism Speaks and from the Simons Foundation Autism Research Initiative (SFARI). PD and ZJW are members of the Autistic & Neurodivergent Scholars Working for Equity in Research (ANSWER) committee of the Autism Intervention Network on Physical Health (AIR-P). No other authors have any conflicts of interests to declare.
Funding
The author(s) disclosed receipt of the following financial support for the research, authorship, and/or publication of this article: Funding for this study was provided by the United States’ Health Resources and Services Administration (HRSA)’s Autism Intervention Research Network for Physical Health (AIR-P; UT2MC39440) and by the Tsakopoulos Foundation. Furthermore, the first author’s time was supported by an Autism Speaks Royal Arch Masons Fellowship.
Ethical Considerations
This study received institutional approval from the University of California, Davis Institutional Review Board. All participants provided informed consent electronically. No identifying details, photos, or video are included in this submission.
Supplemental Material
Supplemental material for this article is available online.
Notes
Author Biographies
References
Supplementary Material
Please find the following supplemental material available below.
For Open Access articles published under a Creative Commons License, all supplemental material carries the same license as the article it is associated with.
For non-Open Access articles published, all supplemental material carries a non-exclusive license, and permission requests for re-use of supplemental material or any part of supplemental material shall be sent directly to the copyright owner as specified in the copyright notice associated with the article.