
Abstract
Objective:
Attention Deficit Hyperactivity Disorder (ADHD) is characterized by inattention, hyperactivity, and impulsivity; however, other executive function dysregulation is common, including inhibition and working memory. This study aims to identify CT differences based on executive function performance in individuals with and without ADHD.
Methods:
Data for this study was acquired from the Adolescent Brain and Cognitive Development (ABCD) database (61 ADHD, and 61 age and sex matched controls). General linear models were used to assess relationships between measures, CT, and diagnosis.
Results:
We found a significant relation between CT and working memory scores in the right precentral area. Additionally, we found significant interactions between CT, diagnosis, and measure outcome in the Flanker assessment (in the left fusiform area) and the attention score of the CBCL (in the right precentral region).
Conclusion:
This suggests that there may be different relationships that exist between CT and executive function in children with ADHD.
Keywords
Introduction
Attention-deficit/hyperactivity disorder (ADHD) is a neurodevelopmental disorder that affects approximately 5% to 7% of children and adolescents (Hollingdale et al., 2020). The diagnosis of ADHD is based on developmental and behavioral presentation, often including standardized parent and teacher ratings of observed symptoms (Banaschewski et al., 2017). ADHD is characterized by inattention, hyperactivity, and impulsivity (Feldman & Reiff, 2014; Willcutt, 2012). Although defined by these core features, individuals with ADHD also commonly have difficulties with executive functioning tasks, particularly working memory and response inhibition (Brocki et al., 2008; Willcutt et al., 2005).
Working memory refers to one’s ability to hold information in their mind, manipulate it, and use it during cognitive tasks (Cowan, 2014; Tulsky et al., 2014), whereas inhibitory control refers to the ability to suppress automatic responses and filter out task irrelevant stimuli (Barkley, 1999). In the past, researchers have suggested that inhibition (Barkley, 1997) and working memory (Castellanos & Tannock, 2002) could be central impairments in ADHD. Although these two abilities, along with attentional capacity, are strongly interconnected (Barkley, 1997; Bunge et al., 2001; Unsworth et al., 2004) and are associated with ADHD symptoms, they support distinct behaviors and arise from different underlying brain outcomes (Almeida et al., 2010; Hoogman et al., 2019; Narr et al., 2009; Shaw et al., 2006, 2007; Silk et al., 2016).
Previous literature regarding differences in brain structure in children with ADHD have been inconsistent. Some studies have found no differences in cortical thickness (CT) when comparing typically developing children to children with ADHD (Ambrosino et al., 2017; Wolosin et al., 2009), whereas others have found decreases in CT in children with ADHD, either generally or in select areas (Almeida et al., 2010; Bernanke et al., 2022; Hoogman et al., 2019; Narr et al., 2009; Shaw et al., 2006, 2007; Silk et al., 2016). Areas of decreased CT have been commonly found in the prefrontal cortex but have also been found in areas across the brain including the parietal and temporal lobes (Almeida et al., 2010; Hoogman et al., 2019; Narr et al., 2009; Shaw et al., 2006, 2007; Silk et al., 2016). In addition, some studies have shown an association between thinner cortices and ADHD severity or clinical outcome (Almeida et al., 2010; Hai et al., 2022; Mous et al., 2014; Shaw et al., 2006) highlighting a potential correlation between brain structure and ADHD symptomology. In addition, mean curvature of the cortex is a way to quantify the shape of the cortex and provides insight into the gyrification of an individual’s cortex during development (Schaer et al., 2012).
Many of the same brain regions associated with ADHD severity have been implicated in attention and executive functioning skills. It is known that the prefrontal cortex plays an important role in attention (Kane & Engle, 2002), working memory (Bunge et al., 2001; Kane & Engle, 2002) and inhibition (Bunge et al., 2001). Additionally, studies examining brain activation during different executive functioning tasks have highlighted the importance of areas such as the parietal and temporal lobes, indicating that different executive function tasks are associated with different brain areas. For example, using fMRI, Rubia et al. (2001) demonstrated activation of the inferior parietal lobe during stop and go/no-go inhibition tasks. Specifically, the stop task, requiring motor inhibition, resulted in predominantly right inferior parietal activation and the go/no-go task resulted in activation predominately in the left hemisphere. Working memory tasks, on the other hand, have been shown to be associated with neural activity in the medial temporal lobe (Axmacher et al., 2007) and for tasks specifically requiring information manipulation, the superior parietal cortex (Koenigs et al., 2009).
Previous literature demonstrates overlap in the brain regions showing ADHD-related cortical thinning and those involved in attention and executive function. However, how CT relates to executive functioning skills in children with ADHD is not understood. In the current study, we make use of behavioral data and structural brain MRIs from the Adolescent Brain Cognitive Development (ABCD) database to elucidate the relationship between cognitive skills, specifically attention, working memory, and inhibitory control, and in a whole-brain analysis of CT in children with and without ADHD.
Methods
Adolescent Brain Cognitive Development (ABCD) Database
The ABCD study is a multisite longitudinal study examining brain development and child health that recruited children aged 9 to 10 years old at 21 data collection sites across the United States (Thompson et al., 2019). The study protocol involves medical information, brain imaging, questionnaires, and performance tasks, which allows for characterization of neurocognition, brain structure/function, and physical and mental health in relation to neurological and neurodevelopmental diagnoses, cultural and environmental factors. (https://nda.nih.gov/abcd/)
Participants
Sixty-one participants with ADHD (59% male) were drawn randomly from the ABCD baseline data and 61 typically developing participants (62% male) were age and sex matched (108–131 months) prior to exclusion due to MRI quality. Diagnosis of ADHD was determined using the Kiddie Schedule for Affective Disorders and Schizophrenia (KSAD-S). Individuals were excluded from the study if they had severe head injuries, major neurologic conditions (e.g., cerebral palsy, hemorrhage, brain tumor, brain aneurysm), and/or a diagnosis of autism spectrum disorder (ASD), schizophrenia, or alcohol/substance use disorders. Individuals with poor motion and quality control scores on MRI quality control checks were also excluded (exclusion in Supplemental Table 1).
Assessments
The National Institute of Health (NIH) Toolbox is a cognitive battery consisting of seven tasks each measuring different aspects of cognition (Rosenberg et al., 2020). Included in the NIH Toolbox are the Flanker Inhibition Task and the List Sorting task that test for inhibitory control and working memory respectively. They have been shown to have good test-retest reliability as well as construct validity (Weintraub, 2013), and are validated for testing for ages 3 to 85 years for the Flanker, and 7 to 85 years for the List Sorting Task.
List Sorting Working Memory Test
The List Sorting Working Memory Test asks participants to order objects according to size and category with progressively increased demand on working memory (Tulsky et al., 2014). In the first round, children are shown either two animals or two pieces of food and are asked to repeat back the items in order of smallest to largest. In the second round, children are shown a list of animals and food items and are asked to list the items in one category from smallest to largest, followed by the items in the second category from smallest to largest. The task progresses in difficulty until a maximum of seven items or is discontinued after two incorrect attempts (Tulsky et al., 2014). Scores are based on the number of correct responses across all trials.
Flanker Task
The Flanker Task from the NIH Toolbox measures cognitive control and attention (Rosenberg et al., 2020). In this task, children are shown five arrows with the four outermost arrows always pointing in the same direction as one another. In the congruent trial, the middle arrow points in the same direction as the other four arrows, and in the incongruent trial the middle arrow points in the opposite direction as the other four arrows (Luciana et al., 2018). Below the five arrows, children are shown a right arrow and a left arrow and are asked to pick the one that matches the middle arrow in the line. For all trials, the word “middle” appears on the screen to act as a reminder for where participants must direct their attention (Zelazo et al., 2014). Scoring for this task is based on both speed and accuracy (Luciana et al., 2018).
Child Behavior Checklist
The Childhood Behavioral Checklist (CBCL) is an observer questionnaire that is validated for individuals 6 to 18 years old. The questionnaire consists of eight subscales of problem behaviors with higher scores indicating increased presence of problem behaviors in that domain (Chang et al., 2016; Thompson et al., 2019). In this study, we utilized the raw scores from the Attention Problem subscale of the CBCL parent report form.
Cortical Thickness and Mean Curvature
From the 3D T1 weighted scans, a cortical surface model was generated using version 7.1.1 of the open access FreeSurfer image analysis suite (https://surfer.nmr.mgh.harvard.edu/). From this surface model, whole-brain CT, defined as the distance between the white matter surface and the pial surface was analyzed (Fischl & Dale, 2000). Mean curvature of the cortex was also constructed (Pienaar et al., 2008). The 3D T1 weighted (Consistent parameters across sites: resolution: 1 × 1 × 1 mm, T1: 1060 ms, flip angle: 8 degrees) (Casey et al., 2018). Scans were processed using recon-all, which includes motion correction, intensity normalization, Talairach transformation, skull stripping, white and gray matter segmentation, and cortical parcellation (Fischl, 2012). After recon-all, the white and gray matter boundary lines were reviewed and errors in the gray and white matter volume segmentations were manually edited for each individual participant (in supplement). Individual CT and mean curvature surfaces were smoothed using a 10 full width half maximum kernel and resampled to a common subject. The surface inflation and registration to a spherical atlas that occurs as part of recon-all allows for the CT and mean curvature surfaces to be compared across subjects (Dabbs et al., 2013).
Analysis
Analyses of questionnaire and behavioral data was run in (SPSS 27.0.1.0). ANCOVA were run comparing the Flanker, List Sorting, and CBCL attention problem subscale measures between groups, with group as independent variable, testing scores as the dependent variable, and age and sex as covariates (α = .05).
Whole brain group level analysis of CT and mean curvature was performed in Freesurfer 7.1.1 to determine significant areas of CT and mean curvature difference between groups. The freesurfer general linear model function mri_glmfit with a two-tailed t-test was used for both the CT and mean curvature surfaces (Weintraub, 2013). Regressors for sex, age, ADHD group, and scores on behavioral tests were used to create a z-maps. Cluster-wise correction for multiple comparison was performed by thresholding the z-map with a cluster-forming threshold of p < .01 and then running monte carlo simulations (8,000 iterations) to determine maximum cluster size for each contrast. A cluster-wise alpha value of 0.05 was used and p-values were adjusted to account for two hemispheres.
Results
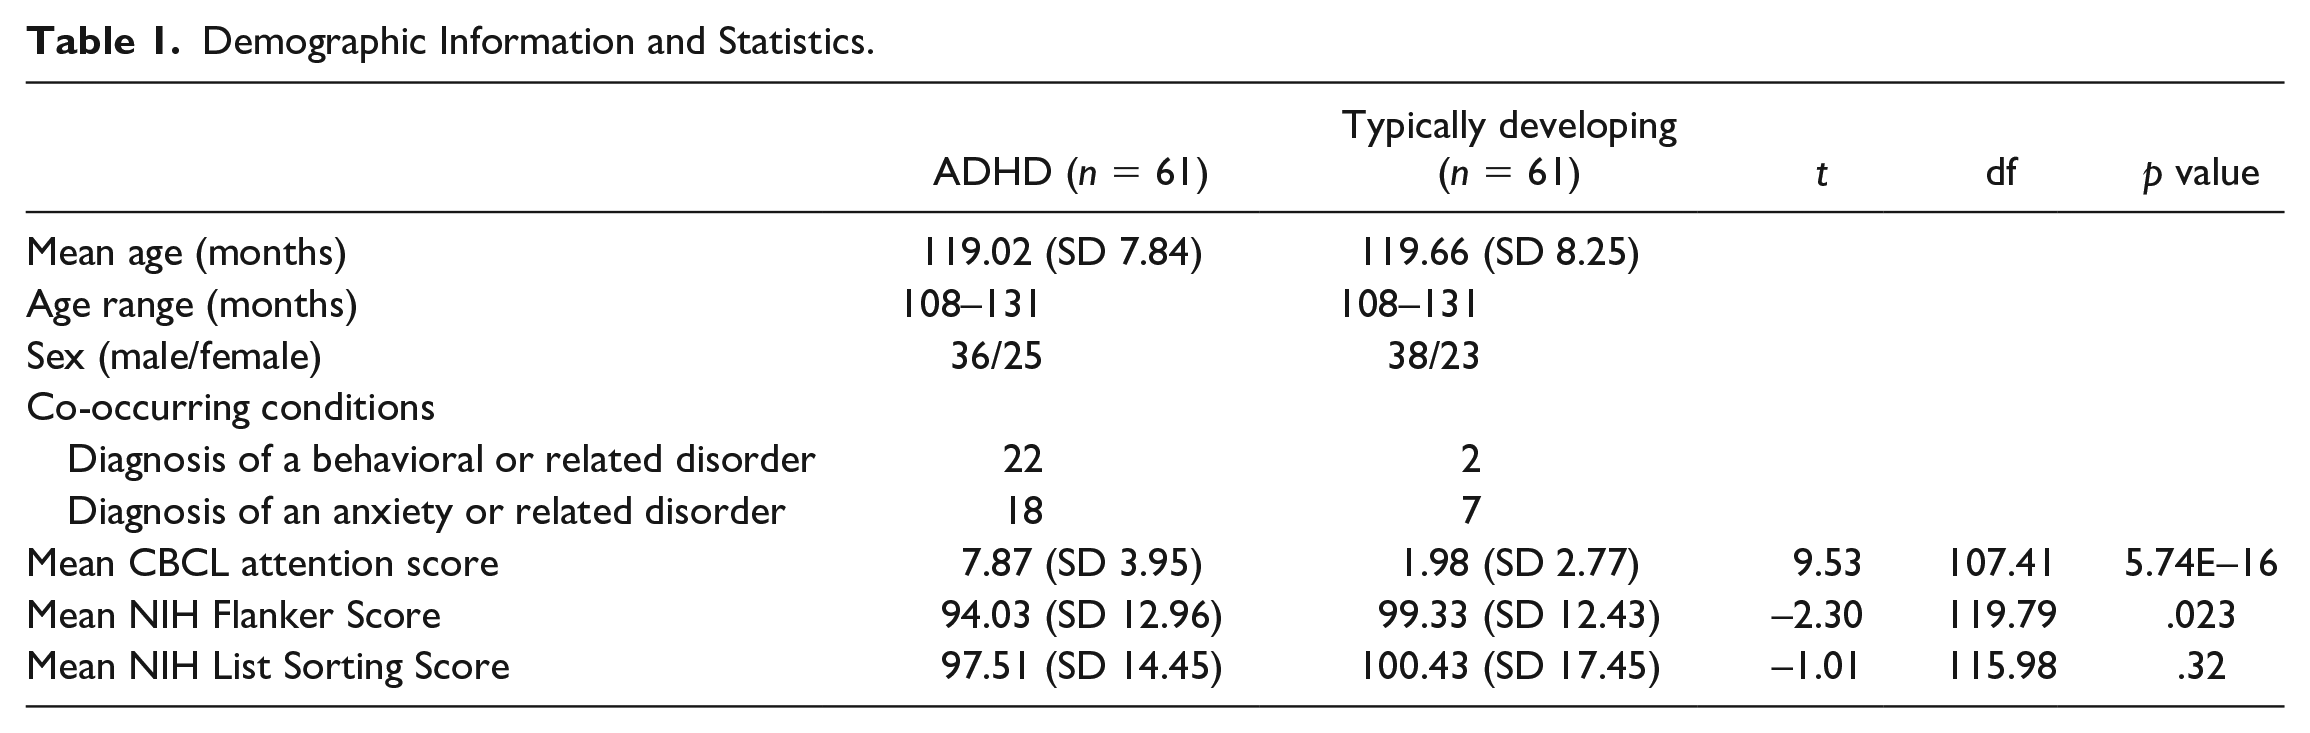
There were significant differences in scores on the Flanker assessment and the CBCL attention problem scores between children with and without ADHD (Table 1), but no difference in list sorting performance. There was a higher rate of behavioral and anxiety disorders in the ADHD group compared to the control group.
Demographic Information and Statistics.
Comparison in Cortical Thickness Between Children With ADHD and Controls
No significant clusters of differences in CT were found when comparing children with and without ADHD when controlling for age and sex. Comparing males and females (controlling for age and ADHD status) there was one significant cluster in the precentral area of the left hemisphere where the cortex was thicker in females than males (size 408.5 mm2, clusterwise p = .04327, max value 3.6502, MNI coordinates of maximum −8.1, −27.1, 73). There were no significant clusters when testing for an interaction between sex and ADHD group and controlling for age.
Associations Between Cortical Thickness and Behavioral Scores
No significant association between CT and scores on the attention problems subscale of the CBCL was found on whole brain analysis for all children (controlling for age and sex). However; there was a significant area of association with CT when testing for interaction between CBCL attention problem scores and group (Figure 1A, right precentral region, area 562.19 mm2, clusterwise p = .00375, maximum value 4.608 MNI coordinates 49.4, −1.0, 36.2). The interactions between diagnostic groups indicates different patterns of relations between CT and assessment scores between groups (Figure 2A). The control group showed a negative trend between CT in the left fusiform area and assessment scores (i.e., children who had more attention problems had reduced CT) while the ADHD group had less of a trend between CT and scores.
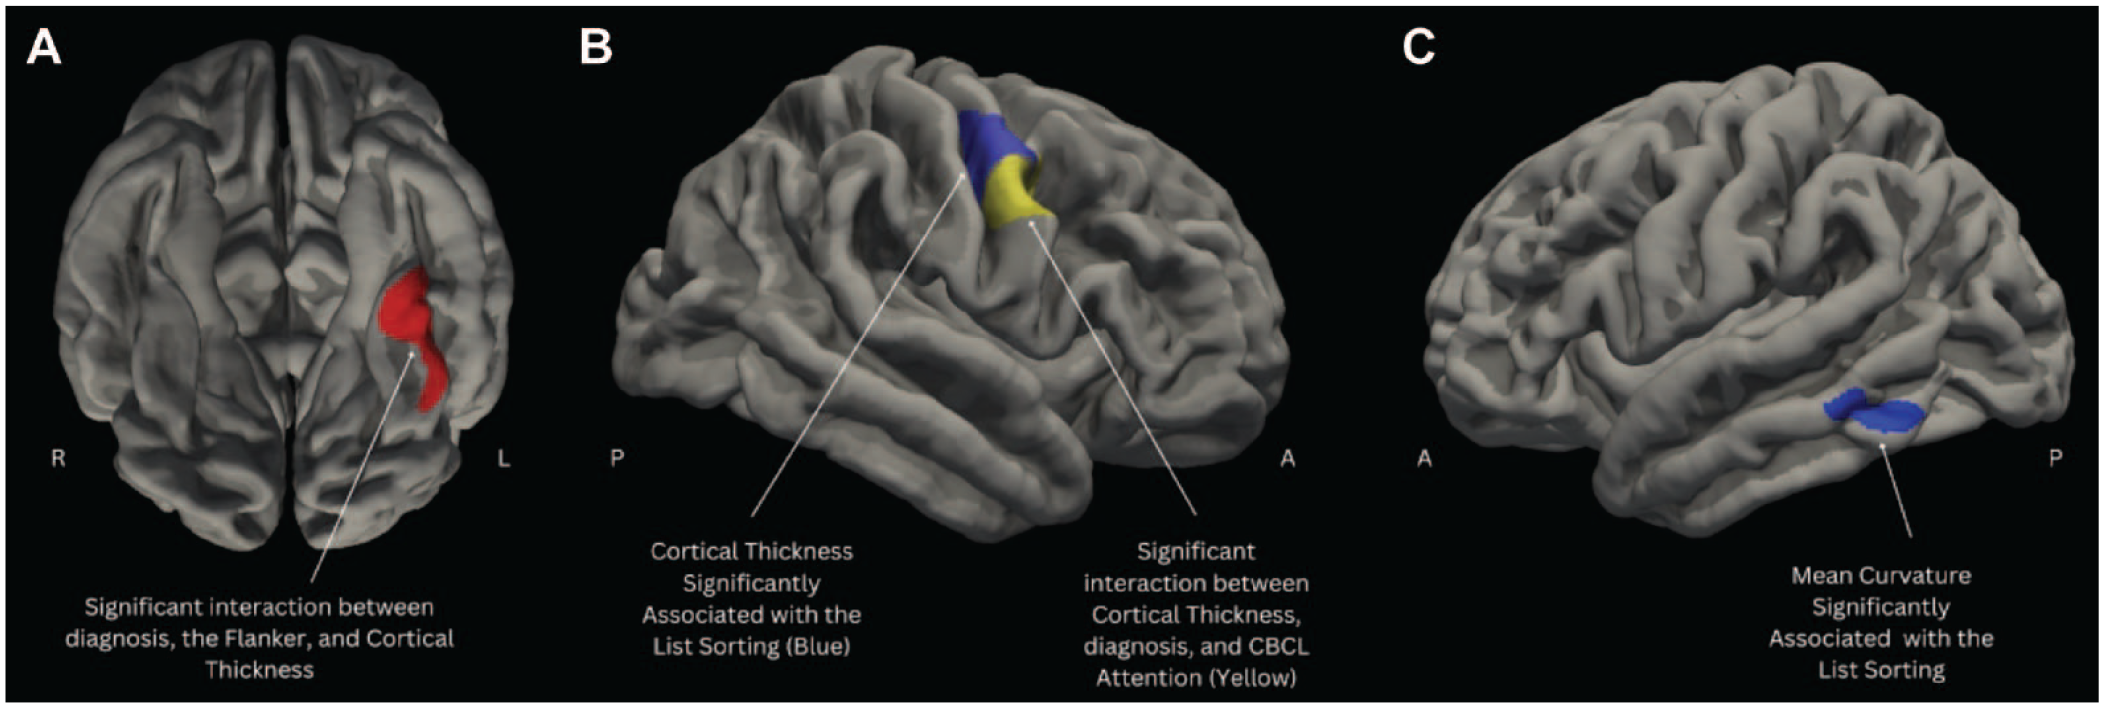
(A) Inferior view of the brain. The red region indicates a significant interaction between Flanker scores, diagnosis, and CT; (B) Lateral view of the right hemisphere. The blue region indicates the region with a significant correlation between list sorting scores, and cortical thickness; Yellow region indicates the region with a significant interaction between CBCL attention scores, diagnosis, and CT; (C) Lateral view of the left hemisphere. The blue region indicates the region with a significant correlation between list sorting scores and mean cortical curvature.
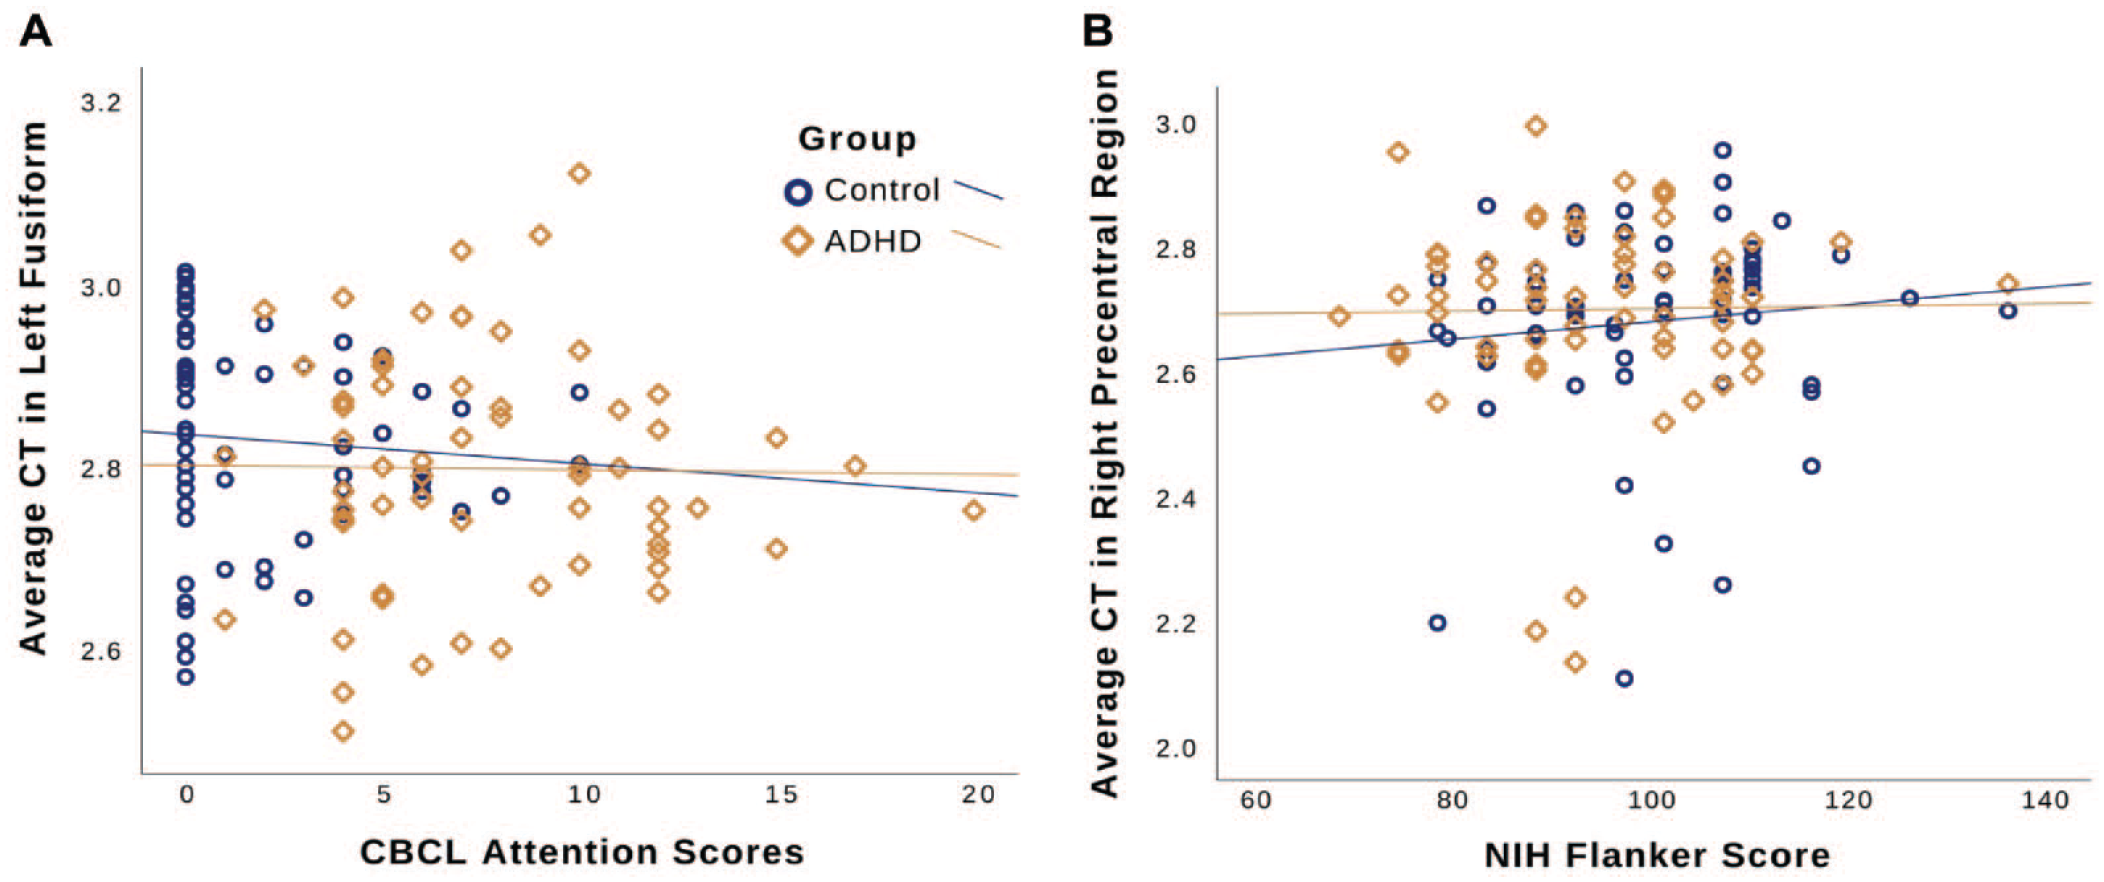
Interaction plots for executive function metrics and their corresponding cortical thickness (CT) values for the regions that had significant outcomes (Blue circles: Controls; Gold Diamonds: ADHD). CBCL Attention Score R2 Values (Controls: 0.012; ADHD: 2.802E-2); NIH Flanker Score R2 Values (Controls: 0.006; ADHD: 2.498E-4); NIH List Sorting Score R2 Values (Controls: 0.010; ADHD: 0.047): (A) CBCL Attention Scores and average CT in left fusiform and (B) NIH Flanker scores and average CT in right precentral region.
When investigating CT associations with the Flanker task performance there was also no areas of correlation with performance across all participants (controlling for age and sex). One area was significant for interaction between performance on the Flanker and group in the left fusiform area (Figure 1A, area 441.13 mm2, clusterwise p = .02138; maximum value −3.87, MNI coordinates of maximum −35.6, −40.6, −22.4). The control group showed positive trend between CT in the right precentral region and performance on the NIH Flanker scores (i.e., children with better inhibition had increased CT) which was not seen for the children with ADHD (Figure 2B).
There was an area of association between CT and performance on the list sorting performance with CT for all children there was a significant cluster in the right precentral area (Figure 1B, area 645.8 mm2, clusterwise p = .0020, maximum value 4.66, MNI coordinates 47.6, −7.2, 48.6) where increased thickness correlated with improved performance. On the list sorting task there was no significant areas of interaction between group and task performance.
Mean Curvature of the Cortex
The same contrasts were used to analyze mean curvature of the cortex. There were no differences found in mean curvature between children with ADHD and controls, between males and females or in the interaction between diagnostic group and sex (controlling for age). There were also no areas of significant association between mean curvature and scores on the CBCL attention subscale or the Flanker, nor the interaction between the scores and diagnostic group. There was an area in the left inferior temporal region (Figure 1C) that showed a significant association between mean curvature and performance on the list sorting task (area 220.54 mm2, clusterwise p = .0327, maximum value 4.45, MNI coordinates −55.3, −50.6, −13.6). On the list sorting task there were no significant areas of interaction between group and task performance.
Discussion
This study aimed to investigate the relationship between executive function measures and CT in individuals with and without ADHD. We found no differences in CT between diagnostic groups both regionally and overall. This has been a point of contention within the literature with some studies showing differences between diagnostic groups (Narr et al., 2009; Silk et al., 2016) and others showing no differences between diagnostic groups (Bernanke et al., 2022; Wolosin et al., 2009). We found relations between a selective executive function measure (list sorting for working memory) and thicker cortex. For other measures we found significant interactions between diagnostic status, CT, and measures (CBCL attention problem subscale, and the NIH Flanker), supporting the use of cortical thickness as a possible biomarker of executive function.
Working memory performance had a significant positive association with CT in an area of the right precentral region. The list sorting task was the only assessment in this study that had significant direct association between CT and assessment scores for all children. Although individuals with ADHD have been shown to have deficits in working memory (though not in the current analysis), this is not consistently recognized as a core symptom of ADHD, and is not a diagnostic requirement (Earle, 2014). This suggests that although there is a relationship between CT and outcome measures on the list sorting task, the relationship is not influenced by presence of ADHD diagnosis.
Both the Flanker assessment and the attention problem subscale of the CBCL assess core symptoms of ADHD, inhibition and attention respectively. Performance on both of these assessments showed no correlation with CT when controlling for age and sex for all children. However, both outcomes showed interaction effects between diagnostic group and performance when associated with CT. In both cases, the control group had thicker cortex with improved behavior, that was less apparent in the ADHD group (Figure 2). The attention problem subscale from the CBCL had a significant interaction effect in the CT of the right precentral region. The prefrontal region has been associated with working memory and inhibition abilities (Bunge et al., 2001). Additionally, right frontal lobe differences have been identified between individuals with and without ADHD (Almeida et al., 2010).
The Flanker had a significant interaction effect between performance and group in CT of the left fusiform area. Previous studies have shown differences in the fusiform gyrus between individuals with and without a diagnosis of ADHD (Chiang et al., 2020; Hoogman et al., 2019) and has been associated with inhibition skills (Palejwala et al., 2020). However, it is more associated with higher order visual processing such as shape and form recognition (Palejwala et al., 2020). It is therefore possible that the differences seen in performance on the Flanker task in children with ADHD may be influenced by differences in their visual processing. This would be supported by previous literature indicating widespread sensory processing differences in ADHD (Rani et al., 2023).
In general, increased CT was associated with increased performance on the assessment in our study and others of ADHD. In contrast, more thinning is related to increased performance on cognitive tests through development in typically developing populations (Shaw et al., 2007). This is consistent with the literature showing differential thinning patterns during development (Shaw et al., 2007), between diagnostic groups (Narr et al., 2009; Silk et al., 2016), and based on executive function ability (Mous et al., 2014). Shaw et al. (2006) showed the differences in cortical thinning between children with and without ADHD through development at school age and into adolescence was most pronounced in the prefrontal cortex (Shaw et al., 2007). Although their study identified different regions, they similarly identified thinning in the region of interest to be associated with decreased attention (Shaw et al., 2006).
As noted above, there is wide disagreement in the literature on differences in CT between individuals with and without ADHD (Shaw et al., 2007; Silk et al., 2017). This is not surprising given the variability within the studies demographics and study design that could impact results. This is particularly apparent when considering medication usage and co-occurring conditions. This studies sample did have significant differences in co-occurring disorders between the ADHD and control groups. However, this is expected given the rate of co-occurrence of ADHD with other brain-based conditions and is consistent with other related studies (Bélanger et al., 2018). Medications used to ameliorate symptoms in ADHD have been shown to impact CT metrics. Narr et al. (2009) demonstrated that there were more spread differences in CT between the ADHD and control group when their analysis include children with ADHD that were and were not taking stimulant medication, suggesting that the use of stimulant medication increased CT differences compared to typical development (Narr et al., 2009). Although medication use has been shown to have effects on CT we could not quantify medication exposure in the ABCD database because duration and dosing was not reported. Further studies should employ more comprehensive recording of medication usage, dosage, and duration to accurately include medication usage as a component within analysis.
Our study found limited association between cortex mean curvature and ADHD diagnosis or executive function ability. Mean curvature is less studied than cortical thickness in clinical populations, but these findings are in keeping with previous studies (Forde et al., 2017; Shaw et al., 2012; Si et al., 2021). We found one area in the left inferior temporal region that was associated with working memory performance. This is in keeping with previous literature implicating the inferior temporal lobes in working memory (Miller et al., 1993; Oztekin et al., 2009; Sugase-Miyamoto et al., 2008).
To improve the understanding of the neurologic basis for executive function deficits in different clinical groups, further studies of CT and other related anatomical metrics, such as cortical volume, surface area and curvature are needed. Because it has been demonstrated that the timing and trajectory of cortical thinning is different in children with and without ADHD (Shaw et al., 2007), longitudinal studies that relate the development of executive function through school age and adolescence with CT may improve understanding of the cortical basis for these deficits in ADHD. Previous studies have shown that other metrics of cortical structure may produce more significant results when assessing differences between individuals with and without ADHD, including cortical volume, and surface area (Hoogman et al., 2019; Narr et al., 2009). Furthermore, fully characterizing individual differences (in co-occurring disorders, cognitive and behavioral performance, genetics, treatment history, and other metrics that could influence brain development) in future large-scale studies of cognitive development of children with neurodevelopmental conditions will lead to improved understanding of the neurophysiological bases of these conditions.
Conclusion
This study demonstrated differences in the relationship between executive function performance, diagnosis of ADHD, and CT. Scales that were directly associated with core symptoms of ADHD (CBCL attention problems and NIH Flanker) had interaction effects between CT, ADHD status, and the assessment scores. Working memory (list sorting task) did have significant association with CT but no interaction effects with diagnostic status. This leads to the conclusion that the relationship between executive function and CT within ADHD is complex and dependant on which executive function component is being assessed.
Supplemental Material
sj-docx-1-jad-10.1177_10870547231174036 – Supplemental material for The Relationship Between Cortical Thickness and Executive Function Measures in Children With and Without ADHD
Supplemental material, sj-docx-1-jad-10.1177_10870547231174036 for The Relationship Between Cortical Thickness and Executive Function Measures in Children With and Without ADHD by Elana Sarabin, Kelsey Harkness and Kara Murias in Journal of Attention Disorders
Footnotes
Declaration of Conflicting Interests
The author(s) declared no potential conflicts of interest with respect to the research, authorship, and/or publication of this article.
Funding
The author(s) disclosed receipt of the following financial support for the research, authorship, and/or publication of this article: This study was supported by the Alberta Children’s Hospital Foundation and the Owerko Centre at the Alberta Children’s Hospital Research Institute.
Role of Funder/Sponsor
Funders had no role in the design and conduct of the study.
Supplemental Material
Supplemental material for this article is available online.
Author Biographies
References
Supplementary Material
Please find the following supplemental material available below.
For Open Access articles published under a Creative Commons License, all supplemental material carries the same license as the article it is associated with.
For non-Open Access articles published, all supplemental material carries a non-exclusive license, and permission requests for re-use of supplemental material or any part of supplemental material shall be sent directly to the copyright owner as specified in the copyright notice associated with the article.