



Abstract
We addressed whether the degree of structure of reading content delivery to the children or degree of professional development support for the teachers was related to kindergarten through second-grade students’ 2-year reading growth in high-poverty, low-performing schools. There were four categories of data sources: (a) classroom, curriculum-based, reading assessments; (b) principal questionnaires; (c) information about staff development and implementation of reading-instruction reform; and (d) demographic information. Six reading variables were created from the classroom reading assessments. Two variables were created from staff development logs and school-based reading-instruction implementation plans—“degree to which content delivery to children was structured” and “degree to which teachers were supported in learning the instructional structure and content.” Control variables such as student poverty status and percentage of African American students in the school were created from the principal questionnaire and demographic data. Hierarchical linear models were used. Main conclusions were as follows: (a) Less structured content delivery overshadowed more structured delivery for student growth, but there was added value of being in schools with more characteristics associated with effectiveness. (b) Students who made the greatest growth were in schools with higher support for teachers. But in low-support settings, students made more growth if they were in schools with more characteristics associated with school effectiveness. (c) The degree of structure of content delivery and degree of professional development support were significantly related to growth in phonics knowledge, but not to growth in other reading subprocesses.
Keywords
The present study addressed the following: (a) Is there a relationship between the degree of structure of reading content delivery and kindergarten through second-grade students’ 2-year reading growth? and (b) Is there a relationship between the degree of professional development support for the teachers to learn the instructional structure and content and kindergarten through second-grade students’ 2-year reading growth? The degree of structure of content delivery to the children was defined by the extent to which a framework was specified for content delivery and instructional activities. An example of high-structure delivery was one in which teachers were given scripts to use during reading lessons. An example of low-structure delivery was book floods with little or no explicit instruction. Degree of professional development support for teachers was defined by the extent to which professional development sessions were held as well as the extent of follow-up coaching or scaffolding.
Study Context
Our study was conducted in the context of a statewide early reading reform effort in high-poverty schools that involved some features of teacher professional development. However, it was not an investigation of school reform per se, nor was it an investigation of an assortment of complexities involved in professional development. Instead, school reform and professional development activities provided a broad context for our exploration of two focal factors that existed inside of that wide array of activities and their relationship to student reading outcomes. The contexts set the stage for the rationale for our study. Figure 1 provides a structured overview of how our focal factors were situated with the broader contexts.
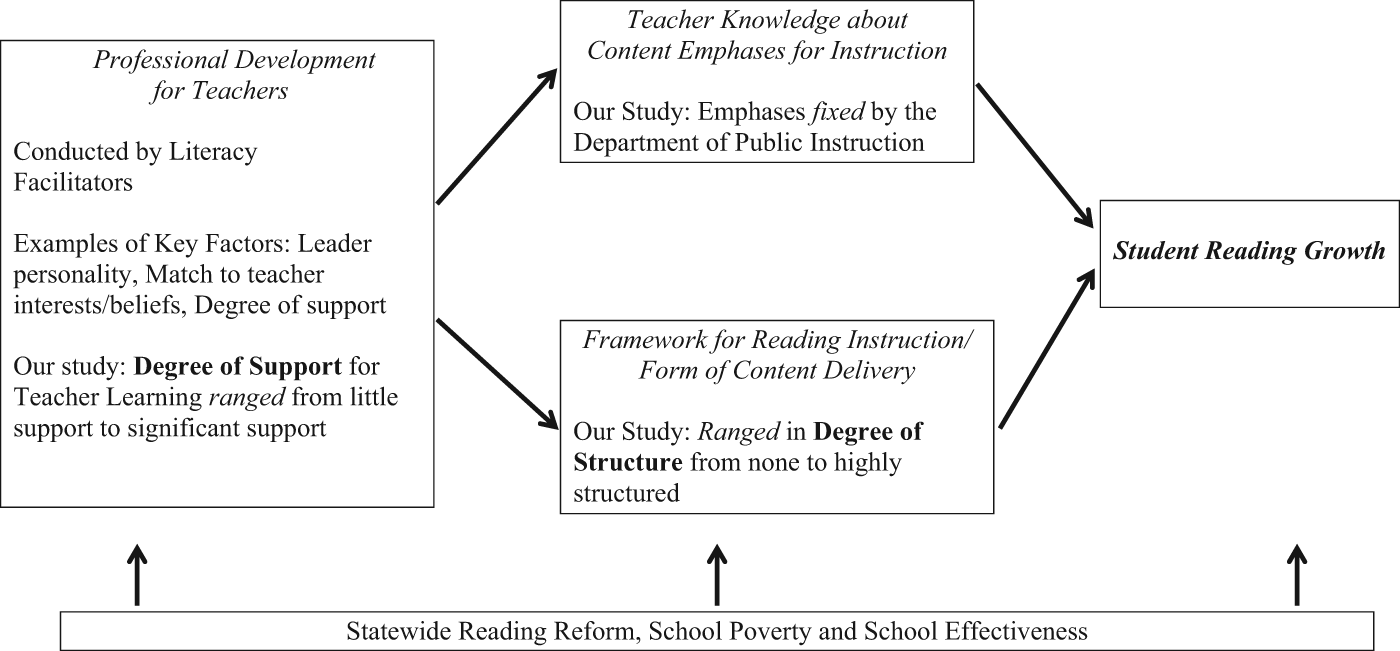
The study variables in context.
The high-poverty status of the schools was an important consideration because high-poverty schools face significant challenges in impacting children’s reading growth. Low-income students are at a greater risk of academic reading difficulty than are high-income students (e.g., Chatterji, 2006; Kaplan & Walpole, 2005; Snow, Burns, & Griffin, 1998), and their reading achievement levels tend to be lower than high-income students’ levels (Entwisle & Alexander, 1990; McLoyd, 1998; White, 1982; Zill, Moore, Smith, Stief, & Coiro, 1995). For example, nationally, 50% of low-income students scored below the basic level on the 2007 National Assessment of Educational Progress (J. Lee, Grigg, & Donahue, 2007), while only 21% of their high-income peers scored below the basic level.
To address the challenge of high-poverty situations, the schools in the present study were participating in 2 years of classroom reading-instruction reformation. State-designated high-poverty, low-performing schools participated in the reform initiative. The primary goal was to impact kindergarten through third-grade classroom reading-instruction reform and student reading achievement through classroom teachers’ professional development. Each school independently created and followed a plan for reform, and within the school reform plans the state Department of Public Instruction required that the reading content that was taught to children would focus on the five main reading subprocesses identified in the National Reading Panel report (National Institute of Child Health and Development, 2000; Snow et al., 1998)—phonemic awareness, phonics, vocabulary, comprehension, and fluency. In addition, teachers were to use and implement “scientifically based reading instruction.” To enact the school-level reform plans, during the 2 years of our study, a state Department of Public Instruction representative held sessions on reading instruction in the five reading subprocess areas for literacy facilitators from each of the schools. However, because each school independently created and enacted other aspects of the reform plan with state-level oversight, there was variation among schools with respect to the two key aspects of interest in the present study—the structure of content delivery to the children, and the degree to which teachers were supported in learning to implement the content and structure.
As for the professional development context, many professional development session variables may impact student reading progress, including, but not limited to, the personality of the professional development leader, the match between teachers’ interests and beliefs about the content and framework of the instruction they are learning, and the degree of support they receive for learning the new instructional means (cf. Guskey, 2003), each of which in turn may impact students’ reading growth (Gersten et al., 2010). In addition, the salience of selected factors’ impact on student reading outcomes may vary according to conditions of school effectiveness and poverty level. There are few rigorous studies detailing the relationships between teacher professional development factors and students’ achievement (Wayne, Yoon, Zhu, Cronen, & Garet, 2008; Yoon, Duncan, Lee, Scarloss, & Shapley, 2007).
We studied only content-delivery structure of the children and professional development support for teachers because they are potential critical factors for children’s reading growth, and because they are likely to be especially salient for children in high-poverty settings (cf. Carlisle, Cortina, & Katz, 2011; Slavin & Madden, 2001). To our knowledge, the importance of key factors in teacher professional development and reading-instruction delivery structures as they might impact student reading outcomes has not been clearly documented in prior research or examined simultaneously within single studies. Nor has it been clearly documented for young children in high-poverty settings. In the following sections, we describe a set of theoretical relationships in which a potentially central facet of professional development—the degree of support for teacher learning—could be especially important for children’s reading growth, and as well, in which the degree of reading-content-delivery structure could be central to children’s reading growth.
Rationale
The Importance of Content-Delivery Structure, Especially in High-Poverty Settings
One explanation for the persistent effect of poverty on students’ reading achievement is that teachers in high-poverty schools may be less knowledgeable than other teachers about recent reading research on reading processes and instruction (Garet et al., 2008). Hypothetically, content delivery that is highly structured, such as scripted lessons, may provide basic instruction in research-based critical features of children’s reading processes at just the right moments in the children’s reading development, especially for teachers who are less knowledgeable (cf. Adams et al., 2002; Borman et al., 2005; Foorman, Francis, Fletcher, Mehta, & Schatschneider, 1998; Mac Iver, 2004; Ross et al., 2004).
Another possibility is that, on average, students in in-school and out-of-school high-poverty settings do not have the same exposure to, or experiences with, school-valued language and literacy that their peers in moderate- and high-wealth situations do (Compton-Lilly, 2004; Heath, 1983; Purcell-Gates, 1995; Vernon-Feagans, 1996). For children who have not been exposed to foundational literacy experiences, a highly structured content-delivery framework might provide a supportive bridge to facilitate students’ exposure to literacy and to facilitate their thinking and understanding about reading (e.g., Foorman et al., 1998).
At the same time, some kinds of highly structured content delivery have been heavily criticized. For instance, scripted content delivery may result in “thoughtless” instruction in which teachers do not reflect on, critique, or sufficiently modulate instruction to meet the situational needs of students (Allington, 2002; Hassett, 2008) resulting in less student reading growth.
To date, the importance of degree of content structure delivery for children’s reading progress in high-poverty settings or otherwise is not clear. On one hand, children’s achievement in some of the most challenging school settings has benefited from implementation of highly structured schoolwide reforms. For instance, Success for All (Slavin & Madden, 2001) and Direct Instruction (Carnine, Silbert, Kame’enui, & Tarver, 2004; Engelmann & Carnine, 1991), two comprehensive school reform programs, provide moderately or highly structured content delivery. Both have been found to be effective in supporting student reading achievement (Borman, Hewes, Overman, & Brown, 2003; Madden, Slavin, Karweit, Dolan, & Wasik, 1993; Slavin et al., 1996; Tivnan & Hemphill, 2005).
However, there is contradictory evidence. Less structured content delivery, such as implementation of book floods, has also been shown to be highly effective for student reading growth (cf. Neuman, 1999, 2002). Also, a large-scale study of one of the most well-known examples of young children’s reading reform efforts guided by structured content delivery—the federally funded Reading First (U.S. Department of Education, 2002)—resulted in the conclusion that Reading First children had virtually no better reading skills than those in schools that were not using the Reading First highly structured instruction (Lankford, Loeb, & Wyckoff, 2002). Structured content delivery was only one factor in the instruction, and so it remains possible that other factors may have interacted with the content-delivery structure so as to have washed out its possible effect.
An additional point about prior studies of content-delivery structure is that although researchers have investigated the effects of highly structured content delivery (e.g., Slavin & Madden, 2001) or less structured content delivery (e.g., Neuman, 1999, 2002), rarely have they investigated a range of content-delivery structures within the same study. Consequently, the effect of degree of content-delivery structure is not clear.
The Importance of Degree of Professional Development Support for Teachers, Especially in High-Poverty Settings
Teachers in high-poverty settings may need extra support for learning to teach reading if they are less knowledgeable than teachers in other settings (Darling-Hammond, 1997; Foote, 2005). Highly supported teacher professional development for learning new ways of teaching reading may be an especially critical factor for children’s reading progress. The more support teachers have for their learning from each other and expert others, the more their learning is scaffolded (Vygotsky, 1978). More scaffolding could enable more teacher exploration and decision making, enhancing teachers’ capacity to grow their understandings in rich ways that in turn potentially impact their ability to reflect on, implement, and modulate instruction.
There is minimal available evidence addressing the degree of teacher support within professional development and its link to student achievement outcomes, and the results are mixed. Some research supports the contention that a higher degree of teacher support is related to higher student achievement outcomes. For instance, for enhanced literacy achievement in a variety of school settings, continuing professional development that involved teachers in their own learning with strong leadership and external support was key (Carlisle et al., 2011; Carreker et al., 2005; Fletcher, Greenwood, Grimley, & Parkhill, 2011; Gersten et al., 2010; Guskey, 2003; Scanlon, Gelzheiser, Vellutino, Schatschneider, & Sweeney, 2008; Taylor & Pearson, 2004; Taylor, Pearson, Peterson, & Rodriguez, 2005; Wasik & Hindman, 2011). Results of a major prior meta-analysis of 29 widely implemented comprehensive school reform models also suggested that the schoolwide educational reforms judged to be the most effective included strong teacher professional development components with effective follow-up to address teachers’ specific challenges in implementing change (Borman et al., 2003; Muncy & McQuillan, 1996; Nunnery, 1998). Other researchers (Carlisle et al., 2011) investigated three professional development conditions and reported that extensive school- and classroom-based support for teachers was most likely to lead to change in instructional practice compatible with the literature surrounding effective early reading instruction.
On the other hand, a few researchers reported contrary findings. Garet and colleagues (2008) conducted a rigorous investigation of three professional development conditions—a content-focused institute series, a content-focused institute series plus in-school coaching, and the standard district professional development. They found no student reading achievement effect for either of the experimental professional development conditions when compared with each other or the standard school district professional development sessions. Reasons for the disparate findings are not clear.
In addition, in general, in the few studies of the impact of professional development on student achievement, the professional development leaders have been researchers or highly trained experts (Wayne et al., 2008). Little is known about the impact of professional development when local school leaders are charged with the development in a range of school contexts.
Why Other School Characteristics Might Matter
Selected school contextual characteristics in high-poverty settings have been shown to impact both program implementation and reading reform outcomes (Coburn, 2005; Tyack & Cuban, 1995). However, which contexts matter most in high-poverty settings is not entirely clear from the research literature. We know that high concentration of poverty is associated with susceptibility for low reading achievement (Snow et al., 1998; Snow, Griffin, & Burns, 2005; Sutton & Soderstrom, 1999). Indeed, concentration of poverty within a school or neighborhood predicts student achievement more strongly than individual students’ family income levels (Myers, 1986; Snow et al., 1998). As well, “school effectiveness” studies consistently suggest that five key school contexts are associated with student achievement: (a) school leadership (Designs for Change, 1998; Lein, Johnson, & Ragland, 1997), (b) degree of teacher-administrator-staff focus on improved student learning (Designs for Change, 1998; Lein et al., 1997; Taylor, Pearson, Clark, & Walpole, 2000), (c) strength of staff collaboration (Designs for Change, 1998; Lein et al., 1997; Taylor et al., 2000), (d) degree of ongoing professional development (Designs for Change, 1998; Johnson & Asera, 1999; Lein et al., 1997; Taylor et al., 2000), and (e) extent of connections to parents (Taylor et al., 2000; Taylor, Pearson, Clark, & Walpole, 1999; Taylor et al., 2005). However, the latter characteristic has been called into question. Results of a meta-analysis of comprehensive school reform efforts suggested that greater parental involvement in school governance and school improvement activities was surprisingly actually a negative predictor of student achievement (Borman et al., 2003).
Summary
In high-poverty schools, degree of structure of content delivery to children and degree of professional development support for teachers to learn new instructional structure and content may be pivotal, but perhaps competing, factors related to students’ reading growth. A greater content-delivery structure may mean less support for teacher learning or teacher autonomy. Research on degree of structure of content delivery is not plentiful, but some findings suggest that highly structured content delivery is effective, while others suggest that less structured delivery can positively impact student reading achievement. However, there is a paucity of research in which researchers have investigated a range of the degree to which content delivery is structured. The impact of degree of support for teachers’ professional development has been positive in some, but not all, settings investigated. Missing from the literature is an investigation of the extent to which a range of either of the two characteristics might interact with selected school characteristics for young children’s reading development.
Method
Design
Using a 2-year longitudinal design, data were collected at 16 schools in seven different school districts in one state. Children who began school in kindergarten, first, or second grade in Year 1 were followed into first, second, or third grade in Year 2. In Year 1, child measures were administered to random samples of approximately 25% of the children in each classroom in kindergarten through second grade. There were four categories of data sources: (a) reading assessments done at the beginning, middle, and end of each of the 2 years; (b) questionnaires completed by principals at the end of each of the 2 years; (c) sources that provided information about staff development and implementation of reading instruction; and (d) demographic information. Six reading variables were created from the reading assessments. Two variables were created from the staff development logs and school-based reading-instruction implementation plans. Eight variables were created from the principal questionnaire and demographic data and used as control variables. Statistical analyses were conducted as hierarchical linear models (HLMs).
Schools and Participants
Schools
Table A1 in the online supplementary material [http://jlr.sagepub.com/supplemental] provides detailed information about school and community demographics. Sizes of communities where the schools were located were extremely varied, and local economies varied across school communities. In some (Schools 1, 2, 6, and 12), mills and factories were at the center of the economies, with several closing within the past 50 years, severely affecting communities and contributing to high unemployment rates. One school community (3) was an inner-city school. Two schools (4 and 5) were located near military bases. Schools 7 and 8 were both located in a single community, which had higher poverty and unemployment rates than state average. Other communities (Schools 9, 10, 11, 13, 15, and 16) were predominantly rural, farming communities.
There was a wide range of school enrollments, and the samples for Schools 1 and 2 appeared the most diverse of the 16 schools. Latino presence was also notable in School 3, but no other school communities had more than 16% Latino students. At the time of data collection, the population of English language learners had experienced recent growth at Schools 1, 2, and 3. Conversely, the samples for some schools tended to be ethnically homogeneous. The sample for School 14 was 81% Caucasian of European descent, and the samples for Schools 3, 5, 8, 9, 10, 11, 12, and 16 were predominantly African American. Other school samples (e.g., 4, 6, 7, 13, and 15) were mixed ethnically.
As would be expected due to originating school selection as high-poverty schools, percentages of students receiving free or reduced lunch was high. At 14 of the 16 schools, the majority of parents had completed high school as their highest level of education (ranging from 54% at Schools 6 and 7 to 76% at School 11). Two schools had a majority of parents who had completed a 2- or 4-year degree as their highest level of education (56% at School 4 and 49% at School 14).
Participants
Participants included children and teachers, and data were also collected from principals and school-based literacy facilitators.
Children
In total, 957 children participated. There were 293 kindergarten students, 330 first-grade students, and 334 second-grade students who were followed into first, second, and third grades, respectively. Sixty-one percent (60.92%) of the students were African American, 23.51% were Caucasian of European descent, 7.84% were Latino, 1.04% were multiethnic, 0.31% were Asian, 0.21% were Native American, and for 6.17% of the sample, ethnicity was not reported. There were 459 females and 415 males, and there were missing gender data for 83 students. The majority of children (76.49%) received subsidized lunch. A small percentage of the children (7.21%) were classified as English language learners.
Teachers
In total, 262 teachers participated in the study across the 2 years. The majority (n = 254, 97%) was female, and there were 5 males. Gender was not identified for 3 teachers. Most (of the 259 self-reports) were Caucasian of European descent (62%), 34% were African American, 1% (n = 3) was Asian, 1% (n = 3) Latino, and less than 1% (n = 2) of another ethnicity. The group’s prior teaching experience was highly varied, ranging from no prior experience to 45 years, with a median and mean of 8 and 12 years, respectively. Most (90%) held a teaching license. The vast majority (76%) reported their highest degree as an undergraduate degree, only 20% reported having a master’s degree, and fewer than 1% reported having a 2-year degree as their highest degree.
Principals
Data were collected from 20 principals across the 2 years of the study. Four principals were replaced at the beginning of Year 2. Nine principals were female, and 11 were male. Seven were African American, 12 were Caucasian of European descent, and 1 did not report ethnicity. Principals’ prior teaching or administrative experiences were extremely varied, ranging from 4 to 38 years. The median was 22 years, and the mean was 20 years. All 20 principals held a state administrator’s license. Twelve held master’s degrees, 5 held educational specialist diplomas, and 3 held doctorates.
Literacy facilitators
Data were collected from 18 literacy facilitators. Each school had a full-time literacy facilitator whose responsibilities included oversight of the classroom reading-instruction reformation professional development activities, teaching reading to children in need of additional help, and administrative duties. Two literacy facilitators were replaced at Year 2. All literacy facilitators were female. Four literacy facilitators were African American, 13 were Caucasian of European descent, and one declined to provide ethnicity. Literacy facilitators were varied with respect to prior teaching experience, ranging from 1 to 32 years. The median was 14 years, and the mean was 15 years. All 18 literacy facilitators held a teaching license. Six literacy facilitators held an undergraduate degree, and 12 held a master’s degree.
What Happened for Professional Development?
Professional development occurred at two levels. A representative of the Department of Public Instruction organized staff development for the literacy facilitators, and the literacy facilitators oversaw staff development for the classroom teachers at their schools.
Literacy facilitator professional development
During each of the 2 years of our study, the literacy facilitators met with the state Department of Public Instruction reading representative as a group approximately once a month, usually for two consecutive days at each meeting. The state Department of Public Instruction reading representative kept session logs and agendas regarding topics, activities, and time spent on each. A review of the session logs and agendas indicated, across the 2 years, there were 23 sessions totaling approximately 217 contact hours, with approximately 12.8 hr spent on administrative issues related to the reform initiative and the remaining 204.2 hr on content for staff development. Major topics covered clearly reflected reading process and instruction domains—phonemic awareness, phonics, vocabulary, comprehension, and fluency. Topics covered, and approximate amounts of time in contact hours, could be categorized as follows:
How to teach reading (approximately 49.2 hr total across the following subgroups of topics)—writing (approximately 15.4 hr), phonics and phonological awareness (approximately 13.1 hr), comprehension (approximately 6.2 hr), vocabulary and language development (approximately 5.1 hr), fluency (approximately 4.8 hr), guided reading (approximately 2.6 hr), and reading strategies for good readers (approximately 2.0 hr).
How to plan and deliver staff development (approximately 42.6 hr, the bulk of which was in Year 1—34 hr).
Reading theory, development, and research (approximately 32.9 hr).
Literacy assessment (approximately 29.2 hr).
Reform initiative purposes and related administrative issues (approximately 22.9 hr).
Family literacy (approximately 9.0 hr).
Working with struggling readers (approximately 5.5 hr).
Classroom organization and management (approximately 5.4 hr).
Planning for summer school programs (approximately 4.0 hr).
Literacy centers (approximately 2.5 hr).
Effective teaching behaviors (approximately 1.0 hr).
The state Department of Public Instruction representative conducted most of the sessions herself. On four occasions, a guest presenter led the group. Means of conducting the sessions included discussion, lecture/presentation, “practicing” how to teach something or how to administer a test, role-playing, planning for professional development, and watching videos.
Classroom-teacher professional development
The total amount of time classroom teachers spent in professional development by school ranged approximately from 42.75 hr to 136.00 hr. As was required by the state Department of Public Instruction representative, topics paralleled those covered in the sessions that the state Department of Public Instruction reading representative conducted with the literacy facilitators. They included the following: (a) how to teach writing; (b) phonics and phonological awareness; (c) comprehension; (d) vocabulary and language development; (e) fluency; (f) words; (g) guided reading; (h) reading theory, development, and research; (i) literacy assessment; (j) purposes of the reform initiative; (k) classroom organization and management; (l) literacy centers; (m) reading with English language learners; (n) balanced literacy; and (o) and Four Blocks framework (a structured approach to teaching a balanced literacy curriculum; Cunningham, Hall, & Defee, 1998; http://www.wfu.edu/education/fourblocks/).
Formats for sessions were highly similar across the 16 schools, with each school using multiple formats, including lecture/presentation, discussion, “make and take” sessions, teacher “practice,” watching videos, watching demonstrations, discussing articles and books, and study groups. In a few instances, teachers attended reading conferences, and/or observed in other teachers’ classrooms. In general, the literacy facilitator led sessions, but on several occasions, sessions were led by other teachers or central office staff, the state Department of Public Instruction representative, an outside consultant, or publishing company representatives.
Data Sources, Variables, and Associated Reliability Estimates
There were four categories of data sources: (a) classroom, curriculum-based, child reading assessments; (b) a principal questionnaire; (c) staff development logs and school-based reading-instruction implementation plans; and (d) selected demographic information. Nine variables were created from the child reading assessments, principal questionnaire, and the staff development logs and school-based reading-instruction implementation plans. Reliability estimates were calculated for each of the nine variables. Eight additional variables were created from demographic information.
For the first three data-source sections that follow, the data source is first detailed, followed by a description of the variables created from that data source as well as the accompanying reliability estimates. For the section on demographic information, each of the variables is described.
Student reading assessments, validity, variables, and reliability
Four classroom, curriculum-based, child reading assessments were individually administered in a counterbalanced fashion during 3-week assessment periods at the beginning, middle, and end of each school year: (a) Oral Reading of Successively Difficult Passages (Bader & Weisendanger, 1994; Barr, Blachowicz, Katz, & Kaufman, 2002; Clay, 2002), (b) Basic Sight Vocabulary (Barr et al., 2002), (c) Hearing Sounds in Words (Clay, 2002; Johnston, 1992), and (d) Phonics Knowledge (adapted from Shefelbine, 1995). The reading assessments were selected with three factors in mind. We wanted to assess critical features of early reading development as supported by prior research, ensure use of assessments that have been widely used both in practice and in prior research, and represent authentic assessments that are typically used in school settings.
The data sources used to create the reading variables might be considered to have face validity, ecological validity, curricular validity, and/or population validity (Fitzgerald, Amendum, & Guthrie, 2008). In the present study, there is support for both face validity and ecological validity in that the student reading measures are commonly used in early grades classrooms, or are highly comparable with measures regularly used in kindergarten through second-grade classrooms. There is support for curricular validity in that the student reading measures reflect common reading performance and/or curricular aims for primary grades students and classrooms. Finally, in the present study there is support for population validity as the study sample is typical of students in many low-performing, high-poverty schools across the United States.
Six reading variables were created from the four reading assessments: Instructional Reading Level, Reading Words in Isolation, Phonological Awareness, Phonics Knowledge, Comprehension, and Fluency.
Classroom teachers at each school site conducted the reading assessments. One of the research study authors trained literacy facilitators, and the literacy facilitators at each school site trained classroom teachers. To assess faithfulness of assessment administration, one of the trained graduate research assistants from the research team was present for approximately 35% of assessment occasions. Agreements in scoring were then determined for the primary assessor with the graduate research assistant’s independent scoring of each assessment. Interrater agreements for faithfulness of assessment administration ranged from .83 to 1.00 across the six variables.
In addition, reliability estimates for each the six variables were determined in a traditional manner by randomly selecting 10% of children within classroom at each testing point and having a trained graduate research assistant score all assessments for those children. Reliability estimates were the proportions of times the research assistant agreed with the examiner. Reliability estimates for each variable are provided in each of the following sections.
Instructional Reading Level
For Oral Reading of Successively Difficult Passages (Bader & Weisendanger, 1994; Barr et al., 2002; Clay, 2002), students read aloud increasingly difficult graded texts from the Bader Reading and Language Inventory (Bader & Weisendanger, 1994), while the examiner recorded miscues on a separate copy of the passage (Barr et al., 2002; Clay, 2002). Using Clay’s (2002) method, Instructional Reading Level was the highest level at which the student read with at least 90% word recognition accuracy. A score of “0” indicated that a student did not pass even the lowest reading passage; 0.25 indicated approximately a preprimer level, which is, for typically developing students, achieved around the beginning of first grade; 0.50 indicated approximately a primer level, achieved by typically developing students around the middle of first grade, 1.00 indicated approximately end-of-first-grade level; 2.00 approximately second-grade level; and so on. The interrater reliability estimate for Instructional Reading Level was .86 for perfect agreement, and .95 within one reading level.
Reading Words in Isolation
On the Basic Sight Vocabulary (Barr et al., 2002) assessment, students were asked to look at five lists of words and pronounce them aloud. Lists were presented beginning with the list near the student’s current grade level. If more than two words were missed on a list, then a lower list (or lists) was read. A word was scored correct if the student pronounced it correctly in 3 seconds or less. Raw score was the number of words read correctly plus any unread words on lower lists (assuming that if students could read harder lists, they could also read lower lists). Possible raw scores ranged from 0 to 220 (the total number of words) and were converted to percent-correct scores. The Reading Words in Isolation score was the percentage of words read correctly. The interrater reliability estimate within 5 percentage points was .93.
Phonological Awareness
On the Hearing Sounds in Words (Clay, 2002; Johnston, 1992) assessment, the examiner slowly read a lengthy sentence containing 37 sounds. Students were asked to write what they heard. Each sound in a word was marked correct if any letter represented the target sound. Possible raw scores ranged from 0 to 37 and were converted to percent-correct scores. The Phonological Awareness score was the percentage of the 37 sounds represented. The interrater reliability estimate within 5 percentage points was .86.
Phonics Knowledge
On the 67-item Phonics Knowledge (adapted from Shefelbine, 1995) assessment, students looked at letters and letter combinations on lists while the examiner prompted with statements such as “Look at these letters, and tell me how they sound,” and “Tell me the long sounds of these letters.” Items included consonants, consonant digraphs, long and short vowels, consonant blends, r-controlled vowels, and common phonograms (e.g., -ad, -ame). Possible raw scores ranged from 0 to 67 and were converted to percent-correct scores. The Phonics Knowledge score was the percentage of items answered correctly. The interrater reliability estimate within 5 percentage points was .92.
Comprehension
Using the assessment, Oral Reading of Successively Difficult Passages (Bader & Weisendanger, 1994; Barr et al., 2002; Clay, 2002), for the instructional reading level passage, the examiner asked the comprehension questions listed in the Bader Reading and Language Inventory (Bader & Weisendanger, 1994). The Comprehension score was the percentage of correctly answered questions. The interrater reliability estimate within 5 percentage points was .83.
Fluency
Using the assessment, Oral Reading of Successively Difficult Passages (Bader & Weisendanger, 1994; Barr et al., 2002; Clay, 2002), for the instructional reading level passage, the examiner timed a child’s reading for 1 min, marking a line after the last word read during the minute (Deno, Fuchs, Marston, & Shin, 2001; Fuchs & Fuchs, 1989). The Fluency score was the number of words read correctly in 1 min. The interrater reliability estimate within 5 points was .95.
Principal questionnaire, variables, and reliability
A principal questionnaire (Fitzgerald, 2000) was individually administered to principals. Questionnaire items assessed principals’ perceptions of characteristics previously found to be associated with school effectiveness (Hoffman, 1991; Taylor et al., 2000; Taylor et al., 2005): (a) strength of school leadership, (b) degree of focus on improved student learning, (c) extent of staff collaboration, (d) extent of ongoing professional development, and (e) extent of school connections to parents. The principals selected responses from 1 (strongly disagree), 2 (disagree), 3 (agree), and 4 (strongly agree). Table A2 in the online supplementary material [http://jlr.sagepub.com/supplemental] shows questionnaire items for each of the five school characteristics.
The questionnaires were mailed to the principals at the end of Year 1 and Year 2. The return rate was 100%. One variable, School Characteristics Associated With Effectiveness, was created from the principal questionnaire. (In the following sections, the variable label School Characteristics Associated With Effectiveness will be shortened to School Effectiveness.) The procedure for creating the School Effectiveness variable was similar to ones used by Taylor and colleagues (2000) in prior research. For each school, questionnaire item responses for each school effectiveness characteristic were averaged and the School Effectiveness score was the average of the means. The alpha reliability coefficient for School Effectiveness was .89.
Staff development logs and school-based reading-instruction implementation plans, variables, and reliability
Literacy facilitators maintained staff development logs and turned them in at the end of Year 1 and Year 2. On the logs, they indicated the following: date of activity and who attended (e.g., first-grade teachers), type of activity (e.g., workshop, grade-level meeting), topic (the reason or purpose for the activity or what the teachers were supposed to learn), who conducted the activity, and how the activity was conducted (e.g., 30-min presentation followed by 15-min small-group discussions).
Prior to the 2 years of our study, each school administrator (a literacy facilitator and/or principal) wrote a school implementation reform plan describing the school-based reading-instruction implementation, which would be enacted at each school. For our study, two variables were created from the staff development logs and school implementation reform plans, Degree to Which Content Delivery to Children Was Structured and Degree to Which Teachers Were Supported in Learning the Instructional Structure and Content. (In the following sections, the variable label Degree to Which Content Delivery to Children Was Structured will be shortened to Degree of Structure, and the variable label Degree to Which Teachers Were Supported in Learning the Instructional Structure and Content will be shortened to Degree of Support.)
Degree of Structure
Degree of Structure was a 6-point scale (1 = very low structure, 2 = low structure, 3 = moderately low structure, 4 = moderately high structure, 5 = high structure, 6 = very high structure). The scale was based on two central issues: the extent to which there was a framework for content delivery and the degree to which reading-instructional activities were specified. Table 1 shows anchors according to each of the two central issues for the six levels on the scale. To create the variable, the first author read the staff development logs and school classroom-reading-instruction reform implementation documents, and using the anchors in Table 1, determined the scale level for each school. An example of high-structure delivery was one in which teachers were given scripts to use during reading lessons. An example of low-structure delivery was book floods with little or no explicit instruction. Interrater reliability between the first author and a graduate research assistant was .92.
Scale: Degree of Structure.

Fidelity of Degree of Structure implementation overview
To assess fidelity of degree of structure implementation, there were four steps: First, we observed students in four schools, two of which were rated “1” on Degree of Structure, very low structure, and two schools rated “5” or “6,” high or very high structure. In each of the schools, 2 first- and two second-grade teachers and 166 of their students were observed during reading instruction 3 times across each school year. Of the 16 teachers, 15 were female, and 1 was male. Ten were Caucasian of European descent, and 6 were African American. Their age ranged from 25 to 56 years, with an average of years 38. Prior teaching experience ranged from 2 to 35 years, with an average of 14 years. The majority had an undergraduate degree as highest degree, and 2 had a master’s degree. All of them held a state teaching license.
Second, the observations were coded and reliabilities of coding were obtained. Third, we considered what differences in observed practices would be expected in schools rated low in Degree of Structure versus those rated high. Fourth, we examined codes that were relevant to the expectations.
How observations were done
A trained graduate research assistant observer visited each classroom for 60 to 90 min each time at the beginning, middle, and end of the year. Observations were arranged in advance with the teachers. Teachers were told that an observer would watch their reading instruction to learn more about how they taught. Teachers were not told to do anything different for the observation. The observer followed a 4-min-on, 4-min-off cycle for taking notes. Each 4-min-on time was spent taking detailed, narrative accounts of what was happening in the classroom, including, where possible, what the teacher and children were saying. Audio recordings were also made for each session. Later, usually on the same day, observers reexamined their typed records, edited them, and modified them if they thought modifications would provide additional detail or context.
How coding was done for the observations and reliability of coding
Trained graduate research assistants coded the observations using a modified version of the scheme described by Taylor and colleagues (2000; Taylor & Pearson, 2000). First, from the typed narratives, segments of activities were identified. Second, the coder coded each segment with several detailed codes within three broad categories: (a) teacher interaction (e.g., teacher telling, teacher modeling, teacher coaching), (b) activity (e.g., words/letters instructional focus), and (c) material (e.g., connected text).
Two sets of interrater reliability coding estimates were obtained from the observation coding. First, the second author went to 16 classrooms in the four schools to observe along with the graduate research assistant. She completed the observation in the same manner as the graduate research assistant. The second author and the graduate research assistant independently coded their own narrative notes. Following Taylor and colleagues’ (2000; Taylor & Pearson, 2000) procedures, interrater reliability estimates were calculated for the three broad categories (teacher interaction, activity, and material). Interrater reliability estimates across the three categories were .78 for teacher interaction, .94 for activity, and .82 for material.
Second, 25% of the observed sessions from each time point were selected, excluding sessions where the second author participated as previously described. The second author worked from the observers’ narratives and recoded them, checking the proportion of times the graduate research assistant agreed with the second author. Interrater reliability estimates across the three categories were .87 for teacher interaction, .93 for activity, and .86 for material.
Expectations for differences between schools rated high versus low on Degree of Structure
To assess fidelity of the implementation in relation to the six levels of the variable, Degree of Structure, we examined the summary code sheets of the 4-min observation segments. We expected to see differences related to the two central dimensions for judging Degree of Structure from Table 1—the extent of a framework for content delivery, and the degree to which instructional activities were specified. Because “framework” and “specification of instructional activities” as criteria are not directly observable, we needed to look for observable manifestations of those criteria. Within the summary code sheets, we considered the instructional focus during the observations and the teachers’ interactions. We expected that for schools rated 5 or 6, we would see more manifestations of structured teaching with respect to instructional focus and teachers’ interactions as compared with schools rated 1 or 2. For instance, we might see teachers following practices encouraged in Four Blocks, such as an instructional focus where teachers conducted word study lessons and/or followed scripts provided by basal programs. With structured teaching, we also expected to see teacher interactions characterized by direct modeling of reading strategies for students. Conversely, for schools rated 1 or 2, we expected that we would see students engaged in wide reading and using more connected texts, rather than working on reading subprocess skills such as word study lessons. In addition, we expected that with respect to teacher interaction, less structured teaching might allow for movement around the classroom while students were engaged in wide reading and therefore teachers might engage in more coaching of students, rather than direct modeling.
Examined codes in relation to expectations
For each coded observation session, we calculated the total percentage of segments for which each of five codes (teacher telling, teacher modeling, teacher coaching, words/letters instructional focus, connected text) was present by dividing the number of segments in which each code appeared by the total number of segments. Then we calculated the mean percentage of teacher telling, teacher modeling, teacher coaching, words/letters instructional focus, and connected text across all segments and across all observation occasions for each school separately. We then compared the mean percentages of all the segments that were teacher telling, teacher modeling, words/letters instructional focus, and use of connected text for schools rated 1 versus schools rated 5 or 6.
Our expectations were supported. With respect to instructional focus, schools rated 5 or 6 had a greater words/letters instructional focus as compared with schools rated 1 (49.72% of coded segments vs. 31.08%), while schools rated 1 had a slightly greater focus on use of connected text (24.03% vs. 20.17%). For teacher interaction, in schools rated 5 or 6, we witnessed more teacher modeling (19.20% vs. 5.98%), while schools rated 1 used more teacher coaching (43.88% vs. 27.37%). Excerpts from observation narratives shown in Table A3 in the supplementary online material [http://jlr.sagepub.com/supplemental] are examples of differences across schools rated 1 versus 5 or 6, shown for instructional focus and teacher interaction.
Degree of Support
Degree of Support was a 6-point scale (1 = very low support, 2 = low support, 3 = moderately low support, 4 = moderately high support, 5 = high support, 6 = very high support). The scale was based on two central issues: the extent of related professional development sessions, and the extent of follow-up coaching or scaffolding. Table 2 shows anchors for each of the six levels. To create the variable, the first author read the school classroom-reading-instruction reform implementation documents and the staff development logs, and using the anchor descriptors (see Table 2) determined the scale level for each school. Interrater reliability between the first author and a graduate research assistant was .85.
Scale: Degree of Support.

Next, for each school, the total number of hours spent in staff development sessions was calculated based on the reported times from the staff development logs. Reported times included large-group professional development as well as follow-up times, typically conducted with grade-level teams. The average time spent in staff development sessions for schools where teachers received low or very low support was 60.00 hr. For schools where teachers received moderately low or moderately high support, the average time spent was 76.00 hr, and for schools where teachers received high or very high support, the average was 89.70 hr. The average number of sessions for low- or very low–support schools was 21. For moderately low- or moderately high–support schools, it was 39, and for high- or very high–support schools, it was 50.
Demographic data sources and variables
Selected demographic information was collected about the schools from the state Department of Public Instruction and about the students from each of the schools. Minority student segregation of 75% or greater has been negatively related to students’ reading achievement trajectories (Kainz & Vernon-Feagans, 2007), and a well-documented achievement gap between ethnic groups exists with minority students, on average, scoring lower than their peers (cf. Perie, Grigg, & Donahue, 2005). Consequently, it was important to capture aspects of such school and individual contexts as control variables in our analyses.
Eight variables were created from demographic information. Four were student-level variables: Grade, Student Poverty Status, African American, and Latino. Four were school-level variables: School Poverty Level, School Size, Percentage of African American Students, and Percentage of Latino Students.
Student-level variables
There were three Grade levels for students moving from kindergarten to first grade, first to second grade, and from second to third grade. Student Poverty Status had two levels: low poverty, represented by students paying full price for lunch, or high poverty, represented by students receiving subsidized lunch (cf. Perie et al., 2005). Two variables were included to represent individual student’s minority status—whether a student was African American, and whether a student was Latino (cf. Perie et al., 2005).
School-level variables
School Poverty Level represented the concentration of poverty at each individual school and was the schoolwide percentage of students receiving subsidized lunch (cf. Sutton & Soderstrom, 1999). School Size was the total school enrollment at each school (V. E. Lee & Smith, 1997). Two variables were included to represent each school’s concentration of minority students (Kainz & Vernon-Feagans, 2007). Percentage of African American Students was the percentage of students from the total school enrollment who were African American (Sutton & Soderstrom, 1999). Percentage of Latino Students was the percentage of students from the total school enrollment who were Latino (Sutton & Soderstrom, 1999).
Results
Overview of Analyses
The main interests in the analyses were the relationships between the two aspects of the reading-instruction reform (Degree of Structure and Degree of Support) and students’ reading growth across 2 years. Six sets of HLMs were used to address the two research questions simultaneously in each set of models. That is, all six sets of models had the same predictor variables, interaction terms, and control variables, and only the outcome variables, that is, only the variable to assess reading growth (e.g., Instructional Reading Level vs. Reading Words in Isolation, etc.), differed across the models.
Predictor and control variables in each of the six model sets
At the school level, the following predictor variables were used: Degree of Structure, and Degree of Support (derived from the staff development logs and school-based reading-instruction implementation plans). Four school-level control variables were added: School Effectiveness (derived from the principal questionnaire), School Poverty Level, Percentage of African American Students, and Percentage of Latino Students (from the demographic data sources). In addition, two school-level interaction terms were also added: the Degree of Structure by School Effectiveness interaction and the Degree of Support by School Effectiveness interaction.
Five student-level control variables were used: Grade, African American, Latino, Student Poverty Status (from the demographic data sources), and for the Comprehension and Fluency models only, End-of-Year-2 Instructional Reading Level (from the student reading assessments). End-of-Year-2 Instructional Reading Level was used to account for variation in Comprehension and Fluency related to students’ Instructional Reading Level.
Outcome variables differed, one for each model set
A conceptual progression of six outcome variables, a different outcome variable for each of six sets of models, characterized students’ reading growth. Instructional Reading Level was the outcome variable in the first set of models and was used to examine students’ overall reading achievement growth. Remaining models examined students’ reading subprocesses’ growth. Word- and sound-level reading subprocesses were the outcome variables in the second, third, and fourth sets of models, comprising Reading Words in Isolation (Model 2), Phonological Awareness (Model 3), and Phonics Knowledge (Model 4). The reading subprocesses of Comprehension (Model 5) and Fluency (Model 6) were the outcome variables in the fifth and sixth sets of models, respectively.
HLM modeling sequence
All six sets of statistical models had in each set three-level HLMs with time (six repeated measures, three time points in each of the 2 years) nested within students nested within schools. A model-building strategy (Raudenbush & Bryk, 2002) was used in each set of analyses and is described for each model next. For each of the six sets of models, the stages for the analytic sequence were the same. First, an unconditional model with no predictor or control variables was run to estimate variance in initial status (intercept) and growth slope. If significant variance was found in the unconditional model, a conditional model was run next to explain variation. In the conditional model predictor variables, interaction terms and control variables were added to the model to determine if each accounted for significant variation.
In each set of models, all noncategorical variables were standardized (M = 0, SD = 1) to allow for a comparison of coefficients in standard deviation units (e.g., Xue & Meisels, 2004). The metric also allowed for a comparison of effect coefficients across HLM models. Because all variables were standardized, standardized regression coefficients were estimated in each of the full models and were also interpreted as effect sizes of association, or the proportion of a standard deviation change in the outcome associated with a full standard deviation change in the predictor, controlling for all other variables in the model.
Preliminary Analyses
Prior to the main analyses, a preliminary examination of the data was completed to provide a context for the interpretation of results. Table 3 shows unadjusted means and standard deviations for the six outcome variables for each time point and the school-level predictor variables, as well as adjusted means for Comprehension and Fluency to account for differences in students’ instructional reading levels. In addition, Table 3 shows means and standard deviations for the school-level predictor variables—Degree of Structure and Degree of Support.
Outcome Variable Means (SDs) for All Six Outcome Variables, Adjusted Means (SEs) for Comprehension and Fluency, and School-Level Predictor Variable Means (SDs).

Note. For Instructional Reading Level scores, a score of “0” indicated that a student did not pass even the lowest reading passage, 0.25 indicated approximately a preprimer level, 0.50 indicated approximately a primer level, 1.00 indicated approximately end-of-first-grade level, 2.00 approximately second-grade level, and so on. Scores for Reading Words in Isolation, Phonological Awareness, Phonics Knowledge, and Comprehension were all percent-correct scores. Fluency scores were number of words read correctly in 1 min.
Table 3 reveals, as would be expected, unadjusted mean scores for Instructional Reading Level, Reading Words in Isolation, Phonological Awareness, Phonics Knowledge, and Fluency increased over time. On average, students made remarkable progress in Instructional Reading Level, beginning at Time 1 with a mean score of 0.94 (near first-grade level) and ending at Time 6 with a mean score of 4.49 (beyond fourth-grade level). Students also made good progress in Reading Words in Isolation, on average improving from 32.45% at Time 1 to 86.78% at Time 6. Students made impressive growth in Phonological Awareness as well, and means appeared to approach ceiling (M = 98.24%) by Time 6, which is expected for students’ Phonological Awareness by the end of second grade. On average, students’ Phonics Knowledge grew from 57.79% at Time 1 to 85.22% at Time 6.
Unadjusted Comprehension mean scores declined slightly over time—likely because of the higher text levels students read at the later time points. Mean Instructional Reading Level at Time 6 was 4.49, which was 1.5 grade levels higher than students’ highest grade level in the sample. However, when Comprehension means were computed controlling for Instructional Reading Level, the adjusted Comprehension mean at Time 1 was 77.29% and the adjusted mean at Time 6 was 86.18% (see Table 3). At each of the six time points, the adjusted Comprehension means were, on average, greater than 75%, indicating a high level of Comprehension when controlling for Instructional Reading Level.
Students made positive growth in unadjusted Fluency mean scores, on average, reading 57.25 words correct per minute at Time 1 and 70.45 words correct per minute at Time 6, which compares favorably with the Spring reading fluency norms for students at the 50th percentile in reading fluency in the first (53 words correct per minute), second (89 words correct per minute), and third (107 words correct per minute) grade (Hasbrouck & Tindal, 2006). When Fluency means were computed controlling for Instructional Reading Level, the adjusted Fluency mean score at Time 1 was 44.07 words correct per minute, and the adjusted Fluency mean score at Time 6 was 54.42 words correct per minute.
Table 3 shows means and standard deviations for the school-level predictor variables. The degree to which the content delivery to children was structured ranged from implementations with no framework for reading-instruction and no-reading-instruction activities suggested to implementations with highly structured frameworks for reading-instruction and daily scripted reading-instruction activities. The mean for Degree of Structure was 3.81, most closely representing a moderately high structure that included a framework for reading instruction and suggestions for daily reading-instruction activities. The degree to which teachers were supported in learning the instructional structure and content ranged from very low support with few one-time unrelated workshops and no follow-up coaching or scaffolding sessions to implementations with very high support with ongoing related staff development with continuing follow-up coaching or scaffolding sessions. The mean for Degree of Support was 3.62 that most closely represented moderately high support that included a moderate number of related staff development sessions with a moderate amount of follow-up coaching or scaffolding sessions.
Next, for each outcome, an unconditional model, with no predictor or control variables, was run to estimate variance. For Instructional Reading Level, Reading Words in Isolation, Phonological Awareness, Phonics Knowledge, and Fluency models, both the intercept and growth slope varied significantly among schools. For the Comprehension model, only intercept varied significantly among schools. Table A4 in the supplementary online material [http://jlr.sagepub.com/supplemental] shows the unconditional model results for each outcome. Unconditional models indicated significant variation among schools for each outcome, and subsequent conditional models were run with predictor and control variables to account for variation. In the case of each outcome, the model fit index suggested that the inclusion of the predictor and control variables improved the fit to the data when compared with the unconditional model, with χ2(df) = 381.084(22), 640.101(22), 618.536(22), 385.026(22), 354.946(9), 354.743(24), respectively, and p < .001, for all outcomes, indicating that the predictors and controls explained variation and should be retained in each model.
Instructional Reading Level Growth (Model Set 1)
As we provide results, readers may find Table 4, an overview and summary of results for all six outcomes, useful. Notably, the control variables were not of interest and were inserted into the models to reduce error variance. Therefore, significant results for relationships between control variables and outcomes are not presented. However, control variable coefficients and standard errors are presented in tables (referenced in the next sections for each outcome). Results from the conditional model are presented in Table 5.
Summary of Significant Results for Variables Related to the Two Features (Significant Coefficients for Intercept and Slope).

Note. *p < .05. **p < .01. ***p < .001.
Final HLM Results for Instructional Reading Level.

Note. For all conditional models, % variance = unconditional model variance − conditional model variance/unconditional model variance. Significant SE(β) values are in bold. HLM = hierarchical linear model.
p < .05. **p < .01. ***p < .001.
We now explain the conclusion. Figure 2 was created to aid interpretation of the significant interaction. Mean growth lines on the graph represent four different combinations of Degree of Structure and School Effectiveness: (a) low degree of structure, high school effectiveness; (b) low degree of structure, low school effectiveness; (c) high degree of structure, high school effectiveness; and (d) high degree of structure, low school effectiveness. Lines on the graph are predicted as “best fit” from the standardized Instructional Reading Levels. The scores at the six time points are not the actual standardized Instructional Reading Level means; instead the lines represent the predicted growth lines for each combination based on the HLM equations.

Degree of Structure by School Effectiveness interaction for instructional reading levels across six time points.
There were no statistically significant differences in schools at the outset. That is, there were no differences for initial predicted standardized Instructional Reading Level, with adjusted mean standardized Instructional Reading Levels ranging from −0.74 to −0.94. However, Figure 2 shows that after approximately 4 months of implementing the reformed reading instruction (by Time point 2), on average, students from all schools were on an approximately even par. Then over the remaining months, children’s growth in the high-structure school settings continued to slow as compared with children’s growth in other schools. In the long run, students who made the greatest Instructional Reading Level gains received reading instruction through low-structure content delivery, whether they were in schools with greater degrees of school effectiveness or not. These were school settings that provided no framework for daily instruction, tended to primarily use instruction such as “book floods” and/or wide reading, and tended to have suggested some minimal reading-instruction activities. Students who made the least gains received reading instruction through high-structure content delivery, whether they were in schools with greater degrees of school effectiveness or not. Students who made the least Instructional Reading Level growth across the 2 years were from schools that used highly structured frameworks for reading instruction, including scripted daily reading-instruction lessons. At the end of 2 years, the two groups of students pictured in Figure 2 who experienced low-structure content delivery had projected standardized Instructional Reading Levels means of .68 and 1.00, whereas the two groups of students who experienced high-structure delivery were projected to reach only −.02 and .29 levels.
In addition, Figure 2 helps us to understand that schools’ tendency toward having more or fewer characteristics associated with school effectiveness moderated the content-delivery structure effect. If we look only at the two groups who made the most growth—those in the low-structure settings—we see that being in a school with more school effectiveness characteristics was an advantage over being in schools with fewer such characteristics. Similarly, if we look at the two groups who made the least growth—those in the high-structure settings—we see the same modulating effect of being in schools with more school effectiveness characteristics.
We now explain the conclusion. Figure 3 was created in a similar way to Figure 2. We see a parallel result to the prior interaction. There were no statistically significant differences in initial predicted standardized Instructional Reading Level at outset, with mean-adjusted standardized Instructional Reading Levels ranging from −.79 to −.89. After approximately 4 months (by Time point 2), children’s progress in high-support schools began to accelerate past children’s progress in low-support schools, regardless of whether children were in schools with greater school effectiveness. In the long run, students who made the greatest Instructional Reading Level gains, on average, had teachers who participated in more staff development sessions and had more exposure to postsession coaching. Conversely, students who made the least gains, on average, had teachers who participated in fewer sessions with less postsession coaching. At the end of 2 years, the two groups of students with the greatest projected means, on average, had predicted adjusted standardized Instructional Reading Level means of .58 and .89, while the others had projected means, on average, of .07 and .39.

Degree of support by School Effectiveness interaction for Instructional Reading Level across six time points.
Again, Figure 3 helps us to understand that the extent to which schools that had more school effectiveness characteristics modulated the impact of the degree of support for teachers. Surprisingly, in high-support settings (the top two growth groups), there was no added value of having more school effectiveness characteristics. However, in low-support settings, there was added value in being in schools with greater school effectiveness.
Follow-Up Models (Model Sets 2, 3, and 4) to Examine Word- and Sound-Level Growth
We now explain the conclusion. Results from the conditional model are presented in Table 6. There was a significant effect of Degree of Structure for the Phonics Knowledge intercept (β = −.59, t7 = −3.70, p = .013) and growth slope (β = .067, t7 = 2.45, p = .049). Figure 4 demonstrates the relationship in a similar way to the previous figures. Mean growth lines on the graph represent settings with lower (averaged lower quartile of standardized Degree of Structure scores) and higher (averaged upper quartile of standardized Degree of Structure scores) structures, after controlling for other variables in the model.
Final HLM Results for Phonics Knowledge.
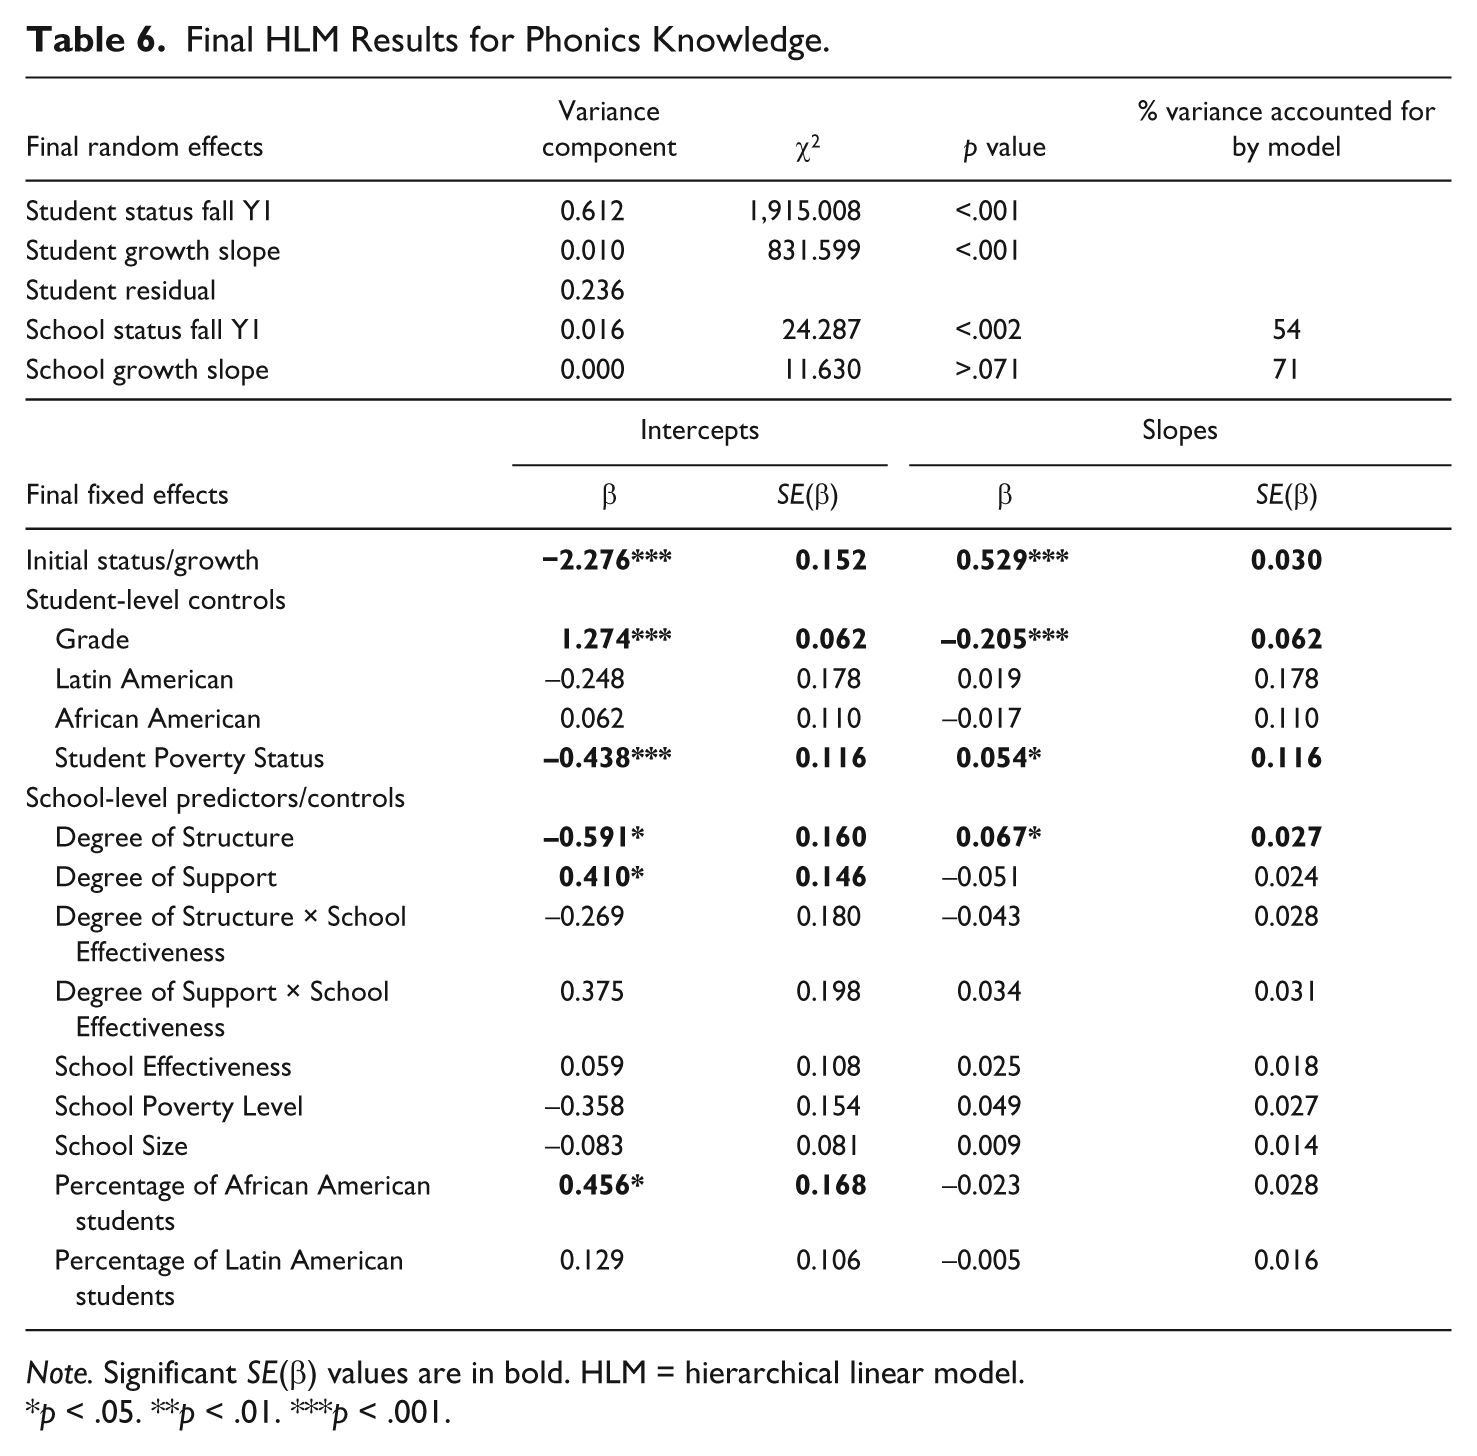
Note. Significant SE(β) values are in bold. HLM = hierarchical linear model.
p < .05. **p < .01. ***p < .001.

Phonics Knowledge growth lines across all six time points by Degree of Structure.
Figure 4 shows that students from schools with higher Degrees of Structure, on average, began Year 1 with significantly lower predicted standardized Phonics Knowledge scores (−.05) than those with lower Degrees of Structure (.09). Initially, when controlling for other variables in the model, for every one standard deviation increase in the Degree of Structure, there was a .59 standard deviation decrease in the Phonics Knowledge intercept (from the overall intercept of −2.28). Moreover, across the 2 years, students from schools with more structured content delivery made more Phonics Knowledge growth than those from schools with less structured content delivery. When controlling for other variables in the model, for every one standard deviation increase in the Degree of Structure, there was a .07 standard deviation increase in the Phonics Knowledge slope (from the overall slope of .53). Although the gap between the two groups was closing, students who received more structured content delivery (predicted adjusted standardized mean = .26) did not catch up with their peers (predicted adjusted standardized mean = .89).
Conclusions and Discussion
Conclusions
First, students who made the greatest Instructional Reading Level growth were in schools with less structured content delivery, but there was added value to less structure when students were also in schools with higher levels of school effectiveness.
Second, students who made the greatest Instructional Reading Level growth were in schools with higher support for teachers, but the degree of support for teachers was also tempered by the level of school effectiveness. Surprisingly, for students in high-support settings, there was no added value of being in schools with greater school effectiveness. However, in low-support settings, student growth was positively impacted if students were also in schools with higher levels of school effectiveness.
Third, neither degree of structure of content delivery nor degree of support for teachers was significantly related to growth in the reading subprocess outcomes, except for Phonics Knowledge. Only degree of structure for content delivery was related to students’ Phonics Knowledge growth. Students who made the most Phonics Knowledge growth were from schools where a higher content-delivery structure was used. However, by the end of the 2 years, these students did not catch up with their initially higher performing counterparts who received low-structure content delivery.
Limitations
Prior to a discussion of the main conclusions, it is important to consider limitations of the study. First, two of the school-level variables were created from literacy facilitator or principal self-report logs or questionnaires. Self-report sources are sometimes criticized as biased (Chan, 2008). However, researchers have documented that claims of bias in self-reports are often overstated (Chan, 2008; Spector, 2006). In the case of Degree of Structure, triangulation through direct observation provided evidence to support the veracity of the staff development logs and school classroom-reading-instruction reform implementation documents. Unfortunately, without direct researcher observation or other data collection, it is difficult to know the extent of bias represented in the other self-reports in our study.
Second, no standardized measures of achievement were used. Although examining curriculum-based measures reveals considerable insight into students’ progress in relation to typical curriculum and classroom facets of learning to read, a question remains as to what student growth might look like using norm-referenced indicators.
Finally, two issues related to the research design might be considered limitations to the study. Ideally, our design and HLM analysis would have allowed us to account for students’ nesting within classrooms. However, students changed teachers from Year 1 to Year 2, midway through the study, making the classroom level difficult to model. In addition, limited resources allowed us to follow 25% of the students from each classroom. It is difficult to know the impact of following a greater percentage of students from each classroom and school.
Discussion
Preliminary comments
Notably, students made significant Instructional Reading Level and subprocess growth across the 2 years. On average, they made 3.65 Instructional Reading Levels gain. As the Instructional Reading Level variable was based primarily on word recognition accuracy in context, such a feat suggests that, on average, students had learned word recognition strategies in context extremely well. Average gains for Reading Words in Isolation, Phonological Awareness, Phonics Knowledge, Comprehension, and Fluency were substantial—54.33 percentage points, 38.31 percentage points, 27.43 percentage points, 9.89 percentage points controlled for Instructional Reading Level, and 13.20 percentage points controlled for Instructional Reading Level, respectively.
Degree of Structure and Instructional Reading Level growth
Students who made the greatest gains received low-structure content delivery, but there was added value of also being in schools with more school effectiveness characteristics. The finding may add fuel to the current debate about highly structured content delivery. The result provides support to critics of highly structured deliveries. On one hand, our result flies in the face of an evidence base that documents the beneficial effects of highly structured programs in high-poverty, challenging situations. One difference between prior studies and the present study is that, on the whole, prior findings have arisen from studies of comprehensive schoolwide reforms that are directed at several factors of school change, while there was one focus of change in our study—classroom reading instruction.
On the other hand, our results are tangentially consistent with results of the U.S. Department of Education Institute of Education Sciences report of the Reading First (U.S. Department of Education, 2002) program effects (Institute of Education Sciences, 2008). Highly structured instruction was a hallmark of Reading First implementation. However, based on a large-scale study of 248 schools in 13 states, researchers concluded that children in schools receiving Reading First funding had virtually no better reading skills than those in schools that did not get the funding.
Being in schools with more school effectiveness characteristics brought added value to the degree of structure for content delivery. We have known from prior research that school contexts matter for student achievement. However, to our knowledge, we have not known before that such school effectiveness characteristics have the potential of “boosting” reading growth in relation to the degree of structure for content delivery. Perhaps teachers in schools with more school effectiveness characteristics feel greater support and encouragement to learn and apply effective research-based practices as well as to make professional decisions about reading instruction.
Degree of Teacher Support and Instructional Reading Level growth
Unsurprisingly, children who were in schools where teachers had higher level support for professional development made more Instructional Reading Level gains than others, but the degree of support for teachers was mitigated by the incidence of school effectiveness characteristics. Our study result is consistent with a considerable body of research that supports the contention that teachers are the most influential in-school factor for student achievement (e.g., Sanders & Rivers, 1996). Reading researchers (e.g., Cooter, 2003) have pointed out that building teachers’ capacity to make instructional decisions may be a more effective way to positively impact students’ overall reading achievement rather than investing in programs or basal readers per se—programs in which instructional decisions have already been made for teachers (e.g., Adams et al., 2002).
The finding is also consistent with some prior research in challenging school settings where reforms judged to be most effective included strong professional development components (cf. Borman et al., 2005; Muncy & McQuillan, 1996; Nunnery, 1998; Taylor et al., 2005). In high-poverty schools, high levels of teacher support may facilitate teachers’ autonomy and professionalism, encouraging them to reflect and grow.
However, it was surprising to learn that being in schools with more school effectiveness characteristics only added value in low-support settings. For students in such schools, the result is extremely heartening, as it appears possible that improving teacher support for learning may help to overcome a difficult schoolwide situation, such as weak school leadership or less focus on student learning, among other factors.
Degree of Structure and Degree of Support: Subprocesses
We turn now to the result that neither degree of structure of content delivery nor degree of support for teachers was significantly related to reading subprocess growth except for Phonics Knowledge. One might assume that as each feature was associated with Instructional Reading Level growth (though tempered by the extent to which schools had characteristics associated with effectiveness), at least one of the two features, if not both, would be related to most, if not all, of the subprocesses. Our collective findings here are similar to some prior results with struggling readers in which differential relationships emerged for overall reading achievement as compared with selected reading subprocess results (e.g., Torgesen et al., 2007). The result suggests the possibility that greater degree of content-delivery structure may be particularly important for learning phonics, as compared with other word- and sound-level aspects of reading. Learning to read words in isolation and developing phonological awareness may be acquired equally effectively with more or less content-delivery structure.
Other implications
An additional implication is that the differential mediating impact of school effectiveness characteristics and specific reading growth variables might be further specified. While in general it may be worthwhile for school personnel to build characteristics associated with effectiveness, it should not be done with the belief that there will be a wholesale impact on multiple facets of children’s reading. Our results suggest that the potential impact of such school characteristics is not straightforward. Rather, the implementation of at least some facets of reading-instruction reform can be quite complicated—with sometimes surprising interactions of implementation features and degree to which schools have those characteristics associated with greater effectiveness. While being in schools that had more characteristics associated with effectiveness often boosted the impact of an implementation feature, it did not consistently do so.
Another implication is that it appears worthwhile for school personnel to provide serious and extended professional support to teachers, but it should not be done with the belief that it will have an impact on all facets of children’s reading. Our results again suggest a complicated finding in which being in schools that had characteristics associated with effectiveness tempered the impact of teacher professional development support. At the same time, a high level of teacher support may be especially important for students in schools with few characteristics associated with effectiveness.
To the best of our knowledge, our study is one of the first to longitudinally investigate relationships among two key characteristics of reading-instruction implementation in high-poverty, low-achieving schools—degree of structure of content delivery and degree of support for teachers’ learning—for young children’s reading growth. Future research that investigates similar relationships would help us to better understand whether the results of the current study are stable.
We also point to the methodology used in the present study—multilevel modeling which not only enabled us control for numerous individual and school factors but also enhanced our ability to understand potential complexities that might exist between key variables and reading growth. For future research, use of such models that help us to account for considerable complexity could be beneficial. The greater the modeling capacity to analyze and account for as much complexity as possible, the better are our chances of recommending features of reading instruction that will make surer differences in children’s reading growth.
Our study also has policy implications. First, for high-poverty, low-achieving schools, policy makers might consider encouraging low-structure reading content delivery along with investing in the highest-level support for teachers to learn about reading instruction. Both recommendations, and particularly the former one, may seem like heretical recommendations in our current policy arena—given that under Reading First, we witnessed increased restrictions for what features of reading are taught, how reading instruction happens, and how reading is assessed.
As we stated at the outset, we weren’t studying school reform per se, nor did we investigate a wide array of complexities involved in professional development. Future research might use the kind of design and methodology used in the present study but should additionally broaden to a wider context so as to include more attributes of reform efforts or professional development.
Our results may also help to set a stage for future researchers to probe what kind of teacher support matters the most for children’s reading growth. As we examined “support,” we considered both amount of time and numbers of sessions teachers spent in professional development and the degree to which teachers were scaffolded and coached as they learned. Although we cannot directly attribute our results to both dimensions, until future research sorts out such attribution, we suggest the possibility that both dimensions of support may be critical. Meanwhile, at the least, it seems important for policy makers to consider the multidimensionality of teacher support and to encourage future research on its dimensions.
Footnotes
Declaration of Conflicting Interests
The author(s) declared no potential conflicts of interest with respect to the research, authorship, and/or publication of this article.
Funding
The author(s) received no financial support for the research, authorship, and/or publication of this article.
Author Biographies
References
Supplementary Material
Please find the following supplemental material available below.
For Open Access articles published under a Creative Commons License, all supplemental material carries the same license as the article it is associated with.
For non-Open Access articles published, all supplemental material carries a non-exclusive license, and permission requests for re-use of supplemental material or any part of supplemental material shall be sent directly to the copyright owner as specified in the copyright notice associated with the article.
