
Abstract
This study analyzed the current state of the gender literacy gap and the change in the gender literacy gap between 1992 and 2003, using the 1992 National Adult Literacy Survey (NALS) and the 2003 National Assessment of Adult Literacy (NAAL). The results revealed that although there were significant gender literacy gaps in 1992, virtually all male-paramount literacy gaps (males obtaining higher scores than females) disappeared in the 2003 survey. Much of this gain can be ascribed to more women participating in higher education. Variations in literacy gap changes by race (Black and White) and educational attainment were also investigated.
The gender literacy gap refers to the historically higher literacy levels of males relative to females (Goldin, 1990). There are many likely factors that influence the adult gender literacy gap, including social inequality (e.g., Stromquist, 1990). There are reasons to believe that the adult gender literacy levels in the United States are diminishing. For example, today women are more likely than men to graduate from high school and college (Freeman, 2004). Unfortunately, it is unclear how this change in educational demographics has affected the adult gender literacy gap because much of the data available on gender literacy levels use student samples. The current study addresses gender differences among a nationally representative sample of adults in verbal and mathematical literacy measured by the National Assessment of Adult Literacy (NAAL).
From 1900 to 1930, females and males attended college in equal numbers until two important historical events intervened. First, the Great Depression of the 1930s led more employers to either implement or strengthen “marriage bars” and “pregnancy bars,” which subjected women of that era to a disincentive to higher education (Goldin, 1990). “Marriage bars” and “pregnancy bars,” rules and practices that prohibited hiring or retaining of married women and/or pregnant women, existed before the Great Depression but began to spread because high unemployment led to a general gender-biased public policy that favored male employment (Goldin, 1990). The rationale was that a married woman’s husband should be employed and she shouldn’t compete for a man’s job or promotion. At their height, just after World War II, marriage bars were in effect in 75% of school systems and 50% of offices (Goldin, Katz, & Kuziemko, 2006). At the time, 90% of White women married and the average woman’s age when she married was just 22 years (Goldin et al., 2006). The marriage bars together with the high prevalence of marriage in young women provided little economic justification for women and their parents to pay for or attend college.
Second, many men received a tremendous boost to their higher educational attainment with the implementation of the original GI Bill in 1944, which helped to pay for the education of returning World War II veterans (Goldin et al., 2006). According to the Department of Veterans Affairs, 47% of all college admissions in 1957 were veterans taking advantage of the GI Bill. When the original GI Bill ended in 1956, about half of the 16 million World War II veterans had been assisted with their education (U.S. Department of Veterans Affairs, 2008). Because only 2% of veterans were female (Campbell, 1987), the GI Bill almost exclusively increased males’ educational attainment. Together, the GI Bill, marriage bars, and pregnancy bars influenced the male to female ratio at college overwhelmingly in favor of men in the 1930s, 1940s, and 1950s.
Marriage bars were virtually abandoned by 1960 (Goldin, 1990), and the original GI Bill ended in 1956 (U.S. Department of Veterans Affairs, 2008). These changes opened the door for women to increase in college attendance. Beginning in 1960, women increased their college attendance relative to that of men (Goldin et al., 2006). By then, not only were gender-biased incentives and disincentives no longer in effect, but also the women’s movement and economic advances in the 1960s and 1970s had led women to expect economic returns for their increased educational attainment. In fact, longitudinal surveys of cohorts of graduating high school seniors show that women graduating in 1992 were much more likely than women graduating in 1957 to plan on attending college and having a career (Goldin et al., 2006).
These historical changes in educational attainment likely had an important impact on the adult gender literacy gap. The results of the National Adult Literacy Survey (NALS) indicate that for those older than 60, men outperformed women on all literacy scales, prose, document, and quantitative in 1992 (Brown, Prisuta, Jacobs, & Campbell, 1996). It is interesting that, though 10% of males aged 60 to 69 scored at the highest levels of proficiency, 4 and 5, on the prose scale, only 5% of females aged 60 to 69 reached that score. On the document scale, 6% of males achieved the highest level of proficiency, but only 2% of females did. Finally, on the quantitative scale, 16% of males and 7% of females aged 60 to 69 achieved the highest level of proficiency (Brown et al., 1996).
Most research assessing the gender literacy gap has focused on student performance and educational attainment. Although student data cannot speak directly to the adult gender literacy gap without the addition of many (often unspecified) assumptions, research has shown that educational attainment is the best predictor of adult literacy (e.g., Park & Kyei, 2011). Student performance data support the hypothesis that the gender gap is closing, especially in reading (Freeman, 2004). Results from the National Assessment of Educational Progress show that in the 12th grade, female students were outperforming male students in reading by a wider margin in 2005 than in 1992. Although males still outperformed females on the overall mathematics scale in 2005, when the scale is divided into content area, the pattern of male dominance only remains for two of the four areas: number properties and operations, and measurement and geometry (Grigg, Donahue, & Dion, 2007). Similarly, data from the Program for International Student Assessment (PISA) show that 15-year-old females in all participating Organisation for Economic Co-operation and Development (OECD) countries that published scores outperformed males in reading. 1 In mathematics, males outperformed females in most participating OECD countries (Fleischman, Hopstock, Pelczar, & Shelley, 2010). In 2005, Black females in the 12th grade scored higher than Black males in reading, and there was no difference in scores in mathematics (Grigg et al., 2007). Similar to the trends in reading and mathematics scores, more Black females enroll in higher education than Black males, whereas White men and women enroll in college at similar rates.
In sum, historical policies have affected the gender educational attainment gap, which is diminishing. The diminishing of the gender educational attainment gap appears to have influenced the closing of the literacy gap among students and younger adults shown in recent studies. Much of the data available on gender literacy differences today use student samples. Although these data support a decrease in the gender literacy gap among student samples, they do not inform discussions on the widely varied adult population of the United States.
The current study investigates the gender gap among U.S.-born adults by analyzing large-scale, national data from the 1992 NALS and the 2003 NAAL. Both assessments measure adult literacy on three scales: prose literacy, document literacy, and quantitative literacy. Here, we assess (a) whether the size of the gender literacy gap changed from 1992 to 2003 (for the population as a whole and by race—Black and White) and (b) if changes occurred, we examine the source of those changes, with a specific emphasis on how they relate to educational attainment. Findings from this study have implications for future research and policy addressing female participation in education, gender-related income disparities, poverty, family literacy, and health literacy.
Method
Data for this study were drawn from the 2003 NAAL and 1992 National NALS. This section provides a brief description of the NAAL and the NALS as well as the statistical methods for the current study. Additional details, such as data collection procedures and scoring, about the two assessments can be found in their technical reports: Kirsch et al. (2001) and Baldi et al. (2009).
Overview of NAAL and NALS
Participants
The 2003 assessment was administered to a nationally representative sample of 19,714 adults ages 16 and older residing in households or prisons. The household sample consisted of 18,541 respondents. The household and prison samples were combined to create a national sample representative of American adults in households or prisons. Data were collected between May 2003 and July 2004.
The 1992 assessment was administered to a nationally representative sample of more than 26,000 adults ages 16 and older residing in households or prisons. The household sample consisted of about 24,900 respondents. The household and prison samples were combined to create a national sample representative of American adults in households or prisons. Data were collected in the first 9 months of 1992.
For comparability among respondents of the two surveys, all analyses in the present article were limited to those who were born in the United States, for two reasons. First, the U.S.-born population is generally exposed to English during the critical language learning ages. Second, the foreign-born population may vary a lot among itself regarding language backgrounds and thus differ too much from the U.S.-born population for the two to be examined together. The analytic sample consisted of 16,158 NAAL respondents and 23,002 NALS respondents. In 1992, 52% were females; 82% were White and 11% were Black. In 2003, 52% were females; 79% were White and 12% were Black in 2003.
Instrument
The NAAL consists of 152 tasks and the NALS consists of 165 tasks that were drawn from texts and documents commonly encountered by the U.S. adult population (e.g., actual newspaper articles, employment forms, etc.). Of the tasks, 65 were identical in both the 1992 and the 2003 assessments. The remaining tasks were developed specifically for each assessment.
Both NALS and NAAL measured adult literacy of English on three scales: prose, document, and quantitative. Technical manuals published by the NCES define prose literacy as the knowledge and skills needed to search, comprehend, and use continuous texts such as editorials and instructional materials. Document literacy is defined as the knowledge and skills needed to search, comprehend, and use noncontinuous texts in various formats such as transportation schedules, job applications, payroll forms, maps, tables, and drug or food labels. Finally, quantitative literacy is defined as the knowledge and skills required to identify and perform computations using numbers embedded in printed materials such as one would do when balancing a checkbook, computing a tip, completing an order form, or determining the amount of interest on a loan from an advertisement (White & Dillow, 2005). In short, quantitative literacy can be conceptualized as any mathematical operation on numbers embedded in narrative or document displays.
The three literacy scales were developed from research suggesting that one’s demonstrated literacy depends not only on general literacy ability but also on the one’s knowledge of the passage content or familiarity with the method of materials presentation (Kirsch & Mosenthal, 1990). Though some have found discriminant validity to be a problem because of significant interscale correlations (Reder, 1998), there is strong statistical justification for three scales, rather than one general literacy scale (Rock & Yamamoto, 2001).
Statistical Analysis Strategy
To address the research questions, two-tailed t tests were performed at the alpha level of .05 to detect the significant differences between male and female adults.
2
The formula used to compute the t statistic is
All analyses were based on weighted data adjusted for nonresponse and unequal probability of selection because of the complex sampling design used in 1992 NALS and 2003 NAAL. Only statistically significant results are discussed in this article. To facilitate interpretation of the data, estimates of mean literacy scores are presented in figures. Their standard errors can be found in the appendix.
Results
Figure 1 presents the quantitative, prose, and document literacy levels of males and females for the U.S.-born population on the NAAL and the NALS. In 1992, male adults outperformed female adults on quantitative literacy (M = 287 for males, M = 271 for females) and document literacy (M = 277 for males, M = 271 for females). Males’ and females’ prose literacy scores were equal in 1992. In 2003, male adults scored higher than females on average only on quantitative literacy (M = 291 for males, M = 284 for females), and by a significantly narrower margin in 2003 than in 1992 (7 points vs. 15 points). It is interesting that in 2003, a significant female-paramount performance gap emerged for document literacy, where there had been a male-paramount performance gap in 1992. Furthermore, a significant female-paramount performance gap emerged for prose literacy, though previously genders did not differ on this scale.
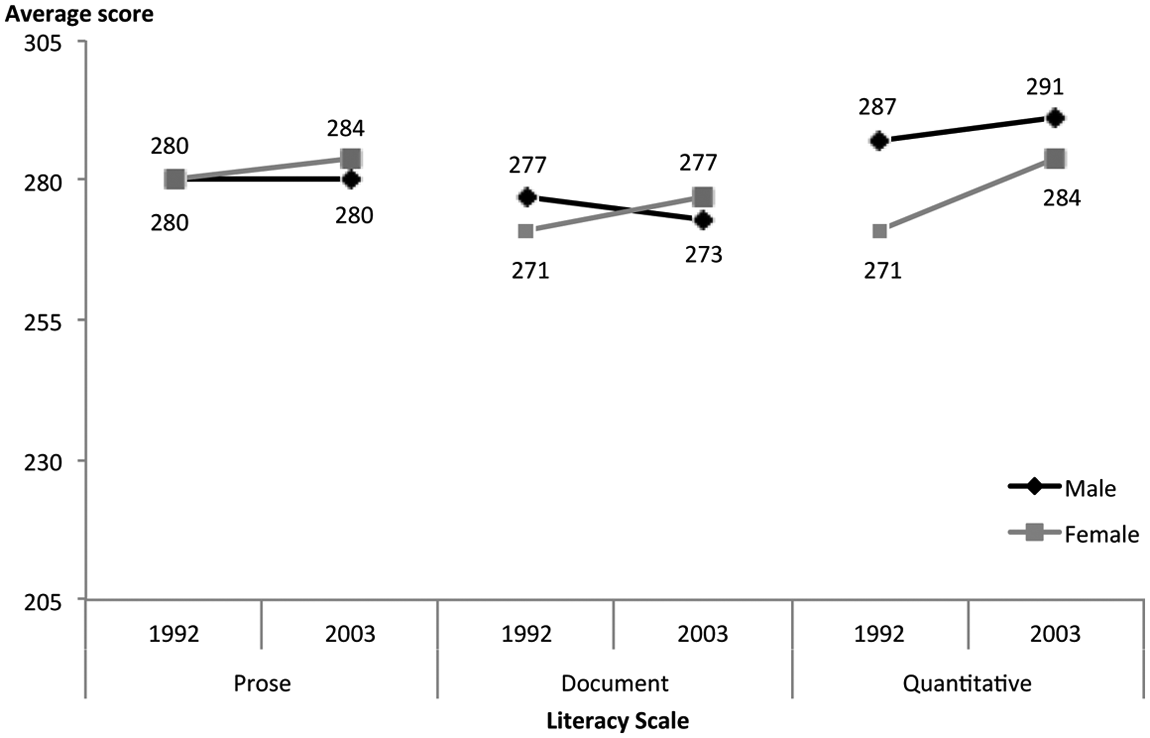
Literacy scores of males and females for the U.S.-born adult population from the 1992 NALS and 2003 NAAL
The narrowing of the male-paramount performance gap in quantitative literacy and the occurrence of a female-paramount gap in the other two literacy scales were almost exclusively results of improved literacy performance of the female population. That is, female adults scored significantly higher in all three literacy areas in 2003 than in 1992. In contrast, male adults scored significantly higher only in quantitative literacy, and their score increase was smaller than the increase in females’ score.
Changes in Literacy Performance Between 1992 and 2003: Black/White Gender Literacy Gap
Figures 2 and 3 present prose, document, and quantitative literacy average scores of NALS and NAAL by gender for the U.S.-born Black and White adult populations, respectively. With regard to the race performance gap, Whites performed significantly better than Blacks on all literacy scales across gender for both the 1992 and 2003 assessments (D. J. Cohen, White, & Cohen, 2012). However, for men the Black/White performance gaps decreased significantly on all three literacy scales in 2003 compared to 1992.
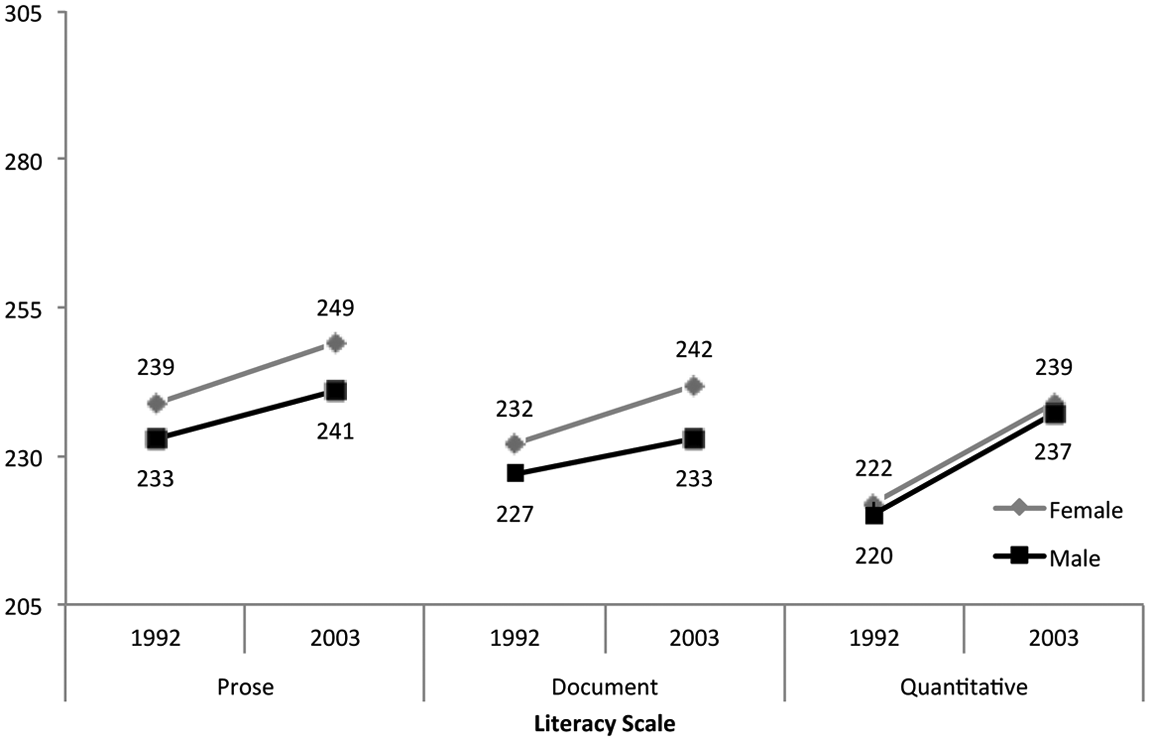
Prose, document, and quantitative literacy of U.S.-born Black male and Black female adults for the 1992 NALS and the 2003 NAAL
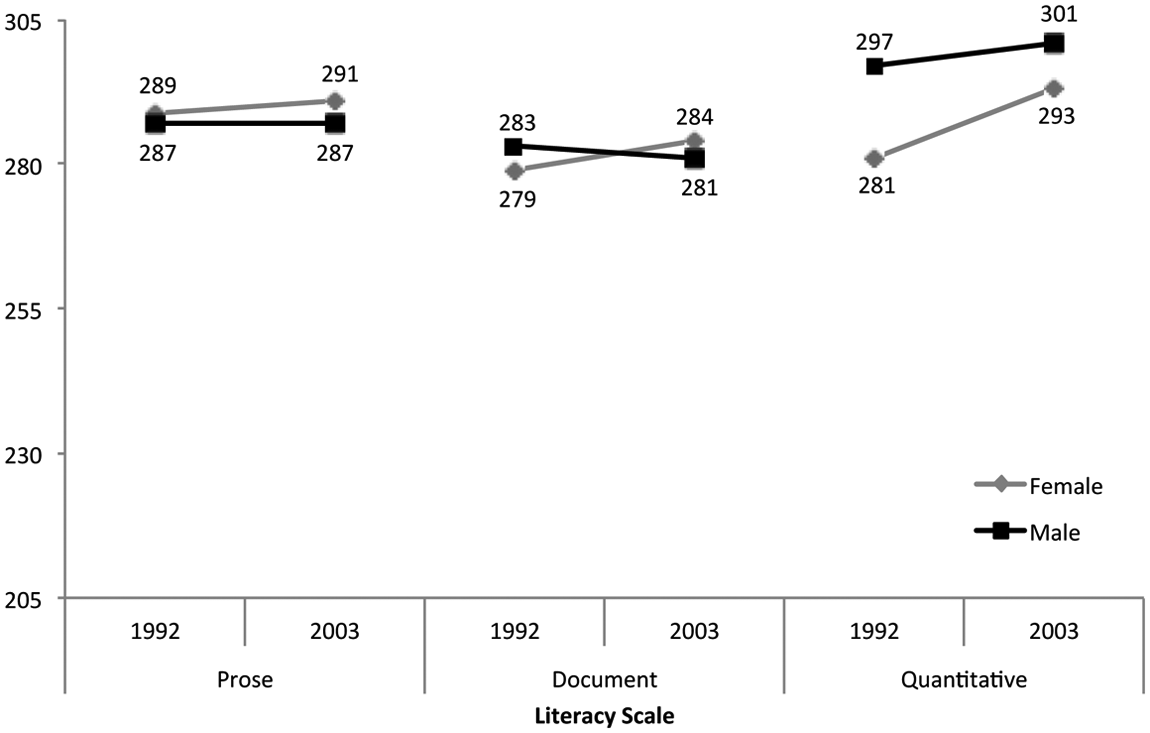
Prose, document, and quantitative literacy of U.S.-born White male and White female adults for the 1992 NALS and the 2003 NAAL
Comparing Black adults by gender, Black females performed significantly better than Black males on the prose and document literacy scales in 1992 and in 2003; thus, in these two areas there is actually a female-paramount gender gap in both assessment years. For quantitative literacy, there was no gender difference for Black adults in 2003 or in 1992. In addition, Black females significantly improved their scores on all three literacy scales in 2003 compared to 1992 and Black males significantly improved their scores on quantitative and prose literacy but not document literacy. Overall, the gap patterns in the three literacy areas in 2003 remained the same as in 1992 for Black adults.
Comparing White adults by gender, in 1992 White males scored significantly higher than White females in quantitative and document literacy, but there was no difference in prose literacy, as shown in Figure 3. In 2003, White males scored significantly higher than White females only in quantitative literacy. Furthermore, though both White females’ and White males’ scores increased in 2003 for quantitative literacy, the average quantitative score for White males was 4 points higher in 2003 than in 1992 and the score for White females was 12 points higher, resulting in a significant narrowing of the gap in quantitative literacy between the two groups.
In addition, the previously significant male-paramount gap in document literacy in 1992 disappeared in 2003. Instead, the direction of the performance gap for document literacy reversed, as White females outperformed White males in 2003, though not to a significant degree.
In contrast, the average prose literacy scores of White males remained unchanged in 2003 compared to 1992. Though White females’ increase in prose literacy scores from 1992 to 2003 was not significant, the increase was sufficient to result in a significant increase in the female-paramount performance gap for prose literacy in 2003 compared to 1992.
In sum, for White adults in 2003, females improved their scores on all three scales whereas males’ performance was mixed. This increase contributed to the significant decrease in the male-paramount performance gaps for document and quantitative literacy and the significant increase in the female-paramount performance gap in prose literacy. In addition, for Black adults we observed a significant female-paramount performance gap for Black women on the prose and document literacy scales in 1992 and 2003. Furthermore, there were no changes to the performance gaps for Black adults, mainly because both genders improved their scores.
Changes in Literacy Performance Between 1992 and 2003: Gender by Educational Attainment
To explore why the gender performance gap is closing, we focus on two possible reasons: First, the gender performance gap may be closing because women are performing at higher literacy levels within each level of educational attainment; second, the gender performance gap may be closing because more women are attaining higher levels of education. To assess the first possibility, we analyzed the gender performance gaps by educational attainment for the 2003 and the 1992 assessments. Figures 4, 5, and 6 present the literacy estimates of males and females on the prose, document, and quantitative literacy scales by educational attainment for the 2003 and 1992 assessments.
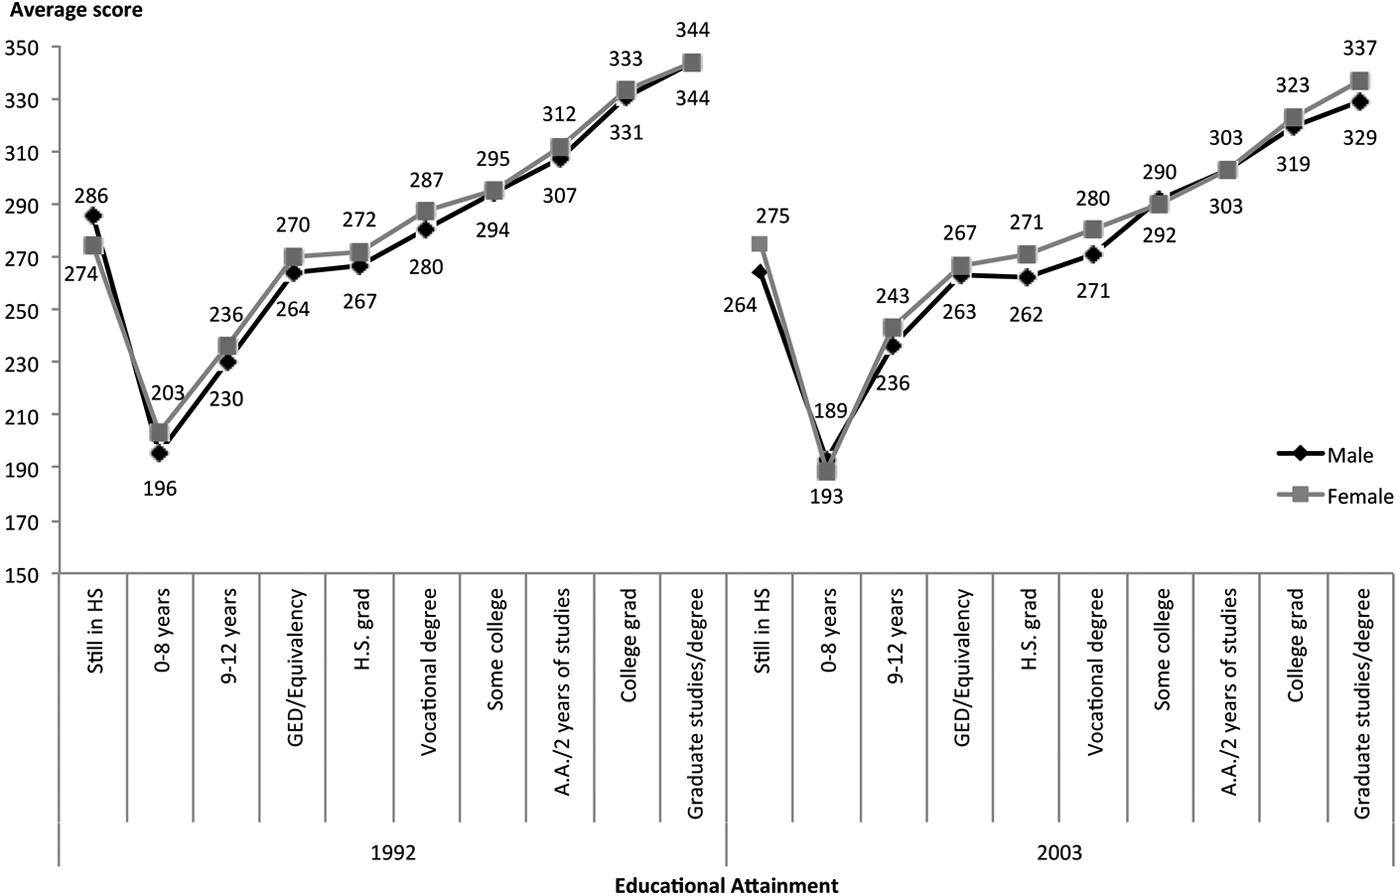
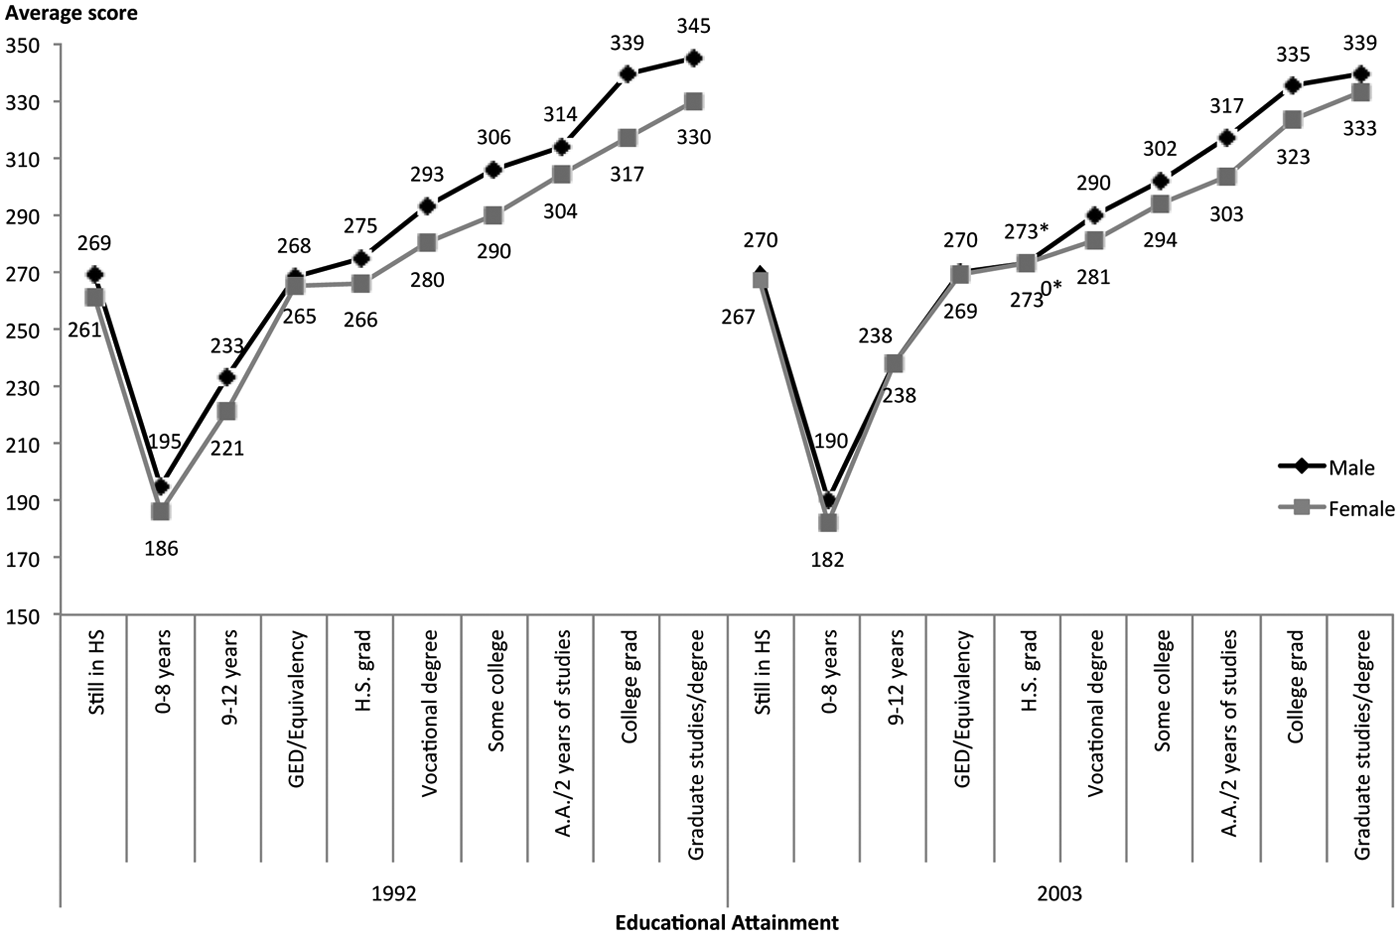
Prose literacy estimates for U.S.-born male and female adults across levels of educational attainment for the 1992 NALS and the 2003 NAAL
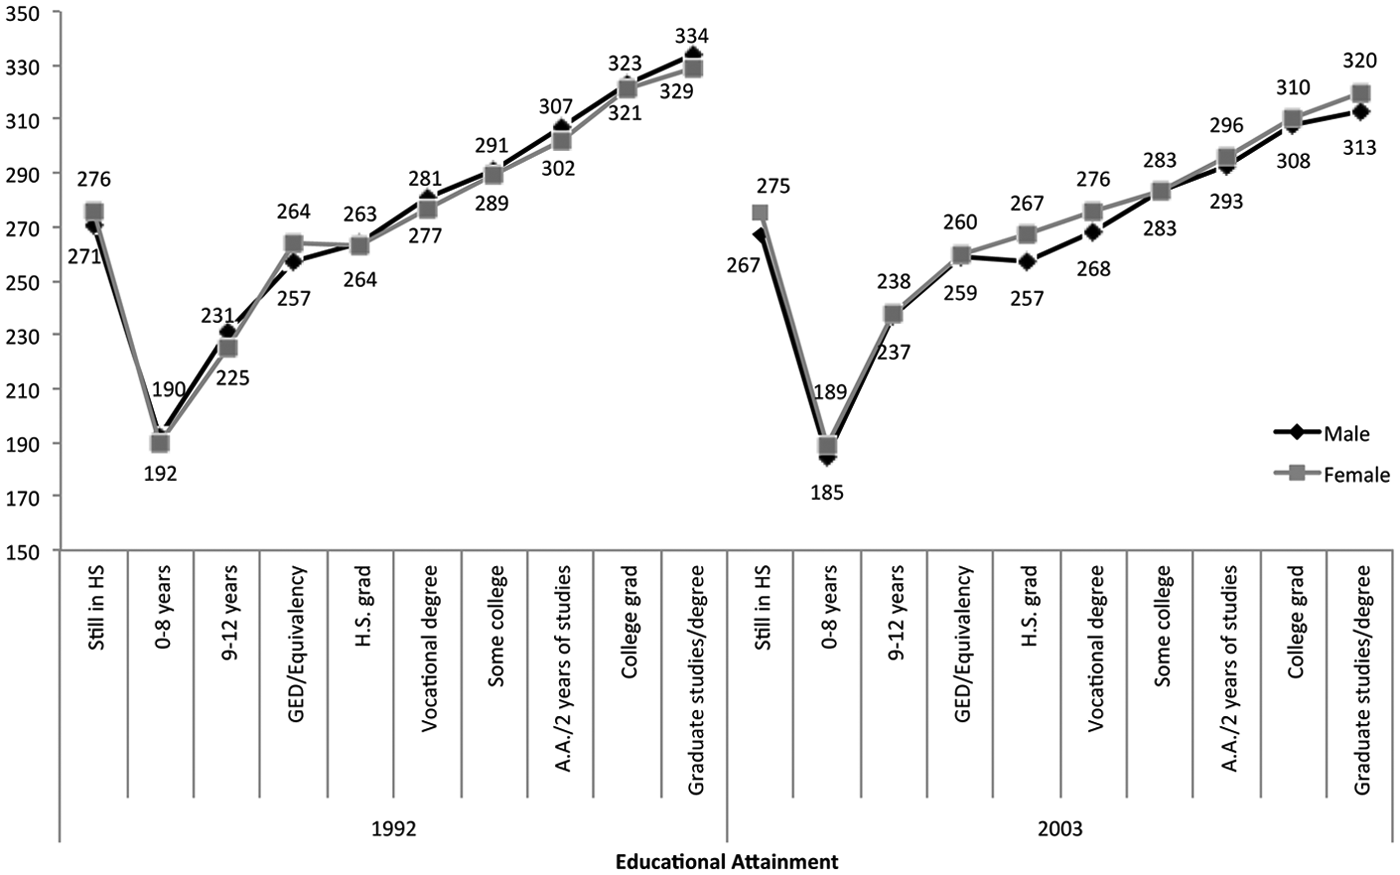
Document literacy estimates for U.S.-born male and female adults across levels of educational attainment for the 1992 NALS and the 2003 NAAL
Quantitative literacy estimates for U.S.-born male and female adults across levels of educational attainment for the 1992 NALS and the 2003 NAAL
For prose literacy (see Figure 4), between 1992 and 2003 only one group, females with 9 to 12 years of education, significantly improved their scores. Instead, both genders showed either no change or significant decreases at some levels of educational attainment. Females’ performance significantly declined on the prose literacy scale at three levels of educational attainment: (a) vocational degree, (b) associate’s degree or 2 years of college studies, and (c) college graduate. Males’ performance significantly declined at three levels of educational attainment as well, but not the same ones in which females declined: (a) high school diploma, (b) college graduate, and (c) graduate studies or degree. This difference did not lead to any change in gap patterns. In fact, with regard to the gender performance gap, there was only one significant case for both years. Specifically, females with a high school diploma outperformed their male counterparts. The size of the gender performance gap in prose literacy did not significantly change between 1992 and 2003 for this educational attainment level.
For document literacy (see Figure 5), between 1992 and 2003, only one group showed a significant improvement in scores between 1992 and 2003, females with 9 to 12 years of educational attainment. Scores for males and females with some college or a college degree significantly decreased in 2003 compared to 1992. Males with the following educational attainment levels also showed significantly decreased scores: high school diploma, vocational degree, associate’s degree or 2 years of college, and graduate studies or degree. With regard to the gender performance gap for those with a high school diploma, there was not a gender gap in 1992, whereas females outperformed males in 2003.
For quantitative (see Figure 6) literacy, females with a high school diploma and those with 9 to 12 years of education significantly increased their scores in 2003 compared to 1992. Females at other educational attainment levels showed no change in scores between 1992 and 2003, as did males of all educational attainment levels. Because males’ scores did not change during that time, this significant score increase by females with 9 to 12 years of education or a high school diploma led to a significant narrowing of the gender gap for these educational attainment levels. Though in 1992 there was a male-paramount performance gap for 9 to 12 years of education, high school diploma, and vocational degree, this gap had disappeared in 2003. Furthermore, even though men with a college degree outperformed women with equal education in 1992 and 2003, the margin of the performance gap for this educational attainment level significantly narrowed over that time.
To summarize, females with 9 to 12 years of education significantly increased their scores on all three literacy scales, and females with high school diplomas increased their scores on quantitative literacy. Males within educational attainment groups did not increase their scores on any literacy scale between 1992 and 2003. Although they remained stable in quantitative literacy, males showed significant decreases in document literacy at both the higher and lower levels of educational attainment. In addition, both genders showed significant decreases in prose literacy at higher and lower levels of educational attainment. In 1992 male adults outperformed female adults on the quantitative scale for 7 levels of educational attainment, but in 2003 the gap was significant for only three levels of educational attainment. Females with high school diplomas outperformed their male counterparts in document literacy in 2003 and in prose literacy in both 1992 and 2003.
The results concerning literacy level changes within educational attainment category are somewhat mixed. There were some sporadic performance gains by females with high school education or less, but otherwise there were no significant increases in literacy within educational attainment groups between 1992 and 2003. This suggests that the robust performance gains by women exhibited earlier are not the result of women having overall higher levels of literacy within educational attainment levels but rather the result of more women achieving higher educational attainment levels. To assess this possibility, we examined the population changes in each educational attainment category between 1992 and 2003.
Changes in Educational Attainment Within Gender Between 1992 and 2003
Figure 7 presents the proportion of the male and female population across highest levels of educational attainment on the 2003 NAAL and the 1992 NALS. In 2003 the proportion of males and females increased significantly in two important levels compared to 1992, some college and college degree. In addition, the proportion of females with an associate’s degree or 2 years of studies and graduate studies or degree also increased significantly in 2003 compared to 1992. Also, a significantly lower proportion of females had just 0 to 8 or just 9 to 12 years of education in 2003 compared to 1992. Together, these data indicate that females, and to a lesser extent males, had attained higher levels of education in 2003 than in 1992.
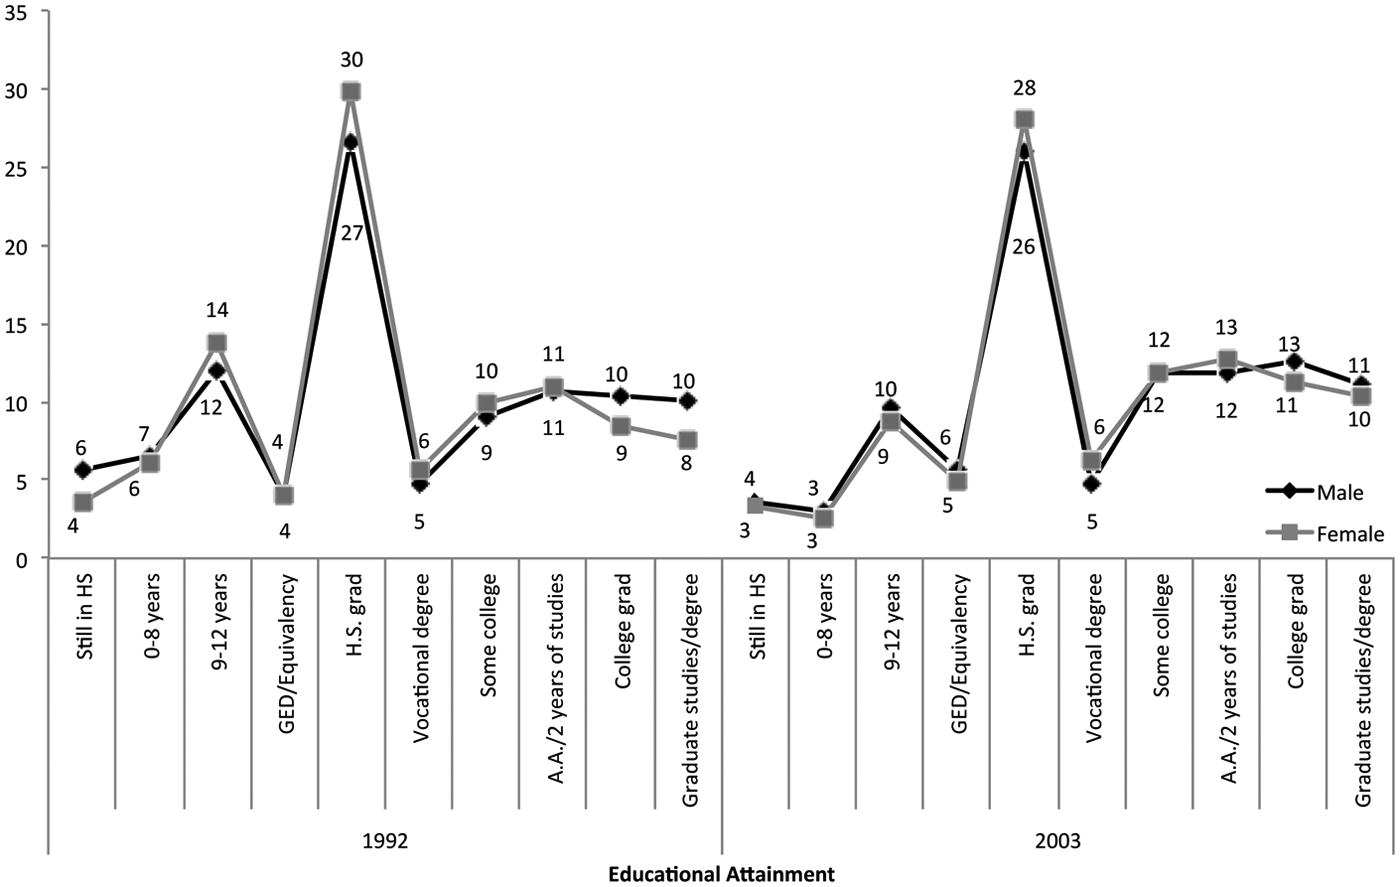
Proportion of U.S.-born male and female adults with various levels of educational attainment in 1992 NALS and 2003 NAAL
With regard to the educational attainment gap, in 1992 the proportion of males who were college graduates or had graduate studies or degrees was significantly higher than the proportion of females who had attained those levels of education; however, in 2003 the gap no longer existed, and males and females attained these educational attainment levels at equal proportions. In addition, in 1992 women were overrepresented in the lower educational attainment levels; namely, the proportion of females with 9 to 12 years of education or high school diploma was significantly higher than the proportion of males who achieved these levels of educational attainment. In 2003, the overrepresentation disappeared. Notably, in both 1992 and 2003 the proportion of females with a vocational degree was higher than the proportion of males achieving this level of educational attainment.
Discussion
This study presents data on quantitative, prose, and document literacy by gender from the 1992 NALS and the 2003 NAAL. The data reveal significant gains by females in prose, document, and quantitative literacy between 1992 and 2003. Specifically, in 2003 there emerged for the first time, a significant female dominance in both prose and document literacy. Furthermore, there emerged a significant reduction in the traditional male dominance in quantitative literacy. These data support the hypothesis that the U.S. male-paramount adult gender literacy gap is virtually extinguished. Because the NAAL and NALS use large national samples, it was possible to examine within-race gender differences to find deviations from the overall pattern for White and Black adults. First, the significant female-paramount advantage that emerged in 2003 on the overall prose and document literacy scales was evident for Black females even in 1992. Black females performed significantly better than Black males in 1992 and in 2003 in these areas, whereas White females did not exhibit the overall female-paramount pattern in document and prose literacy. Instead, White females and males performed similar to each other in 2003. Second, though overall males scored significantly higher than females in 1992 and 2003 in quantitative literacy, there was no gender difference for Black adults on this scale in either year. However, White males scored significantly higher than White females in quantitative literacy in 1992 and in 2003, which is consistent with the overall pattern. These data point to the importance of future research to further address how gender differences vary between groups of different racial/ethnic or socioeconomic categories.
The present data are striking because they reveal the reduction or elimination of previous male-dominated gender literacy gaps among adults. The gains on the NAAL in 2003 by women appear to be the result of overall higher educational attainment by women. Specifically, more women in 2003 attained significantly higher levels of educational attainment than in 1992. In addition, because literacy scores within most educational attainment groups did not change significantly in 2003 compared to 1992, the literacy increases we observed for women are not the result of overall higher literacy within educational attainment groups.
Other studies document the increased higher educational attainment of women relative to men in recent years. Indeed, some have termed the phenomenon “the new gender gap” (Goldin et al., 2006). Today women not only are more likely than men to graduate high school, but also are more likely to graduate college than men (Freeman, 2004). This statement is true both for Black females and for White females when compared to their within-race male peers (Coley, 2001). In fact, in 2001, women earned 57% of college degrees (Freeman, 2004). In addition, in 2000, women earned 59% of master’s degrees (Freeman, 2004). Even in traditionally male-dominated fields, females have increased in number. For example, in 2000, females earned 47% of the college degrees in mathematics (Chipman, 2005). This equalizing of educational achievement in mathematics could lead to a further closing of the NAAL quantitative literacy gap in the future.
It is important that gender achievement gaps emerge from the performance of both males and females. The present data provide much evidence for the increased achievement of females. In contrast, whereas there was some increased achievement by males, males’ performance was more likely to remain stable or occasionally decrease (e.g., document literacy) than that of females. These data may point to a new concern—the emerging female-paramount gender gap.
Today’s “new gender gap” began in the 1980s, when women began to outnumber men in college (Conlin, 2003; Goldin et al., 2006). However, women began increasing their college attendance relative to men in the 1960s, and they gained momentum in the 1970s. Finally, in 1980 females and males attended college in equal numbers (Goldin et al., 2006). When our data are viewed within the context of these data, as well as the historical data presented in the introduction, it becomes clear that changes in the educational attainment demographics (and the policies influencing these changes) are likely having a direct impact on the adult gender literacy gap.
Implications
Findings from this study have implications for developing policies, programs, and initiatives that are focused on female participation in education, narrowing gender pay inequity and other socioeconomic outcomes. Our results show that in 2003, relative to 1992, (a) men and women who were born in the United States have more similar literacy levels and (b) more women who were born in the United States are graduating from institutions of higher education. Recent studies of educational achievement have even shown that women today are earning more bachelor’s and master’s degrees than are men (Freeman, 2004; Peter & Horn, 2005). Despite these educational equalities, U.S. women still obtain work in different types of jobs and at lower rates of pay than do men (Levine, 2004; Peter & Horn, 2005; U.S. Department of Labor, 2009). International comparative studies have shown that the poverty gap between men and women in the United States, in relation to those of other developed Western nations, is highest. In fact, U.S. mothers, married and single, are among the most likely to earn poverty wages compared to mothers in other Western countries (Christopher, England, Smeeding, & Phillips, 2002). Within the United States, 41% of the difference between female and male poverty rates can be explained by the higher proportions of women in the three lowest wage occupations as listed by the U.S. Bureau of Labor Statistics (Christopher, 2002; Lichtenwalter, 2005). Furthermore, recent meta-analyses of international student assessments have discovered that the gender gap in mathematics performance is smaller in countries where women are employed at the same rate as men in science fields and in national government (Else-Quest, Hyde, & Linn, 2010). Therefore, the results of this study, which show women increasing and in some cases outperforming men in their prose, document, and quantitative literacy as well as educational attainment, can be used as evidence for policies supporting greater pay equity between these two groups. Increased female income would have significant effects on the socioeconomic status of struggling families, many of which are led by single mothers.
In addition, mothers are commonly regarded as a child’s first teacher, and studies have found that parents’ propensity to read with their children varies depending on literacy, race, and educational attainment, among other factors (Darling, 2004; Kutner et al., 2007; White & Dillow, 2005). So evidence of increased female literacy and educational attainment could also inform research and policy focused on family literacy initiatives.
Finally, our data point to an emerging “female-paramount” gender literacy gap. It is just as important to identify as to address the causes of this female-paramount gender gap as a male-paramount gender gap. We therefore urge literacy researchers to explore this new gender gap as well.
Limitations
The current study is the first to use two large-scale assessment data sets to examine changes in the U.S.-born adult gender literacy gap. One limitation is that it did not probe demographic changes between 1992 and 2003. Besides changes in educational attainment, potential changes in distributions of age, race/ethnicity, income, and so forth for the male and the female populations could also have contributed to changes in literacy proficiencies. Further research needs to focus on these variables.
Footnotes
Appendix
Declaration of Conflicting Interests
The author(s) declared no potential conflicts of interest with respect to the research, authorship, and/or publication of this article.
Funding
The author(s) disclosed receipt of the following financial support for the research, authorship, and/or publication of this article: This research was funded by a subcontract with the National Center for Education Statistics, an arm of the Institute for Education Sciences. This publication is intended to promote the exchange of ideas among researchers and policy makers. The views expressed in it are those of the author and do not necessarily reflect the position of the U.S. Department of Education.
Notes
Bios
References
Supplementary Material
Please find the following supplemental material available below.
For Open Access articles published under a Creative Commons License, all supplemental material carries the same license as the article it is associated with.
For non-Open Access articles published, all supplemental material carries a non-exclusive license, and permission requests for re-use of supplemental material or any part of supplemental material shall be sent directly to the copyright owner as specified in the copyright notice associated with the article.