
Abstract
Historically, Whites have scored higher than Blacks on most measures of literacy (referred to as the Black-White literacy gap). The authors outline the historic social inequities that contributed to the Black-White literacy gap as well as the current school and home environment that may maintain it. They then examine the current state of the Black-White literacy gap using data from the primary instrument that the U.S. Department of Education uses to assess adult literacy: the 1992 National Assessment of Literacy Survey and the 2003 National Assessment of Adult Literacy. Their analysis shows that (a) the adult Black-White literacy gap decreased between 1992 and 2003, although is still sizable; (b) Blacks and Whites garner equal gains from advancing in educational attainment; (c) there was little evidence of a reduction in Black-White literacy gaps within educational attainment levels, and (d) there was significant evidence of more Blacks moving up the educational attainment ladder. This pattern of data suggests that the decrease in the overall Black-White literacy gap was significantly influenced by Blacks’ achievement of higher levels of educational attainment.
Policy makers, researchers, and educators have historically considered literacy a measure of the quality of education. It is only recently, however, that the U.S. government began explicitly addressing the importance of adult literacy. In 1988, the U.S. Congress asked the U.S. Department of Education to address the need for national adult literacy information (Kaestle, Campbell, Finn, Johnson, & Mikulecky, 2001). In 1992, the U.S. Department of Education’s National Center for Education Statistics (NCES) administered the first national adult literacy assessment to the U.S. population 16 and older with the National Adult Literacy Survey (NALS). In 2003, adult literacy was assessed again under its new name, the National Assessment of Adult Literacy (NAAL; Kutner, Greenberg, Jin, Boyle, Hsu, & Dunleavy, 2007). The NAAL was designed so that its data were directly comparable to the NALS. 1 The 1992 NALS and the 2003 NAAL represent the most comprehensive assessments of adult literacy in the United States.
Historically, Whites have outperformed Blacks on most measures of literacy (Hedges & Nowell, 1998), which will be referred to as the Black-White literacy gap. 2 The Black-White literacy gap grew out of differences in educational attainment (i.e., the highest degree of education an individual has completed) between the Black and White populations. Differences in educational attainment grew out of racial oppression. In the present article, we examine the Black-White literacy gap in detail using data from the 1992 NALS and the 2003 NAAL. In particular, (a) we assess whether the size of the Black-White literacy gap changed from 1992 to 2003, and (b) if changes occur, we examine the source of those changes, with a specific emphasis on how they relate to educational attainment. Because the changes in the Black-White literacy gap over time and their corresponding educational and familial contexts are (a) central to understanding the current data and (b) provide the motivation for examining the current state of the Black-White literacy gap, we briefly review the history of the Black-White literacy gap and its relation to education next.
Historic Differences in Literacy and Education of Blacks and Whites
To fully understand the current Black-White literacy gap, it is important to understand the different historical circumstances of Blacks and Whites with regard to literacy and education. We briefly outline these differences next.
The abilities to read, write, and calculate, which are component skills for literacy, are learned. These skills can be taught within the home by members of the household or outside the home within institutions, such as schools. Slavery provided the circumstances necessary to produce large-scale illiteracy among a subpopulation. In particular, Africans who were unfamiliar with English were forcibly taken to North America and denied virtually all education. In fact, every Southern state before the Civil War had passed laws forbidding the education of Blacks (Knox, 1947). Without being literate themselves, parents could not educate their children. Without access to institutional education, children could not get educated outside the home. As a result, illiteracy among slaves was estimated at 90% (Cornelius, 1991).
The Black-White Literacy Gap Measured in the U.S. Census
From 1840 to 1930, the U.S. Census was the only large-scale measure of literacy. The U.S. Census asked whether people older than age 10 in the house were literate. Although the validity of these self-reported literacy estimates cannot be verified, we assume that any response bias would be in the direction of overestimating literacy rather than the reverse. Nevertheless, assuming these estimates contain some valid data, the trends over time provide important information.
Collins and Margo (2006) analyzed U.S. Census information on literacy and education and provide tables of summary statistics across eight decades, from which we extracted the following brief review. The 1850 U.S. Census, which occurred before Emancipation and did not include slaves, reported that 36% of free Blacks were illiterate. The 1870 U.S. Census, which was the first conducted after Emancipation, reported that 81% of Blacks were illiterate, compared to 9% of Whites.
Subsequent U.S. Censuses reveal a sharp decline in Black illiteracy as high-illiteracy older cohorts were gradually replaced by more literate younger generations. In 1870, there was little difference between older and younger Blacks’ literacy: 85% of Black adults ages 60 to 69 were illiterate, and 76% of Blacks ages 20 to 29 were illiterate. By 1900, overall Black illiteracy had decreased to 48%, with the younger generations showing much higher literacy levels than older generations: 85% of Blacks ages 60 to 69 were illiterate, whereas 37% of Blacks ages 20 to 29 were illiterate. It is important to mention that this cohort, the 20- to 29-year-old Blacks in 1900, were the first cohort born after Emancipation. By 1920, overall Black illiteracy was 24%, with 61% of Blacks ages 60 to 69 illiterate whereas 18% of Blacks ages 20 to 29 illiterate. The last time the literacy question was asked on the U.S. Census was in 1930. By then, 15% of Blacks were illiterate and 2% of Whites were illiterate (Margo, 1990). The historic Black-White literacy gap was likely influenced by the differing educational opportunities and environments of Blacks and Whites. We review these issues next.
The Black-White Education Gap
Gloria Ladson-Billings (2006) argues that the achievement gap is best understood as the inevitable result of a long-standing education debt. That is, the achievement gap grew out of educational inequities in the United States. Park and Kyei (2011) have recently shown that educational attainment is the best predictor of literacy internationally. Next, we briefly review some of the educational inequalities that have contributed to the education debt.
In 1850, the U.S. Census began asking whether school-age children in the household were attending school. Families could answer in the affirmative if the children had attended school at any time during the previous year. Traditionally, the age group most likely for White and Black children to be in school was 10 to 14 (Margo, 1990). In many communities at the time, high schools for Black students simply did not exist (Thompson, 1939). The 1870 U.S. Census indicated that 10% of Black school-age children and 52% of White school-age children spent some time in school that year (Collins & Margo, 2006). By 1900, 36% of Black school-age children and 57% of White school-age children spent time in school (Collins & Margo, 2006).
School attendance meant very different experiences for Black and White children. Until as recently as the 1940s, Black schools were in session fewer days than White schools (Welch, 1973). Often in the South, where a vast majority of Blacks lived, Black schools were in session approximately 5 to 6 months of the year. This is attributed to insufficient resources as well as poverty. For most rural Blacks, school attendance during the time crops were planted (April and May) or harvested (September and October) was simply not possible. Thus, although the typical Black child and the typical White child may have attended school the same number of years, they had potentially a far different number of school days and likely achieved very different literacy levels.
Not only were Black schools in session fewer days, but also per-child education expenditures (which were determined on a local level) in most cases overwhelmingly favored White children (Bureau of Education, 1917). The inequity was worse in majority-minority counties, where approximately half of Black children lived (Margo, 1990). 3 For example, in 1917, in counties where at least 50% of the population was Black, the per-child expenditure for Black children averaged 10% that for White children. By contrast, in majority-White counties, the average per-child expenditure for Black children was 55% that for White children. Insufficient funding led to inferior conditions. 4
Another important consideration is the literacy of parents. As we see in contemporary society, the literacy of the parents had a direct impact on the literacy of their children. Using 1910 U.S. Census information, Margo (1990) found that Black children of illiterate parents were less likely to be in school than those of literate parents. If both parents were literate, 57% of Black school-age children were in school; however, when both parents were illiterate, only 37% of Black school-age children attended school. Low school attendance by children of illiterate parents was likely a function of poverty, because poorer households often relied on the income produced by their children’s employment (Margo, 1990). In addition, illiterate Black parents were more likely to live in areas where educational opportunities were very limited (Anderson, 1988). Black schools at the time were overwhelmingly owned by private sources, such as churches or community philanthropists, and tended to be placed where sufficient community monetary and moral support for Black schools existed rather than where most Blacks lived (Bureau of Education, 1917). Thus, it was not uncommon for children to walk 6 to 7 miles to school, typically a one-room schoolhouse with mixed age groups.
By 1940, Blacks and Whites ages 10 to 14 attended school at similar levels (less than 5% difference), whereas Blacks ages 5 to 9 and 15 to 19 attended school at lower levels than Whites of similar ages. The considerable improvement in Black school attendance was due in part to the narrowing of long-standing spending gaps between Black and White schools that began in the 1940s (Welsh, 1973). In fact, during that time, overall expenditures at the time for Black children grew at a faster rate than spending for White children (Margo, 1990). It was not until 1960 that Black and White children ages 5 to 9 attended school at similar levels and 1970 for Black and White children ages 15 to 19 (Collins & Margo, 2006).
Collins and Margo (2006) examined the educational attainment of birth cohorts from 1880 to 1954 and report that children born in 1945 were the first cohort in which Blacks and Whites spent about the same total years in school—they differed by less than 1 year. Among those born between 1930 and 1944, Whites spent between 1 and 2 more years in school than Blacks. Among those born between 1915 and 1929, that difference averaged between 2 and 3 years. Among those born before 1915, on average, Whites spent 3 more years in school than Blacks.
Desegregation had an immediate positive effect on literacy levels for Blacks, especially in the South (Grissmer, Flanagan, & Williamson, 1998). Grissmer et al. (1998) observed that the National Assessment of Educational Progress (NAEP) reading scores for Black 17-year-olds in 1988 were 0.7 standard deviations higher than in 1978 (a much larger increase than for White children of the same age). Guryan (2004) showed that desegregation was beneficial to Blacks’ enrollment in school, whereas it did not affect White enrollment. Guryan was able to compare enrollments of Black and White students before and after desegregation because although desegregation was ordered in 1954, it was carried out at very different rates across the country. As Guryan notes, a child born in 1955 in New Orleans, which desegregated in 1960 and was among the first school districts to desegregate, would have gone through his or her entire school career in desegregated schools before any child in Chicago had the opportunity to attend a desegregated school. The Chicago school district desegregated in 1982 and was among the last school districts in the country to do so. Next, we examine the current state of majority-minority and majority-White educational environments.
The Current School Environment
After centuries of unequal educational environments, recent assessments of majority-minority schools and majority-White schools show increasing equality. According to a recent meta-analysis, several important school variables known to affect students’ performance are teacher education, teacher experience, teacher salary, per-pupil expenditures, and teacher-pupil ratio (Greenwald, Hedges, & Laine, 1996). Several studies suggest that the average Black student and the average White student attend schools in which these variables are approximately equal (Boozer, Krueger, & Wolkon, 1992; Evans, Murray, & Schwab, 1997). Other studies dispute this assertion, showing that teachers in majority-minority schools have less education and experience and lower ratings on the Teacher Quality Index (an index developed by Illinois Education Research Council; Peske & Haycock, 2006).
It is important to note that apparent equality on global measures, such as per-pupil expenditures, can be misleading. Whereas in a majority-White school, money may be spent on musical instruments or an upgraded science lab, in a majority-minority school, the money may be spent on such expenses as remedial education, special education, counseling, and training new teachers (because teacher turnover in these schools is higher; Orfield & Lee, 2006). Indeed, Fryer and Levitt (2004) found that schools attended by Black and White elementary school students were equal on standard measures of school quality, such as class size, teachers’ education, computers in class, and Internet connections, but were very different by less-standard measures of school quality, such as gang problems in school, percentage of students on free lunch, amount of loitering by nonstudents in front of school, amount of litter around school, and Parent-Teacher Association funding.
Summary
In sum, Blacks have historically been outperformed by Whites on most measures of literacy. Prior to Emancipation, the literacy of Blacks in the United States was prevented by social and legal policies. This Black-White literacy gap, first measured just after Emancipation, revealed that 81% of Blacks were illiterate, compared to 9% of Whites. By most measures, the Black-White literacy gap has been steadily decreasing. The reduction of the Black-White literacy gap has generally been preceded by changes in social environments and prejudicial policies that relate to education, such as longer school years, desegregation, and better funding for majority-minority schools, among others.
Next, we examine the current state of the Black-White literacy gap in detail using data from the most comprehensive measures of adult literacy in the United States: the 1992 NALS and the 2003 NAAL. In contrast to the census data discussed earlier, which relied on respondents’ self-report of literacy, the NALS and NAAL quantitatively measure literacy in paper-and-pencil assessments. Here, (a) we assess whether the size of the Black-White literacy gap changed from 1992 to 2003, and (b) if changes occur, we examine the source of those changes with a specific emphasis on how they relate to educational attainment.
Method
Participants
The 2003 assessment was administered to a nationally representative sample of 19,714 adults ages 16 and older residing in households or prisons. The household sample consisted of 18,541 respondents who were representative of 221 million adults in households. Data were collected between May 2003 and July 2004. The household and prison samples were combined to create a national sample representative of American adults in households or prisons.
The 1992 assessment was administered to a nationally representative sample of more than 26,000 adults ages 16 and older residing in households or prisons. The household sample consisted of about 24,900 respondents who were representative of 221 million adults in households. Data were collected in the first 9 months of 1992. The household and prison samples were combined to create a national sample representative of American adults in households or prisons.
Table 1 presents the sample sizes analyzed in the present article by population groups. For comparability among the survey respondents, all analyses in the present article were limited to those respondents who were born in the United States, because the U.S.-born population is generally exposed to English during the critical language-learning ages. The analytic sample consisted of 16,156 NAAL household respondents and 23,035 NALS household respondents.
NALS and NAAL Sample Sizes by Population Groups of U.S.-Born Household Respondents Younger Than 80 Years Old
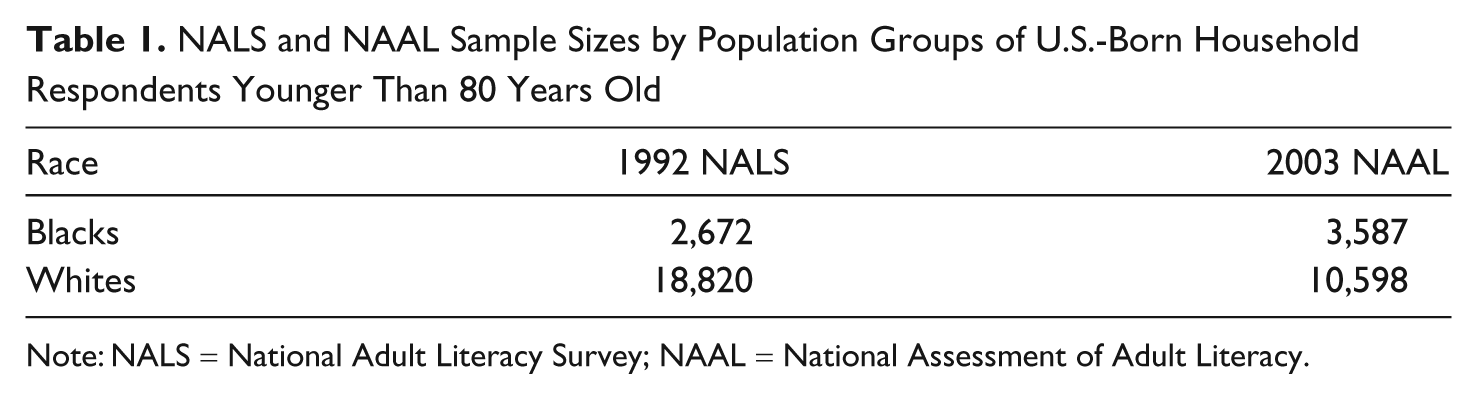
Note: NALS = National Adult Literacy Survey; NAAL = National Assessment of Adult Literacy.
Survey Instruments
The main vehicle of measurement of adult literacy is the NAAL and its predecessor, the NALS. The NAAL conceptualizes literacy as “the ability to use printed and written information to function in society, to achieve one’s goals, and to develop one’s knowledge and potential” (Kirsch & Jungeblut, 1986; White & Dillow, 2005).
Both the NALS and the NAAL measure adult literacy on three dimensions: prose, document, and quantitative. Technical manuals published by the NCES define prose literacy as the knowledge and skills needed to search (e.g., locating information from a newspaper article), comprehend, and use continuous texts, such as editorials (e.g., comparing different points of views in editorials); document literacy as the knowledge and skills needed to search, comprehend, and use noncontinuous texts, such as transportation schedules (e.g., using a schedule to select a train or filling out a form); and quantitative literacy as the knowledge and skills required to identify and perform computations using numbers embedded in printed materials (e.g., balancing a checkbook or completing an order form; White & Dillow, 2005).
The three literacy scales were developed from research suggesting that one’s demonstrated literacy depends not only on general literacy ability but also on the reader’s knowledge of the passage content or familiarity with the method of materials presentation (Kirsch & Mosenthal, 1990). Although some have found discriminant validity to be a problem because of significant interscale correlation (Reder, 1998), there is strong statistical justification for three scales rather than one general literacy scale (Rock & Yamamoto, 2001).
Both the NAAL and the NALS were drawn from texts and published documents commonly encountered by the U.S. adult population (e.g., actual newspaper articles, employment forms, etc.). The NAAL consisted of 152 tasks, and the NALS consisted of 165 tasks. Sixty-five of the tasks were identical in both the 1992 and the 2003 assessments. The remaining tasks were developed specifically for each assessment.
The NAAL and the NALS use literacy practices that are common for all subpopulations, including Blacks. The assessment tasks are those routinely used by both Blacks and Whites. The instrument is carefully reviewed for bias and sensitivity by multiple panels of experts and differential-item-functioning analyses are conducted to ensure that the literacy tasks do not bias any one group. Thus, although there is a diverse set of literacy practices in the Black community (e.g., African American language; e.g., Paris, 2009), this should not affect the literacy gap as measured by the NAAL and the NALS. There are no construct-irrelevant tasks in any of the assessments.
There were three relevant changes in administration procedures between the 1992 NALS and the 2003 NAAL: (a) The 2003 NAAL allowed participants to classify themselves as multiracial, (b) the 2003 NAAL had more Spanish-language accommodations than the 1992 NALS, and (c) the respondents had access to a calculator in the 2003 NAAL for any of the Quantitative items but for only a single block of Quantitative items in the 1992 NALS. The change in the race-ethnicity classification should have minimal influence on the literacy estimates of the 2003 Black population because only 2% of adults identified themselves as multiracial. Nevertheless, this change should be noted, as the proportion of the population who identify themselves as multiracial will likely increase.
The changes in Spanish-language accommodations may have influenced the population of individuals completing the 2003 NAAL. Specifically, in 1992, the background questionnaire was available in either English or Spanish, but the entire assessment was administered in English only. In 2003, in addition to the background questionnaire’s availability in either English or Spanish, the core questions were also asked in both English and Spanish, although the reading materials associated with the core questions were available in English only. Respondents were required to accurately complete the core questions to be included in the overall assessment. Thus, the changes in Spanish-language accommodations allowed more Hispanics with low literacy to be tested in 2003 than in 1992. For this reason, all analyses in the present article were limited to those respondents who were born in the United States. Because the U.S.-born population is generally exposed to English during the critical language-learning ages, the U.S.-born population should be minimally affected by the change in Spanish-language accommodations.
The third change in administration procedures, access to calculators, may have affected the estimates of quantitative literacy. It is difficult to tell how the use of calculators may have, if at all, affected the data. However, out of an abundance of caution, within-assessment comparisons of quantitative literacy should be given more weight than between-assessment comparisons of literacy.
Results
All statistical analyses were calculated using AM, a statistical software package developed with the support of the NCES to analyze data from large-scale assessments with complex designs. AM uses marginal maximum likelihood procedures to represent each participant’s proficiency as a probability distribution across all possible scores. AM uses these probability distributions in the estimation process. Standard errors are calculated using a Taylor-series approximation. The NAAL and NALS are public-use data, so no specific data management decisions were necessary. All analyses were conducted on the basis of weighted data adjusted for unequal probability of selection and nonresponse.
Table 2 presents the quantitative, prose, and document literacy levels of Blacks and Whites for the U.S.-born population on the NAAL and NALS. For both 1992 and 2003, there was a significant performance gap between Blacks and Whites on all three literacy scales. Importantly, the size of the performance gap declined by nearly 20% between 1992 and 2003 on all three performance scales. The shrinking of the performance gap was almost exclusively a function of the Black population’s increasing literacy scores. That is, whereas Whites’ literacy scores increased only in the quantitative assessment, Blacks’ literacy scores increased in all three assessments. Thus, the significant performance increases across literacy scales between 1992 and 2003 by Blacks combined with stable White performance, has resulted in decreasing the performance race gaps. Next, we examine the change in race performance gaps over time within the 2003 assessment.
Quantitative, Prose, and Document Literacy Estimates of Blacks and Whites on the 1992 NALS and the 2003 NAAL Among the Adult U.S.-Born Population
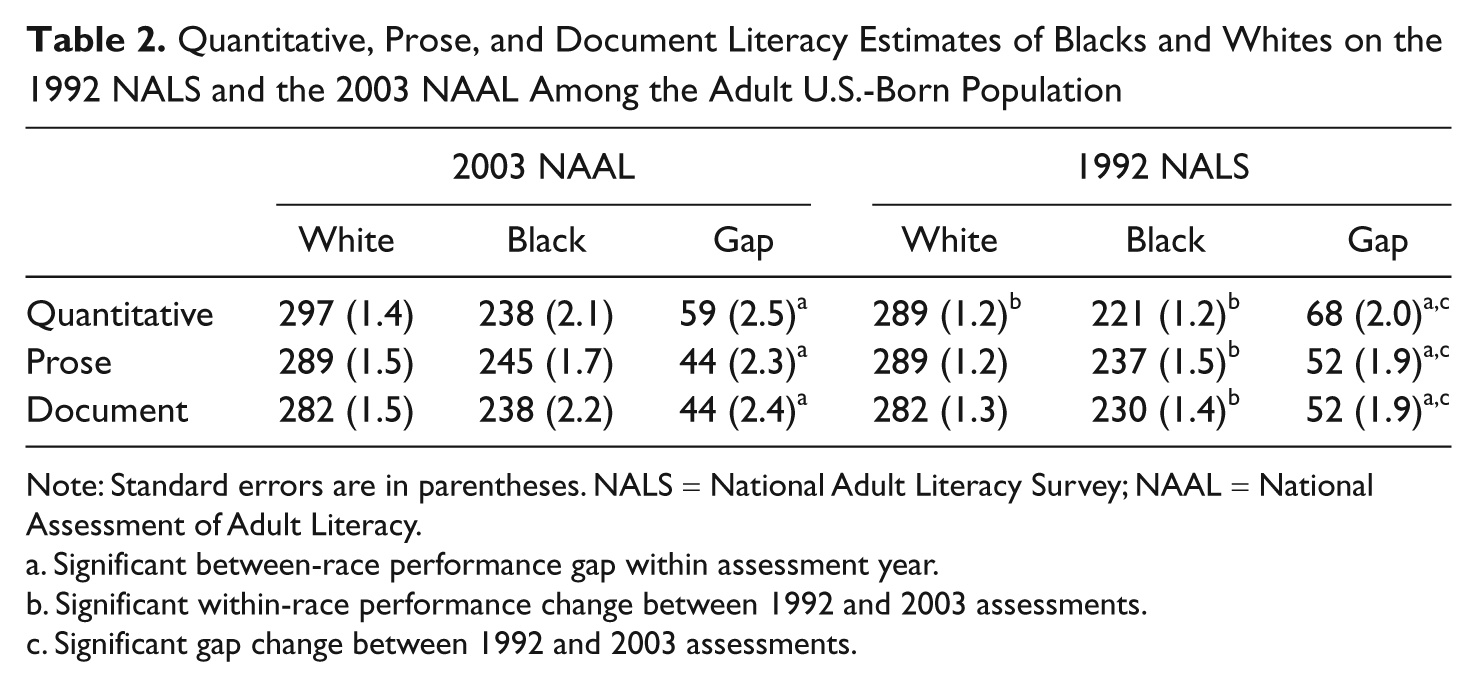
Note: Standard errors are in parentheses. NALS = National Adult Literacy Survey; NAAL = National Assessment of Adult Literacy.
Significant between-race performance gap within assessment year.
Significant within-race performance change between 1992 and 2003 assessments.
Significant gap change between 1992 and 2003 assessments.
Literacy Gaps and Age
Here, we examine Black-White literacy gaps over time within the 2003 NAAL. Age is the main variable that documents time in the 2003 NAAL. Thus, to examine literacy gap changes over time, we binned the respondents into 10-year age groups and examined the literacy gaps across these intervals. We filtered the data to include only the U.S.-born population who were younger than 80. We limited the age to younger than 80 because there were too few respondents 80 or older to produce reliable results. It should be noted that these data are cross-sectional and correlational. Therefore, although we can reveal how performance changes with age, we cannot determine the source of the performance change. That is, gap changes may be a result of different educational attainments over time, differential age-related cognitive loss, or many other possible variables. Nevertheless, the presence or absence of literacy gap changes across age groups may lead to differential, testable hypotheses on the source of the gap change that may aid future researchers.
Table 3 presents the quantitative, prose, and document literacy estimates for Whites and Blacks across age groups for the 2003 NAAL. As the table reveals, there were significant quantitative, prose, and document literacy performance gaps across race for all age groups. For each literacy type, we ran a linear regression assessing performance gap size as a function of age (see Figure 1). The quantitative literacy regression showed a significant decrease in the quantitative literacy performance gap across age groups (intercept = 38.60, slope = 0.61), F(1, 5) = 68.80, p < .001, r2 = .92. The prose literacy regression showed a significant decrease in the prose literacy performance gap across age groups (intercept = 34.80, slope = 0.34), F(1, 5) = 24.70, p = .004, r2 = .78. The document literacy regression showed a significant decrease in the document literacy performance gap across age groups (intercept = 35.10, slope = 0.39), F(1, 5) = 18.80, p = .007, r2 = .75.
Literacy Estimates for Whites and Blacks Across Age Groups Among the Adult U.S.-Born Population on the 2003 NAAL
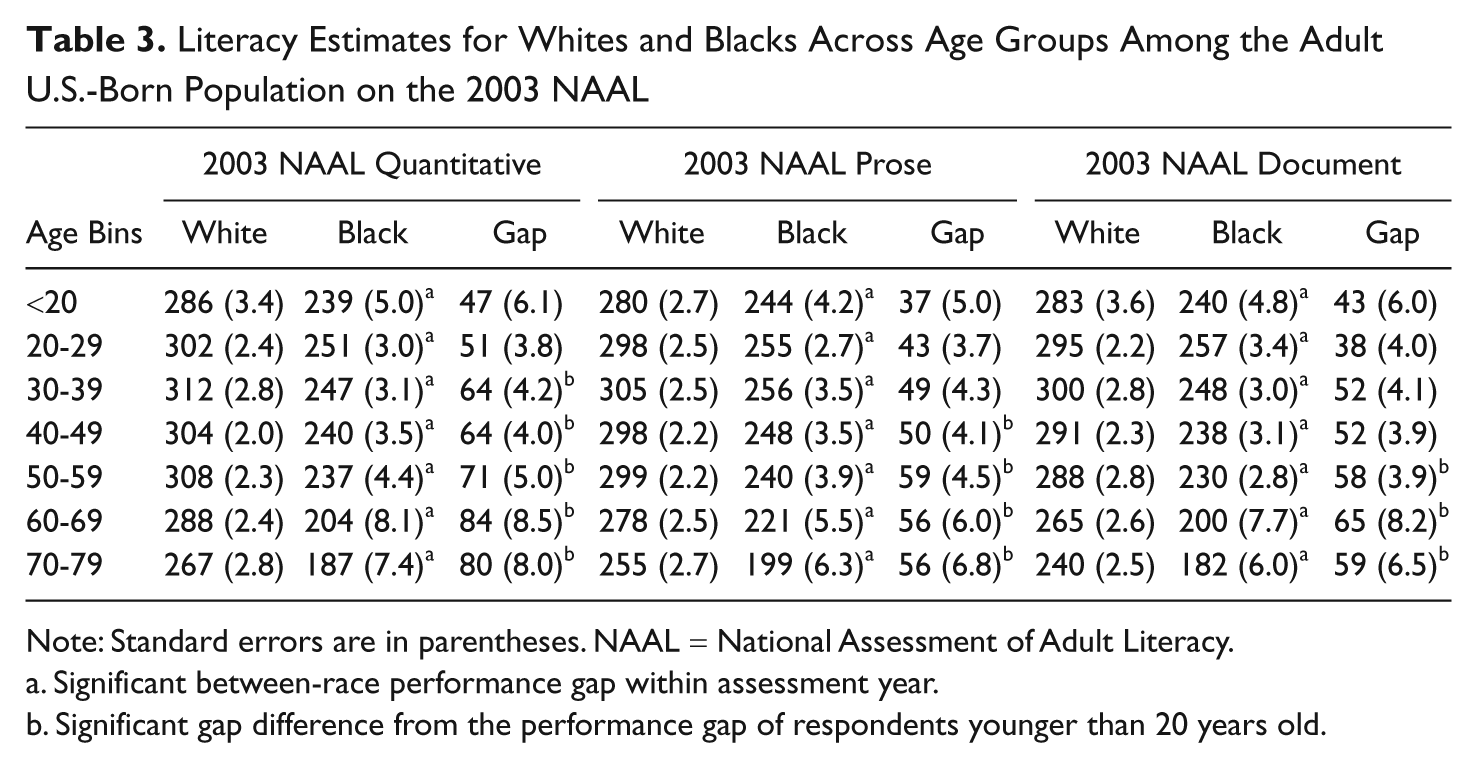
Note: Standard errors are in parentheses. NAAL = National Assessment of Adult Literacy.
Significant between-race performance gap within assessment year.
Significant gap difference from the performance gap of respondents younger than 20 years old.
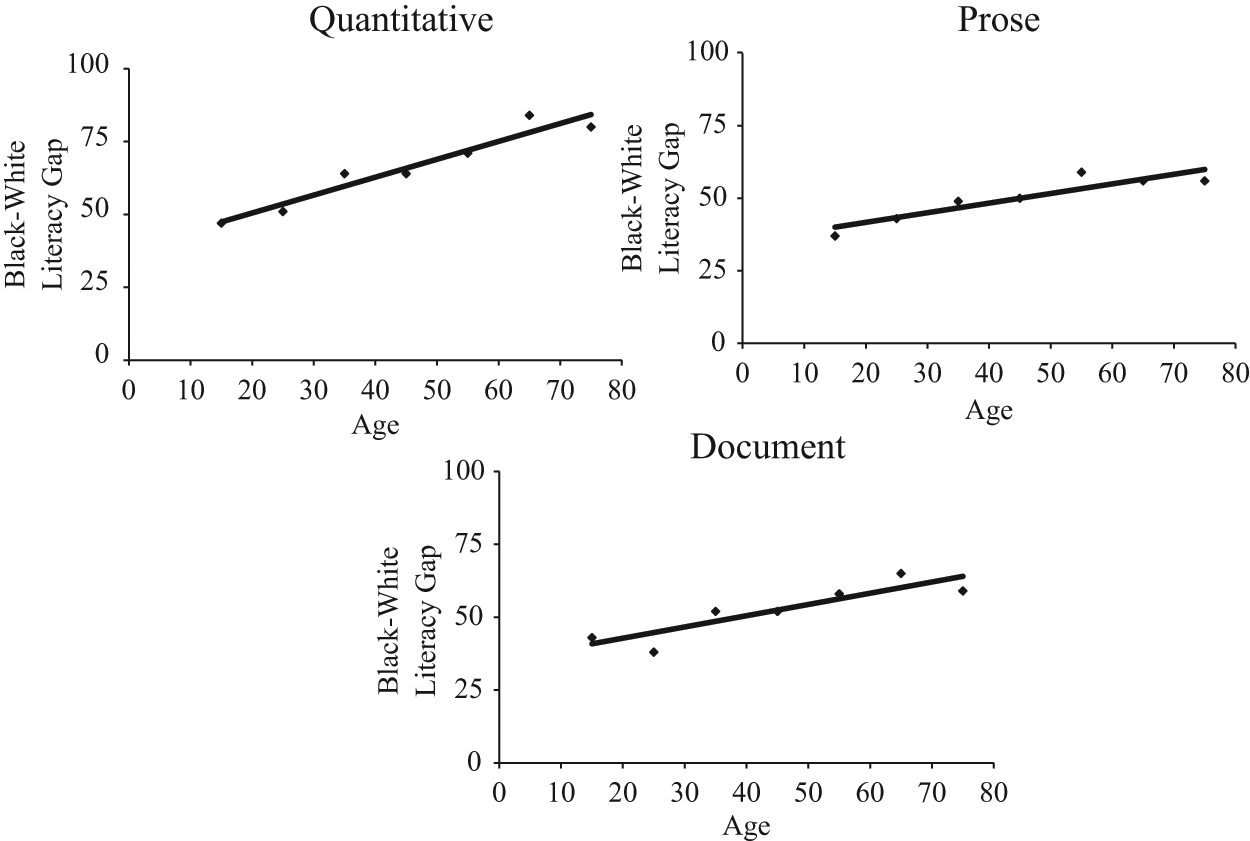
Quantitative, prose, and document literacy estimates of the performance gap between Whites and Blacks across age groups for the adult U.S.-born population on the 2003 National Assessment of Adult Literacy
In sum, for all three literacy scales, there are significant relations between the size of the race performance gap and age, such that the race performance gap decreases with younger age groups. If one assumes that age differences reflect, at least in part, changes in educational quality across generations, then these data reveal a continuous reduction of the race performance gap over time for all literacy scales. Although with the present data, one cannot pinpoint the source of the declining performance gap, it is noteworthy for the strength and direction of the effect. Next, we examine the relation between the race performance gap and educational attainment.
Changes in Literacy and the Literacy Gap Within Education Attainment Levels
To explain whether the decreasing Black-White literacy gap is related to increased literacy at various levels of education, we analyzed the change in the race performance gap by level of educational attainment for the 2003 and 1992 assessments.
Tables 4 through 6 present the literacy estimates of Whites and Blacks on quantitative, prose, and document literacy for the 2003 and 1992 assessments. Our analyses reveal that for all literacy scales, significant race performance gaps exist at all levels of educational attainment for both the 2003 and 1992 assessment, whereby Whites have higher literacy scores than Blacks. Significant within-race performance changes for each level of educational attainment will be discussed as well as any significant changes in the literacy gaps.
Quantitative Literacy Estimates for Whites and Blacks Across Levels of Educational Attainment Among the Adult U.S.-Born Population on the 2003 NAAL and the 1992 NALS
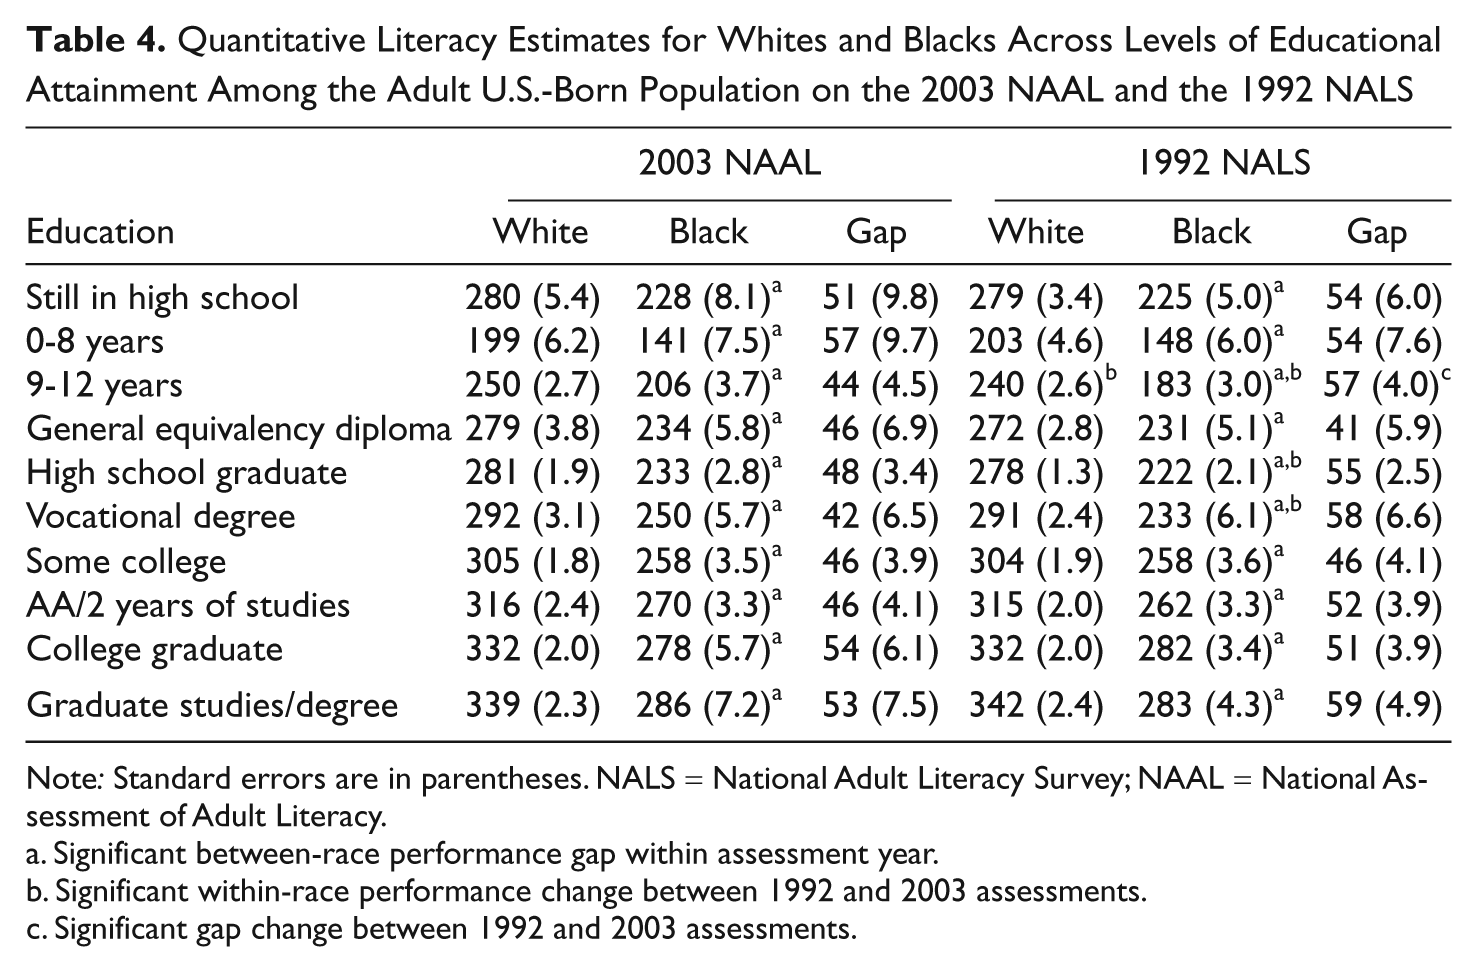
Note: Standard errors are in parentheses. NALS = National Adult Literacy Survey; NAAL = National Assessment of Adult Literacy.
Significant between-race performance gap within assessment year.
Significant within-race performance change between 1992 and 2003 assessments.
Significant gap change between 1992 and 2003 assessments.
Prose Literacy Estimates for Whites and Blacks Across Levels of Educational Attainment Among the Adult U.S.-Born Population on the 2003 NAAL and the 1992 NALS
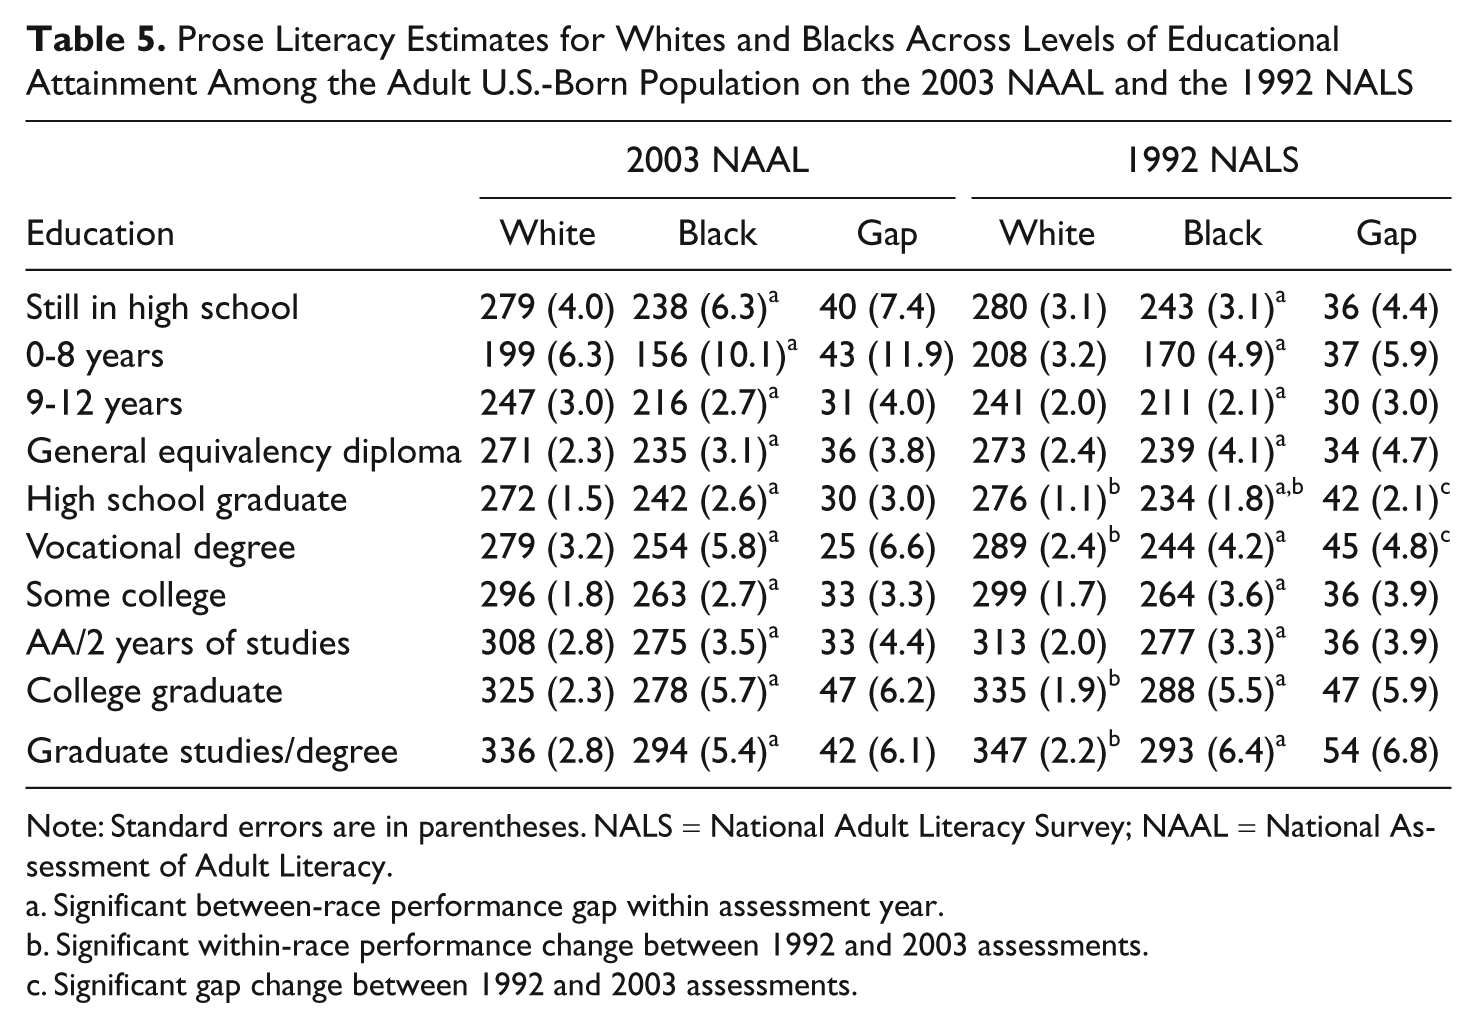
Note: Standard errors are in parentheses. NALS = National Adult Literacy Survey; NAAL = National Assessment of Adult Literacy.
Significant between-race performance gap within assessment year.
Significant within-race performance change between 1992 and 2003 assessments.
Significant gap change between 1992 and 2003 assessments.
Document Literacy Estimates for Whites and Blacks Across Levels of Educational Attainment Among the Adult U.S.-Born Population on the 2003 NAAL and the 1992 NALS
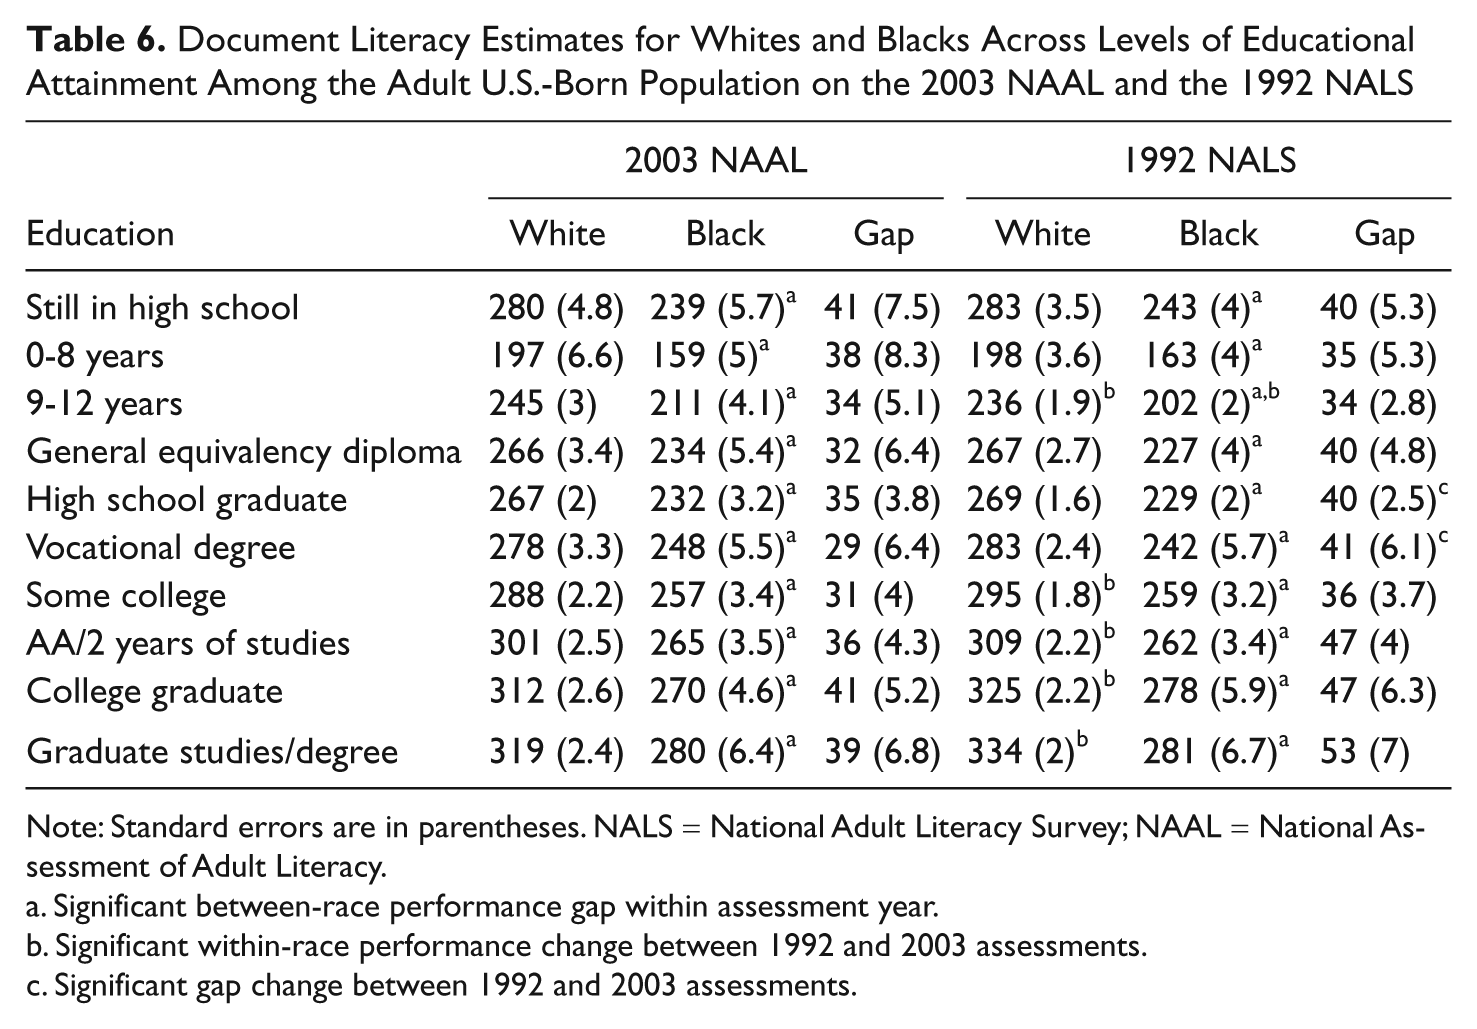
Note: Standard errors are in parentheses. NALS = National Adult Literacy Survey; NAAL = National Assessment of Adult Literacy.
Significant between-race performance gap within assessment year.
Significant within-race performance change between 1992 and 2003 assessments.
Significant gap change between 1992 and 2003 assessments.
For those with 0 to 8 years of education and for those still in high school, literacy scores remained stable for Blacks and Whites on all three literacy scales. However, for those with 9 to 12 years of education, there were some changes in literacy from 1992 to 2003. Blacks and Whites significantly improved their scores on quantitative literacy and document literacy. Scores for Blacks and Whites with 9 to 12 years of education remained stable on prose literacy. The literacy gap decreased significantly only for quantitative literacy, while remaining unchanged for prose and document literacy.
For Blacks and Whites whose highest level of educational attainment was a general equivalency diploma (GED), literacy scores remained stable on all three literacy scales. However, literacy scores for high school graduates showed much change from 1992 to 2003. Black high school graduates improved their quantitative and prose literacy scores, whereas White high school graduates showed a significant increase on quantitative literacy scores but a significant decrease on prose literacy scores. Black and White high school graduates showed no change on document literacy scores. For high school graduates, the prose and document literacy gap decreased significantly, and for quantitative literacy, the literacy gap decreased, but the decrease was not quite significant (p < .1).
Those whose highest educational attainment was vocational degree also showed much change in literacy scores from 1992 to 2003. Blacks with a vocational degree showed significantly increased quantitative literacy and prose literacy scores, whereas document literacy scores remained unchanged. Whites with a vocational degree had significantly lower prose literacy scores, whereas Whites’ quantitative and document literacy scores were stable. The literacy gap significantly decreased for prose literacy and document literacy. For quantitative literacy, the literacy gap decreased, but again, the decrease was not quite significant (p < .1).
Blacks at levels of educational attainment of some college, AA degree or 2 years of studies, college graduate, and graduate degree or studies had stable scores from 1992 to 2003 on all three literacy scales. Additionally, there was no change in the literacy gap for any of these education levels. The quantitative literacy scores of Whites in these higher levels of educational attainment remained unchanged from 1992 to 2003. However, on document literacy, they showed significantly lower scores. On prose literacy, Whites with some college and AA degree or 2 years of studies had stable scores, but White college graduates and Whites with graduate degrees or studies had significantly lower scores in 2003.
In sum, we observed only sporadic performance increases on some literacy scales for Black high school and vocational school graduates accompanied by significant decreases in the literacy gaps for these education levels. Interestingly, Whites with 9 to 12 years of educational attainment improved their scores on only some scales, and those in the four highest educational attainment levels showed declines on some scales. Next, we assess the relation between the degree of the Black-White literacy gap and educational attainment.
To assess whether the Black-White literacy gap increased, decreased, or remained stable as a function of educational attainment, for each literacy estimate (prose, document, and quantitative), we ran a linear regression for Black and White populations whereby literacy estimate was the criterion variable and educational attainment was the predictor variable. We then compared the intercept and slope of the regression for Blacks and Whites. A significant slope difference between Blacks and Whites indicates a change in gap size as a function of educational attainment. A significant intercept difference indicates a significant race gap at the lowest educational attainment level assessed. In this analysis, we assigned educational attainment an ordinal rank from 1 to 8, with 1 denoting 9 to 12 years, 2 denoting GED, 3 denoting high school graduate, and so on. We dropped the educational attainment category “0 to 8” from the analysis because the literacy levels associated with this level of educational attainment were low enough to deviate from linearity. Although educational attainment is an ordinal variable and a regression assumes interval data, Conover and Iman (1981) demonstrated that using rank-ordered variables provides valid results.
There was a significant linear relation between educational attainment and prose literacy estimates for the White adult population, F(1, 6) = 227, p < .001, r2 = .97. Both the slope (b = 12.1, SE = 0.8) and the intercept (a = 237, SE = 4.1) were significant (both ts > 10, p < .001). There was also a significant linear relation between educational attainment and prose literacy estimates for the Black adult population, F(1, 6) = 365, p < .001, r2 = .98. Both the slope (b = 10.3, SE = 0.5) and the intercept (a = 211, SE = 2.7) were significant (both ts > 10, p < .001). The intercept of regression equation predicting literacy as a function of educational attainment for Blacks was significantly lower than that for Whites (t = 5.40, p < .001). The slope of regression equation predicting literacy as a function of educational attainment for Blacks was not significantly different than that for Whites (t = 1.80, ns).
There was a significant linear relation between educational attainment and document literacy estimates for the White adult population, F(1, 6) = 331, p < .001, r2 = .98. Both the slope (b = 10.2, SE = 0.56) and the intercept (a = 238, SE = 2.8) were significant (both ts > 10, p < .001). There was also a significant linear relation between educational attainment and document literacy estimates for the Black adult population, F(1, 6) = 152, p < .001, r2 = .96. Both the slope (b = 9.2, SE = 0.7) and the intercept (a = 208, SE = 3.8) were significant (both ts > 10, p < .001). The intercept of regression equation predicting literacy as a function of educational attainment for Blacks was significantly lower than that for Whites (t = 6.40, p < .001). The slope of regression equation predicting literacy as a function of educational attainment for Blacks was not significantly different than that for Whites (t = 1.1, ns).
There was a significant linear relation between educational attainment and quantitative literacy estimates for the White adult population, F(1, 6) = 221, p < .001, r2 = .97. Both the slope (b = 12, SE = 0.8) and the intercept (a = 245, SE = 4.1) were significant (both ts > 10, p < .001). There was also a significant linear relation between educational attainment and quantitative literacy estimates for the Black adult population, F(1, 6) = 155, p < .001, r2 = .96. Both the slope (b = 10.7, SE = 0.6) and the intercept (a = 204, SE = 4.3) were significant (both ts > 10, p < .001). The intercept of regression equation predicting literacy as a function of educational attainment for Blacks was significantly lower than that for Whites (t = 7.0, p < .001). The slope of regression equation predicting literacy as a function of educational attainment for Blacks was not significantly different than that for Whites (t = 1.1, ns).
All three literacy scales show the same pattern when regressed on educational attainment by race: Although Blacks have a lower estimated literacy compared to Whites, Blacks’ and Whites’ literacy scores increase as a linear function of educational attainment at the same rate. This indicates that Blacks and Whites are getting equivalent gains from each jump in educational attainment. Equivalent gains but not equivalent literacy suggest that early literacy differences appear to carry through all levels of educational attainment.
Because there were very few reductions of the Black-White literacy gap within each educational attainment category, the reduced overall literacy gap described previously cannot be explained by increased literacy levels within educational attainment categories. Instead, Blacks’ improved literacy scores may be better explained by the fact that more Blacks are achieving higher levels of education. To assess this possibility, we examined the population changes in each educational attainment category between 1992 and 2003.
Table 7 and Figure 2 present the percentages of Whites and Blacks across levels of educational attainment for the adult U.S.-born population on the 2003 NAAL and the 1992 NALS. The percentage of Blacks whose highest educational attainment is GED increased significantly between 1992 and 2003. Although the percentage of Blacks whose highest educational attainment was high school graduate increased during that time, the increase was not statistically significant. Additionally, Blacks are increasingly achieving educational attainment beyond high school. In 2003, significantly more Blacks were represented with some college as well as with an AA or 2 years of studies than in 1992. Additionally, gaps between Blacks’ and Whites’ educational attainment that existed in 1992 disappeared in 2003 for categories of AA or 2 years of studies and vocational degree. However, gaps measured in 1992 in the categories of college graduate and graduate studies or degree remained in 2003, such that significantly higher percentages of Whites attained these levels of education than Blacks. Importantly, for the highest level of educational attainment, graduate studies or degree, there was a significant decrease in the population gap. Finally, significantly fewer Blacks and Whites can be categorized as dropouts (0 to 8 years and 9 to 12 years) in 2003 compared to 1992, although in both years, the percentage of Blacks at the dropout level was significantly higher than the percentage of Whites in that category. Together, these data reveal that Blacks are, as a whole, achieving higher levels of educational attainment in 2003 than in 1992. This pattern can be clearly seen in Figure 2, which shows that more Blacks are finishing high school and entering college in 2003 than 1992. These data, together with the data demonstrating that the Black-White literacy gap is generally unchanged within educational attainment levels, suggest that this movement up the educational attainment ladder has increased the average literacy of the adult Black population and has led to an overall decrease in the Black-White literacy gap.
Percentages of White and Black Population Across Levels of Educational Attainment Among the Adult U.S.-Born Population on the 2003 NAAL and the 1992 NALS
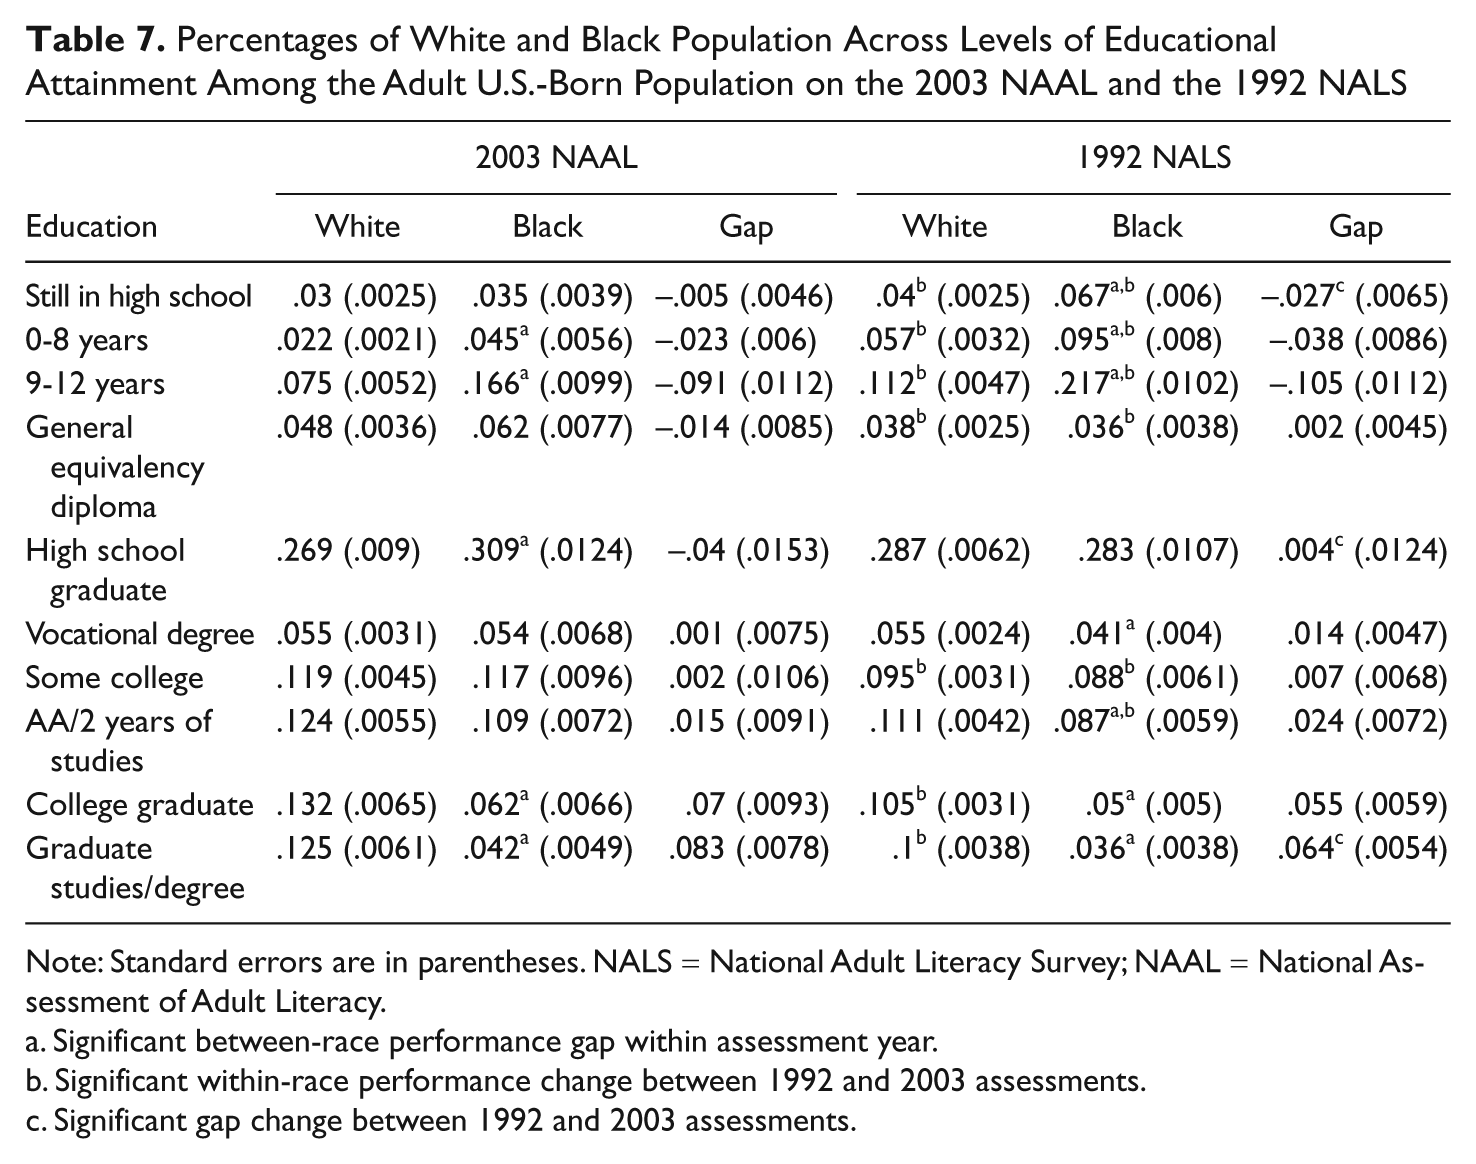
Note: Standard errors are in parentheses. NALS = National Adult Literacy Survey; NAAL = National Assessment of Adult Literacy.
Significant between-race performance gap within assessment year.
Significant within-race performance change between 1992 and 2003 assessments.
Significant gap change between 1992 and 2003 assessments.
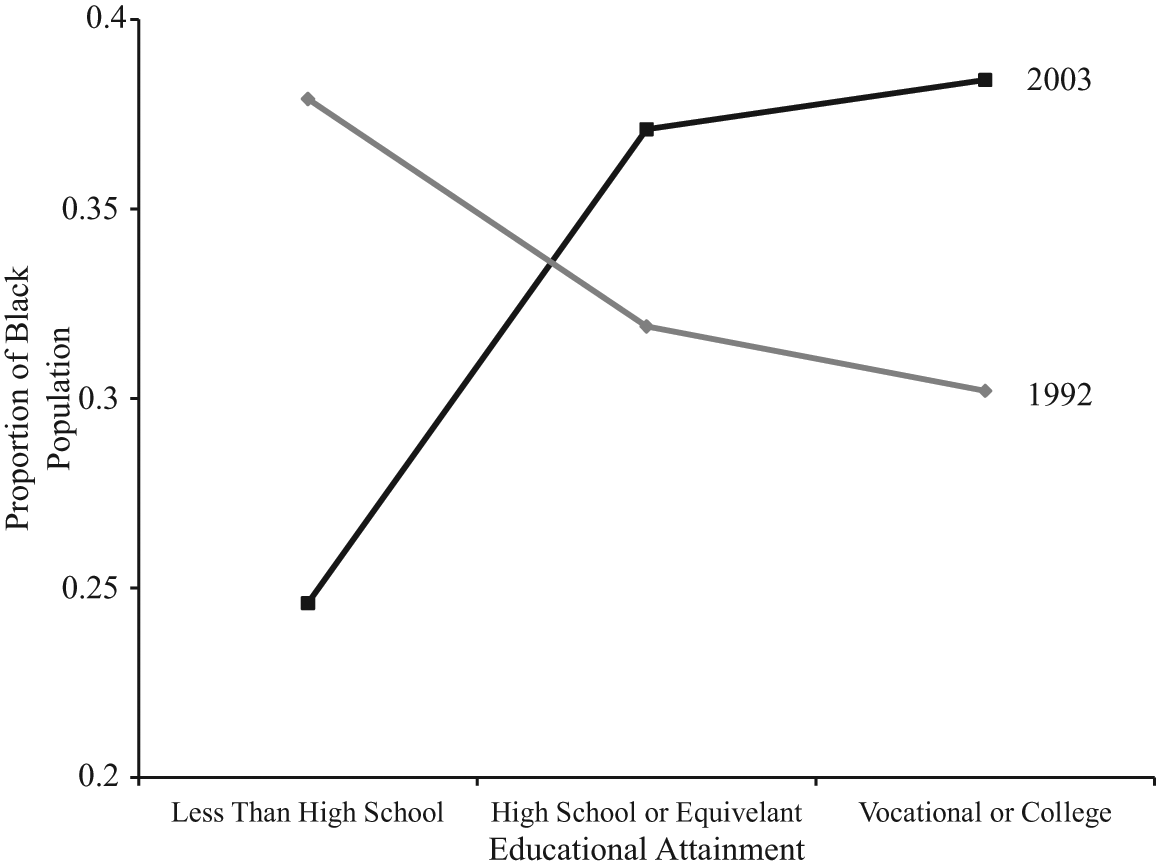
The proportion of the Black population completing different levels of educational attainment in 1992 and 2003. Overall, in 2003, more Blacks completed high school and went to college than in 1992.
Discussion
The 1992 NALS and 2003 NAAL are the most comprehensive measures of adult literacy in the United States. The comparison of literacy estimates between the 1992 NALS and the 2003 NAAL shows robust gains by Blacks across all literacy scales, although the Black-White literacy gaps remain sizable. Although there are sporadic reductions in the Black-White literacy gap between 1992 and 2003 within levels of educational attainment, the reduction of the overall Black-White literacy gap appears to be largely a function of Blacks’ achievement of higher levels of educational attainment. When examining the 2003 data in detail, one sees that the literacy gaps for all scales dramatically decrease as a function of age. Additionally, the 2003 NAAL data reveal that both Blacks and Whites achieve equivalent literacy gains with each step up the educational attainment ladder. Overall, these data suggest slow but steady movement toward eliminating the Black-White literacy gap that originated through social and legislative policies of the 19th and 20th centuries.
The overall diminishing of the Black-White literacy gap seen in the 1992 NALS and the 2003 NAAL data is encouraging because it demonstrates movement toward the ultimate goal of eliminating the gap completely. The slow but steady movement toward this goal is revealed in the linearly decreasing trend relating age and literacy estimates present in the 2003 data. The gains of the younger Black respondents are likely manifestations of changes in social and legislative policies relative to education of Blacks. Recall that it was only relatively recently that desegregation was ordered by the courts. In fact, only cohorts born after the late 1960s had widespread opportunity to attend desegregated schools for their entire school careers. Indeed, the two oldest cohorts in this sample, those who were born before 1943, would have finished school before the courts ordered an end to desegregation. This group shows very large (more than 50 points) literacy gaps on all three scales. The literacy gaps in the two youngest cohorts, those born after 1974, are significantly smaller than those in all older cohorts on all three literacy scales.
We cannot explain why we do not see increases in literacy from 1992 to 2003 within educational attainment categories. This finding is consistent with a trend seen in the NAEP. In particular, with the exception of Grade 4 reading, which shows a narrowing of gaps from 1992 to 2007 in some states due to larger increases in Black students’ scores, the gap has remained stable (Vanneman, Hamilton, Anderson, & Rahman, 2009). These data are also consistent with Neal’s (2006) study of trends of Black-White convergence of skills. Neal noted a stagnation in the 1990s in Black-White skill convergence on a variety of measures, including NAEP reading scores. In fact, Neal estimated Black and White NAEP reading scores would remain more than one standard deviation different until 2030 and more than one half of a standard deviation different until 2050 by using rates of NAEP reading score convergence from 1978 to 1988 and the 1999 baselines (which showed a slowing in the rate of convergence).
However encouraging the data are, the data continue to reveal robust and relatively large Black-White literacy gaps on all three literacy scales—even for the youngest respondents. These Black-White literacy gaps are likely a function of the direct and indirect impact of the prejudicial policies of the 19th and 20th centuries associated with slavery and segregation. These policies directly affect those individuals who were educated in racially segregated school systems and/or those individuals who were denied access to higher education because of their race. The members of the Black adult population who directly experienced segregated school systems are not negligibly small, and the 2003 NAAL data indicate that these members of the adult Black population evidence the largest Black-White literacy gaps.
Although the direct impact of the prejudicial policies of the 20th century on literacy is important, the indirect impact of these policies likely has a greater and longer-lasting effect. The indirect impact of these policies on the literacy of the Black population is a function of the relation between the literacy of a child and the literacy of the parent and grandparent. There are strong and almost universally recognized effects found between parental, especially maternal, educational attainment level and children’s academic performance (e.g., Baydar, Brooks-Gunn, & Furstenberg, 1993; Fryer & Levitt, 2004; Leibowitz, 1977; Phillips, Brooks-Gunn, Duncan, Klebanov, & Crane, 1998). Although much of the data linking parental education and children’s academic performance are correlational, there is reason to believe that there are causal influences that likely manifest in the home environment. For example, early joint book reading has been found to have a strong effect on later literacy (Bus, van Ijzendoorn, & Pellegrini, 1995), and frequency of participation in this activity is positively associated with parents’ higher educational attainment (Yarosz & Barnett, 2001). Furthermore, performance of Head Start students on the Peabody Picture Vocabulary Test–Revised (PPVT-R) improved the most for those students whose parents participated in joint reading of books sent home (Whitehurst et al., 1994).
Support for the cumulative effect of low literacy and prejudicial policies across generations is found in a study by Borjas (1994). Borjas used U.S. Census data from 1910 to 1980 (and a variety of other data sources) to examine how the literacy level of one’s ancestors predicts educational attainment and wages generations later. Using U.S. Census data, he compared the literacy of White Americans, Black Americans, and immigrants from the “Great Migration” that occurred between 1900 and 1910, he found that 96% of White U.S.-born Americans, just 77% of immigrants, and 69% of Blacks were literate (Borjas notes that the self-reported literacy could be in English or a different language). The second-generation (1940 Census) immigrants made progress in wages and educational attainment at levels predicted by the literacy level of the 1910 generation of immigrants, whereas this generation of Blacks, who at the time were still in underfunded segregated schools, did not make such fast progress. By 1980, Blacks’ wages were similar to those predicted by the 1910 literacy rate and increased at a rate similar to that of wages of third-generation immigrants; however, educational attainment levels remained 1 year behind what was predicted by the 1910 literacy rate and the rate of educational attainment increase by the third-generation immigrants. These data demonstrate that group illiteracy plus the impact of prejudicial policies impeded the progress of Blacks more than group illiteracy alone impeded the progress of immigrants. Furthermore, this analysis demonstrates that the impact of a group’s illiteracy level in 1910 was still felt in 1980.
In sum, the direct and indirect impact of prejudicial policies of the 19th and 20th centuries on literacy likely continue to affect the literacy levels of the vast majority of the adult Black population. This impact was (and likely continues to be) felt through inferior school environments, lower levels of parental education, and various policies that restricted access to higher education and job opportunities. Next, we discuss how facilitating higher levels of educational attainment may be a particularly effective means of decreasing the adult Black-White literacy gap.
Reducing the Black-White Literacy Gap by Facilitating Educational Attainment
Our data suggest that the overall drop in the Black-White literacy gap is largely attributable to the achievement of higher levels of educational attainment by more Blacks. Furthermore, our analysis shows that Blacks’ literacy gain as they move up the educational achievement ladder is equivalent to Whites’ literacy gain. 5 Movement up the educational attainment ladder may be a particularly effective means of increasing literacy because literacy and educational attainment are likely recursive processes. That is, educational attainment will positively affect literacy, and literacy will positively affect educational attainment. Thus, movement up the educational ladder can improve literacy, and this improvement of literacy can help the further movement up the educational ladder.
Facilitating higher education attainment by Blacks has the added, perhaps even more important, benefit of mitigating the Black-White literacy gap in the children of those who achieved higher educational attainment. This is true because (a) offspring of those with higher educational attainment will be less likely to enter the educational system behind their peers (Brooks-Gunn, Klebanov, & Duncan, 1996), and (b) offspring of those with higher educational attainment will be more likely to attain higher levels of attainment themselves (Black & Sufi, 2002). One of the best predictors of college enrollment is parental education level (Black & Sufi, 2002; Kane, 1994). Kane (1994) found when using the Current Population Survey (CPS), a monthly household survey conducted by the Bureau of the Census for the Bureau of Labor (Kane, 1994), found that a Black child with two college graduates as parents was 85% more likely to attend college than a Black child with two high school dropouts as parents, even when holding family size and income constant. Indeed, the recent phenomena of Blacks of lower socioeconomic status (SES) being more likely to attend college than lower-SES Whites can be explained by the very rapid increase in the percentage of Black mothers and fathers of this cohort who graduated high school compared to Black mothers and fathers in the past (Black & Sufi, 2002; Kane, 1994). For example, Black and Sufi (2002), who also used the CPS, found that in 1968, almost 70% of Blacks had mothers who had not graduated high school, compared to about 35% of Whites. Although the percentage of those who reported that their mothers had not graduated high school decreased significantly in the subsequent decades, the percentage dropped more sharply for Blacks than Whites. Just 20 years later, in 1988, about 25% of Blacks said that their mothers had not graduated high school, compared to 10% of Whites. Thus, facilitating the movement of Blacks up the educational attainment ladder benefits the individual who achieves a higher educational attainment as well as the offspring of those who achieve higher educational attainment.
Because educational attainment is strongly associated with occupational and economic status (Sum, 1999), we suggest that interventions to increase parental education attainment would have the added benefit of having an impact on narrowing the kindergarten literacy gap. For example, the relatively poor long-term academic performance of Head Start students may be less a reflection on the program and more a result of tremendous impediment to a child’s literacy and academic achievement posed by low maternal educational attainment. Given the very low educational attainment of parents of Head Start children, it would be difficult to assess a statistical relation between parental educational attainment and student performance. For example, Currie and Thomas’s (1995) meta-analysis found no effect of educational attainment on performance of Head Start students, largely because the attainment level of White and Black mothers was so low, on average just 11 years. A similar problem existed in Phillips, Brooks-Gunn, et al.’s (1998) study that relied on a sample that oversampled from the lower-SES population. Nevertheless, Phillips, Brooks-Gunn, et al. did observe that an extra year of school for the mother had more of an effect on Black children’s PPVT-R scores than White children’s. Studies are needed that use samples with more variability in maternal educational attainment.
One of the obvious ways to increase Blacks’ educational attainment—affirmative action in postsecondary education—already exists. Unfortunately, public support has dwindled for affirmative action in recent years. Whereas in 1995, 55% of Americans expressed support for affirmative action (Paul, 2003), in 2007, the Gallup Poll reported that just 23% of Americans believe race or ethnic background should be considered in the college admittance process (Saad, 2007). Highly publicized movements in California and Michigan in recent years may have influenced public opinion. Both states have passed state constitutional amendments banning race and gender from being a consideration in public university acceptance and government hiring and contracting (Goodman, 2007; Williamson & Strauss, 2006). California’s amendment, called Proposition 209, was passed about 10 years ago and had immediate negative effects on minority college acceptance to higher education. In 1996, the year it took effect, both the University of California–Los Angeles and the University of California–Berkeley reported that Black and Hispanic enrollment fell by half (Williamson & Strauss, 2006). The effects in Michigan, which just passed its amendment in 2007, remain to be seen.
Affirmative action was implemented to promote access to education and employment to redress the effects of past discrimination. The removal of affirmative action from public policy is tantamount to holding the position that past discrimination no longer affects access to education and employment. Our analysis of the current and past data indicates that the effects of the past discriminatory policies are still negatively affecting the literacy of Blacks. The lower literacy levels resulting from these policies hinder acceptance into higher education—as can be seen by the dramatic reduction of accepted Blacks in the University of California–Berkeley. Our analysis also demonstrates that Blacks and Whites will gain equally from access to higher education. More importantly, however, the data suggest that the Black-White literacy gap may be reduced most effectively through facilitating Blacks’ access to higher education. Thus, whereas eliminating affirmative action has the potential to reverse some of the literacy gains made in recent years, strengthening the program has the potential to hasten the elimination of the Black-White literacy gap.
Limitations
The data demonstrating a reduction in the adult Black-White literacy gap between 1992 and 2003 are clear. The literacy data were drawn from the most comprehensive assessments of adult literacy in the United States. Nonetheless, the conclusions drawn about the source of the reduction should be considered with some caution. The analyses assessing the source of the reduction were correlational; therefore, no direct causal connection can be conclusively made. Furthermore, the conclusions drawn from our analysis of the trend in the adult Black-White literacy gap across age groups depend on the assumption that at least part of the variance in these data can be attributed to education changes. Although this assumption may not be difficult to demonstrate, as of yet, it is still an assumption.
Conclusion
We have examined the Black-White literacy gap in detail using the most comprehensive assessments of adult literacy in the United States: the 1992 NALS and the 2003 NAAL. Our analysis shows that the Black-White literacy gap is decreasing though still sizable, that Blacks and Whites garner equal gains from advancing in educational attainment, and that the decrease in the Black-White literacy gap is likely a result of more Blacks moving up the educational attainment ladder. We reviewed the history of the Black-White literacy gap and analyzed the extant literature addressing the factors that influence literacy. We conclude that facilitating movement of Blacks up the educational attainment ladder is an increasingly overlooked and effective means of the long-term reduction of the Black-White literacy gap.
Footnotes
This publication is intended to promote the exchange of ideas among researchers and policy makers. The views expressed in it are those of the author and do not necessarily reflect the position of the U.S. Department of Education.
The author(s) declared no potential conflicts of interest with respect to the research, authorship, and/or publication of this article.
This research was funded by a subcontract with the National Center for Education Statistics, an arm of the Institute for Education Sciences.
Notes
References
Supplementary Material
Please find the following supplemental material available below.
For Open Access articles published under a Creative Commons License, all supplemental material carries the same license as the article it is associated with.
For non-Open Access articles published, all supplemental material carries a non-exclusive license, and permission requests for re-use of supplemental material or any part of supplemental material shall be sent directly to the copyright owner as specified in the copyright notice associated with the article.