
Abstract
To assess the robustness and sensitivity of the findings in Delmas, Nairn-Brich, and Lim, we conduct a replication and an extension study. In the replication, we use their research design but analyze another time frame. In our extension, we furthermore expand the geographical scope, and use another carbon performance measure as well as a different set of control variables. We show that the finding that higher carbon emissions are associated with higher short-term financial performance is very robust. By contrast, we also find strong evidence for higher carbon emissions being associated with higher long-term financial performance. This outcome is supported by several supplementary analyses and robustness checks. We derive theoretical implications for the debate on tackling grand challenges. Since there seem to be negative financial performance implications for firms reducing carbon emissions, we highlight a clear need for further policy intervention to pave the way for a low-carbon economy.
Introduction
The article by Delmas et al. (2015) significantly contributed to the long-standing debate on the link of corporate social and corporate financial performance (e.g., Orlitzky et al., 2003). Their results suggest that higher carbon emissions are associated with higher return on assets (ROA), while at the same time investors apparently anticipate the potential long-term risks of high-carbon emissions, which is manifested in a lower level of Tobin’s q. Thus, their study suggests that reducing carbon emissions may hurt financial performance in the short-run but is beneficial in the long-run.
We find these results very intriguing and seek to replicate Delmas et al.’s (2015) study for a longer time period, as well as extend it to a larger geographical scope and a different set of control variables in a second step. The basic motivation for this extension is that Delmas et al. (2015) analyze a U.S. sample until 2008 and climate change has gained immense relevance since 2008, also outside the United States. For example, several global investor initiatives increasingly emphasize the urgent need to address climate change (e.g., UNEP FI, CERES Investor Network, International Investor Group on Climate Change, UN PRI, Climateaction 100+). Furthermore, regulatory efforts in the climate change context have intensified, especially in Europe. This can be illustrated by the recent EU action plan “Financing Sustainable Growth,” as well as established policies, such as the EU Emissions Trading System (EU ETS), the renewable feed-in tariff in Germany, or the Climate Change Act in the United Kingdom. These developments raise the basic question whether the results found by Delmas et al. (2015) also hold true when using another time frame and a geographical scope beyond the U.S. context.
To assess the robustness and sensitivity of the findings and to provide additional evidence that helps build a cumulative body of knowledge (Ethiraj et al., 2016), we conduct a quasi-replication study (Bettis et al., 2016). To do so, we replicate and extend the existing research design of Delmas et al. (2015). First, the results of our replication suggest that more carbon emissions are associated with better short-term financial performance (ROA). This is in line with the results of Delmas et al. (2015). In contrast to Delmas et al. (2015), we do not find support for a positive association of higher carbon emissions and less long-term financial performance (Tobin’s q). Thus, in contrast to Delmas et al. (2015), we cannot provide any evidence indicating a more optimistic long-term perspective of investors for the time period until 2014. In a second step, in our extension of Delmas et al.’s (2015) study, we expand geographical scope by including European firms. We also use another method to measure carbon performance and select a different set of control variables. Surprisingly, we then even find very robust support for both, more carbon emissions being associated with higher short-term performance (ROA) as well as long-term performance (Tobin’s q).
With this replication and extension of Delmas et al.’s (2015) study, we reveal important insights on the robustness and sensitivity of the corporate carbon and corporate financial performance link. With regard to robustness, we find that the link of more carbon emissions and higher short-term financial performance is robust when analyzing another time frame, expanding the analysis to a broader geographical scope, and varying other parameters in the analysis. Regarding sensitivity, we show that the association of carbon emissions and long-term financial performance is sensitive to changes in the research design, such as analyzing a later time period. In several supplementary analyses and robustness checks, we provide evidence for the result that more carbon emissions being associated with higher Tobin’s q. In this way, we aim to contribute to building a cumulative body of knowledge, by assessing the robustness and sensitivity of the existing findings (Ethiraj et al., 2016).
Moreover, we derive theoretical implications for the more general research on tackling grand challenges. Climate change, as one of the great challenges of the 21st century (Howard-Grenville et al., 2014) requires collective coordinated action. Our study contributes an important perspective on potential reasons why the necessary actions fail to appear: currently, we do not see positive financial performance implications for firms that implement a carbon mitigation strategy. Without adequate incentives, market participants collectively fail to find solutions that are aligned with socially desired outcomes. The policy implication is that there is a clear need for more stringent climate regulations to achieve the targets of the COP21 agreement in Paris. Such regulations can prompt firms to develop and implement an effective carbon mitigation strategy and foster the leverage effect of financial markets for a low-carbon economy. While we find empirical support for the need for policy interventions in the climate change context, this outcome may be relevant for the entire debate on tackling grand challenges.
Related Literature and Background
In the related literature on corporate carbon performance and financial performance, besides Delmas et al. (2015), several studies provide empirical evidence that reducing carbon emissions has a negative impact on short-term financial performance (Iwata & Okada, 2011; Lee et al., 2015; Wang et al., 2014). As one explanation for this outcome, Misani and Pogutz (2015) argue that while a firm invests in carbon mitigation technologies, its competitors may still benefit from avoiding such expenditures. Moreover, Brammer and Millington (2008) observe that stakeholders may not immediately notice such improvements and, thus, it takes time for the benefits of differentiation to materialize. Delmas and Montiel (2009) further argue that cost savings that are attributed to better carbon performance largely depend on savings from liability and compliance costs, which can barely be realized in the short term. Slawinski and Bansal (2012) argue that, consequently, some of the potential benefits of better carbon performance may not be realized in a short-term period.
To capture long-term effects on financial performance, several studies look at more market-orientated measures of financial performance. One example may highlight the relevance of climate change regulations for a firm’s future risk-return profile: In 2009, Standard & Poor’s downgraded Drax, a U.K. power-generating company, owing in part to future business risks resulting from new European emissions trading rules (Barley, 2009). Examples like this support the expectation that corporate carbon performance affects investors’ perceptions about future profitability, which is being captured by market-based performance measurements (Dixon-Fowler et al., 2013; Peloza, 2009). Tobin’s q is a typical measure to capture such investors’ expectations (Aggarwal & Dow, 2012; Iwata & Okada, 2011; Matsumura et al., 2014). Several studies find a positive linkage between corporate carbon performance and Tobin’s q (Busch & Hoffmann, 2011; Misani & Pogutz, 2015). Baboukardos (2017) argues that carbon emissions are used by investors as a proxy for assessing firms’ unbooked future environmental liabilities (Clarkson et al., 2015; Matsumura et al., 2014).
The results shortly summarized above, a negative link of corporate carbon performance and short-term financial performance, and a positive link to long-term financial performance, is also what Delmas et al. (2015) find. In this study, we aim to study whether these results are (a) robust for another time period and (b) can be generalized to another geographical scope. While environmental awareness seems to be growing in different parts of the world, the United States were not the most proactive region in the climate change context during the period of investigation in Delmas et al. (2015): the United States did not ratify the Kyoto Protocol, a treaty that began to be enforced in 2005, the first year of our sample. Even though statewide or regional initiatives were formed in the United States—such as the California Climate Action Registry in 2001, the Chicago Climate Exchange in 2003, or the Regional Greenhouse Gas Initiative in 2003. By contrast, carbon regulations were enforced in Europe in 2005. Subsequently, three phases of the EU ETS were initiated, and several national regulations came into force, for example, the renewable feed-in tariff in Germany and the Climate Change Act in the United Kingdom. Thus, we replicate the results of Delmas et al. (2015) for a later period covering the years 2005-2014. In the following section, we describe our data and methods in detail and reflect on how we replicate and extend the original study design of Delmas et al. (2015).
Replication
Data and Sample
In our replication of Delmas et al.’s (2015) study, we use the initial study design. We replicate the analysis of Delmas et al. (2015) for the time frames 2005-2014. We use ROA as dependent variable, which is defined as the ratio of net income to total assets, as a measurement of short-term financial performance. Long-term financial performance is operationalized using Tobin’s q. It is calculated as the ratio of market value of assets and liabilities divided by book value of assets. To measure the independent variable of corporate carbon performance, we use total greenhouse gas emissions (tons of CO2-equivalent) encompassing direct as well as indirect emission scopes. As in the original study, this data were obtained from Trucost. 1 As in Delmas et al.’s (2015) study, we include control variables measuring other environmental factors such as the Trucost variables water abstraction and general waste and Kinder, Lydenberg, Domini (KLD) concerns and KLD strengths. We also include a variable to control sales growth. We control for firm size using a firm’s market value as a measure of firm size. We also control for firm risk or leverage and for capital intensity. We use the ratio between a firm’s capital expenditures and equity to estimate capital intensity.
Analysis and Results
As in Delmas et al.’s (2015) study, we use ordinary least square (OLS) regression analysis to estimate the relation between corporate carbon performance and financial performance. Likewise, we use a firm fixed effects model for the analysis to better account for firm heterogeneity, as the intercept terms vary for individual companies.
Table 1 presents the descriptive statistics and pairwise correlations and Table 2 presents the estimation results of the replication analysis for the time frame 2005-2014. The coefficient is positive and statistically significant for ROA. This result implies in line with Delmas et al. (2015) that more carbon emissions are associated with higher ROA. In contrast to the initial findings, we do not find a significant link of carbon emissions and Tobin’s q. In addition, we also analyzed the time frame 2005-2008 in order to investigate if we obtain the same results for this shorter time period which is closer to the initial study (2004-2008). We obtain no significant results at all. This outcome can be explained by the circumstance that there is no longer access to the initial data set and Trucost apparently made methodological changes.
Correlation Coefficients (Replication of Delmas et al., 2015).
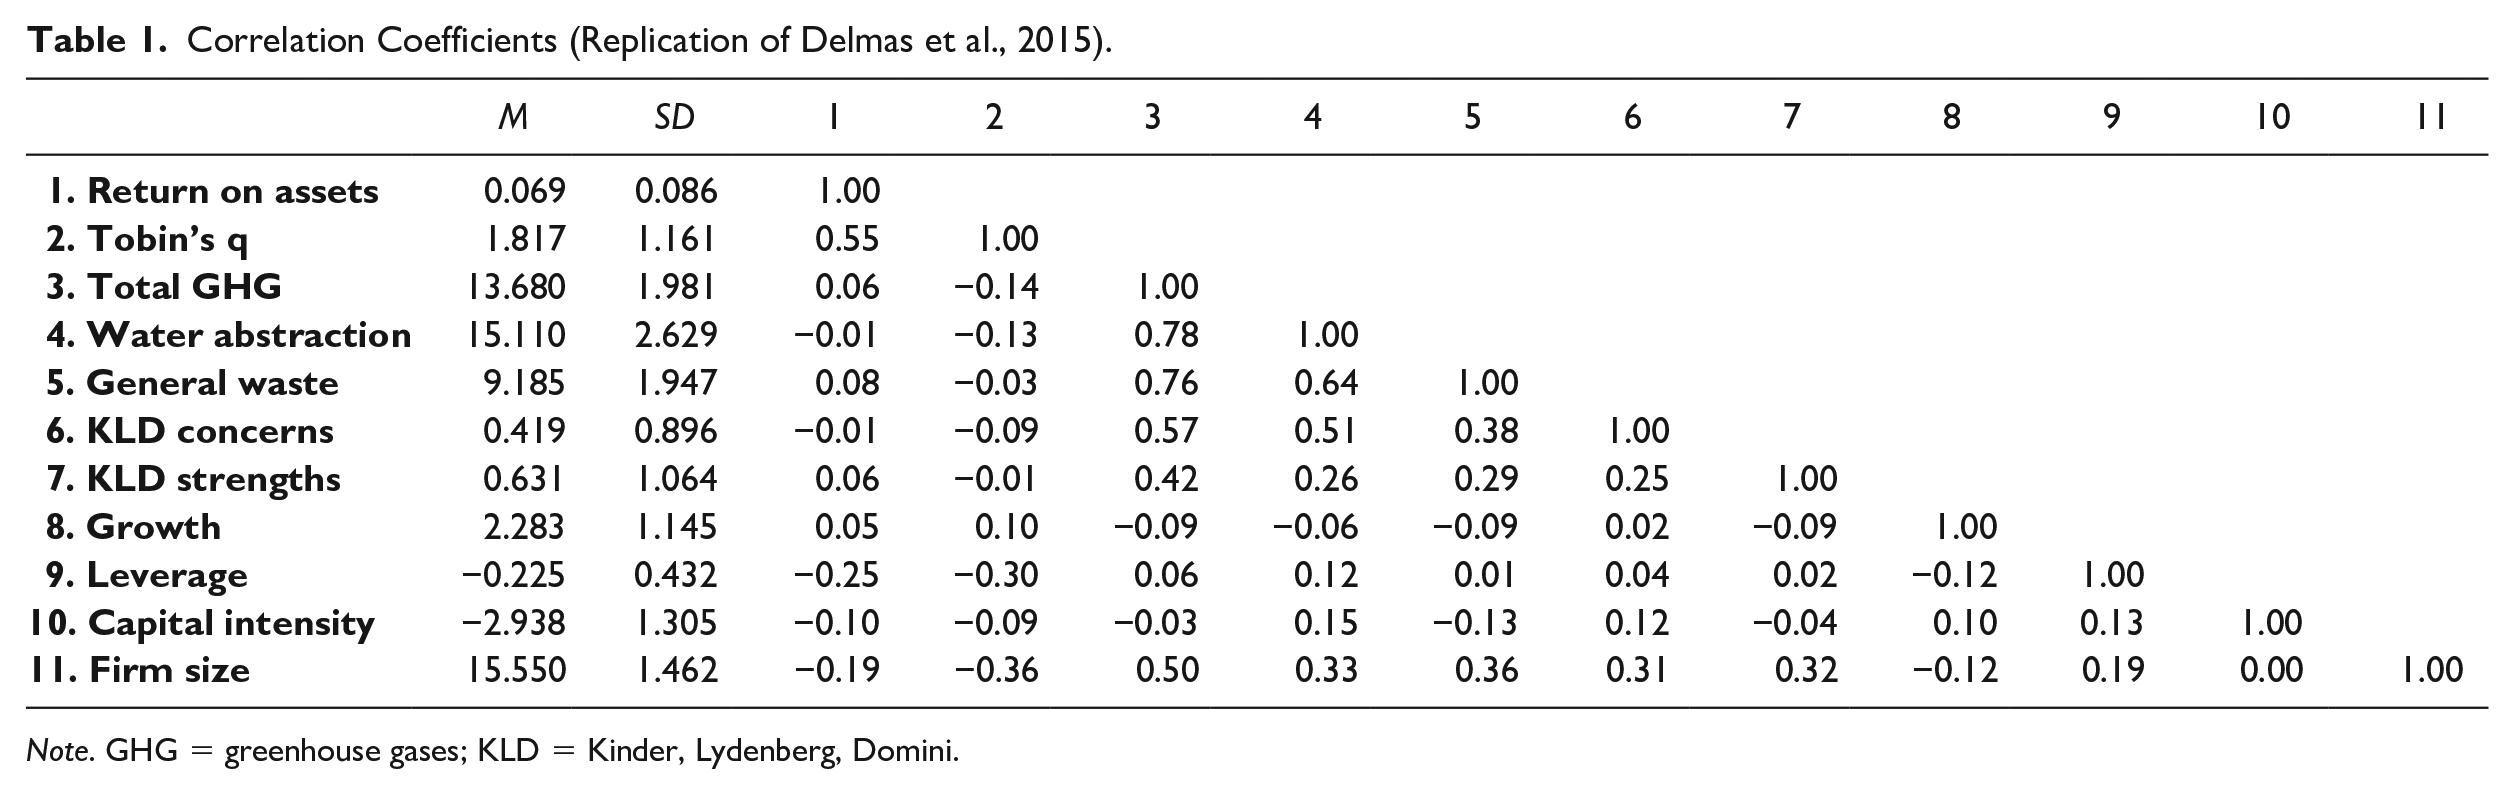
Note. GHG = greenhouse gases; KLD = Kinder, Lydenberg, Domini.
Firm-Fixed Effects Regression Analysis of GHG Emissions on ROA and Tobin’s q (Replication of Delmas et al., 2015) for the Period of 2005-2015.
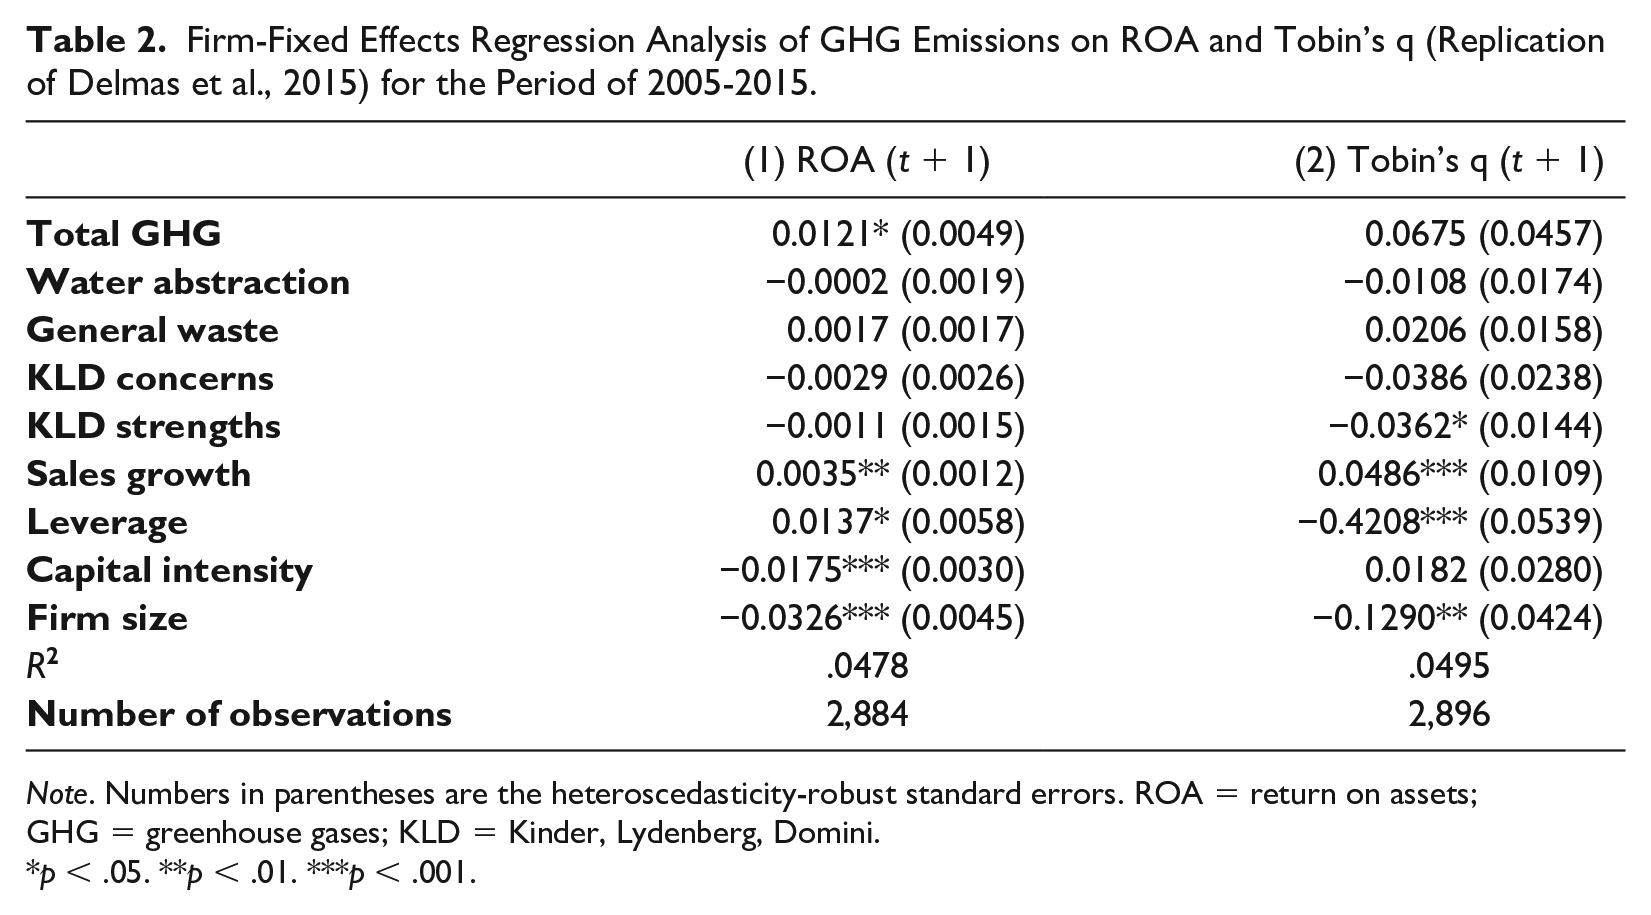
Note. Numbers in parentheses are the heteroscedasticity-robust standard errors. ROA = return on assets; GHG = greenhouse gases; KLD = Kinder, Lydenberg, Domini.
p < .05. **p < .01. ***p < .001.
Extended Analysis
Data and Sample
In the second part of our analysis, we extend the analysis of Delmas et al. (2015) by including European firms into the geographical scope, measuring carbon performance as intensities and adjusting the control variables. Our sample covers 10 years (2005-2014) of data on carbon emissions and includes 37,253 firm-year observations for 5,663 publicly listed stock companies. Trucost data reports and calculates environmental impacts across firm operations and supply chains for a worldwide sample. We merged that data with financial data and general firm information from Thomson Reuters Datastream. The absence of sufficient financial information is the primary reason for a large number of dropouts. The panel is unbalanced as the number of firm-year observations is not always the same. Outliers were accounted for by winsorizing the lowest and highest 1st percentiles of all variables used in the analysis. We merged that data with financial data and general firm information from Thomson Reuters Datastream. The absence of sufficient financial information is the primary reason for a large number of dropouts. The final sample is composed of a panel data set of 27,986 firm-year observations, which covers 4,873 companies. The panel is unbalanced as the number of firm-year observations is not always the same. Outliers were accounted for by winsorizing the lowest and highest 1st percentiles of all variables used in the analysis.
We again use ROA as a measurement of short-term financial performance and Tobin’s q as measurement of long-term financial performance. Whereas Delmas et al. (2015) rely on total greenhouse gas emissions (Scopes 1-3), our models focus on Scope 1 which covers direct emissions from sources that are owned or controlled by the company. The reason is that we are especially interested in the effect that stringent climate regulations have on companies. We include Scopes 1 to 3 emissions as a supplementary analysis. We measure corporate carbon performance by the inverse value of a firm’s carbon intensity. A firm’s carbon intensity is defined as the ratio of CO2e-emissions to sales. We decided to use this relative measure to determine a firm’s carbon performance since it allows better incorporations of growth and size related effects. As compared with absolute emission levels, this allows us to include special effects related to acquisitions, mergers, or process outsourcing as well as emission variations due to varying production capacities and changes in overall economic conditions (Busch & Lewandowski, 2018). We use the inverse value of carbon intensity since this indicates that low amounts of carbon emissions refer to superior carbon performance and vice versa (Misani & Pogutz, 2015).
One potential issue inherent to empirical analyses is the presence of endogeneity, which occurs when the explanatory variable is correlated with the error term. There are two common causes of endogeneity. The first is the presence of a confounding variable, which is an extraneous variable that correlates with both the dependent and independent variables. In the context of our study, a confounding variable (e.g., management skills which cannot be measured or observed) would influence both the level of financial performance and the level of carbon performance. In this case, the model may suffer from omitted variable bias and the explanatory variable is correlated with the error term. Another cause of endogeneity is the presence of simultaneous causality, which would suggest that carbon performance and financial performance are correlated in a bidirectional way (Waddock & Graves, 1997). In line with previous studies (Brouwers et al., 2015; Delmas et al., 2015; Misani & Pogutz, 2015; Trumpp & Guenther, 2017), we use the lagged values of carbon performance, thus relocating all observations by one year. By doing so, we specify our assumption that carbon performance affects financial performance and seek to address the presence of endogeneity. By using the lagged values of carbon performance, we also account for the delayed release of carbon emission data (Trumpp & Guenther, 2017). To extend the geographical scope of the sample, we add to the companies located in the U.S. companies that are located in the 28 member countries of the European Union, as well as Iceland, Norway, and Switzerland. Furthermore, we split the sample of European companies into two groups according to their regulation status under the EU ETS. 2
We use a multivariate analysis framework and include several control variables that are highly likely to determine the dependent variables. Thereby, we reduce the risk of omitted variable bias and control for potential sources of unobserved firm heterogeneity. Applying the method of stepwise regression, we chose additional predictive variables that may also have an effect on corporate financial performance. After we applied this procedure repeatedly, we ended up with a selection of control variables that proved to be suitable to estimate the link between corporate carbon and financial performance based on a sound statistical method. We include a variable to control for firm size. Large companies tend to be more profitable than smaller companies (Trumpp & Guenther, 2017) because larger firms have longer histories and more assets and are therefore less likely to default (Jung et al., 2014). We use a firm’s market value as a measure of firm size and expect a positive relationship with financial performance. We also control for firm risk or leverage. High levels of leverage increase the probability of bankruptcy and default risk (Chen & Silva Gao, 2011; Jung et al., 2014). This may result in inferior banking and supplier conditions that could affect overall profitability and stock market performance. Thus, leverage is likely to be a determinant of financial performance. We use the ratio between a firm’s long-term debt and total assets to estimate firm risk and expect a negative relationship between leverage and financial performance. We also control for capital intensity (Brouwers et al., 2015; Clarkson et al., 2015; Delmas et al., 2015; Fujii et al., 2013; Griffin et al., 2017; Iwata & Okada, 2011; Jung et al., 2014; Wang et al., 2014). High levels of capital intensity indicate that a company invests in growth opportunities and is more profitable than less capital-intensive companies. We use the ratio between a firm’s capital expenditures and equity to estimate capital intensity (Trumpp & Guenther, 2017) and expect a positive relationship between capital intensity and financial performance. Finally, we control for liquidity or cash flow (Aggarwal & Dow, 2012; Jung et al., 2014; Trumpp & Guenther, 2017). The larger a firm’s generated cash flow, the more funds are available for investments that increase financial performance. Furthermore, the larger a firm’s generated cash flow, the smaller the probability of failure, which results in better lending conditions. We use the ratio between funds from operations and net sales or revenues to estimate cash flow (Aggarwal & Dow, 2012; Trumpp & Guenther, 2017) and expect a positive link between cash flow and financial performance.
Econometric Analysis and Results
Table 3 presents the descriptive statistics and pairwise correlations. There is a negative association between carbon performance and financial performance if measured as ROA, whereas the correlation coefficient is slightly positive for Tobin’s q. All bivariate correlations for the explanatory variables are below ±0.5 and collinearity diagnostics show that variance inflation factors (VIFs) are below 2 for all explanatory variables (mean VIF = 1.38). Therefore, our analysis is not subject to the threat of multicollinearity.
Descriptive Statistics and Correlations.
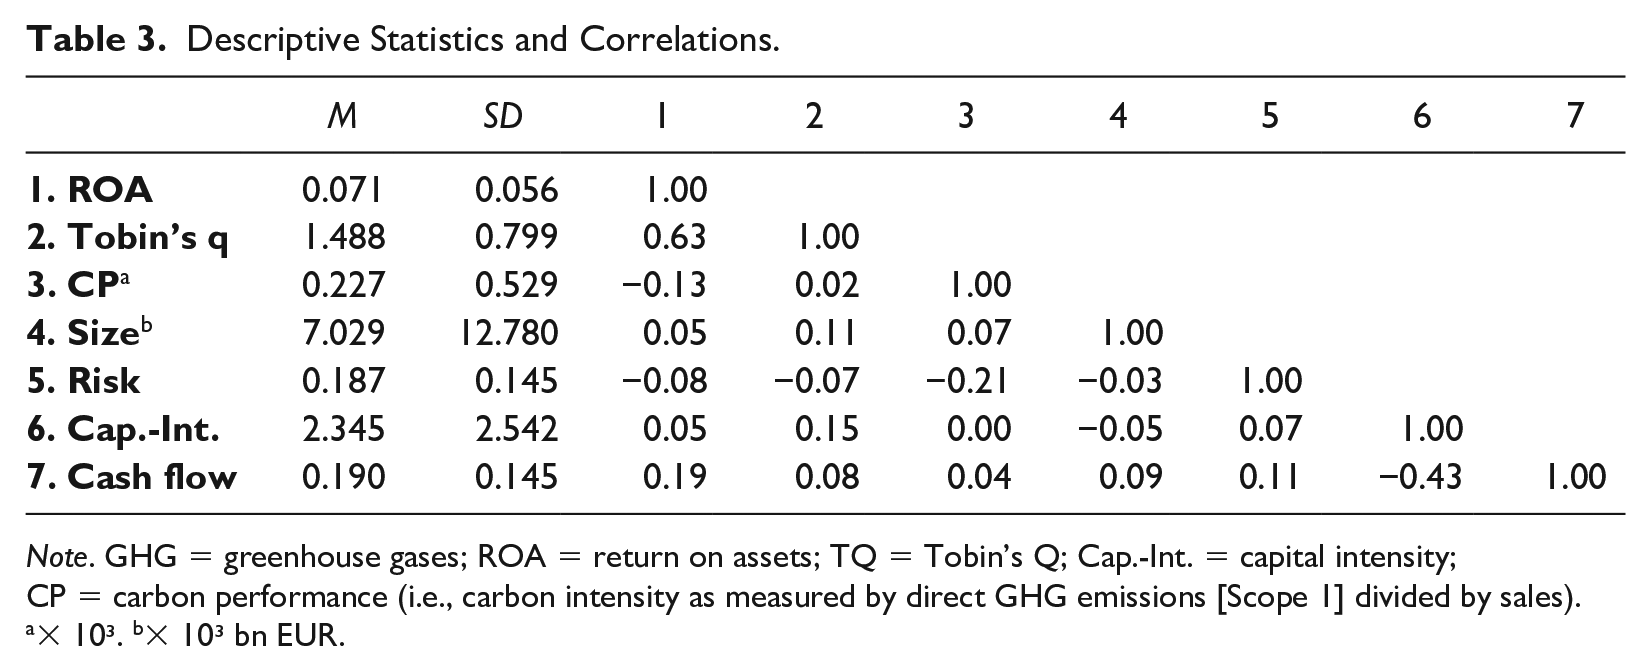
Note. GHG = greenhouse gases; ROA = return on assets; TQ = Tobin’s Q; Cap.-Int. = capital intensity; CP = carbon performance (i.e., carbon intensity as measured by direct GHG emissions [Scope 1] divided by sales).
× 10³. b× 10³ bn EUR.
We use OLS regression analysis to estimate the relation between corporate carbon performance and financial performance. We use a firm fixed effects model for our analysis to better account for firm heterogeneity as the intercept terms vary for individual companies. We prefer the fixed effects model over the random effects model for two reasons. First, we assume that company-specific characteristics, such as management capabilities or brand image, significantly influence carbon performance. More technically, unobserved firm characteristics may correlate with the explanatory variable and thus cause omitted variable bias. The fixed effects model controls for such time-invariant firm characteristics (including a firm’s industry context). Second, a Hausman specification test supports the choice of a fixed effects model over an alternative random effects model. Using conventional analysis tools, we detected that the dependent variables are related to the independent variables in a nonlinear function, which we address in detail in our robustness checks below. To account for the presence of nonlinearity, we transformed the dependent and independent variables using logarithms. Thus, we estimate a log-log regression function where the coefficients show the elasticity (percentage change) of the independent variables with respect to the dependent variables. All results are estimated based on heteroscedasticity-robust standard errors.
Table 4 presents the estimation results of the extension analysis. The explanatory power of the models as inferred from the R2 is .156 for ROA and .478 for Tobin’s q. All coefficients for the control variables are significant and show relationships in the direction as expected. The linkage between corporate carbon and financial performance is negative and statistically significant for both ROA and Tobin’s q. More precisely, a 1% increase in carbon performance is, on average, associated with a 0.055% decrease in ROA and a 0.033% change in Tobin’s q. The results imply that good carbon performance deteriorates a firm’s profitability and stock market performance.
Firm-Fixed Effects Regression Analysis of the Link Between Corporate Carbon and Financial Performance.
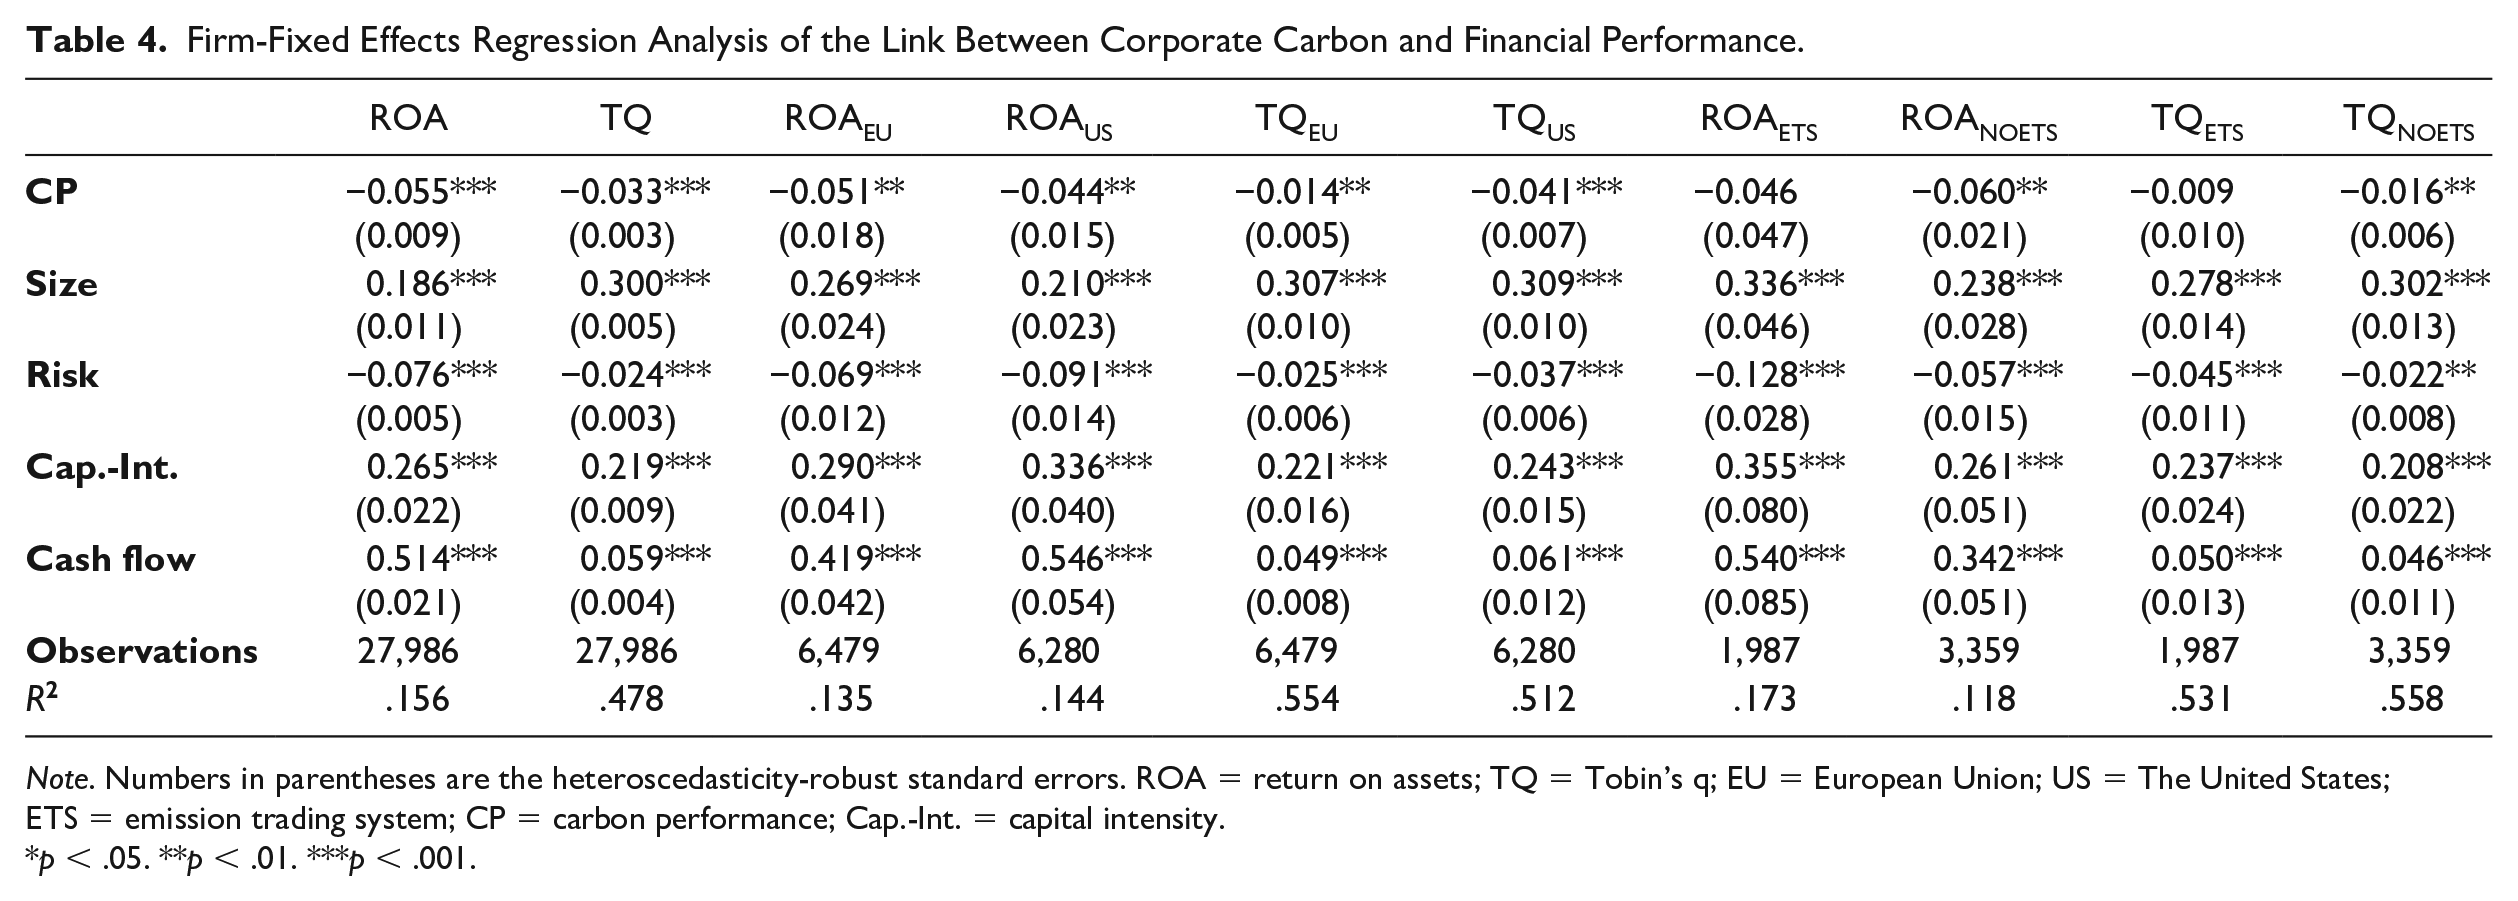
Note. Numbers in parentheses are the heteroscedasticity-robust standard errors. ROA = return on assets; TQ = Tobin’s q; EU = European Union; US = The United States; ETS = emission trading system; CP = carbon performance; Cap.-Int. = capital intensity.
p < .05. **p < .01. ***p < .001.
Our results for the European and U.S. subsamples show that carbon performance is significantly negatively related to ROA. The effect size is almost equal for Europe (−0.051) and the United States (−0.044) since there is only a marginal difference between European and the U.S. firms. With respect to Tobin’s q, we again obtain significantly negative results in both geographical contexts. However, the effect size is substantially smaller for Europe (−0.014) as compared with the United States (−0.041). When investigating the relevance of the EU ETS, we do not obtain any statistically significant results for the subsample containing the firms subject to carbon regulations. For the nonregulated firms, the results remain negative and significant. Following recent research (e.g., Hussain et al., 2019, Knight & Schor, 2014), we used a Z-test (Clogg et al., 1995; Paternoster et al., 1998) to analyze whether both pairs of coefficients are statistically different from each other. The differences in the coefficients for both pairs of coefficients (ROAETS vs. ROANOETS and TQETS and TQNOETS) were not found to be statistically different. Thus, even though our findings indicate that for regulated firms, we cannot find the negative relation between carbon and financial performance, we cannot draw final conclusions about the actual relation. Further research is needed to investigate the financial consequences of carbon emission regulations.
Supplementary Analyses and Robustness Checks
We conducted several supplementary analyses and robustness checks to investigate whether the results change substantially when altering the model specifications. We did this with the aim of increasing the reliability of our empirical results. Table 5 presents the results of our supplementary analyses and Table 6 shows the results of our robustness checks.
Supplementary Analyses.
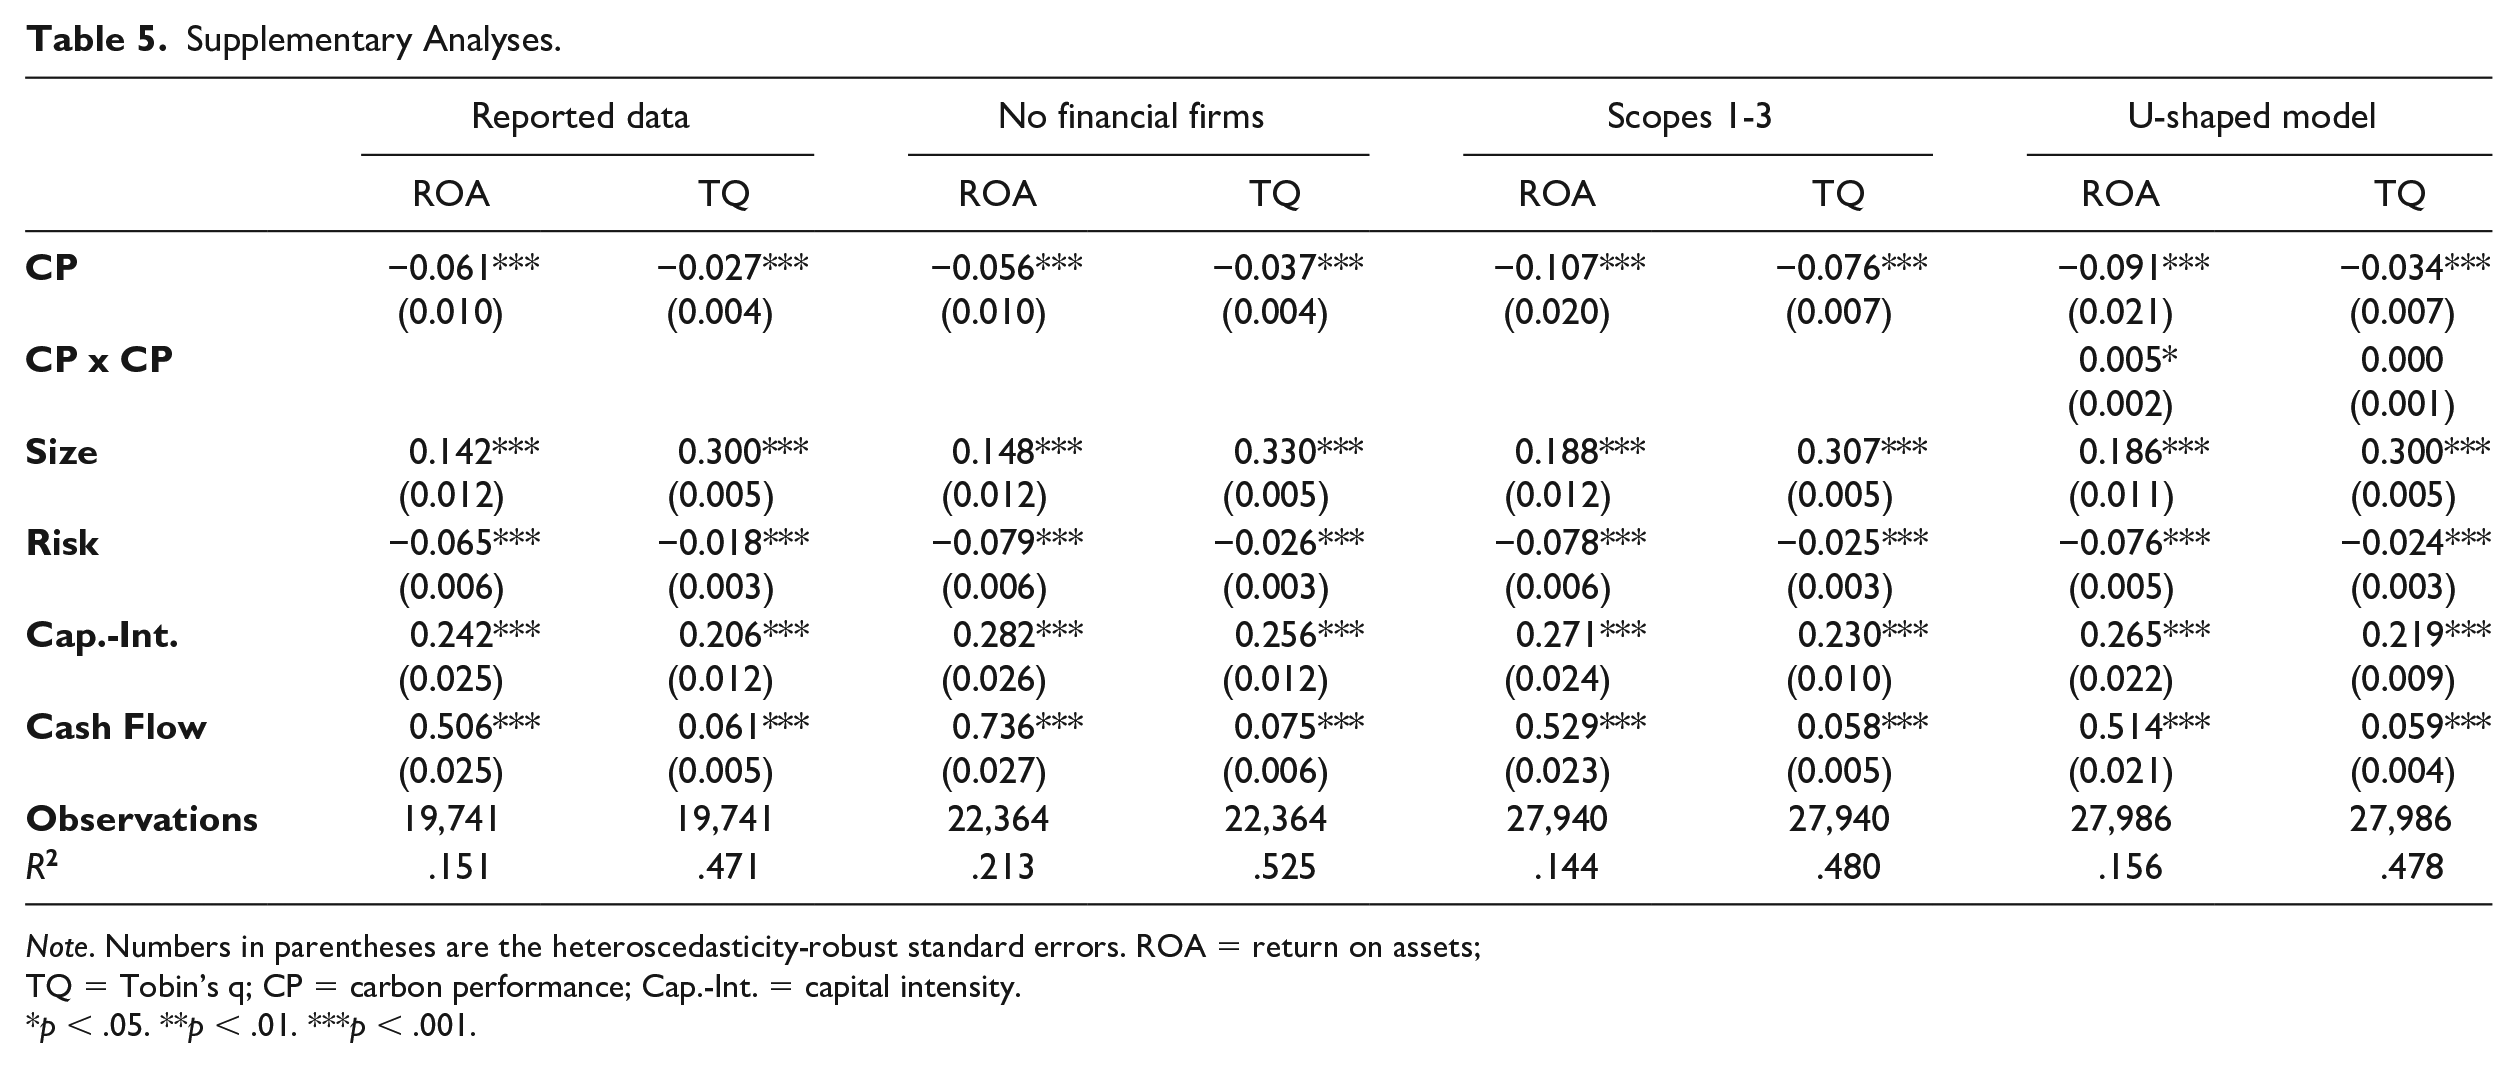
Note. Numbers in parentheses are the heteroscedasticity-robust standard errors. ROA = return on assets; TQ = Tobin’s q; CP = carbon performance; Cap.-Int. = capital intensity.
p < .05. **p < .01. ***p < .001.
Robustness Checks.
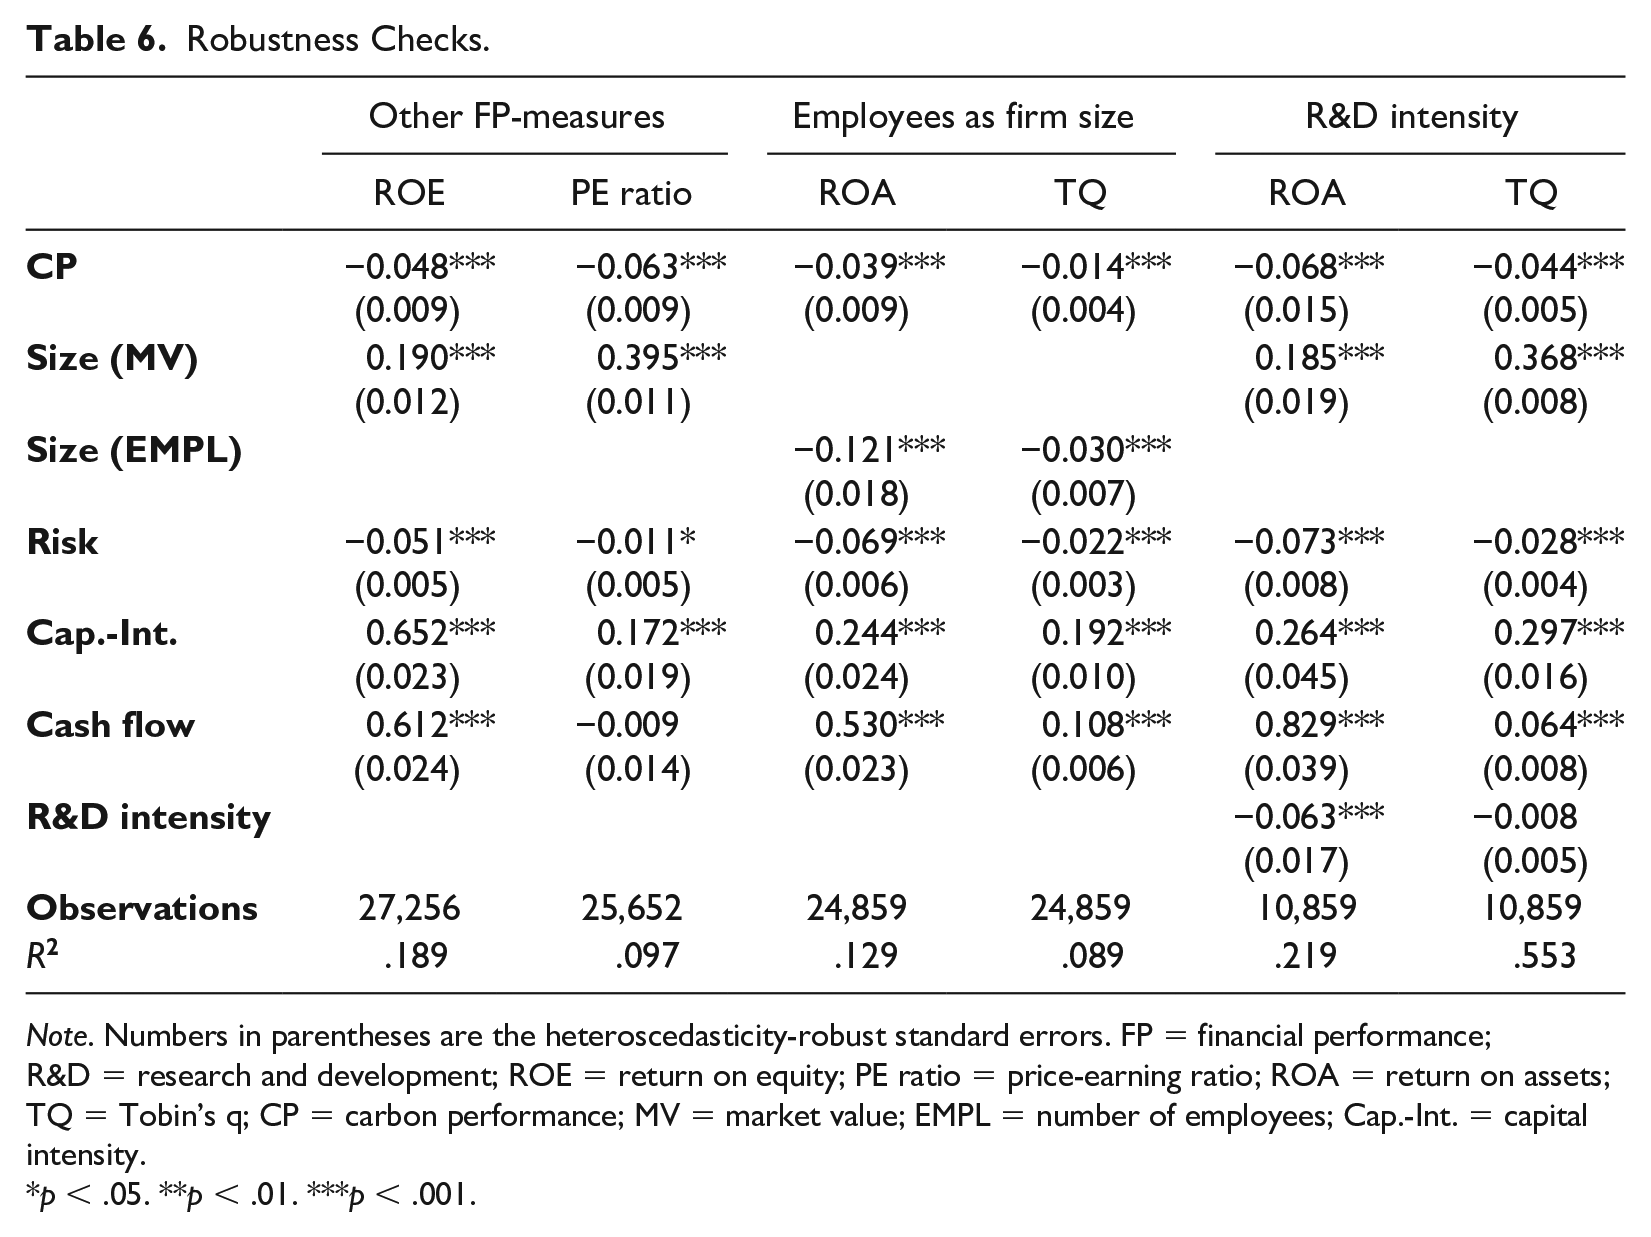
Note. Numbers in parentheses are the heteroscedasticity-robust standard errors. FP = financial performance; R&D = research and development; ROE = return on equity; PE ratio = price-earning ratio; ROA = return on assets; TQ = Tobin’s q; CP = carbon performance; MV = market value; EMPL = number of employees; Cap.-Int. = capital intensity.
p < .05. **p < .01. ***p < .001.
Reported Data
We analyzed differences related to the disclosure of carbon emission data. Trucost data is composed of a mix of different data sources. Approximately 15% of the data are extracted from the CDP database. This includes emission figures directly reported to CDP, as well as estimates derived from reported fuel usages. Around 11% of Trucost’s data are data provided in corporate environmental or corporate social responsibility (CSR) reports. This includes exact values of emission figures as well as values derived from reported fuel uses or approximations from charts and graphs. Around 4% of the emission data is derived from information disclosed in personal communication with company employees.
To ensure the reliability of estimated and derived emission data, we split up the sample according to the data sources and estimate the linkage between carbon and financial performance separately for reported data only (emission data from CDP, data published in CSR reports, and data from personal communication). The model “Reported data” in Table 5 shows that the main results remain statistically significant and show a negative sign for both measurements of financial performance. Thus, we feel confident claiming that our results are not biased by data quality issues.
Financial Service Providers
In line with several empirical studies (Chapple et al., 2013; Clarkson et al., 2015; Delmas et al., 2015; Trumpp & Guenther, 2017; Wang et al., 2014), we did not exclude companies from the financial service sector. Other studies, however, explicitly dropped financial service providers. Jung et al. (2014), for example, excluded financial service providers from their sample because they are subject to specific regulations, which makes their approach to capital market decisions fundamentally different from firms in other industries. Furthermore, Delmas et al. (2015) argue that financial service providers tend to have lower ROAs and comparatively low-carbon emissions, so the inclusion of financial service providers runs the risk that banks or insurance companies influence a study’s empirical outcomes.
We tested for the relevance of the financial service industry by performing a robustness check based on a reduced sample that excludes financial service companies. The model “No financial firms” in Table 5 presents the estimation results. The empirical outcomes are largely identical to the results of our main analysis. Thus, we find no evidence that financial service companies systematically affect our empirical results.
Scopes 2 and 3 Emissions
Trucost reports data on carbon emissions in line with the emission scopes proposed in the Corporate Accounting and Reporting Standard of the greenhouse gases (GHG) Initiative (World Business Council for Sustainable Development & World Resources Institute, 2004). The standards of this GHG Protocol provide guidance for companies in quantifying and reporting their carbon emissions. Scope 1 covers direct emissions from sources that are owned or controlled by the company. Scope 2 refers to indirect carbon emissions from the generation of purchased electricity consumed by equipment or operations that are owned or controlled by the company. Scope 3 covers all indirect emissions, other than electricity emissions, that result from company activities, but result from sources not owned or controlled by the company.
Our models focus on Scope 1 emissions because direct emissions are subject to regulation in the EU, whereas indirect emissions are not regulated under the EU ETS. Nevertheless, we also estimate the link for all emission scopes (the sum of Scopes 1-3) to capture a firm’s carbon performance along its entire value chain. The model “Scopes 1-3” in Table 5 presents the estimation results. The results are largely identical to those presented in our main analysis. The results are also identical for carbon performance when considering Scopes 1 and 2 emissions only (not reported). Thus, our findings indicate that the emission scope does not significantly affect our empirical outcomes.
Curvilinear Relationship
The functional form of the relationship between corporate environmental and financial performance has been subject to debate. Wagner et al. (2002, p. 135) suggest that the shape of the relationship could be an “inversely U-shaped curve with an optimum level of environmental performance.” Brammer and Millington (2008) also propose a U-shaped relationship, which assumes that payoffs are the highest with very low and very high levels of corporate social performance. This claim is supported by subsequent empirical findings (Barnett & Salomon, 2012).
The functional form has also increasingly been applied in research on the link between carbon performance and financial performance. Hatakeda et al. (2012) and (Tatuso, 2010), for example, provide empirical evidence for a curvilinear link between carbon performance and accounting-based financial performance. Misani and Pogutz (2015) and Trumpp and Guenther (2017) provide evidence for a curvilinear link between carbon performance and both accounting- and market-based financial performance. In contrast, Fujii et al. (2013) find no empirical evidence for a curvilinear relationship between carbon performance and financial performance.
Given the increasing attention in empirical research to the shape of the relationship, we extend our basic model specification and include a quadratic term of carbon performance. Model “U-shaped model” in Table 5 shows the estimation results. Indeed, we find a U-shaped relationship between corporate carbon and financial performance for ROA. In contrast, our findings do not support a curvilinear link between carbon performance and Tobin’s q.
Financial Performance Measures
In line with Delmas et al. (2015), we used ROA as a measurement of short-term financial performance and Tobin’s q as a measurement of long-term financial performance. We collected data on other financial performance measures and replaced our dependent variables to analyze if our choice of financial performance variables drives our empirical outcomes. We used return on equity (ROE) instead of ROA as another measure of accounting-based financial performance, and a firm’s price-earning ratio (PE Ratio) instead of Tobin’s q as another measure of market-based financial performance.
The column “Other FP-measures” in Table 6 presents the estimation results. The findings indicate a negative association between carbon performance and ROE, as well as a negative linkage between carbon performance and PE Ratio. Thus, the empirical results are largely identical to those presented in the main analysis and we conclude that our empirical findings are not influenced by our choice of financial performance variables.
Firm Size
We used a firm’s market value as a measure of firm size. This could posit a problem because our measure for market-based financial performance, Tobin’s q, is calculated as the ratio of the sum of market value and liabilities divided by total assets. Thus, firm size may be analytically linked to one of our dependent variables. We collected data on the number of employees and replaced our variable for firm size to analyze if our choice of firm size measure influences our empirical findings.
The column “Employees as Firm Size” in Table 6 presents the estimation results. The findings indicate a negative association between carbon performance and ROA, as well as a negative linkage between carbon performance and Tobin’s q. Thus, the empirical results are largely identical to those presented in the main analysis and we conclude that our empirical findings are not influenced by our choice of firm size measure.
R&D Intensity
McWilliams and Siegel (2000) identify research and development (R&D) as an important determinant of firm performance and suggest that an empirical model would be wrongly specified if it is not controlled for R&D investments. However, empirical studies analyzing the link between carbon performance and financial performance do not always control for R&D. Those studies that do control for R&D often rely on samples comprised of manufacturing companies (e.g., Iwata & Okada, 2011) or focus on energy-intensive industries (e.g., Misani & Pogutz, 2015). Other studies, which rely on samples of firms from different industries, often refrain from including data on R&D to avoid reduced sample sizes. Wang et al. (2014), for example, remove R&D from their final sample because they find that data on R&D expenditures are mostly not accessible.
We extend our basic model specification to include R&D Intensity as a control variable. In line with other studies (Fujii et al., 2013), we assume a delay between R&D investments and observable improvements in financial performance. The column “R&D-Intensity” in Table 6 presents the estimation results. Since the results are largely identical to those presented in the main analysis, we conclude that our larger sample size model without R&D Intensity does not suffer from omitted variable bias.
Discussion and Conclusion
This study assesses the robustness and sensitivity of existing findings by replicating and extending Delmas et al.’s (2015) study. With regard to robustness, we find that the link between carbon emissions and short-term financial performance (ROA) is robust to various changes in the research design. As in Delmas et al. (2015), more carbon emissions are associated with higher ROA for our replication using a longer time frame as well as when expanding the research design to another geographical scope and adjusting other parameters. Regarding sensitivity, we show that the association of carbon emissions and long-term financial performance (Tobin’s q) is sensitive to changes in the research design. When analyzing another time frame (2005-2014), we do not find significant results. Instead, in the extended analysis, we do provide evidence of contradicting results: more carbon emissions are associated with higher Tobin’s q. This outcome is robust in several supplementary analyses and robustness checks. In this way, we aim to contribute to building a cumulative body of knowledge by revealing important insights on the robustness and sensitivity of the existing findings (Ethiraj et al., 2016).
The main difference in our replication, compared with the original study, is the time frame. In their study (which covers the period of 2004-2008), Delmas et al. (2015) conclude that investors might consider the likelihood of potential future carbon emissions when forming perceptions of future market conditions. This, in turn, might have motivated investors to favor firms with low-carbon emissions. This argument does not seem to hold true for the extended time frame of our study, which also covers more recent data (up to 2014): investors do not seem to perceive a firm’s lower carbon emissions as value driving. One interpretation for this outcome is that financial markets apparently do not anticipate a change in external conditions that would favor firms with a proactive stance toward climate change.
We find that lower carbon emissions are associated with lower Tobin’s q. While this is contradicting with Delmas et al. (2015), it is in line with several studies looking at market evaluations in the climate change context and using an event study design: Fisher-Vanden and Thorburn (2011) show that firms experience stock price drops when they announced joining the U.S. Environmental Protection Agency Climate Leaders program. Jacobs et al. (2010) found that voluntary emissions reductions in the United States were associated with negative market returns. Lyon et al. (2013) find similar results for China. Yet it appears paradoxical that several global investor initiatives are engaging companies to curb carbon emissions and to strengthen climate-related disclosure and at the same time there is currently no financial incentive for firms to proactively engage in emission reductions.
Even though these global investor initiatives increasingly emphasize the urgent need to address climate change, they lack powerful influence. We see three potential reasons why the current level of investors’ pressure does not exert the pressure needed for stimulating change: First, investor pressure might make a difference at the individual firm-level only in some cases (Hiatt et al., 2015). Since we do not control for investor pressure at the firm level, we cannot observe this effect. In general, our results illustrate that no such effect of investors’ pressure can be detected across the entire sample. Second, initiatives such CDP may primarily increase disclosure and transparency; however, investors as of yet do not utilize the insights from provided data, as they apparently consider carbon emissions not to pose a substantial risk. Efforts such as the recently released recommendations by the Task Force on Climate-related Financial Disclosures seek to overcome this issue. Third, some of the actions taken by firms are purely symbolic (Hiatt et al., 2015). As such, the pressure from various interest groups may lead toward more greenwashing and impression management (Cho et al., 2015). In this case, Callery and Perkins (2020) raise important insights on the manipulation of CDP reports. In sum, we come to one major conclusion: While adequate incentives can serve as a motivational factor that drives firms—as well as investors—to care about carbon emissions, the absence of such incentives may create trade-off situations between environmental and financial goals.
We derive one main theoretical implication from this insight. Climate change has been called one of the greatest challenges of the 21st century, which must be addressed through the collective action of numerous actors (Ferraro et al., 2015; Howard-Grenville et al., 2014; Jarzabkowski et al., 2019). Yet the absence of financial incentives seems to hold back the transformational action required to create an environment in which financial markets could leverage collective action. As the literature on grand challenges examines how individuals, groups, and organizations can mobilize attempts to overcome such deep-rooted problems, our study contributes an important perspective on potential reasons why the necessary actions do not occur. While we find empirical support for the need for policy interventions in the climate change context, this outcome may be relevant for the entire debate on tackling grand challenges. Future studies may build on our insight to further investigate the role of adequate incentives in tackling situations where market participants collectively fail to find solutions to grand challenges.
In terms of future research, our results suggest that empirical studies should be cautious when the results of econometric analyses propose different outcomes for ROA and Tobin’s q. Empirical studies suggest that—due to the positive correlation between ROA and Tobin’s q—a similar effect for both measures seems to be reasonable (Anderson & Reeb, 2003; Belkhir, 2009). Our study supports this argument in the climate change context. One limitation of our study is the general issue of endogeneity, which is the subject of several studies in this field. Even though we lagged our dependent variable for 1 year, we cannot ignore that corporate carbon and financial performance may reinforce each other. Another common issue with empirical studies in this field is the measure of carbon performance. The Trucost data comprises a mix of different data sources, of which about 50% are Trucost’s own estimations. As such, potential issues with the study could be data reliability and quality. However, we controlled for these concerns in our robustness checks. Furthermore, our results are robust in several other specifications. The empirical outcomes are largely identical when we remove financial service providers from the sample, as well as when we include R&D intensity as a control variable or extend the scope of considered carbon emissions. Therefore, we can present a fairly robust estimation of the current financial relevance of firms’ carbon emissions. Finally, we acknowledge that measures such as ROA are scaled ratios and that the use of such measures might lead to spurious findings, in particular given that most variables in the analysis are related to firm size. This is a general critique most of the studies in this realm face. Moreover, we use Trucost data to measure carbon performance which relies on self-disclosed data. While self-reported data provide the possibility to access data that hard to access otherwise (especially for Scopes 2 and 3 data), previous studies have shown that self-disclosure may not be truthful (Fabrizio & Kim, 2019; Kim & Lyon, 2015). Interpreting our results, one needs to be aware of this potential drawback of the utilized data.
The practical implication of this study is that there is a clear need for more stringent climate regulations. While there is evidence that there is a significant negative linkage between carbon and financial performance for nonregulated firms, we cannot state the same for firms regulated under the EU ETS. It appears that the regulation is relevant for both measures of corporate financial performance. One explanation for this interesting outcome could be the fact that some regulated firms are faced with the costs of emission certificates and, therefore, reducing carbon emissions is becoming more financially attractive. Furthermore, financial markets seem to react to the regulation. While these effects are not large enough to reverse our findings, they do diminish the statistically significant negative relationship between corporate carbon and financial performance. Our interpretation is that investors become efficient with their investments when regulatory interventions start to internalize the negative externalities of climate change. This further underlines the relevance of carbon-related regulation; to mitigate climate change through the leverage effect of financial markets, a considerable carbon price seems essential.
Footnotes
Declaration of Conflicting Interests
The author(s) declared no potential conflicts of interest with respect to the research, authorship, and/or publication of this article.
Funding
The author(s) disclosed receipt of the following financial support for the research of this article: Financial funding was provided by Union Investment.