
Abstract
The transformation of the electricity infrastructure into the smart grid requires energy utilities to increase consumer involvement. However, in the United States, consumers’ trust in utilities is low, which impedes consumer involvement. Drawing on the literature on corporate social responsibility and signaling theory, we examine possible strategies for increasing trust. We hypothesize that utility prosocial, proenvironmental, and service-oriented investments increase consumer trust, and that this increase, in turn, is positively associated with consumers’ willingness to participate in utility programs. We test our hypotheses through online vignette experiments in the context of smart meter apps for household energy management. Our results show that utility proenvironmental investments have the strongest and most consistent effect on consumer trust, and the effect of utility behavior on consumer willingness to use the app is mediated by trust. Our findings contribute to the organizational trust literature and have practical implications for utilities seeking to increase consumer involvement.
Introduction
The electricity delivery system (the electric grid) is under increasing pressure due to resource constraints and environmental concerns. In order to transition to a cleaner, more environmentally sustainable system, the social organization of the grid will need to change (Bakke, 2016). Many argue that consumers are key to this transition (Frickel, Wühr, Horne, & Kallman, 2017). New information and communication technologies make it easier for utilities to influence the energy consumption of consumers—including the amount of energy they use and the time of day they use it. However, it is unclear how open consumers will be to efforts by energy utility companies (henceforth utilities) to involve them (Horne & Kennedy, 2017). If people do not trust their utility, they may be suspicious of changes to the electricity delivery system and unlikely to want to be involved in utility programs. Thus, understanding the conditions under which consumers trust utilities is a substantively important issue.
Trust refers to an actor’s belief regarding another’s trustworthiness in a dyadic interaction comprising social or economic exchange (e.g., Deutsch, 1958; Gambetta, 1988; Mayer, Davis, & Schoorman, 1995). In the context of our study, when consumers trust a utility by, for example, participating in a utility program, they believe that the utility will, in return, behave in a way that is competent and consistent with consumer interests. However, previous research suggests that consumers’ trust in utilities is generally low (Saad, 2016; Tweed, 2013). Here, we link the literatures on signaling theory (Connelly, Certo, Ireland, & Reutzel, 2011; Gambetta, 2009; Spence, 1974) and corporate social responsibility (CSR; Aguinis & Glavas, 2012; Vlachos, Tsamakos, Vrechopoulos, & Avramidis, 2009; Zerbini, 2017) to derive hypotheses about the effectiveness of measures that utilities can take to increase consumers’ trust in them.
We test our hypotheses empirically by means of vignette experiments embedded in three online surveys. In our first study, we corroborate that people in the United States indeed have little trust in utilities and that this lack of trust is negatively associated with consumer willingness to be involved in utility programs. In studies two and three, we test our hypotheses regarding the effects of utilities’ prosocial, proenvironmental, and service-oriented investments on consumer trust and, in turn, on consumer willingness to use a new household energy app. Studies 1 and 2 are conducted with a convenience sample and Study 3 is based on a representative sample of U.S. residents (Mutz, 2011).
We find that utilities’ proenvironmental investments have the most consistent effect on consumer trust. Prosocial investments and improved customer services also produce some gains, though only for our convenience sample. This discrepancy demonstrates once again that results obtained on convenience samples cannot be generalized to the population of interest. In any case, however, consumer trust in utilities is the main predictor of willingness to use a smart meter app provided by the utility. Based on the representative sample used for Study 3, we also perform exploratory analyses of the relation between respondents’ sociodemographic characteristics and our two outcome variables. This post hoc analysis shows that respondents younger than 26 years trust utilities more a priori and the trust-enhancing effect of proenvironmental investments stems from respondents aged 26 years and older. Besides trust, respondents’ sociodemographic characteristics are also related to their willingness to download and use the smart meter app. We end our article with a discussion of the implications of our research for understanding consumer trust in organizations and for utilities wishing to increase consumer involvement in the transition to a more sustainable, efficient, and reliable grid.
Background: The Smart Grid and the Energy Utility Context
Electricity is essential for modern life. Because everything we do depends, eventually, on the reliable supply of electricity, the electric grid has been designated as a critical infrastructure (U.S. Department of Homeland Security, n.d.). Consequently, substantial resources are invested in reliable and affordable electricity delivery (see Executive Office of the President, 2013, for examples of approaches to reducing outages due to weather; see U.S. Department of Energy, n.d., for general discussion). However, the grid is currently under pressure due to an aging infrastructure, resistance to construction of new generation plants and transmission lines, and demands to reduce environmental impacts (Bakke, 2016; Frickel et al., 2017).
In response to these pressures, the electricity industry is exploring approaches to using existing resources more efficiently, as well as incorporating renewable energy sources into the electricity delivery system without compromising reliability. Many industry actors see consumers as key to this effort to transition to a sustainable, efficient, and reliable grid (e.g., Mihlmester & Choate, 2017; Yang, He, Lin, Yu, & Yang, 2016). Thus, utilities are seeking to increase active consumer involvement. For example, they are investing in demand response programs—programs that use incentives to shift time and level of customer electricity use in order to optimize grid functioning (e.g., Ehrhardt-Martinez, Donnelly, & Laitner, 2010; Faruqui & Sergici, 2010).
Such efforts are in their early stages. Current home energy systems typically allow customers to monitor their electricity use; some have other features, such as allowing consumers to manage their appliances, thermostats, security systems, and so forth remotely. But, most of these systems are not integrated with utility efforts to manage load and demand response. Utility efforts have focused on relatively simple interventions such as offering customers smart thermostats that utilities control remotely (changing temperatures by a few degrees for short periods) during times of heavy demand. The vision, however, is that as appliances become “smarter,” consumer use of electricity will be more responsive to grid needs, helping utilities better balance consumer demand with supply. This vision can only be realized if consumers trust the utility and are willing to participate in utility programs.
There is reason to believe that Americans have little trust in utilities relative to other institutions. Recent polling data show that people have less trust in electric and gas utilities than in other industries (e.g., restaurant, technology, auto, mobile), though utilities do not fare as badly as the federal government (Saad, 2016). Reports by media and consulting companies similarly suggest low levels of trust (e.g., Tweed, 2013). In part, this lack of trust may be because consumers are most aware of their utility when their rates increase or the power goes out. Because electricity is so fundamental to daily life, and the provision of electricity is typically reliable, utilities are most salient to consumers when problems arise. How can utilities increase consumers’ trust?
Consumer Trust in Utilities: Theory and Hypotheses
Trust and Trustworthiness
The notion of trust we employ here is consistent with the vast literature on trust in dyadic exchange in sociology (Gambetta, 1988), economics (Fehr, 2009), political science (Levi & Stoker, 2000), organization science (Mayer et al., 1995), and computer science (Riegelsberger, Sasse, & McCarthy, 2005). In line with this literature, we conceive of trust as an ingredient of dyadic social and economic exchange in which actors engage in behaviors that have the potential for gain but, in doing so, risk losses that may result from the other party’s actions. We call those in whom trust may or may not be placed “trustees,” and we call those who may or may not have trust in others “trusters.” Dyadic exchange with trust at stake is usually conceived as sequential (e.g., Dasgupta, 1988) with the truster moving first by making an advance (e.g., sending money to buy an item), which the trustee, moving second, can either meet (e.g., send the item) or abuse (keep the money without sending anything or sending an item of lower quality than advertised). In this framework, trust can be defined as the truster’s belief about the trustee’s trustworthiness on which the truster acts (Fehrler & Przepiorka, 2016). That is, if the truster believes that the trustee is trustworthy, he will make an advance (for other notions of trust, see, e.g., Hardin, 2002). Trustworthiness is defined as the trustee’s ability and/or intention to meet the truster’s advance. That is, the trustee may lack the ability or competence to meet the truster’s advance, or the trustee may be self-regarding and not want to meet the truster’s advance (Mayer et al., 1995).
We use these notions of trust and trustworthiness to describe the interactions between consumers and utilities, in which consumers are in the position of trusters and utilities are in the position of trustees. A utility’s trustworthiness is determined by its competence in providing its services and products as well as its intent to meet customer needs. But, consumers often lack the information to make accurate evaluations of a utility’s competence and intent. Thus, the answer to the question how consumers’ trust in utilities can be increased lies in the answer to the question how utilities can credibly communicate that they possess trustworthy properties. This question has been convincingly addressed by signaling theory (Connelly et al., 2011; Gambetta, 2009; Spence, 1974).
Signaling Theory and CSR
Signaling theory starts from the assertion that trust problems arise because trustworthy properties of trustees are a priori unobservable. For example, a consumer may not know whether a company is competent in what it does or whether it offers its products and services at fair prices. To overcome this uncertainty (Akerlof, 1970; Cook, Cheshire, Gerbasi, & Aven, 2009), trustees can engage in acts that signal (i.e., provide evidence of) their trustworthiness (Bacharach & Gambetta, 2001; Przepiorka & Diekmann, 2013; Riegelsberger et al., 2005). Signaling theory identifies the conditions under which particular behaviors are good indicators (i.e., signals) of the trustworthiness of a trustee. In the so-called separating equilibrium (e.g., Przepiorka & Diekmann, 2013), a behavior can function as a signal and distinguish between trustees because an untrustworthy trustee cannot afford or does not want to engage in the behavior, whereas a trustworthy trustee can afford and wants to engage in it. Such signals are most effective if a priori levels of trust are low (Przepiorka & Diekmann, 2013).
The literature on CSR deals with companies’ behaviors and hence establishes an ideal starting point to explore the applicability of signaling theory to interactions between consumers and utilities (Connelly et al., 2011). CSR can be defined as a company’s policies and actions that promote business success in ways that respect ethical values, people, communities, and the natural environment (see, e.g., Aguinis & Glavas, 2012; Montiel, 2008, on the evolution of this and related terms). Zerbini (2017) provides a comprehensive review of the literature that conceptualizes CSR in terms of signaling theory. Zerbini advocates for a research agenda that assesses the types of CSR initiatives, in particular, their ability to signal unobservable properties of a company that are relevant for stakeholders (e.g., production quality, ethicality, investment risk). The following two paragraphs give a brief recap of the literature conceiving CSR as a signal of a company’s trustworthiness.
Using online survey experiments, Wang, Beatty, and Foxx (2004) and Aiken and Boush (2006) show that third party certification of online retailers’ data security and privacy policies (so-called trustmarks) increase potential consumers’ trust in these online retailers as compared with other signals or the absence of signals. Based on the analysis of transaction data from eBay auctions, Elfenbein, Fisman, and Mcmanus (2012) show that online sellers who dedicate part of their earnings for their auctioned items to charity attract more buyers, obtain higher prices, and are partly compensated for a lower reputation built from buyer feedback (see also Fehrler & Przepiorka, 2016). This research shows that CSR can positively affect consumer trust in online retailers. However, due to its use of convenience samples of online shoppers, it leaves open the generalizability of findings to other contexts.
Based on an analysis of more than 300 companies’ corporate social and environmental performance across five industries, the Boston Consulting Group reports, “[c]ompanies known for products with positive environmental or social attributes, such as those that are responsibly sourced and have natural ingredients, can inspire customers’ loyalty and trust. That can translate into increased sales and even premium pricing” (Beal et al., 2017, p. 7). The findings of Boston Consulting Group are in line with previous studies investigating the relation between corporate social and environmental performance and consumer trust in the organic food industry (Pivato, Misani, & Tencati, 2008), the mobile service industry (Vlachos et al., 2009) and tourism (Ponnapureddy, Priskin, Ohnmacht, Vinzenz, & Wirth, 2017). These studies too suggest that corporate social and environmental signals affect consumer perceptions of company trustworthiness. Despite their critical role in the energy transition, studies investigating CSR as signals of trustworthiness in the utility context are lacking.
In line with Zerbini’s (2017) recommendation, we conceive of utilities’ behaviors (i.e., their CSR initiatives) as strategic acts that potentially signal trustworthiness. We focus on utilities’ prosocial, proenvironmental, and service-oriented investments as signals of trustworthiness because these behaviors represent three relevant targets of companies’ CSR activities: society at large, the environment, and customers. We use online survey experiments to test our hypotheses. We are therefore able to make causal claims about the effect of particular signals on consumers’ perceptions of utilities’ trustworthiness and how these perceptions are related to consumers’ willingness to be involved in utility programs. For obvious reasons our approach does not allow us to assess how far utilities’ trustworthiness is correlated with their actual level of CSR (see Fehrler & Przepiorka, 2016).
Socially Responsible Behaviors as Signals of Trustworthiness
Laboratory experiments with economic games played by human subjects show that prosocial acts (costly behaviors that create benefits for others) such as generosity and charitable giving (see, e.g., Murphy & Ackermann, 2014) can function as signals of trustworthiness to some extent (Barclay, 2004; Fehrler & Przepiorka, 2016). Because the prosocial preferences underlying generosity and trustworthiness partly overlap, generosity and trustworthiness are correlated (Gambetta & Przepiorka, 2014). The former therefore provides reliable evidence of the latter. This mechanism arguably applies to interactions between consumers and companies. For example, results from behavioral experiments support the idea that prosocial behavior of companies (e.g., corporate social performance) attracts employees who are willing to exert higher work effort at lower wages because they identify with the mission the companies’ CSR conveys (Brekke, Hauge, Lind, & Nyborg, 2011; Ciocirlan, 2017; Fehrler & Kosfeld, 2014). By this mechanism, companies’ CSR and trustworthiness will be correlated via the preferences and behaviors of employees and hence consumers may perceive the former as a sign of the latter. More generally, literature on CSR finds that companies’ prosocial actions, such as corporate philanthropy, can be interpreted as signals of trustworthiness and lead consumers to choose these companies, their products and services (Elfenbein et al., 2012; Fehrler & Przepiorka, 2016). This leads us to our first hypothesis:
While generosity and charitable giving have been found to function as signals of trustworthiness in lab experiments and peer-to-peer online markets, there are at least two reasons why they might not be interpreted as such by all consumers in the utility context. First, prosocial acts can be interpreted as wasteful (i.e., reducing profits for shareholders or increasing costs for consumers; Friedman, 1962). Supporting this conjecture, a recent study has cast doubt on whether corporate social giving and corporate financial performance are positively correlated (Rost & Ehrmann, 2017). Second, charity may be too distant from a company’s core business to be perceived as evidence of trustworthiness (Gambetta, 2009). In other words, CSR fit of charity might be low in the utility context (Du, Bhattacharya, & Sen, 2010).
De Jong and van der Meer (2017) point out CSR fit as an increasingly important factor in CSR communication and provide a comprehensive review of the literature on CSR fit. Most of the literature seems to indicate that a high CSR fit, that is, a high similarity between a company’s core business and its CSR activities, results in better outcomes for the company because of the clear and self-explanatory relation, which raises less skepticism on the part of consumers. In line with this conjecture, we propose that, in the utility context, proenvironmental behavior may provide a superior signal of trustworthiness and consequently have a trust-enhancing effect. Proenvironmental behavior (e.g., voluntary investments in renewable energy sources) is arguably prosocial because it benefits the collective rather than the individual (Liebe, Preisendörfer, & Meyerhoff, 2011), but consumers may perceive proenvironmental behavior as economically practical (rather than wasteful) and as consistent with the utility’s core business of electricity provision. In line with this argument, research finds that utility proenvironmental messaging increases consumer trust (Ramirez, Tajdini, & David, 2017, and the literature cited in the previous section). Our second hypothesis is therefore as follows:
Although most of the literature finds evidence that high CSR fit increases trust, there are studies showing that low CSR fit can also generate positive outcomes for a company (de Jong & van der Meer, 2017). Signaling theory can explain these contradictory findings in so far as it posits that CSR initiatives with a low fit should be perceived as more credible because they are not just the side product of these companies’ core business and therefore costly (Przepiorka & Diekmann, 2013). At the same time, it has been shown that it is the CSR initiatives with a low fit (i.e., peripheral initiatives) that are reduced more readily by small firms in times of economic decline (Panwar, Nybakk, Pinkse, & Hansen, 2015), which may render low fit CSR, a more ambiguous signal over time. Whether most consumers will perceive proenvironmental or prosocial investments as more indicative of a utility’s trustworthiness is an empirical question. We therefore refrain from hypothesizing about the relative strength of these two effects.
Prosocial and proenvironmental investments aimed at enhancing consumers’ trust contrast with standard efforts made by utilities to improve relations with customers. Such service-oriented behaviors involve improving customer relations through communication strategies and online tools for customers. For example, a recent article advised utilities that “[c]ustomers want everything from detailed usage information (if they have a smart meter) to more rate-plan options and digital tools or text bill alerts” (Tweed, 2013; see also Smart Grid Consumer Collaborative, 2017, n.d.). Although not typically identified with CSR, utilities that provide consumers with high-quality information and online tools signal their interest in and ability to serve consumers. Hence, service-oriented behaviors can serve as signals of trustworthiness because they communicate to consumers utilities’ intentions to serve them in a competent way (Vlachos et al., 2009). This leads us to our third hypothesis:
Recall that we have conceptualized the relation between consumers and utilities as an exchange relation with consumers as the trusting parties (trusters) and utility companies as the trusted parties (trustees). We have suggested that trustees who view a truster as trustworthy are more likely to make a risky advance. Consistent with this argument, evidence for the role of trust in consumer behavior has been found in previous research in other industries that investigates the outcomes of CSR (Aguinis & Glavas, 2012; Aiken & Boush, 2006; Elfenbein et al., 2012; Vlachos et al., 2009; Wang et al., 2004). This research shows that corporate actions affect consumer trust that, in turn, has implications for consumer behavior. In our context, when consumers trust a utility, they are more likely to believe its assertions and to expect that utility programs will help them, rather than benefit the utility at their expense. Therefore, the more that consumers view a utility as trustworthy, the more willing they will be to participate in utility programs that promise a benefit for them. Accordingly, our fourth hypothesis reads as follows:
Method and Results
Before testing our hypotheses, we conducted an initial online study (Study 1) to assess our starting assumption that people have little trust in utilities relative to other actors. We then tested our hypotheses using a second online vignette study (Study 2) conducted with a convenience sample of participants. To establish the generalizability of our findings, we conducted a third online study (Study 3) with a representative sample of U.S. adult residents. We also conducted two additional studies with convenience samples to test slight variations in the wording of our vignettes. Because the results of these additional studies do not differ from our main findings, we report them in the appendix (available in the online supplemental material of the article) only and refer to them where appropriate in the main part of the article.
Although vignettes describe hypothetical scenarios and responses to subsequent survey questions are often not incentivized, population-based survey experiments are a valid first step (Mutz, 2011). Unlike field experiments (see, e.g., Delmas & Aragon-Correa, 2016), vignette experiments are generally not useful for assessing the substantive size of effects in the field, but they provide strong tests of the effects of theoretical causal factors and can be relatively easily conducted on a broad range of topics. In our case, if we do not find support for our hypotheses it is unlikely that we would find support for them in terms of actual behavior.
Our convenience samples were recruited through Prolific, a research hosting site that is similar to Amazon’s Mechanical Turk (AMT), but designed specifically for academic researchers. Research suggests that Prolific performs well compared with AMT (Peer, Brandimarte, Samat, & Acquisti, 2017). As with AMT, researchers post studies on the Prolific site. Participants click on the study link and are taken to the study materials. In our studies, participants completed a consent form, read a short vignette, answered questions about it, completed manipulation checks, and provided basic sociodemographic information. As manipulation check, we asked participants about the type of actor specified in the vignette in Study 1. In Studies 2 and 3, we asked participants about the utility’s behavior (electricity production, investment in charity, investment in renewables, or investment in their website and online customer tools). Our analyses for the three studies include the full samples; we do not exclude cases from the analysis based on manipulation checks (or for other reasons) because excluding cases in which respondents failed the manipulation check does not change our results. At the conclusion of each study, participants were directed back to the Prolific site for payment. Participants were paid a small sum of money, consistent with Prolific’s payment guidelines.
Our representative sample was obtained through YouGov. YouGov is a research organization that maintains panels of online participants. It solicits panel participants and awards points to them when they participate in studies. Those points can be redeemed to obtain rewards such as gift cards. Participants for our study were weighted to be a nationally representative sample of U.S. adult residents. 1 As in the Prolific studies, participants completed a consent form, read a short vignette, answered questions about the vignette, and completed manipulation checks. YouGov provided sociodemographic data.
In all studies, participants were U.S. residents aged 18 years or older. Each study had a between-subject design; that is, only one vignette was presented to each participant.
Study 1: Trust in Utility Companies and Other Actors
Study 1 assesses participant trust in utility companies relative to other organizational actors, as well as the association between trust and willingness to use an energy app provided by these actors. It has eight conditions. The eight conditions describe different types of organizational actors: utilities, Google, technology start-up companies, nonprofit organizations, university researchers, federal government agency, state government agency, and local government. There were approximately 50 participants per condition for a total N = 401 participants.
Participants
Participants were mostly male (54.3%). Mean age was 36.2 years (SD = 11.5). Fifty-seven percent had completed college. The sample was 81.6% White. It was also liberal, with 72.2% indicating that they would more likely vote Democrat than Republican in U.S. presidential elections.
Experimental Manipulations
The experimental conditions were manipulated in the vignette. The vignette described a household energy app being offered by an organizational actor. To appeal to the broadest set of participants, we described the app as helping households both save money and help the environment (two outcomes that are highly correlated with electricity use): [A utility company/Google/A tech start-up company/An environmental nonprofit organization/Some university researchers/A federal government agency/A state government agency/The local city council] is offering a free app to help household manage their electricity consumption. [The utility company/Google/The tech start-up company/The environmental nonprofit organization/The university researchers/The federal government agency/The state government agency/The local city council] is saying that the app will help households save money and also help the environment by reducing carbon emissions.
Measures
We measured participants’ trust by asking them how much they trusted the organization (1 = not at all to 10 = very much). We also measured participant willingness to use the app provided by the organization in the vignette (1 = very unwilling to 10 = very willing). Finally, we obtained information on the sociodemographic characteristics described above.
Results
Table 1 reports the results of OLS regressions examining the effects of the experimental conditions on trust and willingness to use the app, with utility company as the reference category. The results show that type of organization has a substantial and statistically significant effect on participants’ trust (Model 1). Their trust in utility companies is comparable to their trust in federal, state, and local government agencies as well as technology start-ups, and significantly lower than their trust in environmental nonprofits, university researchers, and Google. Given that current levels of trust in government in the United States are at historic lows (e.g., Pew Research Center, 2017), these results suggest that, indeed, people have little trust in utilities.
OLS Regression Models of Trust and Willingness to Use App.
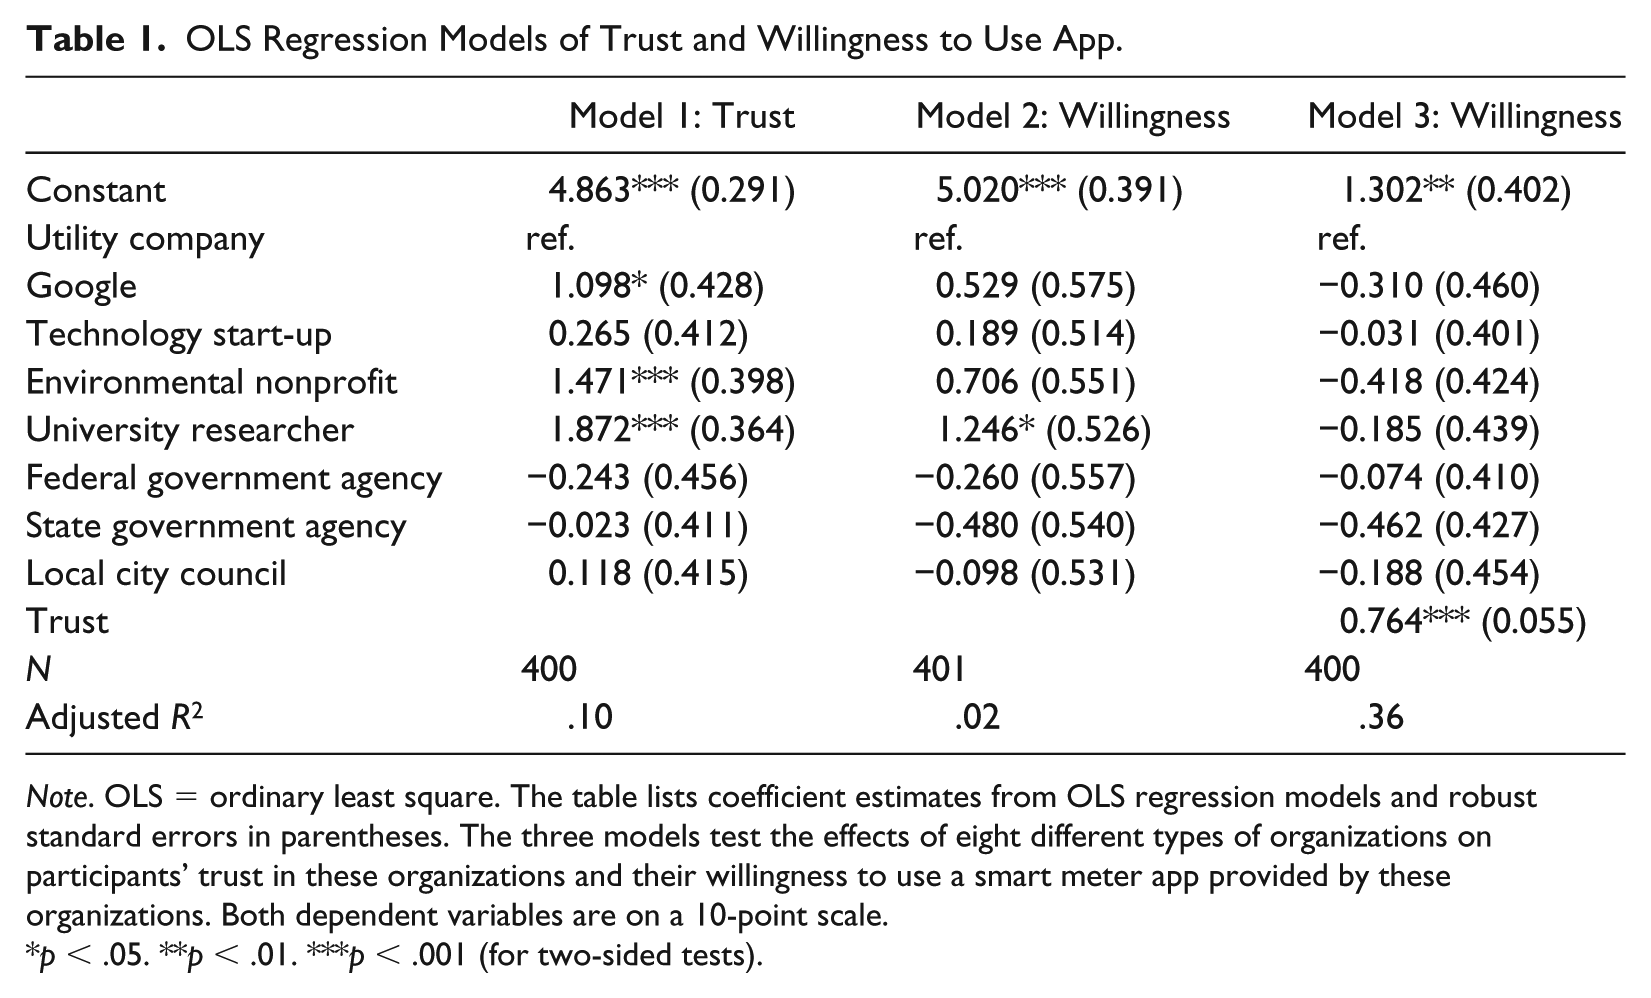
Note. OLS = ordinary least square. The table lists coefficient estimates from OLS regression models and robust standard errors in parentheses. The three models test the effects of eight different types of organizations on participants’ trust in these organizations and their willingness to use a smart meter app provided by these organizations. Both dependent variables are on a 10-point scale.
p < .05. **p < .01. ***p < .001 (for two-sided tests).
As can be seen from the coefficient estimates in Model 2, there is variation in participants’ willingness to use an app provided by the different types of organizational actors, joint significance test: F(7, 393) = 2.38, p = .022. However, this variation is substantially reduced once in Model 3, participants’ trust in the organizational actor is controlled for, joint significance test: F(7, 391) = 0.35, p = .930. The statistically significant association between trust and willingness suggests moreover that type of organization affects willingness to use the app indirectly through trust (Baron & Kenny, 1986). The appendix (Section E) provides a formal test of the mediating effect of trust. The test is based on an estimation of the indirect effect of the multicategorical treatment variable on willingness in a structural equation model with bootstrapped standard errors of the coefficient estimates (Hayes & Preacher, 2014; Kline, 2010).
Figure 1 shows average trust scores across types of organizations as well as willingness scores conditional on mean trust scores across the different types of organizations. The average trust scores correspond with the coefficient estimates of Model 1 in Table 1, whereas willingness scores are predicted from these average trust scores. Predicted willingness scores are calculated after seemingly unrelated estimation of Model 1 and a model with willingness as the outcome variable and trust as the sole explanatory variable. This approach allows error terms to be correlated across the two models. In other words, Figure 1 shows the indirect effect of type of organization on willingness scores via trust. Among the listed types of organizations, utilities and state government agencies have the second lowest trust scores; only federal government agencies have even lower trust levels.
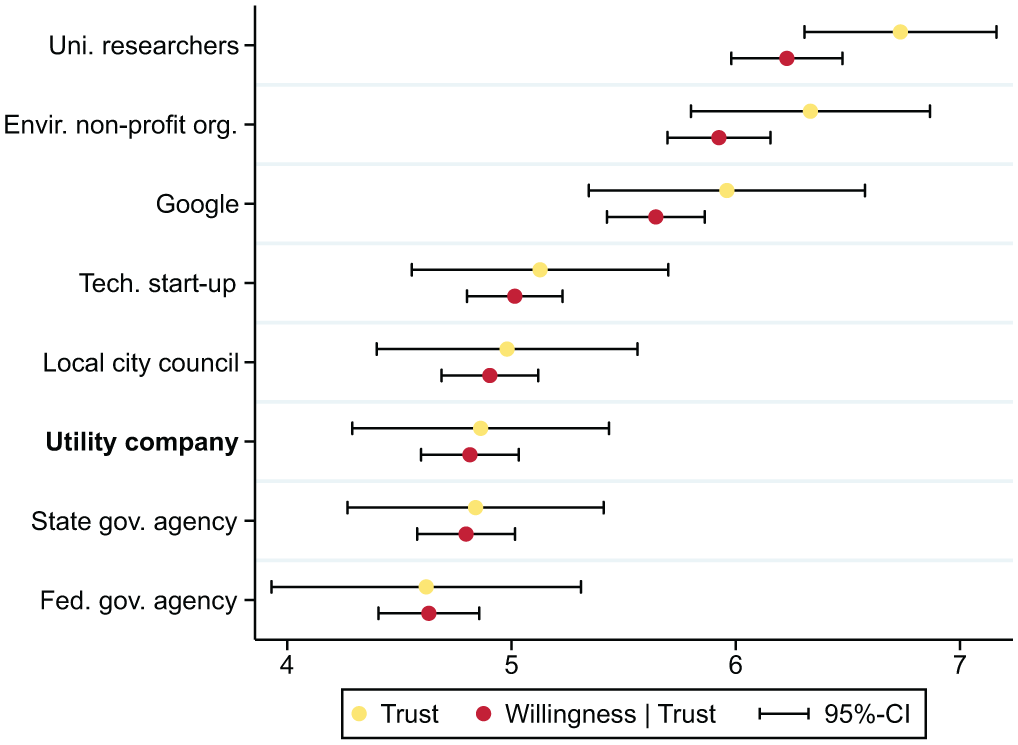
Trust and willingness to use app across types of organizations.
These results are consistent with our initial assumption that people have little trust in utilities. We now turn to the studies that test our hypotheses—assessing whether evidence that a utility engages in prosocial behavior, proenvironmental behavior, or improves customer service affects customer trust.
Study 2: Prosocial, Proenvironmental, and Service-Oriented Investments
Study 2 focuses only on utility companies (rather than on different kinds of organizations) and examines strategies utilities might use to increase consumer trust. It had four conditions—prosocial investments, proenvironmental investments, service-oriented investments, and a control condition in which the utility was simply described as investing in electricity production. This design allows us to estimate the effects of utility prosocial, proenvironmental, and service-oriented investments (as compared with the effect of the utility’s investment in electricity production) on participant trust and willingness to use the app. 2 There were approximately 100 participants in each experimental condition for a total of N = 403. 3
Participants
Study 2 had more male (57.8%) than female participants. Mean age was 28.8 years (SD = 9.3). Forty-two percentage had a college degree. Sixty-nine percentage identified themselves as White. Seventy-five percentage indicated that they would more likely vote for a Democratic than Republican candidate in U.S. presidential elections.
Experimental Manipulations
Participants first read about utility company behavior: Part 1 In recent years, a utility company has invested substantial resources in [increasing the amount of electricity it produces/renewable energy like wind and solar/nonprofit charitable organizations in the community/maintaining a high-quality website and online customer tools].
At this point, we asked participants how much they trusted the utility as well as questions about their perceptions of the utility. Then, in Part 2 of the vignette, we described a new app that the utility was providing.
Part 2 We told you that the utility company has invested a lot in [increasing the amount of electricity it produces/renewable energies like wind and solar/nonprofit charitable organizations in the community/maintaining a high-quality website and online customer tools]. Now we will tell you a little more about the utility company. It is offering a new program. It is providing households with a free app that households can use to manage electricity consumption. The utility company information pamphlets say that the app can help households save money and help the environment.
Participants then answered the remaining questions.
Measures
We asked participants how willing they were to use the app provided by the utility described in the vignette (1 = not at all to 10 = very much). We also included manipulation checks and sociodemographic measures.
Results
Table 2 reports the results of regression analyses looking at the effects of the experimental conditions on participant trust in the utility and participant willingness to use the app. We hypothesized that utility behavior would affect trust, and in turn, willingness to use the app. Consistent with Hypotheses 1 through 3, we find that a utility that invests in nonprofit charitable organizations (i.e., a prosocial cause; Hypothesis 1), renewable energy (i.e., a proenvironmental cause; Hypothesis 2), or in their website and online tools (customer service; Hypothesis 3) is trusted more than a utility that merely invests in electricity production (Model 1). Furthermore, the effect of investment in renewable energy is significantly larger than the effect of investment in nonprofit charitable organizations, F(1, 399) = 8.75, p = .003, and the effect of investment in website and online tools, although the latter difference is only significant at the 10% level, F(1, 399) = 3.12, p = .078. There is no statistically significant difference between participants’ trust in a utility that invests in online tools and one that invests in nonprofit charitable organizations, F(1, 399) = 2.22, p = .137.
OLS Regression Models of Trust and Willingness to Use App.
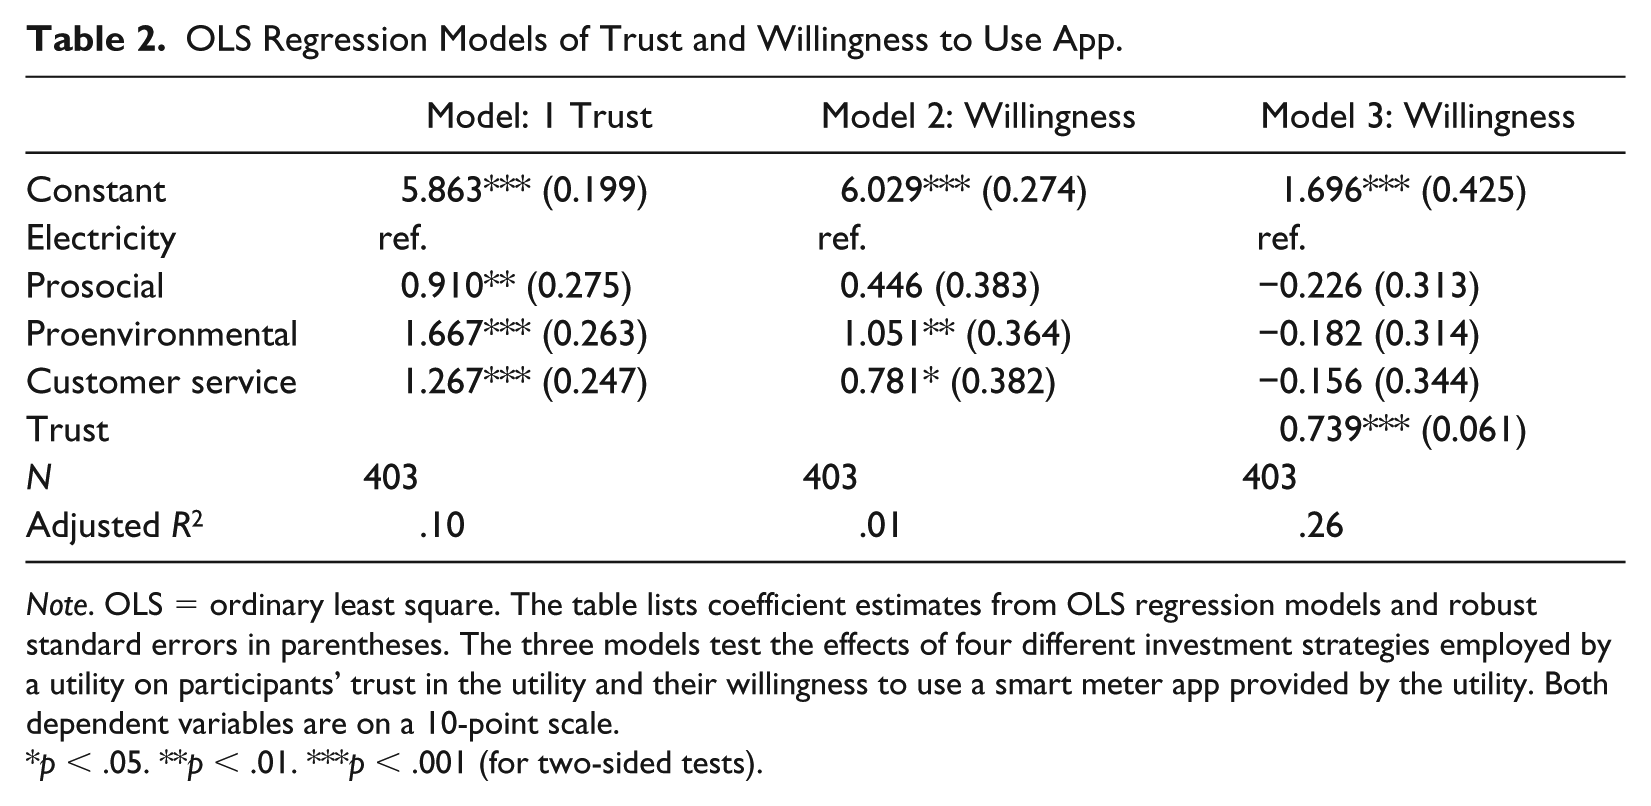
Note. OLS = ordinary least square. The table lists coefficient estimates from OLS regression models and robust standard errors in parentheses. The three models test the effects of four different investment strategies employed by a utility on participants’ trust in the utility and their willingness to use a smart meter app provided by the utility. Both dependent variables are on a 10-point scale.
p < .05. **p < .01. ***p < .001 (for two-sided tests).
Hypothesis 4 predicts that utility prosocial, proenvironmental, and service-oriented behavior will affect participant willingness to use the app and that this effect will be mediated by participant trust in the utility. Consistent with this prediction, we find that all three utility behaviors affect willingness (Model 2). Furthermore, these effects disappear once trust is included in the model (Model 3). These results indicate that the effects of type of utility behavior on willingness are mediated by trust (a formal test of the mediating effect of trust is provided in the appendix, Section E).
Figure 2 shows average trust scores across types of investments as well as willingness scores conditional on mean trust scores across the four types of investments (see description of Figure 1 for details). The figure shows the indirect effect of investment signals on willingness scores via trust.
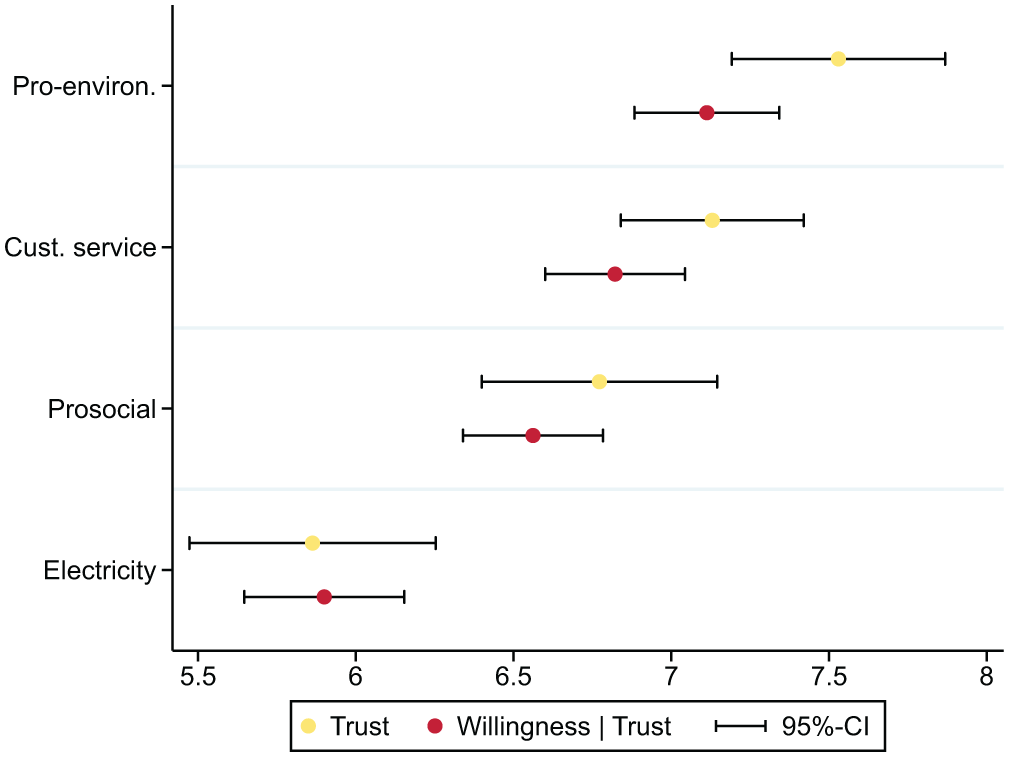
Trust and willingness to use app across types of investments.
Study 3: Generalizability
The studies described thus far were conducted with convenience samples of Americans. To assess the generalizability of our findings, we conducted a study with a nationally representative sample of U.S. residents recruited through YouGov. This study had a between subjects design with four conditions—prosocial investments, proenvironmental investments, service-oriented investments, and control (investment in electricity production). There were approximately 500 participants per condition for a total N = 2,000. 4
Participants and Procedure
Study 3 had more female (54.2%) than male participants. Mean age was 47.5 years (SD = 16.8). Thirty-nine percentage had completed at least 2 years of college education. Seventy-three percentage identified themselves as White. Fifty-seven percentage indicated that they would more likely vote Democrat than Republican in U.S. presidential elections. Thus, the YouGov sample is more female, older, less educated, and more Republican than the convenience samples recruited through Prolific. For the analyses with the YouGov data, we used sample weights to achieve results that are nationally representative.
Manipulations
Again, we manipulated the experimental conditions using a vignette: Part 1 In recent years, a utility company has invested substantial resources in [increasing the amount of electricity it produces/renewable energy like wind and solar/nonprofit charitable organizations in the community/maintaining a high-quality website and online customer tools].
At this point, participants answered a question about how much they trust the utility. Then participants read the second part of the vignette: Part 2 Now we will tell you a little more about the utility company. It is offering a new program. It is providing households with a free app that households can use to manage electricity consumption. The utility company information pamphlets say that the app can help households save money and help the environment.
Then participants answered the rest of the questions.
Measures
Measures of participants’ trust in the utility and willingness to use the app were the same as in the Prolific studies. Data on participant sociodemographic characteristics were provided by YouGov. We also asked participants about how much confidence they had in various types of actors to work in the best interests of the public (see appendix, Section C).
Results
Table 3 shows the effects of the experimental conditions on participants’ trust in the utility and the association between participants’ trust and their willingness to use an app for household energy management provided by the utility. 5 We predicted that utility prosocial (Hypothesis 1), proenvironmental (Hypothesis 2), and service-oriented investments (Hypothesis 3) would affect trust. Unlike Study 2, here only the investment in renewable energy has a statistically significant effect on consumer trust (Model 1). A utility that invests in renewable energy is trusted significantly more than a utility that merely invests in electricity production (see Table 3). These results are consistent with Hypothesis 2 regarding utility proenvironmental investments, but do not support Hypotheses 1 and 3 regarding utility prosocial and consumer-oriented behavior, respectively. What is more, a utility that invests in renewable energy is also trusted significantly more than a utility that invests in nonprofit organizations, F(1, 1996) = 14.40, p < .001, or in the maintenance of their website, F(1, 1996) = 11.78, p < .001. Unlike our convenience sample, here type of investment has no effect on participant willingness to use the app (Model 2). But, trust is associated with willingness (Model 3). These findings are partially consistent with our Hypothesis 4 that utility investments will affect willingness indirectly via trust (a formal test of the mediating effect of trust is provided in the appendix, Section E).
OLS Regression Models of Trust and Willingness to Use App.
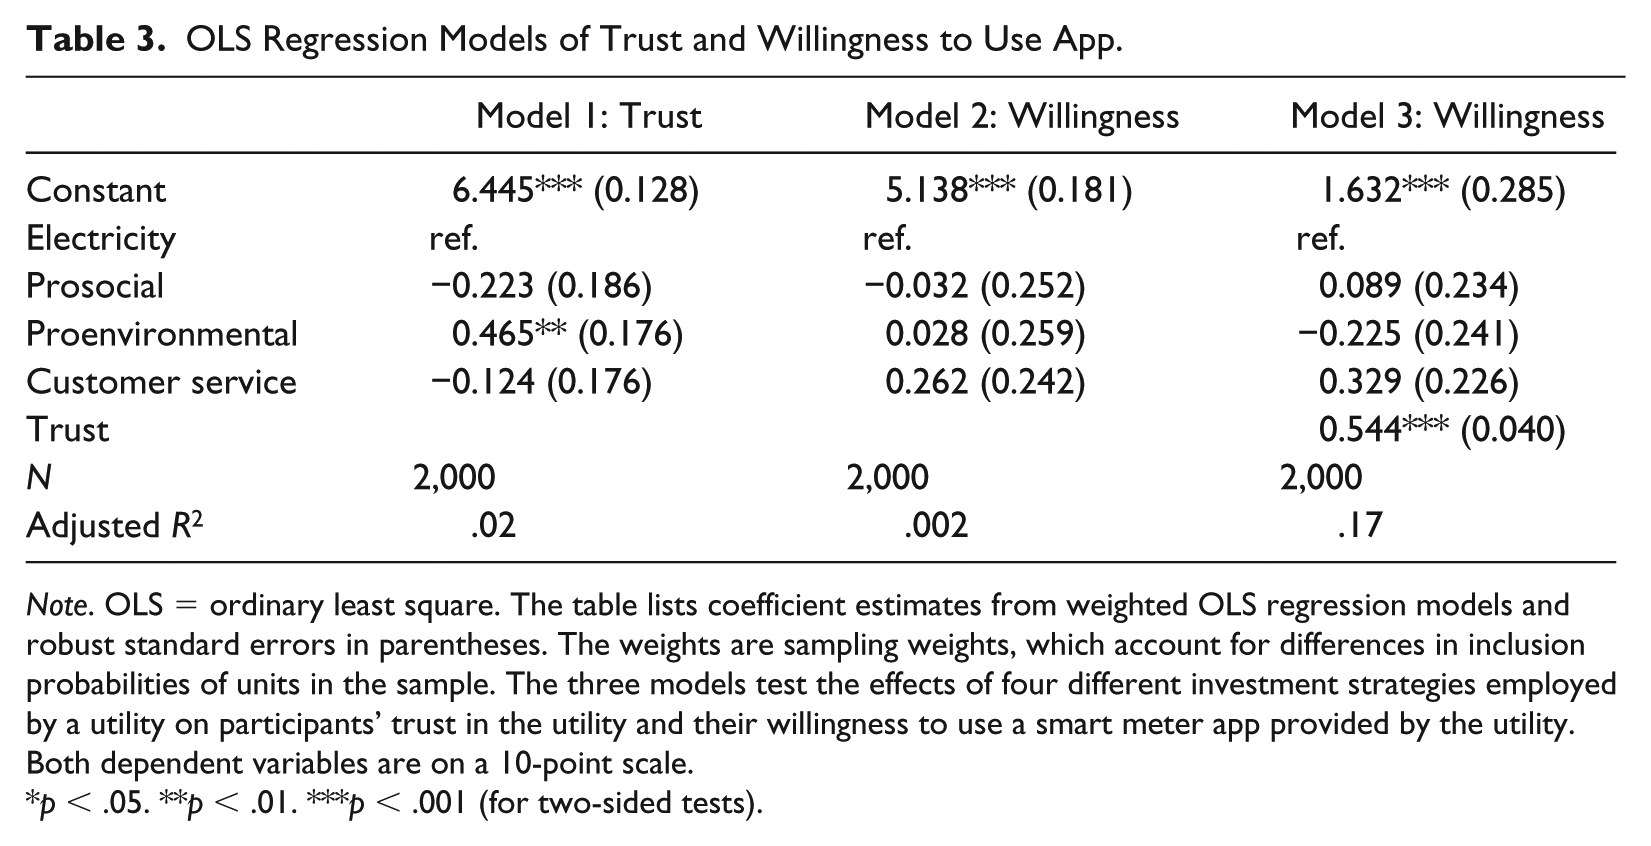
Note. OLS = ordinary least square. The table lists coefficient estimates from weighted OLS regression models and robust standard errors in parentheses. The weights are sampling weights, which account for differences in inclusion probabilities of units in the sample. The three models test the effects of four different investment strategies employed by a utility on participants’ trust in the utility and their willingness to use a smart meter app provided by the utility. Both dependent variables are on a 10-point scale.
p < .05. **p < .01. ***p < .001 (for two-sided tests).
Figure 3 reports mean trust levels across types of utility behaviors as well as corresponding willingness scores conditional on trust (see description of Figure 1 for details). The figure shows the indirect effect of type of investment on willingness scores via trust.
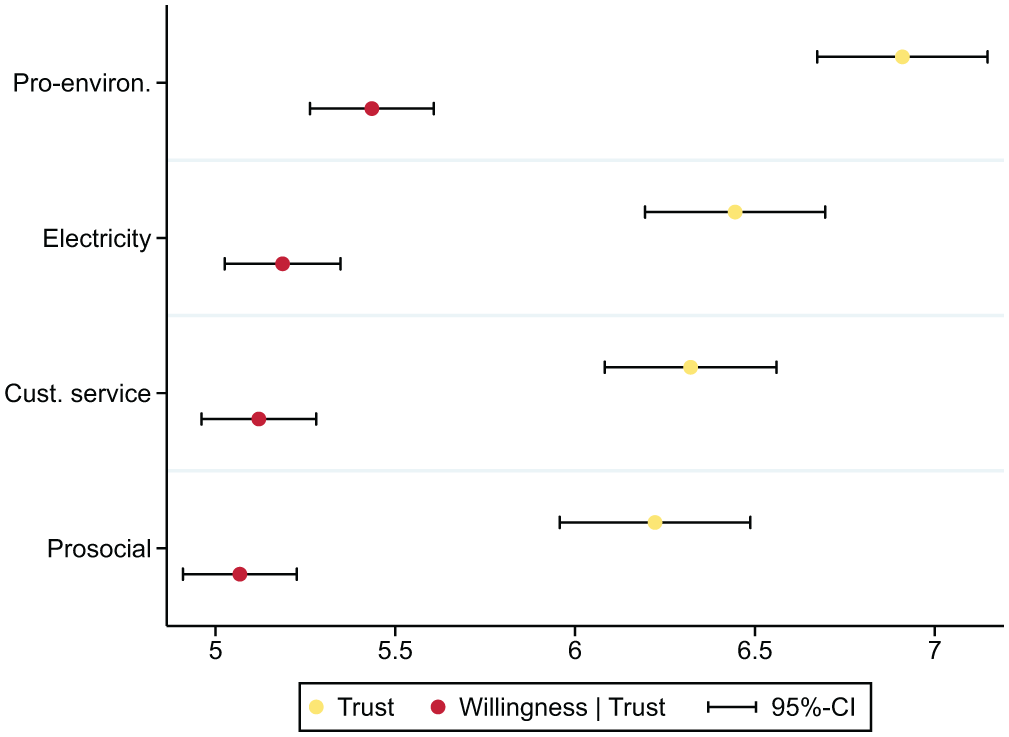
Trust and willingness to use app across types of investments.
Exploratory Analyses
We conducted additional exploratory analyses to assess whether identifiable differences in sample composition can explain the differences in results for prosocial and service-oriented investments across the convenience sample (Study 2) and representative sample (Study 3). Our analysis shows that proenvironmental behavior has the predicted effects on trust across both samples, but that prosocial and consumer-oriented behavior only affect trust in the convenience sample and not in the representative sample. The two samples differ (on average) in participants’ gender, age, education, and political ideology. Accordingly, we include these factors in our exploratory analyses; we also include indicators for race, marital status, and unemployment status (which we only had for the representative sample). The results of these analyses regarding consumer trust and willingness are reported in Table 4 and Table 5, respectively.
OLS Regression Models of Trust in Utility.
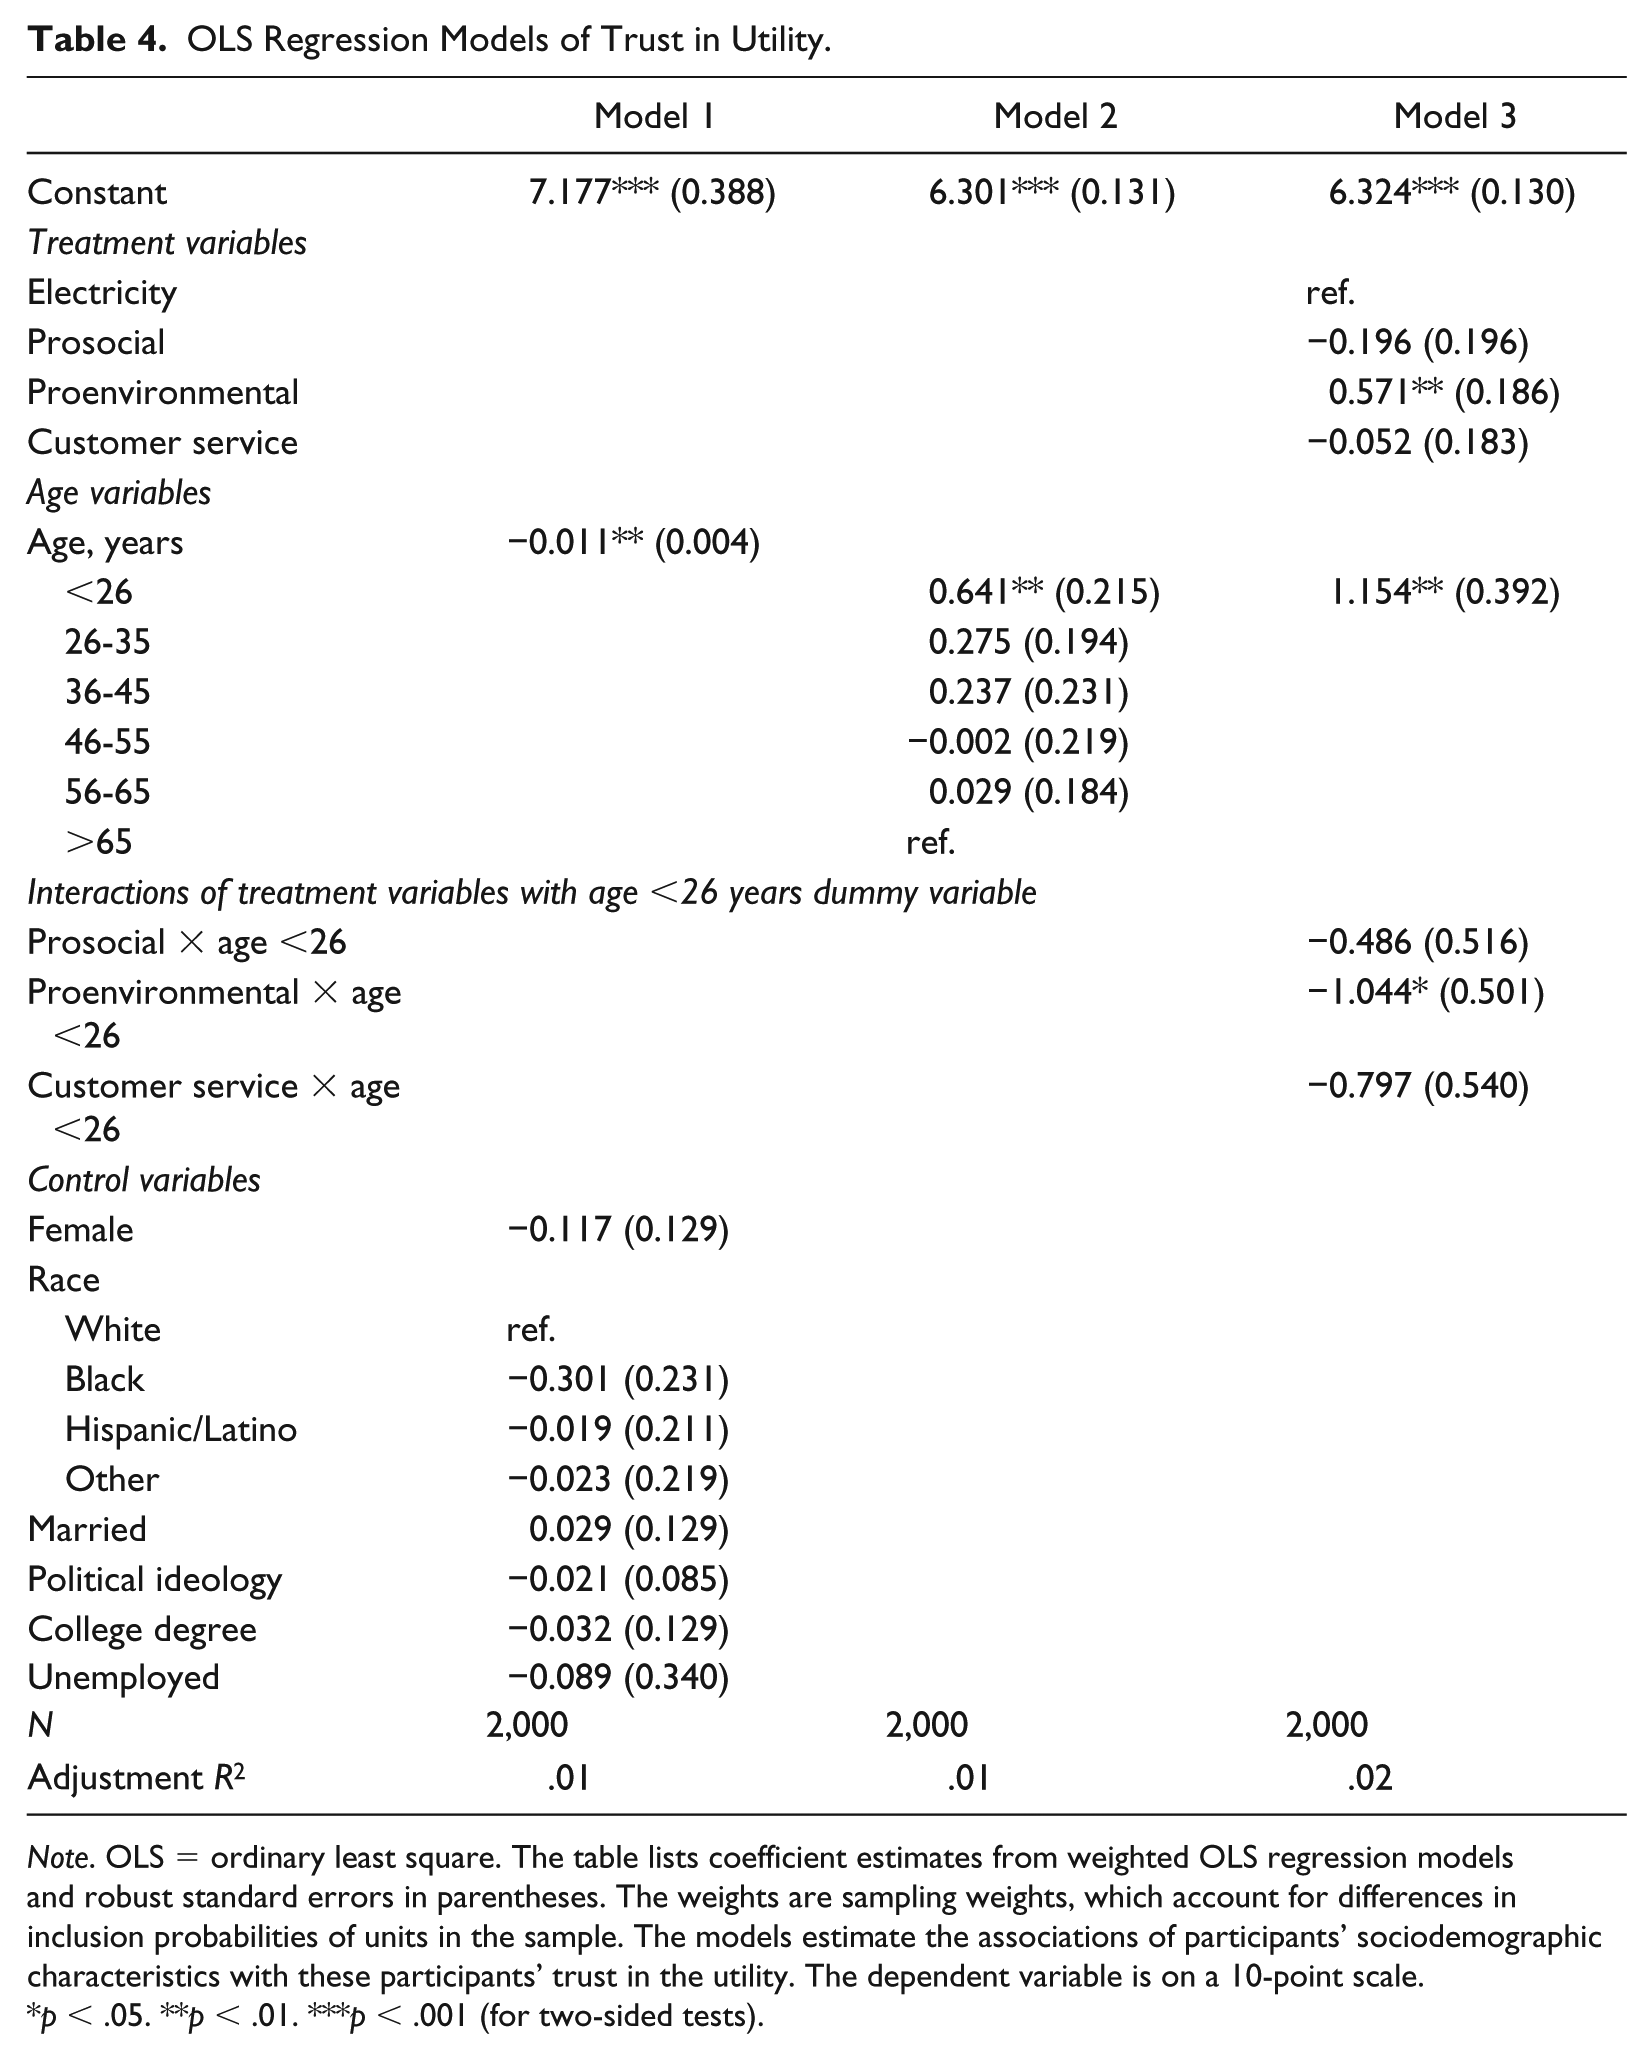
Note. OLS = ordinary least square. The table lists coefficient estimates from weighted OLS regression models and robust standard errors in parentheses. The weights are sampling weights, which account for differences in inclusion probabilities of units in the sample. The models estimate the associations of participants’ sociodemographic characteristics with these participants’ trust in the utility. The dependent variable is on a 10-point scale.
p < .05. **p < .01. ***p < .001 (for two-sided tests).
OLS Regression Models of Willingness to Use the App.
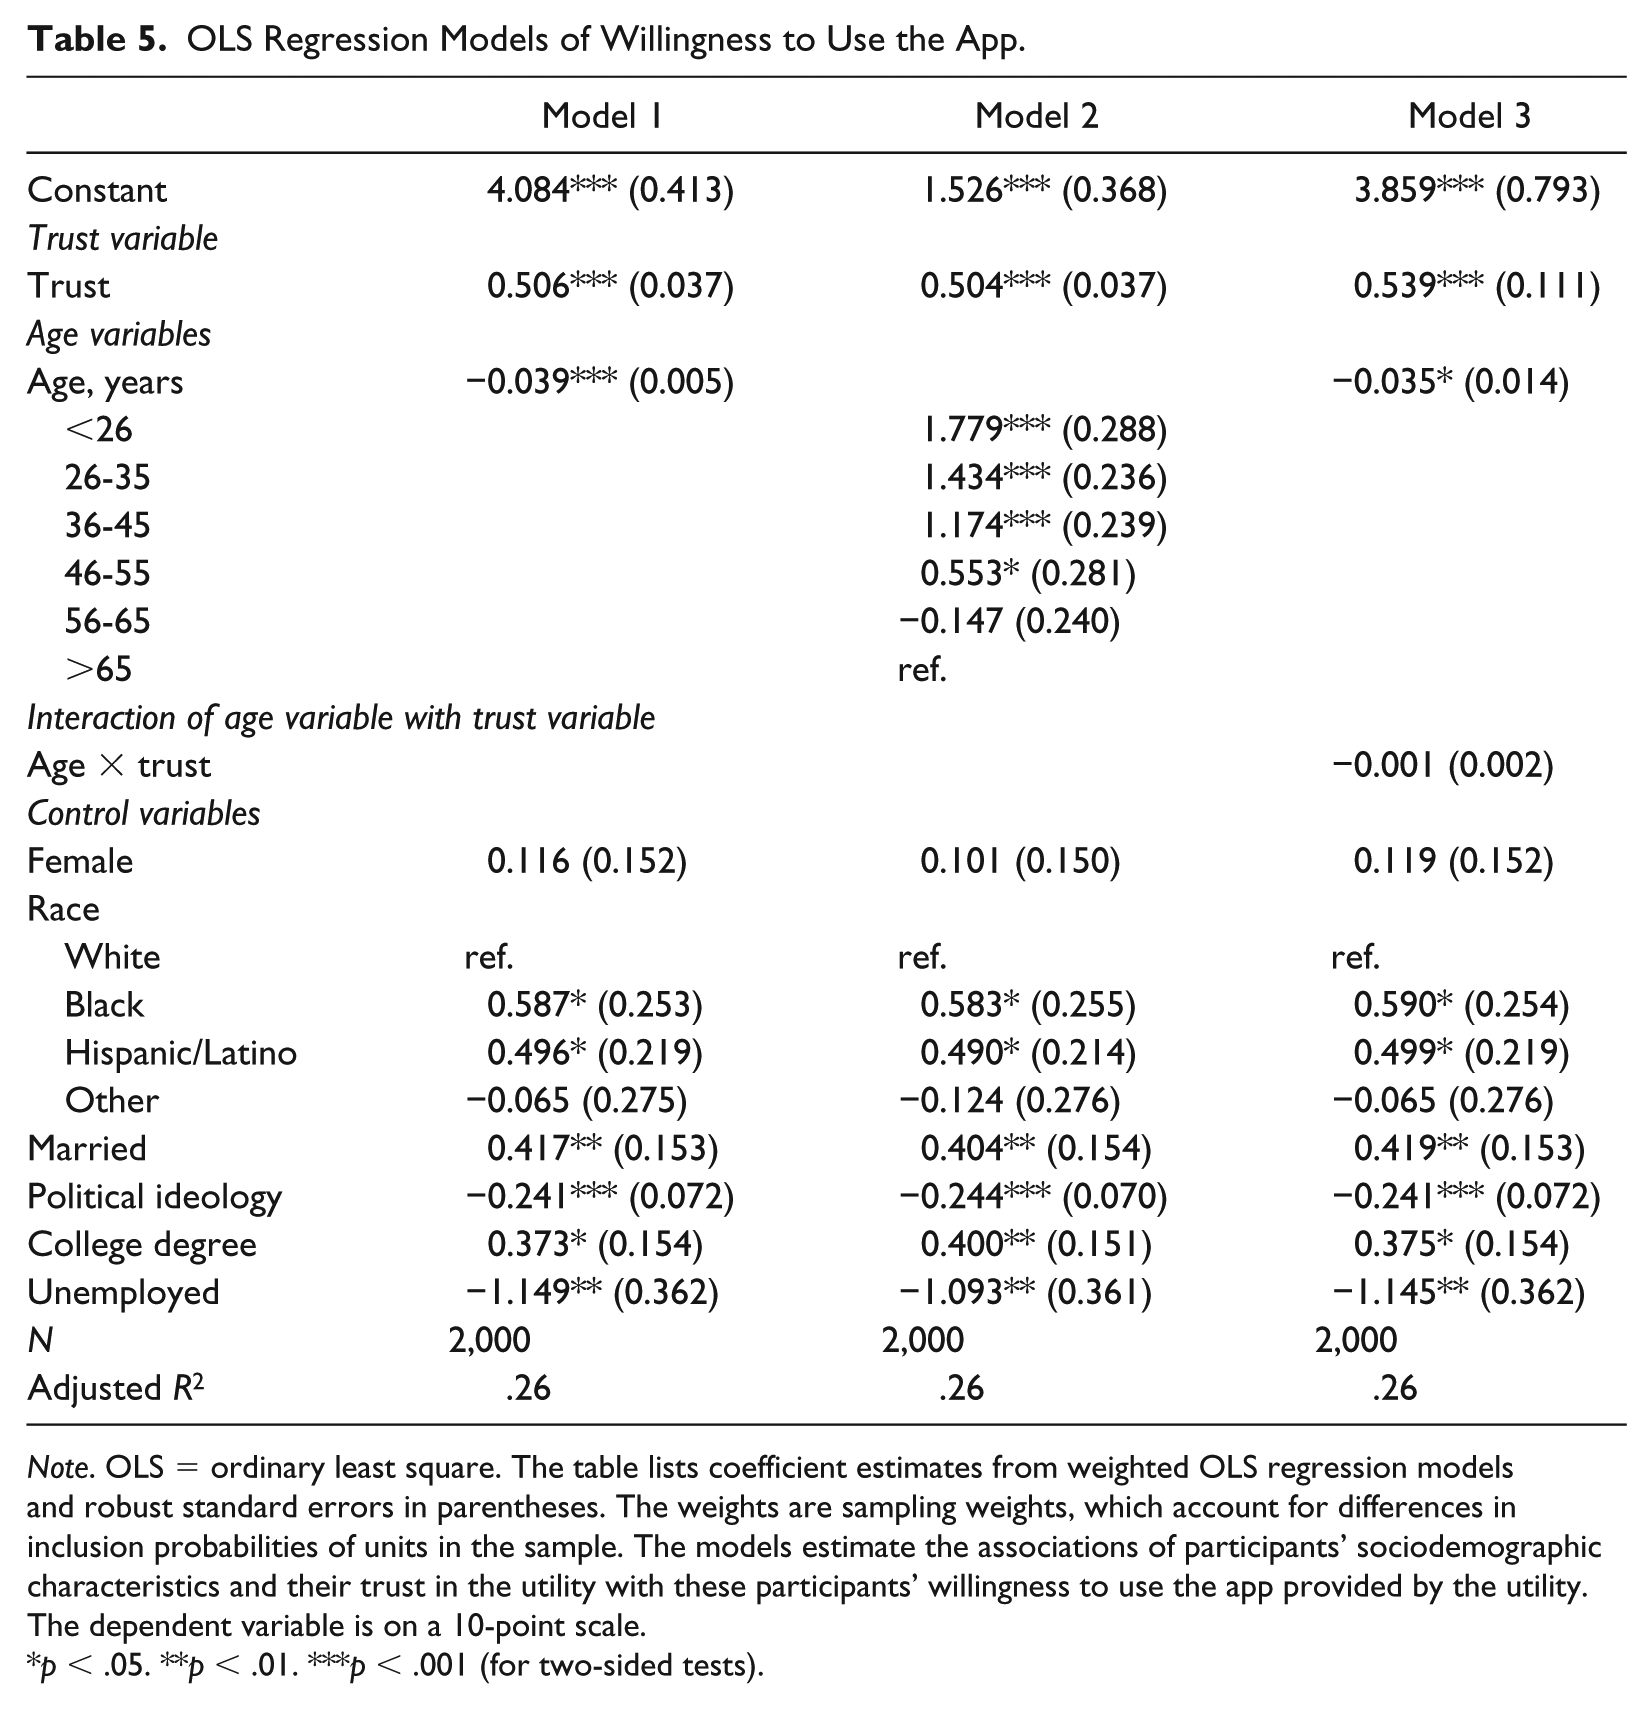
Note. OLS = ordinary least square. The table lists coefficient estimates from weighted OLS regression models and robust standard errors in parentheses. The weights are sampling weights, which account for differences in inclusion probabilities of units in the sample. The models estimate the associations of participants’ sociodemographic characteristics and their trust in the utility with these participants’ willingness to use the app provided by the utility. The dependent variable is on a 10-point scale.
p < .05. **p < .01. ***p < .001 (for two-sided tests).
In Table 4, Model 1 shows that gender, education, and political ideology (measured as liberal vs. conservative) are not associated with trust. 6 However, participant age matters; older participants have less trust in the utility than younger participants. Moreover, this age effect is not linear. Whereas participants younger than 26 years express relatively high levels of trust, those 26 years and older are less trusting (Model 2). There is little difference in trust levels across age groups above 26 years (e.g., Age 26-35 years vs. Age 46-55 years: t = 1.23, p = .220).
Model 3 explores potential interaction effects of age with the experimental conditions. The model estimation shows that young participants exhibit significantly higher levels of trust toward utilities that merely invest in electricity production than older participants. However, older participants’ trust in a utility increases significantly in response to proenvironmental investments by the utility. Among young participants, although the coefficients for type of investment (main effect plus interaction effect) are negative, they are not statistically significant (prosocial: t = −1.43, p = .153; proenvironmental: t = −1.02, p = .309; customer service: t = −1.67, p = .095). These results are partly in line with previous experimental findings showing that signals may only be effective in increasing trust if a priori trust levels are low (as in older participants) and that signals can raise suspicion and lead to decreased trust if a priori trust levels are high (as in young participants; Przepiorka & Diekmann, 2013).
But these age effects do not explain the different findings for the effects of the prosocial and customer service conditions across the two samples. In the representative sample, neither prosocial nor service-oriented investments had an effect; in the convenience sample both did. Although the effects of utility proenvironmental behavior varied with participant age, there were no comparable interaction effects of age with prosocial behavior or age with service-oriented behavior (Model 3). The lack of interaction effects suggests that differences in participant age across the two samples cannot account for these different findings. Thus, it appears that sociodemographic characteristics for which we have data cannot explain the difference in results across the convenience and nationally representative samples.
Table 5 reports the results of analyses looking at the association between participant characteristics and willingness to use the app. Notably, the association between trust and willingness remains strong when sociodemographic characteristics are included. Consistent with existing research findings that technology use is higher among the young (e.g., Smith, 2014), we find that age is significantly associated with willingness, with younger participants more willing to use the app than older participants (Model 1). The association between age and willingness is more or less linear (Model 2), and there is no significant interaction effect of age with trust on willingness (Model 3). Unlike for trust, other sociodemographic characteristics are also associated with participant willingness scores (Model 1). Consistent with research showing an association with education and technology adoption (e.g., Kennedy & Funk, 2016), we find that participants with a college degree are more willing to use the app than less educated participants. Political ideology is also associated with willingness—conservative participants are less willing to use the app than liberals. Participant race also makes a difference, with Black and Latino participants expressing more willingness to use the app than White participants. This finding is consistent with research suggesting that Blacks and Latinos rely on smartphones for some services more than Whites (Perrin, 2017). Finally, both education and employment status are positively associated with willingness to use the app. Our findings regarding the associations between participant sociodemographic characteristics and willingness to use the app are generally consistent with existing research on the digital divide and adoption of new technologies (e.g., DiMaggio, Hargittai, Neuman, & Robinson, 2001; Fairlie, 2017).
Summary and Discussion
We address the question how consumers’ trust in energy utility companies can be increased. We find that consumers’ trust in utilities is most strongly and consistently increased by utility investments in renewable energy. Consistent with existing literature, our findings also provide some evidence that prosocial investments increase trust. However, this effect only occurs in the convenience sample. We find no effect of prosocial investments for our nationally representative sample. Furthermore, investment in customer communication tools increases trust for the convenience sample, but not for the nationally representative sample. This shows that results from convenience samples do not necessarily generalize to the broader population, thus casting doubt on the generalizability of trust research that relies on convenience samples only. However, we find a consistent association between trust and consumers’ willingness to participate in utility programs across all three studies.
Results of exploratory analyses with our nationally representative sample show that utility proenvironmental investments have stronger effects on trust for older (age 26 years and older) participants. These results are consistent with research suggesting that signals are most effective when a priori levels of trust are low. But, sociodemographic characteristics do not explain differences in the effects of utilities’ prosocial and service-oriented investments across the Prolific and YouGov samples. Our results are partially consistent with studies showing that an actor’s prosocial behavior is indicative of the actor’s trustworthiness and that actors infer trustworthiness from observing prosocial behavior (Barclay, 2004; Fehrler & Przepiorka, 2016; Gambetta & Przepiorka, 2014). But, our results also suggest that the strength of these effects may vary depending on the preexisting levels of trust (Przepiorka & Diekmann, 2013), which, in turn, may vary with actors’ characteristics (e.g., age).
Theoretically, our study contributes to understanding of CSR as signals of trustworthiness. Although every day companies around the world deal with the question how to reduce the uncertainties their stakeholders (e.g., customers and employees) face regarding these companies’ competencies, product qualities, good intentions, and so on, very little work examines the potential of CSR to reduce these information asymmetries (Zerbini, 2017). Conceptualizing CSR as signals of trustworthiness (or other relevant but unobservable properties of the firm) is a very promising theoretical approach that can readily be applied to other contexts such as transport, pharmaceutical, banking, and retail industries (also see Fehrler & Przepiorka, 2016). Our results show that CSR increases trust and that trust, in turn, is associated with consumer behavior in the energy utility context. Furthermore, our finding that utility proenvironmental investments have more consistent effects on trust than do prosocial and service-oriented investments supports the argument that CSR fit matters for the effectiveness of a signal. This is an important insight that points out a potential gap in signaling theory (see, e.g., Gambetta, 2009); signaling theory suggests that any type of behavior, the cost for which is causally related to an unobservable property of interest, can serve as a credible signal of that property. Our findings suggest that it also matters whether CSR is perceived by most customers as being in line with a company’s core business (de Jong & van der Meer, 2017).
Our study also suggests some avenues for future empirical research. Although our results are consistent with arguments about the importance of CSR fit, they raise further questions. In particular, future research should explore factors affecting consumer perceptions of fit, and the weight they place on it, across different types of organizations and in different consumer populations. In the utility context in particular, future research could distinguish between utility proenvironmental behaviors that have a close fit with core business (as here, investment in renewables) and behaviors that are more distant (e.g., investing in environmental nonprofits or reforestation initiatives in Brazil). Such a study would help distinguish between the effects of efforts that help the environment and the utility’s core business and the effects of strategies that affect the environment but do not contribute to the utility’s core business (and may undermine it by potentially increasing prices for customers).
In addition to assessing determinants of fit, future research should examine the signaling effects of corporate strategies on components of trust. Our theoretical discussion assumes that trust has two components—perceptions that a company has both good intent and competence (Mayer et al., 1995). But, we did not distinguish between these possibilities theoretically or empirically. Future research could identify factors that suggest good intent and those that signal competence and assess their relative and interactive effects. For example, in our convenience sample (but not in our representative sample) prosocial behavior increases trust. It may be that prosocial behavior signals good intent (which increases trust), but (at least for utilities) some level of incompetence (which decreases trust). In contrast, proenvironmental behavior—at least, utility investment in renewable energy—may signal both good intent and competence. Distinguishing between intent and competence may contribute to understanding of variation in the effects of prosocial and proenvironmental signals.
Future research should also examine possible variation across individuals. Most experimental studies on signals of trustworthiness are conducted with university students. Our study shows that organizational behavior may have more heterogeneous effects on perceptions of trustworthiness than studies based on convenience samples would suggest. It would be useful to identify relevant individual characteristics and assess the effects of CSR for people with these characteristics. Furthermore, our study was conducted in a particular empirical context (electricity provision in the United States). Thus, it is not clear whether the patterns we find hold across other contexts. U.S. utilities are often seen as quasigovernmental organizations, in turn, potentially raising concerns about government spending. Thus, it is possible that fit is more important for utilities (and government agencies) than for clearly profit-oriented companies that are not expected to act in the public interest. Indeed, a recent analysis of a selection of the 500 largest U.S. corporations does not find any evidence that sustainability performance and financial performance are positively related via sustainability reputations (Sroufe & Gopalakrishna-Remani, 2019). Future research should explore the effects of possible interactions between an organization’s behavior, observer characteristics, and the substantive domain (i.e., type of business).
Future research should also explore people’s perceptions of renewable energy. Whereas our theory assumes that people perceive renewable energy as proenvironmental and prosocial (e.g., Dastrup, Zivin, Costa, & Kahn, 2012; Rai & Beck, 2015; Rai & McAndrews, 2012; Wolske, Stern, & Dietz, 2017), it is also possible that they associate solar energy with investments in technology advancement (Wolske et al., 2017). We cannot fully distinguish between these possibilities here. But, the fact that investments in online customer tools (also a technology) had little effect suggests that renewable energy is different from technology generally. Future research could more explicitly assess reactions to investments in technology as compared with proenvironmental or prosocial investments.
Substantively, our results have implications for utilities seeking to effectively engage with consumers to reduce and shift electricity consumption in ways that facilitate grid management. Our data are consistent with polls showing low levels of trust in utilities and suggest that lack of trust may inhibit consumer responsiveness to utility programs. Our findings suggest that utilities will most effectively increase trust by demonstrating their commitment to renewable energy. Conversely, utility efforts that appear to undermine renewables are likely to decrease trust. For example, utilities are currently in the news for advocating measures that make installing solar panels more difficult for residential customers (e.g., Tabuchi, 2017; Warrick, 2015). Our findings suggest that utility lobbying efforts may have the unintended consequence of reducing consumer trust and feeding antismart meter, antiutility activism. Utilities need to walk a fine line between their business and technological constraints, and consumer buy-in. Even as they manage the grid within a number of constraints (see, e.g., Kraft, 2018), they need to demonstrate a credible commitment to renewable energy.
More generally, our article contributes to understanding of consumer (mis)trust in utilities. It suggests that concerns are more fundamental than just the quality of the customer experience, resting in part on people’s assessments of utility commitments. Improving communication tools, while a typical customer relations strategy (e.g., Accenture, n.d.; Patankar, 2015), may not address people’s fundamental concerns about utility trustworthiness.
Supplemental Material
online_appendix – Supplemental material for How Can Consumer Trust in Energy Utilities be Increased? The Effectiveness of Prosocial, Proenvironmental, and Service-Oriented Investments as Signals of Trustworthiness
Supplemental material, online_appendix for How Can Consumer Trust in Energy Utilities be Increased? The Effectiveness of Prosocial, Proenvironmental, and Service-Oriented Investments as Signals of Trustworthiness by Wojtek Przepiorka and Christine Horne in Organization & Environment
Footnotes
Declaration of Conflicting Interests
The author(s) declared no potential conflicts of interest with respect to the research, authorship, and/or publication of this article.
Funding
The author(s) disclosed receipt of the following financial support for the research, authorship, and/or publication of this article: Christine Horne gratefully acknowledges the financial support of the National Science Foundation (Grant No. 1555980).
Notes
Author Biographies
References
Supplementary Material
Please find the following supplemental material available below.
For Open Access articles published under a Creative Commons License, all supplemental material carries the same license as the article it is associated with.
For non-Open Access articles published, all supplemental material carries a non-exclusive license, and permission requests for re-use of supplemental material or any part of supplemental material shall be sent directly to the copyright owner as specified in the copyright notice associated with the article.