
Abstract
Introduction:
Home care (HC) services are increasingly central to support older adults with complex health needs, yet evidence remains limited on how variations in formal HC service provision are associated with health-related quality of life (HRQoL), particularly when measured using comprehensive assessment data.
Objective:
The objective of this research was to examine the associations between formal HC service levels and HRQoL for older adults receiving this care in Edmonton, Alberta.
Methods:
An observational, retrospective, longitudinal study was completed in Edmonton, Alberta which collected administrative data from Home Care clients who had completed the Resident Assessment Instrument-Home Care (RAI-HC) in sequential years. This data was mapped to the Health Utility Index 3 to report on HRQoL.
Results:
Data were obtained from 8743 clients aged 65 years or older who accepted HC between March 1, 2018 and February 29, 2020. Changes in HRQoL were assessed based on the profession of the service provider and the care type. Multivariable logistic regression was used to examine HC service levels by activity provision associated with improved/stable HRQoL outcomes. Results demonstrated a significant decrease in mean HRQoL for this population, outcomes over time, regardless of the profession, or type of care activity of the HC healthcare provider.
Conclusion:
Individuals who had fewer HC services at baseline were associated with better HRQoL and a higher likelihood of experiencing improved/stable HRQoL compared to those with more HC service time. Various factors were identified that correlated with a lower average HRQoL, including HC clients with a recent health diagnosis, being in an older age group, accessing respite care, and receiving higher levels of HC services. Now that these factors relating to diminished HRQoL have been identified, further research is needed to evaluate possible interventions targeting this issue.
Introduction
The importance of Home Care (HC) services for older adults continues to grow for numerous reasons, including an aging population, an increase in the number of people accessing HC, client preference for in-home care, and control of health care costs. 1 Many countries have prioritized enabling people with complex health needs to remain in their homes longer by providing additional support and more diverse resources. 2 HC in Canada is not regulated within the federal services coordinated by the Canada Health Act. 3 Therefore, depending on the area, variation can exist in publicly provided lifestyle enhancements and professional health services. 4 In the province of Alberta, approximately 115 000 clients are accepting the publicly provided HC services. 5 These services are provided based on clients’ unmet needs, as identified by a case manager. Care is delivered by a multidisciplinary team that includes Registered Nurses, Licensed Practical Nurses, Registered Dietitians, Social Workers, Pharmacists, Respiratory Therapists, Occupational Therapists, Physical Therapists, Recreation Therapists, Therapy Assistants, and Health Care Aides (HCAs). The public HC system often contracts private agencies to deliver HCA services. Additionally, Alberta residents may choose to purchase extra home care services from private providers. Within this context, it is essential to develop an in-depth knowledge of HC services and older adults accepting this care.
The aging process is not uniform among individuals but is characterized by a range of issues, including changes in strength, mobility, cognition, dependence, and physical health. 6 Older adults in many cases can experience multiple chronic conditions concurrently 7 and have a higher prevalence for some conditions which can result in the need for complex health care. 8 Although there has been growing evidence of the benefits of HC services, evaluating the impact of this program has been challenging due to a lack of relevant comparison groups and outcome measures that are unable to capture the entire range of possible benefits. 9 Historically, health outcomes have been objectively measured through morbidity, mortality, and life expectancy, 10 although these traditional indicators are inadequate. 11 As there are improvements in life-saving treatments allowing older adults to live longer and with numerous health conditions, the quality of extended life is becoming more important to individuals, health care providers, and the public health community.12,13 There is growing recognition from both researchers and healthcare providers regarding the need for a comprehensive health status measure to include health-related quality of life (HRQoL). 14 HRQoL is a useful indicator because it quantifies a person’s subjective health status within a group, encompassing multiple dimensions of health – including physical, mental, and psychosocial well-being, 10 and enables comparisons of health over time. 11
Measuring HRQoL within the HC population can present challenges, as there are fewer responses from the oldest age groups due to a decline in physical and cognitive health.15-17 Research results may be biased toward the healthiest and those with stronger cognitive abilities, 15 leading to underrepresented segments of the HC population. An alternative measure often used within HC is the Residential Assessment Instrument – Home Care (RAI-HC). This measure is a comprehensive standardized evaluation of health, function, and care needs for the older adult population using all available health information, which allows for comparison over time and between different locations,20,24-26 although it does not provide an HRQoL outcome.
To compensate for reduced ability to measure HRQoL in the HC population, recent research has proposed a mapping process from the RAI-HC data to the Health Utility Index 3 (HUI3). 15 The HUI is a generic preference-based multi-attribute HRQoL measure that is used internationally.18,19 This mapping process from the RAI-HC to the HUI3 can provide an HRQoL outcome for all individuals accessing HC, even those who may be systematically under-reported. Currently, there is a gap in evidence regarding interactions between HRQoL outcomes and HC service provision for older adults. Therefore, the objective of this research was to examine the associations between formal home care service levels and health-related quality of life for older adults receiving this care in Edmonton, Alberta.
Methods
Study Design, Setting, and Population
We employed an observational, retrospective, longitudinal design, utilizing data previously collected from 2 sources within the provincial healthcare authority, Alberta Health Services (AHS). The first type of data was collected through regular clinical practice from the RAI-HC, which only collects information on services accessed in the past 7 days, or since last assessment if less than 7 days prior. 20 Administrative data was also accessed from AHS to provide a complete report of HC services accessed for the entire study period. This second set of data was a record of 2 continuous years of HC. All data were collected from the Edmonton Zone Home Care program operated by AHS. All community-dwelling individuals 65 years of age and older who were accessing publicly funded HC services were considered for inclusion.
Ethical Considerations
The University of Alberta Research Ethics Board has approved (Identification Number: Pro00108790) the study. Approval was also received from AHS, the organization that provides publicly funded HC services. Information provided to the research team was anonymized before release from AHS.
Inclusion Criteria
For inclusion, clients were required to receive HC from AHS in the community and had to be 65 years of age or older on March 1, 2018. Clients were required to have completed 2 RAI-HC assessments within sequential measurement periods, first between March 1, 2018 to February 28, 2019 (baseline), and a second assessment completed between March 1, 2019 to February 29, 2020 (follow-up). Clients were required to be coded as Long Term Supportive or Maintenance (definitions available online 21 ) with a minimum of 1 service visit per week to ensure they were actively engaged in HC.
Measurements
Demographics were collected from clients RAI-HC assessment including age, gender and the first 3 digits of the postal code of residence.
Health status was evaluated primarily through the RAI-HC assessment, which collects information on a range of physical, mental, and social abilities. For example, the RAI-HC assessment includes: mobility, communication, depression, home safety, health conditions, cognition, hydration, use of care services, falls, medication use, and pain. 20 This measure has been reported to have acceptable reliability and validity.22-25 The RAI-HC is completed within AHS at intake, annually, and following any significant change in client health 26 to support HC’s client care plan development. Additionally, a Comorbidity Index (CI) was created to stratify clients to account for the numerous health conditions that have been identified earlier to affect mortality in longitudinal studies. 27 An updated version of the Charlson Comorbidity Index created by Quan et al 28 was selected, and then updated by 10 additional impactful diagnoses to better represent the HC client population’s disease burden. Higher CI scores indicate a lower health level (Appendix Table 1). Data was also collected for higher levels of care accessed for 90 days before completing the RAI-HC on: (1) Admissions to hospital with an overnight stay; and (2) Visits to Emergency Room (ER) without an overnight stay. 20
Health-related quality of life was assessed using the interRAI HRQoL outcome, which maps information from the RAI-HC to provide answers for questions in the HUI3. The goal of the interRAI HRQoL is to maintain the clinical and theoretical constructs of the HUI3. 15 The HUI3 is a health-status classification system that produces both independent health attribute scores and an overall preference-based summary HRQoL outcome. 19 The 8 health attributes include vision, hearing, speech, ambulation, dexterity, emotion, cognition, and pain with 5 or 6 levels of function for each. 19 A complete description of the creation and validation of this process can be accessed through an earlier publication. 15
Client service use data was provided by AHS, Data Integration, Measurement & Reporting. Service was defined as formal care provided by the HC team and rendered between March 1, 2018 and February 28, 2019 (baseline). Service data included 3 items: identification of the type of healthcare worker who provided care (service profession), categorization of the type of care provided (activity type), and total minutes of services provided for the year for each grouping of profession and category of care. Due to the large number of categories from which information was collected, larger, more encompassing groups were formed. Service profession was comprised of 5 categories including: (1) nursing (registered nurse (RN) and licensed practical nurse); (2) rehabilitation (occupational therapy, physical therapy and therapy assistant); (3) health care aid; (4) social work; and (5) other (services less consistently accessed such as dietitians, pharmacists, and registered respiratory therapists). Activity type was composed of 4 categories, including: (1) case management services; (2) clinical specialties services (professional assessment, Alberta aids to daily living, and professional health service); (3) non-regulated services (homemaking and personal care); and (4) respite services. As service time was provided in minutes per year, for ease of understanding, this was converted into an average of hours per month.
Data Analysis
Client service time was reported in hours/month and was categorized in quartiles for the baseline period. The first quartile of baseline service time identifies the lowest quarter of service time provided, with increasing quartiles reporting higher levels of service. Using the HUI3 scores both at baseline and follow-up, the change score of HUI3 over time was calculated for each client (score of second year assessment minus score of first year assessment). Subsequently, the HUI3 change score was categorized as improved (>0.03), stable (±0.03), and declined (<−0.03), as earlier research noted a meaningful change for the overall HUI3 score as 0.03. 19
To report on the impact of factors associated with HRQoL changes, multivariable regression analysis was completed based on independent variables available to the study group including age, sex, CI diagnosis count, service time provided by category of activity type, and service of emergency care and hospital admission with overnight stay. The regression analyses were performed for each type of activity service (case management, clinical specialties service, non-regulated service, respite services), respectively and adjusted for the effects of other potential confounding variables. Results were reported as odds ratio (OR) and 95% confidence interval (CI) for clients with stable or improved HRQoL outcomes relative to decreased HRQoL. A statistically significant value was set at P < .05. Statistical analysis was completed using STATA version 15 (Stata/IC 15, StataCorp LLC, College Station, TX, USA).
Results
General Characteristics of Sample
A total of 26,969 observations were initially identified for this study, including 11,639 baseline observations and 15,330 follow-up observations. Of these, 3594 repeat observations were removed by retaining the first baseline measurement and the final follow-up measurement for each individual. An additional 3196 observations were excluded because the client was younger than 65 years, and 2693 observations were excluded due to the absence of a baseline measurement. The final analytic sample consisted of 17,486 observations, representing 8743 individuals with both baseline and follow-up measurements. Clients who left the HC program during the follow-up period, including deceased individuals, had their information removed by AHS before the release of information.
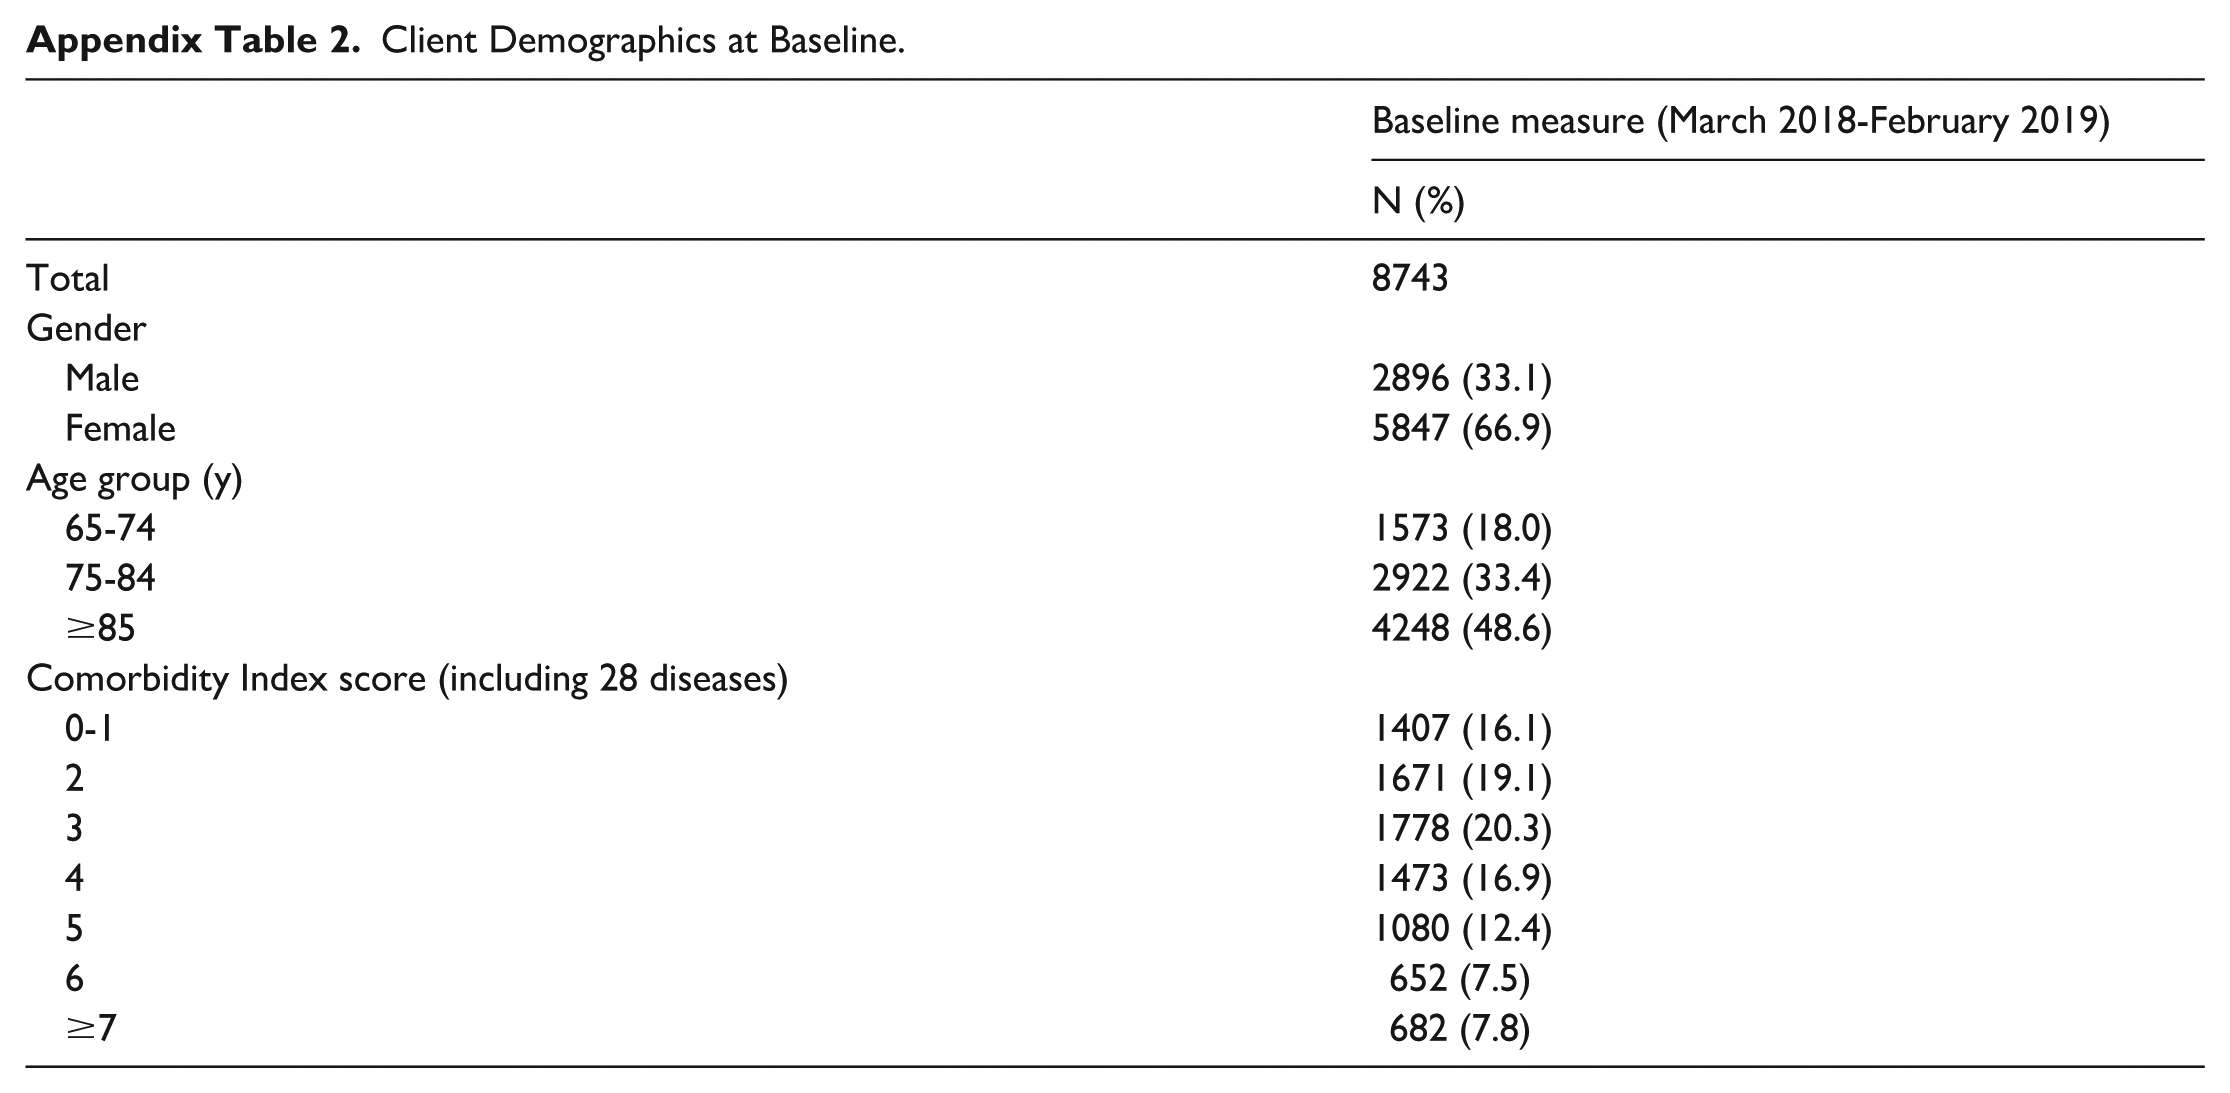
For the 8743 clients, their mean age at baseline was 83.1 (8.3 SD) years. Nearly half (48.6%) of the population was 85 years of age or older (Appendix Table 2). Women represented a larger portion (66.9%) of the sample. Individuals were frequently found to have 2 (19.1%) or 3 (20.3%) comorbidities.
Baseline Service Use
During the baseline year, most clients accessed case management (99.8%), clinical specialties services (100%) and non-regulated service (92.5%) with a minority of clients accepting respite services (7.1%; Table 1). Non-regulated services accounted for the highest mean number of activity type service hours provided (29.6 hours/month) and case management services provided the lowest (1.1 hour/month). Based on service profession, HCAs who are often contracted agency staff provided the highest mean number of hours (29.9 hours/month) which far surpassed care time provided from other professions including nursing (3.8 hours/month), rehabilitation (0.7 hour/month), social work (0.6 hour/month), and other (0.4 hour/month).
Mean HUI Score at Baseline (March 2018-February 2019) and Follow-up (March 2019-February 2020), and Mean Service Time Based on Presence of Service Provision During the Baseline Year.
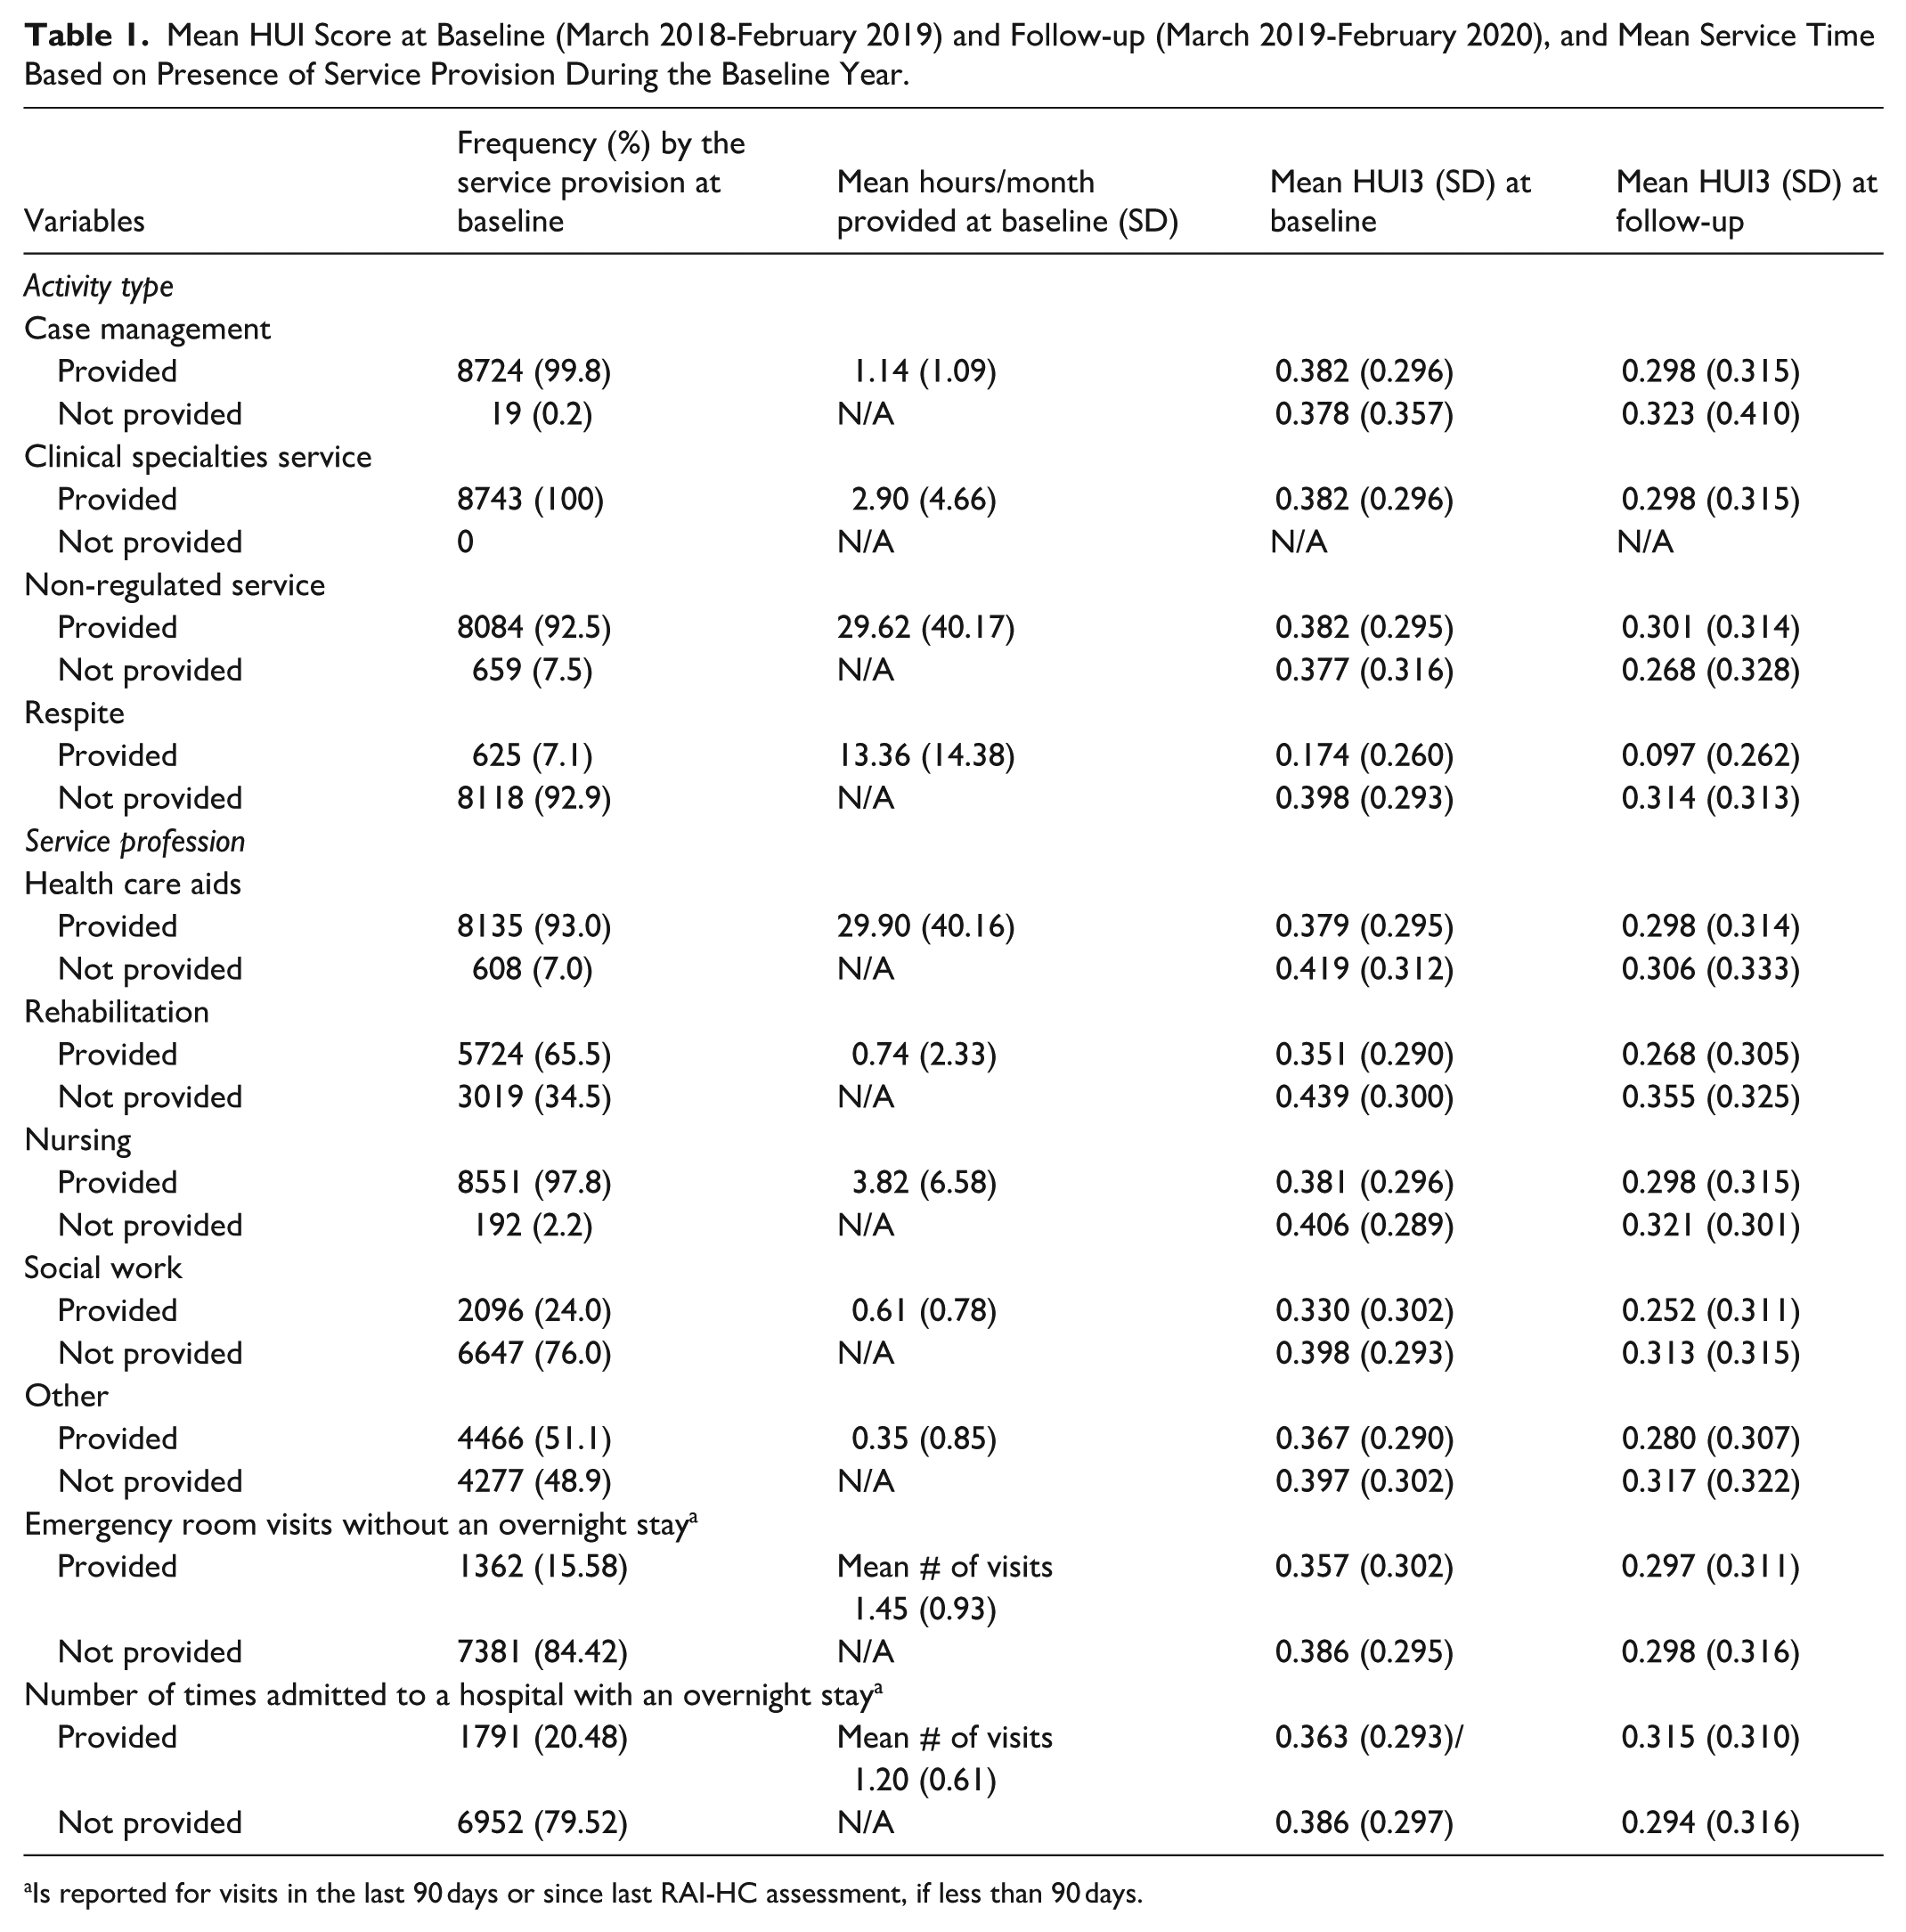
Is reported for visits in the last 90 days or since last RAI-HC assessment, if less than 90 days.
HRQoL and the Changes Over Time by the Service Use
Table 2 presents the mean HUI3 scores based on quartiles of service time (hrs/month) at baseline with the lowest service time provided in the first quartile and highest service time provided in the fourth quartile. The lowest level of service time at baseline (e.g., first quartile) generally had the highest HUI3 score at baseline and follow-up, respectively. Overall, there was a decrease in the average HUI3 outcome of −0.083 (SD 0.27) between baseline and follow-up measures (Tables 1 and 2). The largest levels of change in HUI3 outcomes over time were found for individuals who at baseline had the lowest amount of non-regulated service provided (first quartile), with a decreased HUI3 score of 0.102 (SD 0.291).
Mean HUI3 Score (SD) at Baseline and Follow-up, and the Changes by the Baseline Groups of Activity Affiliation (N = 8743).
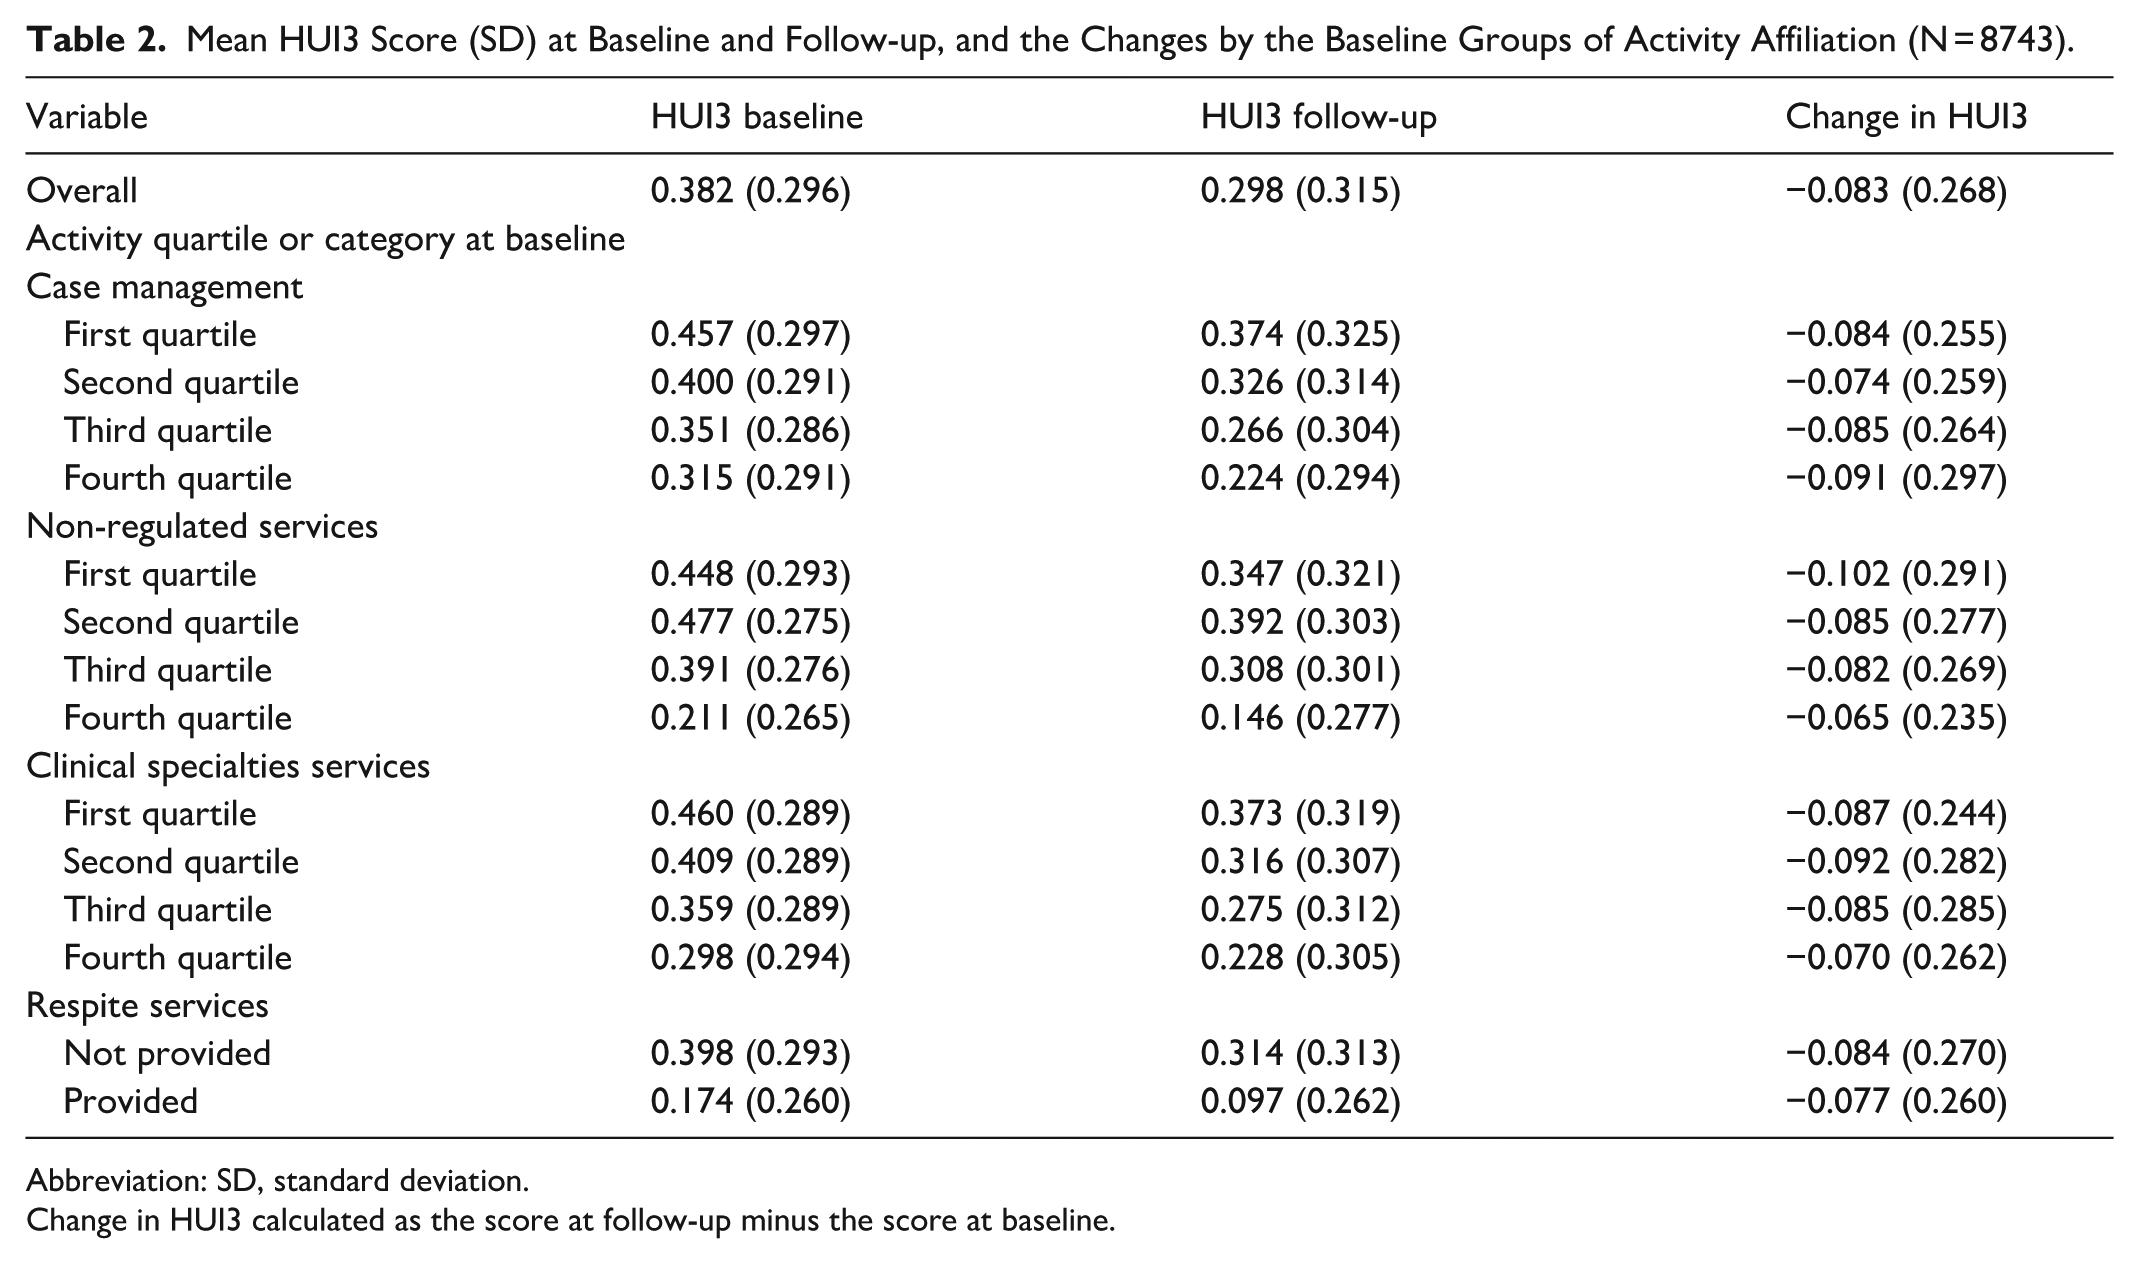
Abbreviation: SD, standard deviation.
Change in HUI3 calculated as the score at follow-up minus the score at baseline.
Regression Analysis
Regression analysis models are presented in Table 3. Overall, regardless of activity type, an increase in provided service hours coincides with a lower probability of improved/stable HUI3 outcomes. For example, case management service (Model 1) was found to have a 9%, 26% and 34% decrease in the odds for an improved/stable HUI3 outcome for the second, third and fourth quartiles, respectively, though the second quartile change did not reach a statistical significance. There is a gradient association between clinical specialties service and HUI3 outcome, where the odds of improve/stable HUI3 decreased with the quartile levels increase, suggesting a cause-and-effect relationship. The exception to this trend was in non-regulated services (Model 2), where there was an increase in likelihood (15%) of having an improved/stable HUI3 outcome among individuals in the second quartile compared to the lowest level of service provision. Clients who were provided with respite services (Model 4) were 35% less likely to have an improved/stable HUI3 outcome. Several factors demonstrated consistency across all models. No statistically significant differences were found between men and women in the OR for an improved/stable HUI3 outcome. Significant differences were found based on age group, with the older age groups having diminished odds for an improved/stable outcome. Individuals were more likely to have a decreased HUI3 outcome for an additional diagnosis during the study period, and even higher for 2 or more additional diagnoses. Individuals with higher baseline HUI3 outcomes had significantly lower odds for an improved/stable HUI3 outcome. In addition, both ER visits and overnight hospitalizations from the baseline year of measurements (capturing 90 days prior to the RAI-HC assessment) increased the odds for improved/stable HUI3 in each service type with OR ranging between 1.10 to 1.16 and 1.21 to 1.32, respectively.
The Association of HUI3 Improved/Stable with the Baseline Healthcare Service Time by Activity Provision (N = 8743).
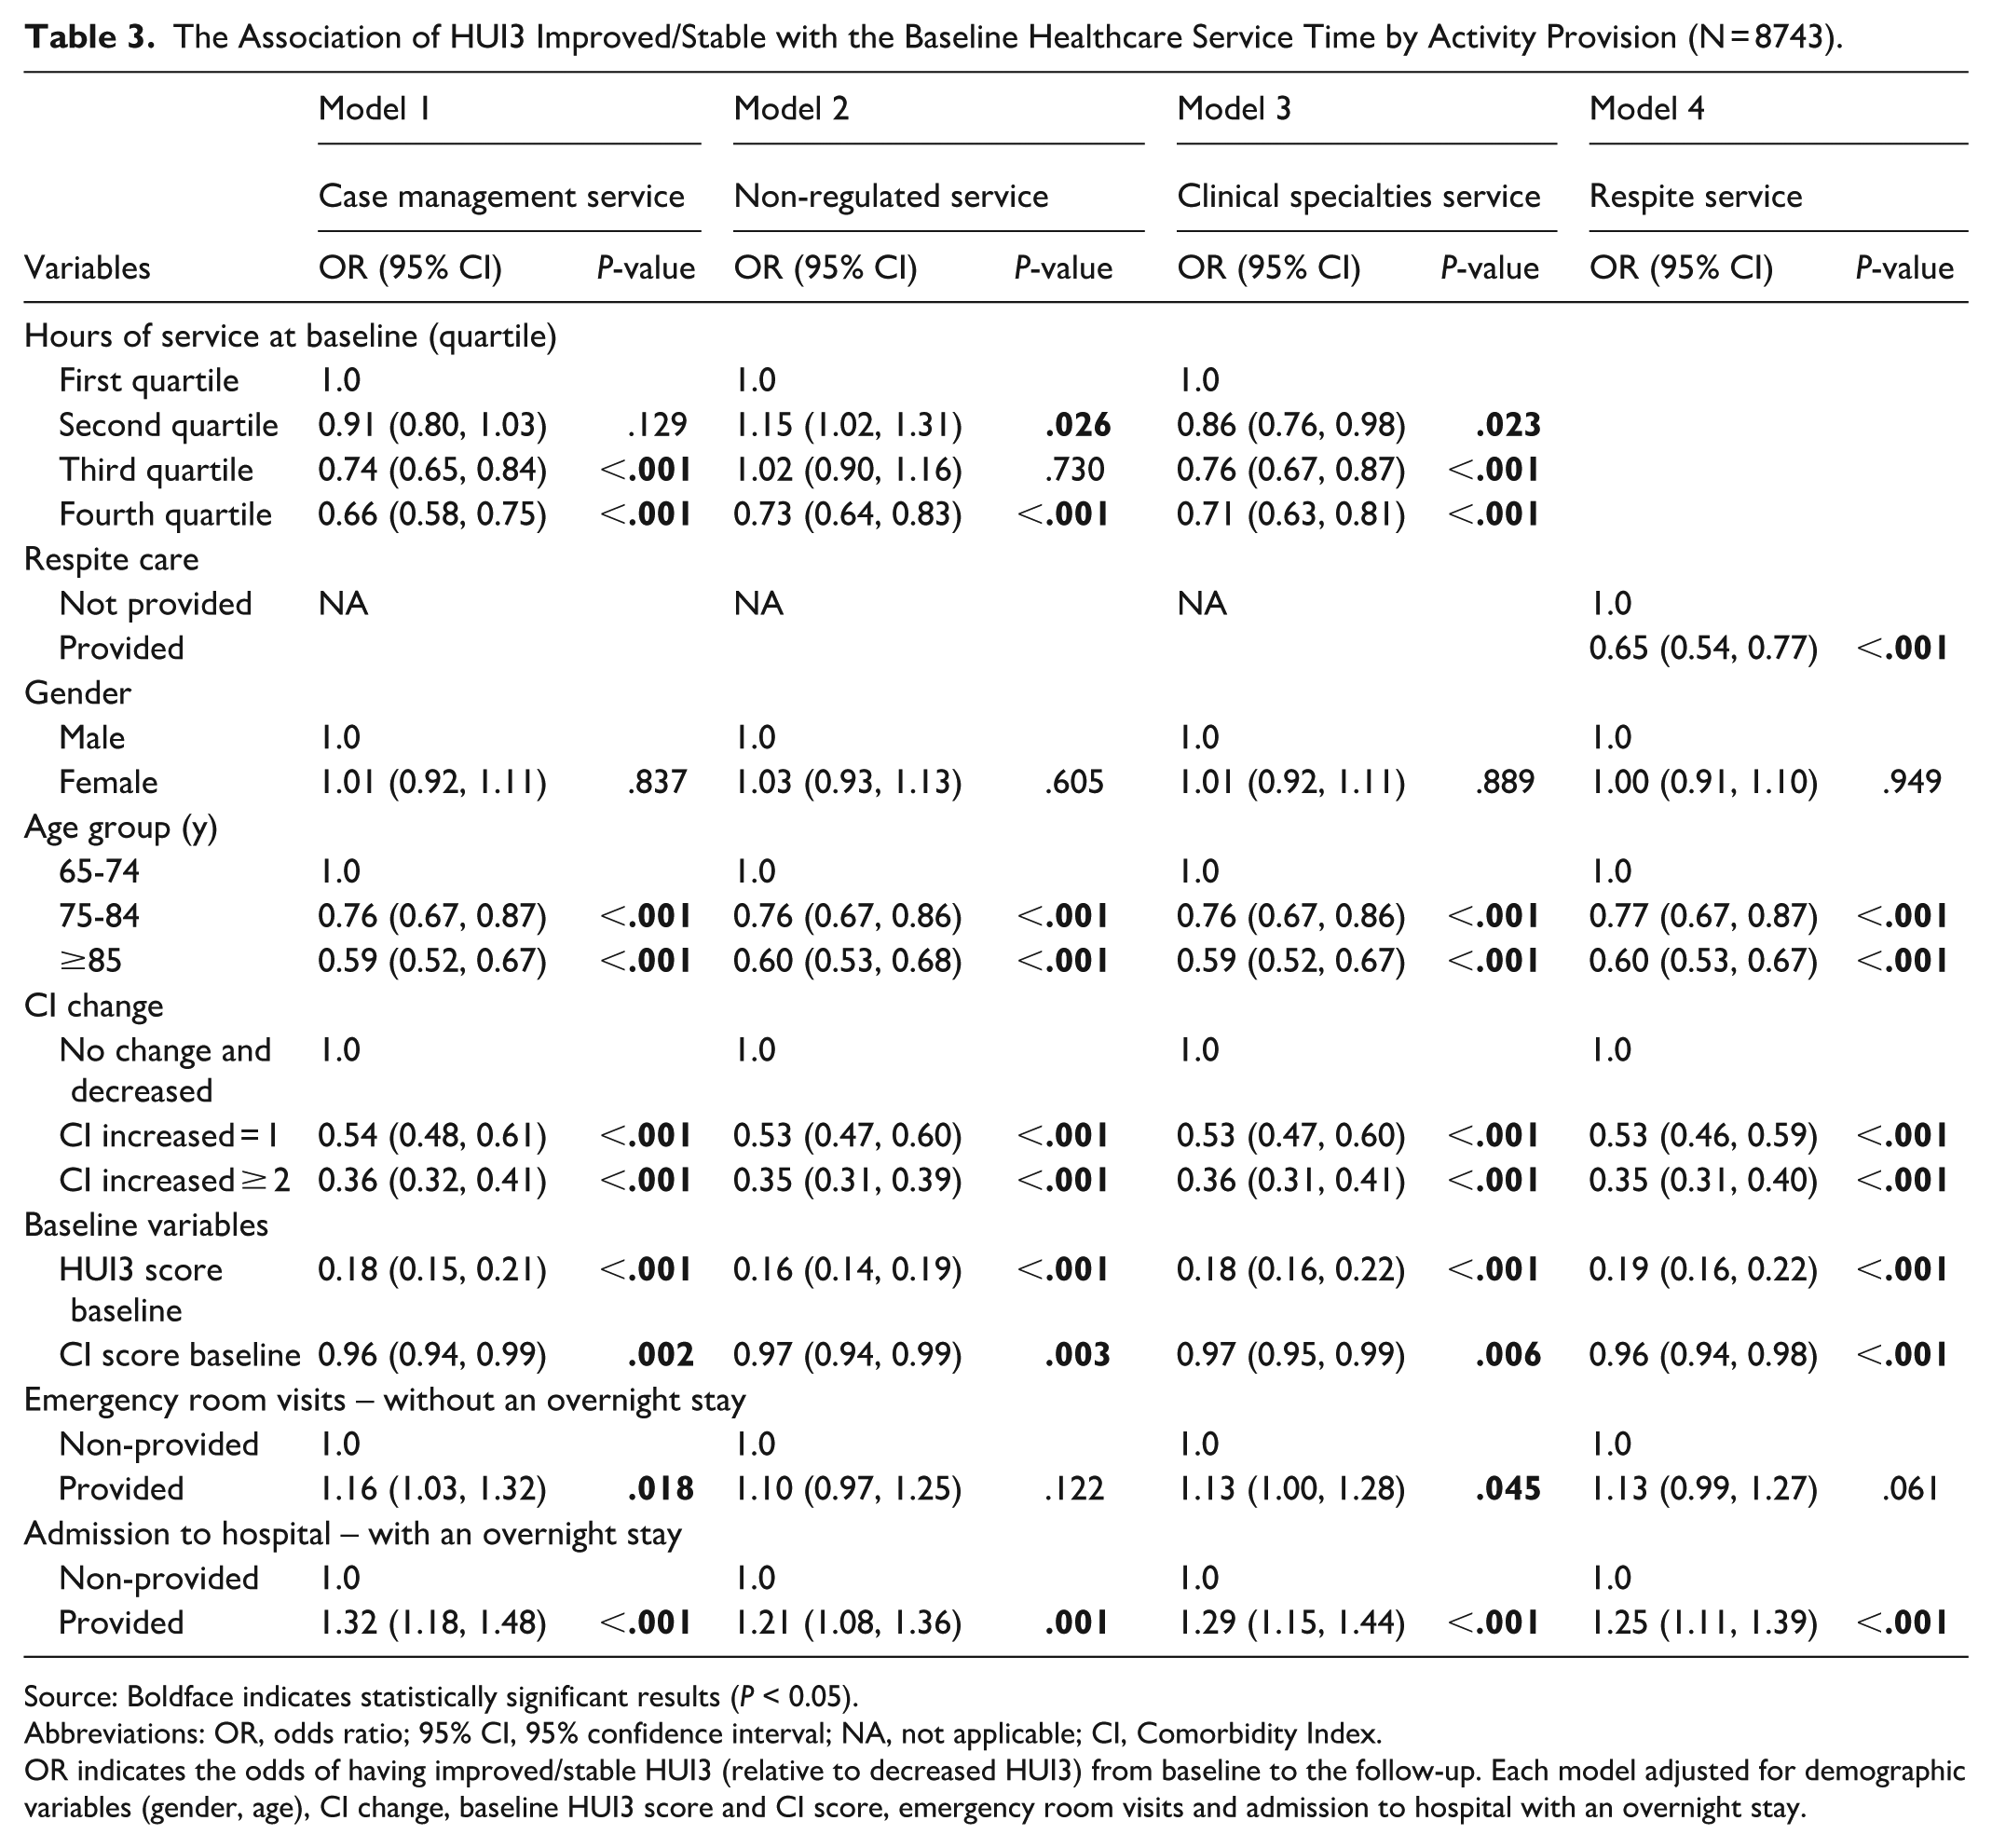
Source: Boldface indicates statistically significant results (P < 0.05).
Abbreviations: OR, odds ratio; 95% CI, 95% confidence interval; NA, not applicable; CI, Comorbidity Index.
OR indicates the odds of having improved/stable HUI3 (relative to decreased HUI3) from baseline to the follow-up. Each model adjusted for demographic variables (gender, age), CI change, baseline HUI3 score and CI score, emergency room visits and admission to hospital with an overnight stay.
Discussion
This study was completed within a publicly funded health care system to investigate HRQoL of older adults accepting HC services on a long-term basis. Irrespective of the activity type, the majority of HC clients experienced a decrease over time in their HRQoL outcomes. The analysis showed that increasing amounts of clinical specialties service, case management and respite service among clients were associated with decreased HRQoL over time. Relative to the lowest level of service (first quartile), clients who received the highest level (fourth quartile) of non-regulated service were less likely to have improved or stable HRQoL. It was observed that access to some higher levels of care, such as emergency room care, admission to hospital with an overnight stay, was accompanied by a smaller reduction in HRQoL at follow-up, compared to those who did not access these services.
To meet client needs, a broad mix of types of services is demonstrated in this study and other research. 29 A Finnish study reported on 17 different components of needs and interventions within HC. 30 Within the current study, most clients were also accepting a variety of care activity types, including case management (99.8%), clinical specialties (100%), and non-regulated services (92.5%). However, comparisons between this study and other HC studies are limited due to the inconsistent defining and grouping of care activities across regions.
With increased understanding for the importance of supporting informal caregivers, respite services are a growing area of interest. This study found that respite care (7.1%) was provided less frequently than other activity types. Clients receiving respite care demonstrated that at baseline their HRQoL was much lower than HC clients not accepting this type of care, which continued to diminish over time. These results suggest that this form of care is being directed to clients who have much more impairment in factors that affect HRQoL, when compared to the other HC clients.
The small group of HC population accessing overnight hospital and ER services were found to have lower baseline and about the same follow-up HRQoL when compared to those HC clients not accessing these services. As the decrease in health outcomes over time was smaller for individuals accessing these services, this indicates the use of these health interventions may support some recovery in their health. Evidence suggests incorporating HC following hospital discharge may assist in preventing hospital readmission 31 and decrease ER visits. 32 This highlights the variety of interacting factors that are impacting HRQoL for individuals who are accessing both HC and higher levels of care.
Individuals receiving more case management and clinical specialty services showed greater decrease in HRQoL over time. This aligns with expectations, as clients with unstable health rely more on case managers to adjust care, increasing staff time. The finding highlights the crucial role of case management in supporting client wellbeing, even though higher service levels are linked to lower HRQoL. Consistent with other studies, case manager activity rises along with increases in client intensity scores. 33
The logistic regression analysis indicates that HC clients are more likely to experience improved/stable HUI3 outcomes if they have a stable diagnostic profile, are in a younger age group, access lower levels of service, and have utilized emergency department (ED) services or experienced an overnight hospital admission within the previous 90 days. The findings related to diagnostic stability, younger age, and lower service levels are expected, as these factors may reflect better overall health compared with the broader HC population. In contrast, the association between improved/stable outcomes and recent ED use or hospitalization appears counterintuitive. One possible explanation is that acute care services successfully stabilize clients’ conditions, thereby preventing further decline. Also, the need for acute care may prompt revisions to clients’ care plans. Because the RAI-HC assessment is completed following significant changes in health status, 26 reassessment by HC Case Managers upon discharge from the hospital may lead to modifications in HC services that positively influence clients’ trajectories.
Overall, these findings suggest that if healthcare providers are interested in bolstering individuals most at risk for a decline in HRQoL, targeting interventions toward clients with recent diagnoses, those in older age groups, and those accessing larger amounts of services should be considered. The findings support the validity of HUI3 measure through mapping from the RAI-HC to HRQoL, showing the measure can discriminate HRQoL changes by HC service levels, comorbidities and demographic characteristics (e.g., age).
This study has several limitations. Service time data were derived from an electronic system that assigns a preset amount of time to recorded tasks, which may introduce measurement error in 1 of the primary independent variables. Because these preset durations may not accurately reflect the actual amount of care time provided to clients, the results in this study may have been impacted by a non-differential misclassification of service level, potentially biasing the findings toward the null or attenuating observed associations. To mitigate this measurement error, infrequent outliers in service time data were truncated to the highest actual possible measure of time provided per month. For example, 40 hours/week of physical therapy care creates a cap of 160 hours/month of physical therapy care. Another limitation is that as HCA care is mainly delivered by contracted agencies, systematic differences may exist between their staff and AHS employees. Data were limited to individuals with 2 sequential RAI-HC assessments within the study period from the city of Edmonton and may not represent rural residents or a full range of socioeconomic backgrounds.
Strengths of this study include its pragmatic design and collaboration with the local healthcare provider to identify HRQoL-related factors in older adults receiving long-stay HC. The mapping process enabled an efficient evaluation of a large, diverse client group, providing a comprehensive assessment of all home care recipients rather than only the healthiest. Health data collected at 2 time points also allowed for a clearer understanding of client changes over time.
Conclusion
This evaluation found a significant decline in mean HUI3 scores over time, regardless of activity type or provider profession involved in care. Lower HRQoL was associated with recent health diagnoses, older age, respite care use, and higher levels of HC service. Future research should assess interventions directed at managing identified factors impacting HRQoL and report study populations and comparators in detail to improve comparability and help providers and policymakers assess relevance.
Footnotes
Appendix
Client Demographics at Baseline.
| Baseline measure (March 2018-February 2019) | |
|---|---|
| N (%) | |
| Total | 8743 |
| Gender | |
| Male | 2896 (33.1) |
| Female | 5847 (66.9) |
| Age group (y) | |
| 65-74 | 1573 (18.0) |
| 75-84 | 2922 (33.4) |
| ≥85 | 4248 (48.6) |
| Comorbidity Index score (including 28 diseases) | |
| 0-1 | 1407 (16.1) |
| 2 | 1671 (19.1) |
| 3 | 1778 (20.3) |
| 4 | 1473 (16.9) |
| 5 | 1080 (12.4) |
| 6 | 652 (7.5) |
| ≥7 | 682 (7.8) |
Acknowledgements
We would like to thank our AHS colleagues, Colleen Berean, Melissa Jameson, and Alexei Potapov, for their support in accessing data and for providing valuable insights in completing this project.
Ethical Considerations
The University of Alberta Research Ethics Board has approved (Identification Number: Pro00108790) the study. Approval was also received from AHS, the organization that provides publicly funded home care services. Information provided to the research team was anonymized prior to release from AHS. Client consent was not required for use of this data.
Consent for Publication
Not applicable.
Funding
The authors disclosed receipt of the following financial support for the research, authorship, and/or publication of this article: No financial relationships exist that may lead to a conflict of interest. Julie Flemming received financial contributions from the Network of Alberta Health Economists Postdoctoral Fellowship, supported financially and in-kind by Alberta Health and administered by the Institute of Health Economics (![]() ).
).
Declaration of Conflicting Interests
The authors declared the following potential conflicts of interest with respect to the research, authorship, and/or publication of this article: Julie Flemming is an employee of the Home and Community Care program, Assisted Living Alberta (formerly within Alberta Health Services).
Data Availability Statement
The data that support the findings of this study are not publicly available.