
Abstract
Previous work showed that the Fidelity120 processing strategy provides better spectral sensitivity, while the HiResolution processing strategy can deliver more detailed temporal information for Advanced Bionics cochlear implant users. The goal of this study was to develop a new sound processing strategy by maximizing the spectral benefit of Fidelity120 and the temporal benefit of HiResolution to improve both aspects of hearing. Using acoustic simulations of Fidelity120 and HiResolution strategies, a dual-processing strategy was created by combining Fidelity120 in the low frequency channels and HiResolution in the high frequency channels. Compared to Fidelity120, the dual processing provided an improvement in performance for Schroeder-phase discrimination at 200 Hz and temporal modulation detection at 200 Hz with the cost of a slightly decreased performance for spectral-ripple discrimination relative to Fidelity120. Spectral-ripple discrimination was better with the dual processing than with HiResolution. However, no benefit for speech perception in noise was found for the dual-processing strategy over Fidelity 120 or HiResolution in our preliminary tests. Some other more optimal combination of Fidelity120 and HiResolution may be required to maximize the spectral and temporal benefits to yield improved speech perception.
Introduction
Cochlear implant (CI) users utilize both spectral and temporal cues to perceive speech. Two dramatically different sound processing strategies have been in clinical use in the Advanced Bionics implant devices: HiResolution (HiRes) intended for better temporal representation and HiResolution Fidelity120 strategy (F120) designed for better spectral resolution. Litvak, Krubsack, and Overstreet (2003) implemented current steering technique in Advanced Bionics CI devices, which is clinically available as F120. In a recent paper, Drennan et al. (2010) evaluated the HiRes and F120 processing strategies in 10 CI listeners. The two strategies did not show any difference in performances for speech recognition in quiet or in noise, and for music perception. However, significant differences were found between the two strategies in terms of spectral and temporal sensitivities: F120 improved spectral sensitivity measured by spectral-ripple discrimination, but F120 also created worse temporal sensitivity as measured by Schroeder-phase discrimination. Here, spectral-ripple discrimination is an efficient measure of spectral resolution (Jones et al. 2013), which is predictive of multiple clinical outcomes in CI users and sensitive to changes in sound processing (Drennan et al., 2010; Won, Drennan, Kang, & Rubinstein, 2010; Won, Drennan, & Rubinstein, 2007). Schroeder-phase discrimination has been used as a measure of temporal resolution in CI users (Drennan et al., 2008), assessing CI users’ ability to perceive across- and within-channel timing differences. Positive and negative Schroeder-phase stimuli have identical long-term spectra and minimal envelope modulations but differ only in their temporal fine structure (Schroeder, 1970). For CI users, the Schroeder-phase discrimination test evaluates the ability of CI listeners to track temporal modulations that sweep rapidly across channels.
Drennan et al. (2010) suggested that a null clinical benefit from F120 was observed because the benefit from the good spectral sensitivity might have been offset by the worse temporal sensitivity. Because F120 showed better spectral-ripple discrimination than HiRes, it is reasonable to expect to see a better representation of the frequency spectra for spectral-ripple stimuli in the outputs processed by F120. To prove that, the spectral-ripple stimuli were processed with acoustic simulations of HiRes and F120 (detail descriptions of the simulations are provided in the Method section). Figure 1 shows the frequency spectra of the outputs for spectral-ripple stimuli with 1 ripple/octave processed with three different strategies. The peaks and valleys in the spectrum of the acoustic input stimulus are well preserved in the F120 output, whereas the HiRes output shows noisy fluctuation with reduced peak-to-valley contrast. The noisy peaks in the HiRes outputs appear to be the result of the use of pure tone carriers. The frequencies of pure tone carriers for the HiRes processing are fixed within the analysis band, so the frequency location of stimulation across the 16 channels are not always related to the peaks in each channel. The F120 processing selects the peaks of the input spectrum in each channel and generates the carriers with the frequencies of those peaks to modulate the temporal envelopes. Thus, F120 processing can better present the frequency components of the input sound and preserve the spectral contrast between the standard and inverted ripple stimuli.
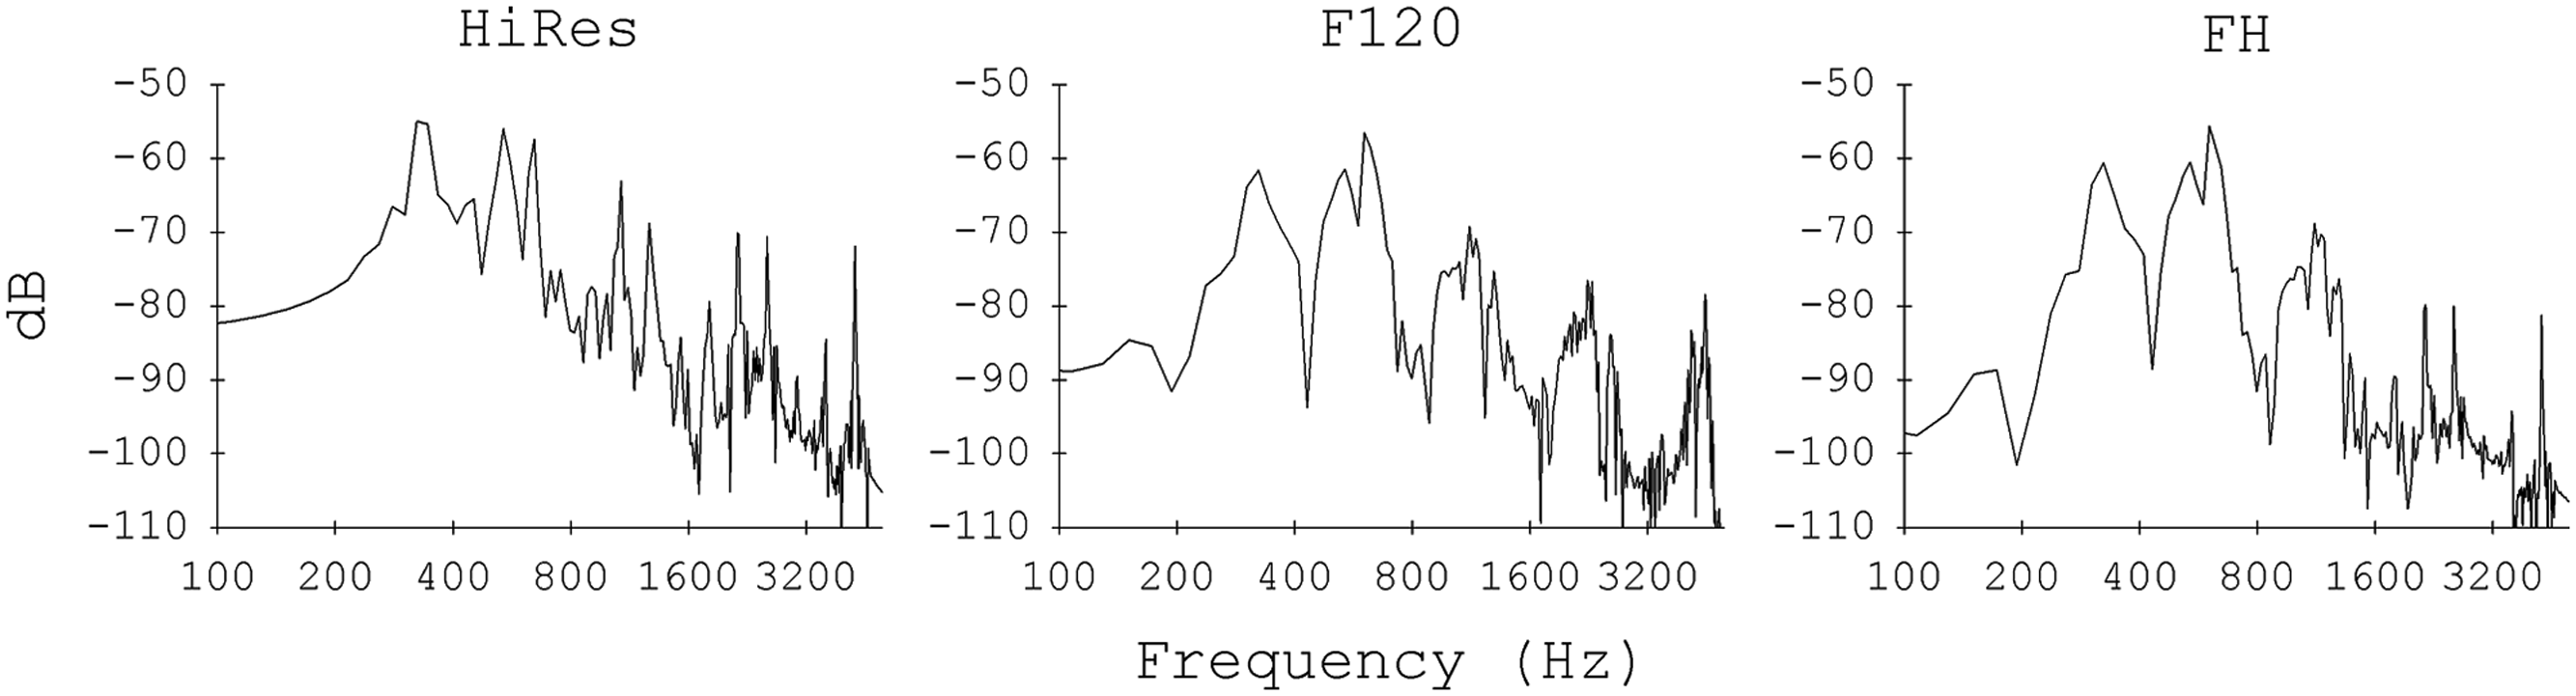
Long-term spectra for spectral-ripple stimuli processed with three different processing strategies. A ripple density of 1 ripples/octave with standard phase was used.
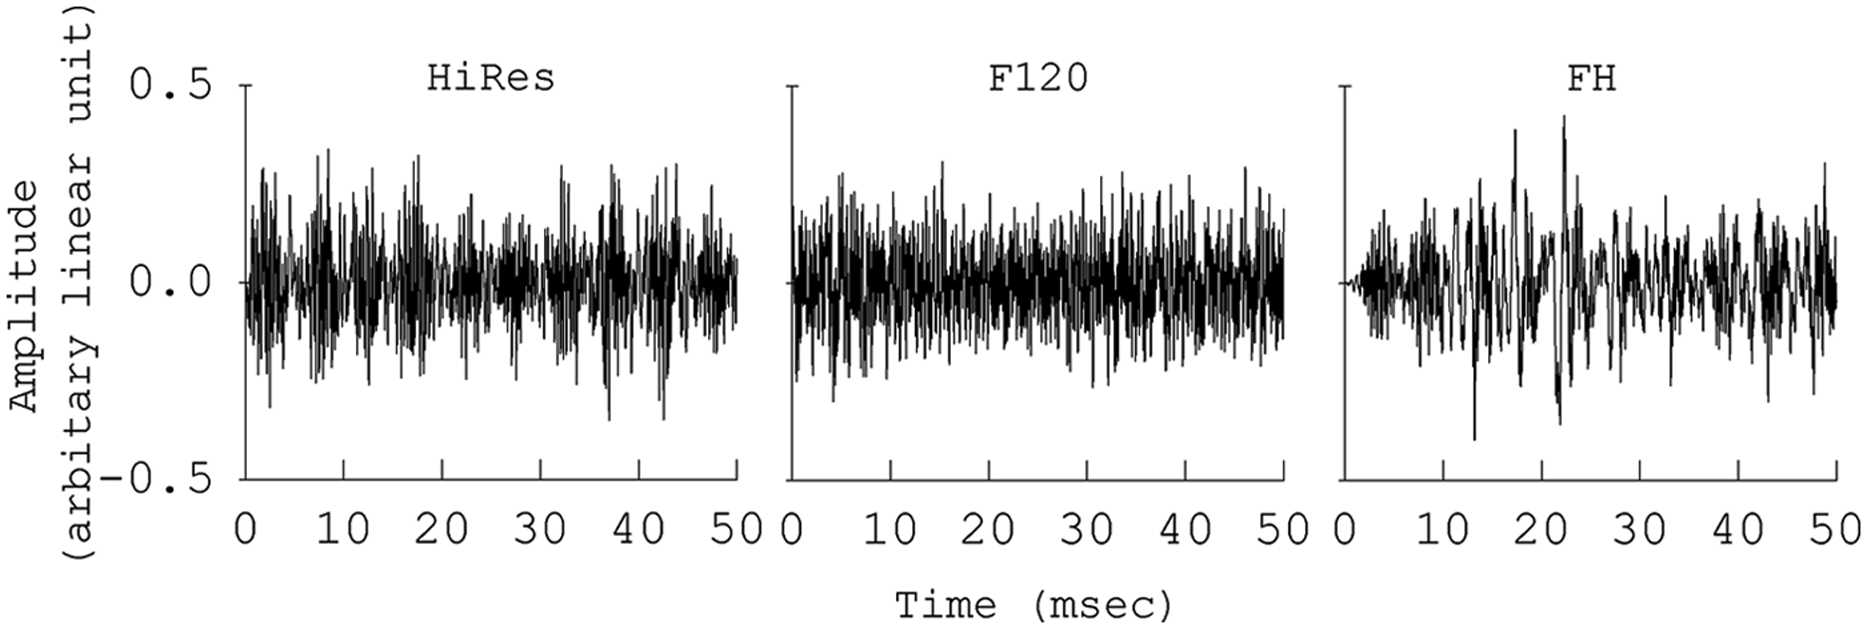
A potential reason for the reduced temporal representation of sound by F120 is that, in contrast to the filter bank processing in HiRes, F120 uses a fast Fourier transform (FFT) in order to do more accurate spectrum analysis of the input sound (Drennan et al., 2010; Litvak et al., 2003; Nogueira, Edler, Ostermann, & Buechner, 2009). F120 takes a look at the spectrum every 1.1 ms using a 14.7 ms sliding window (256 pts Hanning window). This acts as a low-pass filter for temporal envelope information, smearing the temporal envelopes that would be available with HiRes. Thus, the F120 processing as implemented currently does not provide the cues necessary for 200 Hz Schroeder-phase discrimination, which has a 5 ms period. This is shown in Figure 2. The figure shows subband output waveforms for 200 Hz Schroeder-phase stimuli for three different processing strategies. HiRes shows nice envelope modulations in the high frequency channels, whereas F120 shows an almost flat envelope modulation in the high frequency channel outputs. In addition, the outputs for HiRes show that the Schroeder-phase stimuli are transformed into envelope packets that sweep down in frequency. The frequency of the sweep is set by the fundamental frequency of stimulus; in this case, it is 200 Hz. For the positive Schroeder-phase stimuli, the sweep moves from high to low frequency, and for the negative Schroeder-phase stimuli, the sweep moves from low to high frequency. This serves as a powerful cue for CI users to discriminate between positive and negative Schroeder-phase stimuli. In the HiRes outputs, the sweep is clearly observed, but the F120 processing does not represent the sweep of the modulation peaks across the frequency channels and this is a potential reason for discrimination performance degradation.

Subband output waveforms for 200 Hz positive Schroeder-phase stimuli processed with three different processing strategies. The lowest frequency channel outputs are shown in the bottom of the figure and the highest frequency channel outputs are shown in the top of the figure.
Decreasing the window size for the FFT computation could provide better timing resolution, but it will cause a decrease in frequency resolution. Unlike F120, HiRes does not use an FFT but uses real-time filters, so temporal updating occurs every 0.2 to 1.1 ms, thus HiRes provides sufficient temporal information for 200 Hz Schroeder-phase discrimination. Furthermore, for F120, the FFT is linear in frequency presented against log-spaced channels, thus there are more possible points of steered excitation in the high frequency channels than in the low frequency channels because high frequency channels have a much larger bandwidth on a linear frequency scale (Nogueira et al., 2009).
The goal of the current study is to present a new sound processing strategy, designed to overcome the limitation of F120 indicated above. A dual-processing strategy is created by combining F120 and HiRes, such that F120 is used to process low frequency channels from 1 to 8 and HiRes is used to process high frequency channels from 9 to 16. Hereafter, this processing is referred to as “FH” processing. The FH processing was implemented using a sine wave vocoder in collaboration with Advanced Bionics Corporation. The right panel of Figure 1 shows the frequency spectra of the outputs for spectral-ripple stimuli processed by the FH processing. Compared to HiRes, more accurate representation of rippled spectrum is shown in the low frequency region. The right panel of Figure 2 shows the subband outputs for 200 Hz positive Schroeder-phase stimuli processed by the FH strategy. The FH strategy shows the sweep of the modulation peaks in the high frequency channels, which is absent in the F120 outputs. Taken together, the FH strategy is expected to provide a good representation of speech spectra in the low frequency region using F120, and at the same time, it will improve the delivery of the temporal envelope modulation patterns in high frequency channels using HiRes. Therefore, we hypothesized that the FH strategy will benefit from the spectral and temporal advantages of F120 and HiRes, respectively; and as a result, perceptual outcomes will improve.
To test this hypothesis, HiRes, F120, and FH strategies were evaluated using four different perceptual tests. Spectral-ripple discrimination was used to evaluate the spectral sensitivity of these processing strategies. A current CI system delivers primarily temporal envelope modulation information, suggesting that it is important to evaluate the temporal envelope modulation sensitivity for novel sound coding strategies. Thus, the present study used a temporal modulation detection test, where a subject’s detection threshold for a sinusoidally amplitude modulated wide band noise is measured. It is also useful to evaluate both temporal and spectral envelope sensitivities because the spectral-ripple test and temporal modulation detection test have been shown to measure two independent (i.e., not correlated to each other) hearing abilities in CI users (Won, Drennan, Nie, Jameyson, & Rubinstein, 2011).
Schroeder-phase discrimination involves both temporal and spectral sensitivities because the sweep of modulation peaks moves across the frequency channels over a certain period of time. Thus, Schroeder-phase discrimination was used to evaluate the spectrotemporal sensitivities of the three processing strategies. Lastly, in order to evaluate a clinically important outcome, speech perception in steady noise was measured for the three strategies. As a background masker, steady noise was chosen over fluctuating noise because our previous work has shown that there was less learning effect for speech perception in steady noise (Won et al., 2007). From a clinical standpoint, this suggests that the use of steady noise as a background masker would provide a better speech perception test to evaluate clinically meaningful improvements for hearing in noise because the learning effects are minimal. The three tests including spectral-ripple discrimination, Schroeder-phase discrimination, and speech perception in steady noise were used by our previous study (Drennan et al., 2010), where 10 CI users were tested with the same three tests using HiRes and F120 strategies. Therefore, the use of the same three tests will allow us to compare the normal-hearing simulation data from the present study to CI users’ data from a previous work.
Method
Subjects
Eight normal-hearing listeners (four females and four males, ages ranged from 27 to 51) participated in these experiments. All listeners had audiometric thresholds of 25 dB HL or less at octave frequencies between 250 and 8,000 Hz. The present study was approved by the University of Washington Institutional Review Board.
Test Administration
All tests were conducted in a double-walled, sound-treated booth (IAC). Custom MATLAB (The Mathworks, Inc.) programs were used to present stimuli on a Macintosh G5 computer with a Crown D45 amplifier. A single loudspeaker (B&W DM303), positioned 1-m from the subjects at 0° azimuth, presented stimuli in a sound-field condition. The order of the sound processing strategies and perceptual tests were randomized across the subjects.
Speech reception threshold (SRT) in steady-state noise
In this SRT in noise test, the subjects were asked to identify one randomly chosen spondee word out of a closed-set of 12 equally difficult spondees (Harris, 1991) in the presence of speech-shaped, steady-state noise (Turner et al., 2004; Won et al., 2007). The spondees, two-syllable words with equal emphasis on each syllable (e.g., “birthday,” “padlock,” “sidewalk”), were recorded by a female talker (F0 range: 212-250 Hz; Turner et al., 2004). Duration of the steady-state noise was 2.0-s and the onset of the spondees was 500 ms after the onset of the noise. A closed-set, 12-adaptive forced choice (AFC) task with 1-up, 1-down adaptive tracking procedure was used to determine SRTs, converging on 50% correct (Levitt, 1971). The level of the target speech was fixed at 65 dBA. The noise level was varied with a step size of 2 dB. Feedback was not provided. For all subjects, the adaptive track started with +10 dB signal-to-noise ratio (SNR) condition. The threshold for a single adaptive track was estimated by averaging the SNR for the final 10 of 14 reversals. Three adaptive tracks were repeated to determine the average thresholds.
Spectral-ripple discrimination
The spectral-ripple discrimination test in this study is the same as that previously described by Won et al. (2007). Two-hundred pure tone frequency components were summed to generate the rippled noise stimuli. The 200 tones were spaced equally on a logarithmic frequency scale. The amplitudes of the components were determined by a full-wave rectified sinusoidal envelope on a logarithmic amplitude scale. The ripple peaks were spaced equally on a logarithmic frequency scale. The stimuli had a bandwidth of 100 to 5,000 Hz and a peak-to-valley ratio of 30 dB. The mean presentation level of the stimuli was 61 dBA and randomly roved ±4 dB in 1 dB steps. The starting phases of the pure tone components were randomized for each presentation. The ripple stimuli were generated with 14 different densities, measured in ripples per octave. The ripple densities differed by ratios of 1.414 (0.125, 0.176, 0.250, 0.354, 0.500, 0.707, 1.000, 1.414, 2.000, 2.828, 4.000, 5.657, 8.000, and 11.314 ripples/octave). Standard (reference stimulus) and inverted (ripple phase reversed test stimulus) ripple stimuli were generated. For standard ripples, the phase of the full-wave rectified sinusoidal spectral envelope was set to zero radians, and for inverted ripples, it was set to π/2. The stimuli had 500 ms total duration and were ramped with 150 ms rise/fall times. Stimuli were filtered with a long-term, speech-shaped filter (Byrne et al., 1994). A 3-AFC, two-up and one-down adaptive procedure was used to determine the spectral-ripple density resolution threshold converging on 70.7% correct (Levitt, 1971). Each adaptive track started with 0.176 ripples/octave and moved in equal ratio steps of 1.414. Feedback was not provided. The threshold for a single adaptive track was estimated by averaging the ripple spacing (the number of ripples/octave) for the final 8 of 13 reversals. The primary dependent variable for this test was the mean threshold estimated from three adaptive tracks.
Schroeder-phase discrimination
The Schroeder-phase discrimination test in the current study is the same as that previously described by Drennan et al. (2008). Positive and negative Schroeder-phase stimulus pairs were created for two different F0s of 50 and 200 Hz. For each F0, equal-amplitude harmonics from the F0 up to 5 kHz were summed. Phase values for each harmonic were determined by the following equation:

where θn is the phase of the nth harmonic, n is the nth harmonic, and N is the total number of harmonics in the complex. The positive or negative sign was used for the positive or negative Schroeder-phase stimuli, respectively. The Schroeder-phase stimuli were presented at 65 dBA without roving the level. A 4-interval, 2-AFC procedure was used. One stimulus (i.e., positive Schroeder-phase, test stimulus) occurred in either the second or third interval and was different from three others (i.e., negative Schroeder-phase, reference stimulus). The subject’s task was to discriminate the test stimulus from the reference stimuli. Visual feedback was provided. To determine a total percent correct for each F0, the method of constant stimuli was used. In a single test block, each F0 was presented 24 times in random order and a total percent correct for each F0 was calculated as the percent of stimuli correctly identified. The dependent variables for this test were the mean percent correct of three test blocks for each F0.
Temporal modulation detection
The modulation detection test in this study is the same as that previously described by Won et al. (2011), which was adapted from the methods of Bacon and Viemeister (1985). Acoustic stimuli were 2-s in duration. One of the two 1-s observation intervals consisted of sinusoidally amplitude modulated wide band noise, and the other 1-s observation interval consisted of continuous wide band noise. For the modulated stimuli, sinusoidal amplitude modulation is applied to the wideband noise carrier using the following equation: [f(t)][1 + misin(2πf
mt)], where f(t) is the wideband noise carrier, mi is the modulation index (i.e., modulation depth), and f
m is the modulation frequency. A modulation frequency of 200 Hz was used. The modulation frequency was chosen based on a previous study (Won et al., 2011) that modulation detection thresholds (MDTs) at 200 Hz were significantly correlated with SRTs in steady-state noise (r = 0.56, p < 0.05) in 24 CI users. This relatively high modulation frequency was also desirable to avoid the ceiling effect at lower modulation frequencies. To compensate the intensity increment for the modulated stimuli, the modulated waveform was divided by a factor of
Output waveforms for sinusoidally amplitude modulated noise at 200 Hz processed with the three different processing strategies
Single-interval, 2-AFC procedure was used to measure MDTs. Stimuli were presented in sound-field at 65 dBA. During one of the two 1-s observation interval, the carrier was sinusoidally amplitude modulated. The subjects were instructed to choose the interval which contains the modulated noise. A 2-down, 1-up adaptive procedure was used to measure the modulation depth (mi) threshold, converging on 70.7% (Levitt, 1971), starting with a modulation depth of 100% and decreasing in steps of 4 dB from the first to fourth reversal, and 2 dB for the next 10 reversals. The final 10 reversals for each run were averaged to obtain the MDT for each test run. Three test blocks were conducted. MDTs in dB relative to 100% modulation [20log10(mi)] are reported.
Sine Wave Vocoder Simulations
HiResolution (HiRes) strategy
Figure 4 shows the functional block diagram for HiRes vocoder sound processing. An audio signal was digitally sampled at 17,400 Hz. The signal was filtered into 16 channels using an array of infinite impulse response, sixth-order Butterworth filters. The filter bank utilized in this simulation used the same frequency cutoff, center frequency, and bandwidth for 16 channels as in the actual HiRes processing that is clinically in use. The frequency allocations for 16 channels were: 250-416 Hz for CH1, 416-494 Hz for CH2, 494-587 Hz for CH3, 587-697 Hz for CH4, 697-828 Hz for CH5, 828-983 Hz for CH6, 983-1168 Hz for CH7, 1168-1387 Hz for CH8, 1387-1648 Hz for CH9, 1648-1958 Hz for CH10, 1958-2326 Hz for CH11, 2326-2762 Hz for CH12, 2762-3281 Hz for CH13, 3281-3898 Hz for CH14, 3898-4630 Hz for CH15, and 4630-8700 Hz for CH16. Next, the envelope of each channel was computed on a frame-by-frame basis every 10 samples over 0.57 ms (10/17,400) by performing the half-wave rectification and averaging the outputs of each filter. The output of each channel was used to modulate a sine wave with frequency equal to the center frequency of the corresponding analysis channel. Each modulated tone was then filtered with the initial analysis filters to eliminate sidebands. 1 Finally, the modulated tones were summed together to create sine wave vocoded stimuli. The HiRes simulation was implemented using custom MATLAB programs.

Functional block diagram of the HiRes vocoder processing
Fidelity120 (F120) strategy
F120 processing was implemented using custom MATLAB programs and a current steering stimulator. Figure 5 shows the functional block diagram for the F120 vocoder sound processing. An input audio signal was sampled at a sampling frequency (Fs) of 17,400 Hz and windowed using a 256-point Hanning window, and then a FFT was performed to analyze the spectrum of the windowed sound with a duration of 14.7 ms. For 16 channels, the same frequency allocations were used as with HiRes processing. A total of 113 FFT bins were allocated along the processing spectrum (i.e., 250-8,700 Hz). Two adjacent channels formed an analysis band, resulting in 15 analysis bands with the 16 channels. The number of bins for each analysis band was 1, 2, 1, 2, 2, 2, 3, 4, 4, 5, 6, 7, 8, 19, and 47. The envelope and spectral peak information (in Hz) of each band were computed on a frame-by-frame basis every 0.57 ms. The Hilbert envelope of each analysis band was determined by computing the root mean square of the bins in each band. If the number of bins in a band is equal to or less than four, those bins are combined to compute the envelope. If the number of bins is larger than four, the first four bins are combined to compute one envelope (e1), and the next four bins are computed for another envelope (e2) in this analysis band. The net envelope (E) for this analysis band is computed by combining the energy in the two envelopes, which is
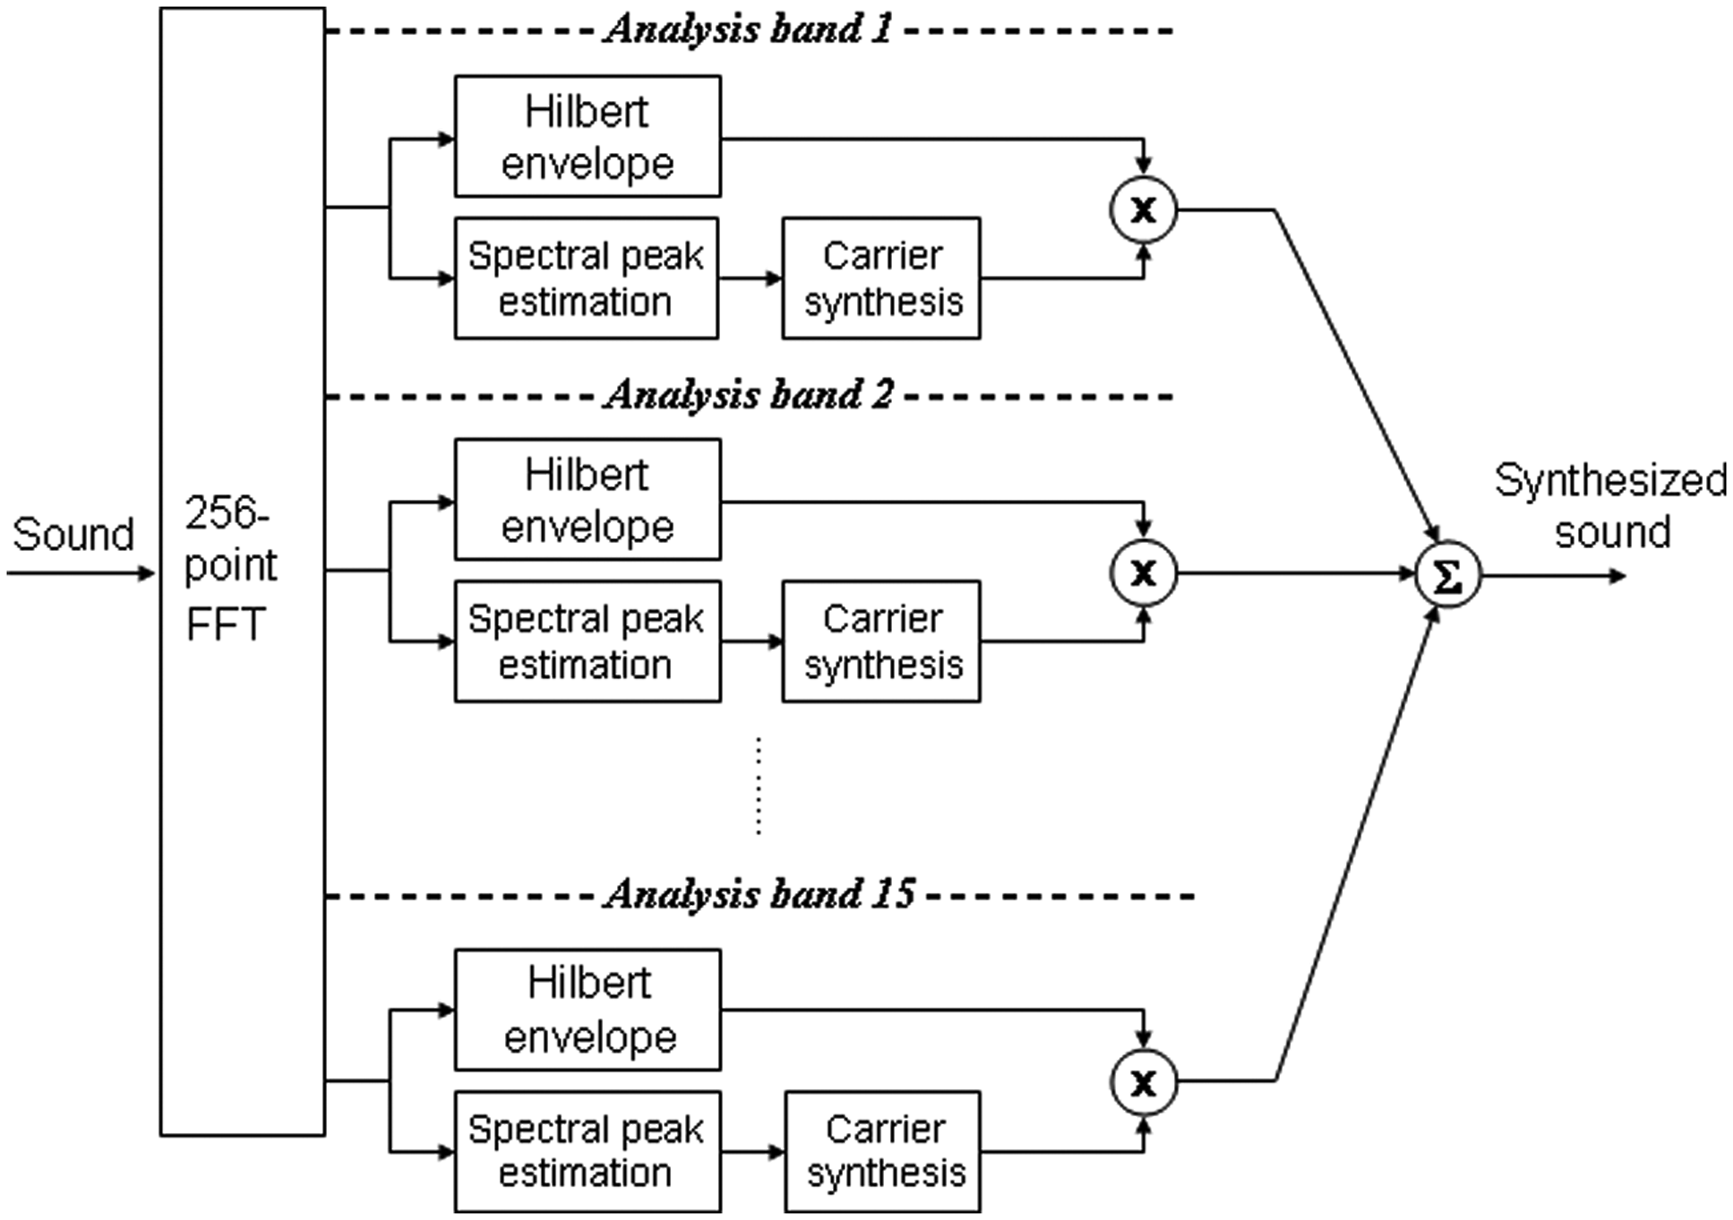
Functional block diagram of the F120 vocoder processing
FH strategy
The outputs of the eight low frequency channels (CH1-CH8; 250-1,387 Hz) of the F120 simulation were aligned in time and combined with the outputs of the eight high frequency channels (CH9-CH16; 1,387-8,700 Hz) of the HiRes simulation.
Results
Spectral-ripple discrimination was best with F120 followed by FH and HiRes. The individual and mean results from spectral-ripple discrimination are shown in Figure 6. The mean spectral-ripple threshold was 3.36 ripples/octave for HiRes, 5.42 ripples/octave for F120, and 4.25 ripples/octave for FH processing, and 4.64 ripples/octave with HF. Figure 7 shows the individual and mean scores from Schroeder-phase discrimination at 50 and 200 Hz. Schroeder-phase discrimination at 50 Hz did not show difference across the three processing strategies. For 200 Hz condition, HiRes and FH showed almost identical performance (66.5% vs. 69.4%) and F120 showed worst performance (57%).

Individual and average (AVG) thresholds for spectral-ripple discrimination. Error bars for individual data represent standard deviation across three repetitions. Error bar for average data represents standard deviation across the eight listeners.

Percent correct scores for individual and average data for 50 and 200-Hz Schroeder-phase discrimination. Error bars for individual data represent standard deviation across three repetitions. Error bar for average data represents standard deviation across the seven listeners.
Figure 8 shows the individual and mean thresholds from modulation detection at 200 Hz. HiRes showed the best performance (−8.3 dB relative to 100% modulation), followed by FH (−6.6 dB relative to 100% modulation) and F120 (−2.4 dB relative to 100% modulation).

Individual and average MDTs. Error bars for individual data represent standard deviation across three repetitions. Error bar for average data represents standard deviation across the seven listeners.
Figure 9 shows the speech perception in speech-shaped, steady-state noise test results. There was no difference in performance among the three strategies for individuals and for the group.

Individual and average speech reception thresholds (SRTs). Error bars for individual data represent standard deviation across three repetitions. Error bar for average data represents standard deviation across the 8 listeners.
Discussions
The benefit of the FH processing was observed for Schroeder-phase discrimination at 200-Hz (57% with F120 vs. 69.4% with FH). For the 200-Hz Schroeder-phase stimuli, there are six harmonics in between 250 and 1,387 Hz and it takes about 1.1 ms to sweep from 200 Hz (1st harmonic) to 1.2 kHz (6th harmonic) in one cycle (5 ms), so it is almost impossible to distinguish the across-channel sweeping cue in the low frequency channels. However, there are 19 harmonics in between 1,387 and 8,700 Hz and it takes about 3.9 ms to sweep in one cycle and the across-channel sweeping cue is clearly available in these regions. Therefore, when HiRes was used in the high frequency channels (FH) where the across-channel sweeping cue is present, the subjects could show better ability in the 200-Hz Schroeder-phase task.
For the temporal modulation detection test, HiRes showed the best performance. In CI processing, the envelope modulations for each channel are determined by the filter bandwidth and the envelope cutoff frequency. The temporal modulation detection test in the present study used a modulation frequency of 200-Hz. If the filter bandwidth is less than 400 Hz, then that channel is not capable of representing the 200-Hz modulation. For HiRes processing, the higher five channels (CH 12-16) have filter bandwidth larger than 400 Hz. For F120 processing, however, the number of bins in each analysis band determines its bandwidth. A single FFT bin represents a frequency interval of 67.97 Hz (i.e., Fs/L = 17,400 Hz/256 bins = 67.97 Hz/bin; Fs is a sampling frequency; L is a window length for the FFT computation). Thus, at least three bins (67.94 H/bin × 3 bins = 203.8 Hz) are required to have a channel bandwidth larger than 200 Hz. There are three or more than three bins in between band 7 and band 15 in F120 processing. Therefore, theoretically, channels 12-16 in HiRes and bands 7-15 in F120 have envelope modulations above 200 Hz after band-pass filtering, but the envelope cutoff frequency will ultimately determine whether those channels are capable of encoding the 200-Hz modulation. HiRes updates its envelope every 0.57 ms and it is roughly equivalent to the envelope low-pass cutoff frequency at 1,754 Hz. Thus, the higher channels of HiRes can represent the 200-Hz envelope modulation. However, the envelope low-pass cutoff frequency for F120 corresponds to the number of bins combined together to compute the envelope. So, the highest possible cutoff frequency for F120 is 271.8 Hz in between band 8 and band 15. However, the actual envelope cutoff frequency would be well below 271.8 Hz, because the averaging process over the FFT bins would result in the envelope smoothing. Therefore, only weak or even no 200-Hz modulation can be presented through the higher 8 bands in F120. The HiRes and F120 processing capabilities described above are consistent with the subject testing results: HiRes was the best and F120 was the worst in the temporal modulation detection test and the FH was in between the two strategies.
Compared to F120, the FH processing provided temporal benefits on the 200-Hz Schroeder-phase discrimination and the temporal modulation detection tasks, but it did not provide any benefit for speech perception in steady-state noise. The temporal benefits in the higher frequency regions might not be so pertinent to speech perception ability measured by spondee word recognition in steady-state noise, because the target spondee words have a fundamental frequency range of 212 to 250 Hz. On the other hand, the FH processing resulted in a slight reduction in benefit for spectral-ripple discrimination provided by F120 (5.4 ripples/octave with F120 vs. 4.2 ripples/octave with FH). It is possible that the temporal benefit from FH might have been offset by reduced spectral sensitivity, which could result in no net benefit in speech perception.
Compared to HiRes, the FH processing showed better performance for spectral-ripple discrimination and similar performance for Schroeder-phase discrimination at 200 Hz, but temporal modulation detection was worse with the FH processing than with HiRes. Subsequently, no benefit was observed for speech perception in noise by FH processing relative to HiRes. All of these mixed outcome patterns for the three processing strategies suggest that certain processing strategies can differentiate certain acoustic cues, either spectral or temporal, and make them detectable for listeners. This additional information is necessary, but may not be sufficient to improve speech perception in noise. Substantial clinical benefits might be obtained if a sound processing strategy could maximize delivery of both spectral and temporal information. It is also important to consider that the normal-hearing subjects in the present study were tested acutely. It may be possible that CI users would actually benefit from longer exposure to the dual-processing strategy for better speech perception outcomes.
The present study evaluated a dual-processing strategy only in a single form. In addition, acoustic simulations of cochlear implant sound processing do not reflect differences in peripheral conditions potentially present in CI users such as varying neural survival or nerve health. Anderson, Nelson, Kreft, Nelson, and Oxenham (2011) showed that considerably different spectral-ripple thresholds were observed within individual CI subjects across the stimulation sites in the electrode array. If the variation in the spectral-ripple thresholds in different frequency locations is due to peripheral physiological and anatomical variables in CI users, then it might be appropriate to design dual-processing strategies on an individual-site basis. Frequency locations that show good spectral sensitivity might be effective for sound processing strategies which deliver detailed spectral information of sound such as F120. On the other hand, for the frequency locations identified as having poor spectral-ripple resolution, sound processing strategies emphasizing temporal information such as HiRes might be the more effective method of stimulation. The maximum performance of the dual strategy might be observed if more virtual channels are directed to frequency ranges with high spectral resolution in an individual listener.
Footnotes
Acknowledgements
We appreciate the dedicated efforts of our subjects and we thank Leo Litvak of Advanced Bionics for providing the acoustic simulation codes for the HiResolution and Fidelity120 sound processing strategies.
Author Note
This article was a part of the first author’s PhD dissertation. Portions of this work were presented at the 34th meeting of the ARO, Baltimore, Maryland, February 19-23, 2011.
Declaration of Conflicting Interests
The authors declared no potential conflicts of interest with respect to the research, authorship, and/or publication of this article.
Funding
The authors disclosed receipt of the following financial support for the research, authorship, and/or publication of this article: This study was supported by NIH grants R01-DC007525, R01-DC010148, P30-DC04661, F31-DC009755, and L30-DC008490 an educational fellowship from Advanced Bionics Corporation.