
Abstract
The auditory midbrain implant (AMI) is a new hearing prosthesis designed for stimulation of the inferior colliculus in deaf patients who cannot sufficiently benefit from cochlear implants. The authors have begun clinical trials in which five patients have been implanted with a single shank AMI array (20 electrodes). The goal of this review is to summarize the development and research that has led to the translation of the AMI from a concept into the first patients. This study presents the rationale and design concept for the AMI as well a summary of the animal safety and feasibility studies that were required for clinical approval. The authors also present the initial surgical, psychophysical, and speech results from the first three implanted patients. Overall, the results have been encouraging in terms of the safety and functionality of the implant. All patients obtain improvements in hearing capabilities on a daily basis. However, performance varies dramatically across patients depending on the implant location within the midbrain with the best performer still not able to achieve open set speech perception without lip-reading cues. Stimulation of the auditory midbrain provides a wide range of level, spectral, and temporal cues, all of which are important for speech understanding, but they do not appear to sufficiently fuse together to enable open set speech perception with the currently used stimulation strategies. Finally, several issues and hypotheses for why current patients obtain limited speech perception along with several feasible solutions for improving AMI implementation are presented.
Keywords
Introduction
Deep brain stimulation (DBS) for treating hearing loss has gained momentum over the past decade. Early attempts at stimulating the central auditory system to induce sound sensations have been documented for the auditory cortex (Dobelle, Stensaas, Mladejovsky, & Smith, 1973; Penfield & Rasmussen, 1950) and the inferior colliculus (IC; Simmons, Mongeon, Lewis, & Huntington, 1964). These initial attempts were motivated, in part, by the growing interest and number of investigations surrounding auditory nerve and cochlear stimulation for hearing restoration (Andreev, Gersuni, & Volokhov, 1935; Djourno & Eyries, 1957; Djourno, Eyries, & B. Vallancien, 1957; Djourno, Eyries, & P. Vallancien, 1957; Wilson & Dorman, 2008; Zeng, 2004). At least for cochlear stimulation, continued research and progress have resulted in the most successful neural prosthesis to date. More than 100,000 patients worldwide have been implanted with what is called the cochlear implant (CI), which consists of an electrode array that is inserted into the cochlea and designed to electrically stimulate the remaining auditory nerve fibers (Figure 1). Remarkably, patients can extract sufficient information from the crude stimulation patterns to understand speech with many being able to converse over the telephone (Adams, Hasenstab, Pippin, & Sismanis, 2004). For a review, see Zeng (2004) and Wilson and Dorman (2008).

Cochlear implant (CI) system. There are many types of CI systems with different processor designs and electrode arrays. This image presents a behind-the-ear CI system developed by Cochlear Ltd. It consists of a small processor that fits behind the ear with a microphone located near the white tip (not shown). The processor communicates with the receiver-stimulator implanted in a bony bed in the skull beneath the skin surface through a telemetry interface (brown coil). The ground ball electrode connected to the receiver-stimulator is placed within the temporalis muscle whereas the electrode array is positioned within the cochlea with the 22 electrodes aligned along its tonotopic gradient. The electrodes are designed to stimulate the remaining nerve fibers that exit to the right of the image. Image printed with permission from Cochlear Ltd.
In contrast to CIs, central auditory prostheses have experienced slower development and progress. The first central hearing prosthesis known as the auditory brainstem implant (ABI), which consisted of a ball-type electrode, was implanted on the surface of the cochlear nucleus by William E. Hitselberger and William F. House in 1979 at House Ear Institute (Los Angeles, CA) with a total of 25 patients implanted by 1992 (Schwartz, Otto, Shannon, Hitselberger, & Brackmann, 2008). This implant was initially designed for patients with a genetic disease known as neurofibromatosis type 2 (NF2), which is usually associated with bilateral acoustic neuromas. Removal of these tumors and complete damage of the auditory nerves, the patients became bilaterally deaf and unable to benefit from CIs. Because the cochlear nucleus was approached during tumor removal, it was then possible to place the electrode on its surface with minimal added surgical risk. Since 1992, the single channel ABI has been developed into a multisite surface array (see Figures 2 and 3 for one example) by several implant companies (i.e., Advanced Bionics Corp., Sylmar, CA; Cochlear Ltd., Lane Cove, Australia; Med-El Company, Innsbruck, Austria; MXM Digisonic, Vallauris Cedex, France) and implanted in more than 600 patients worldwide with etiologies no longer limited to NF2 (e.g., nerve aplasia/avulsion, cochlear ossification; Behr et al., 2007; Colletti & Shannon, 2005; Colletti, Shannon, Carner, Veronese, & Colletti, 2009; Lenarz et al., 2001; Nevison et al., 2002; Schwartz et al., 2008). This expansion of the ABI field has occurred within the last 10 years. For example, approximately 300 ABIs were sold by Cochlear Ltd. by the year 2000 with a rise to about 800 units by 2007. This number has jumped to about 1,100 by 2009 (values provided by Frank Risi, Cochlear Ltd.). Based on a PubMed search (as of May 2009) using the keyword “auditory brainstem implant,” a total of 116 publications were listed in which 96 were dated from 1999. These trends demonstrate that central auditory prostheses, particularly the ABI, has become more widely accepted and implemented in patients over the past decade. For further details and trends on the ABI, see Colletti et al. (2009), Colletti and Shannon (2005), McCreery (2008), and Schwartz et al. (2008).

Auditory brainstem implant array. An example of an electrode array, developed by Cochlear Ltd., designed for surface stimulation of the cochlear nucleus for hearing restoration. This array consists of 21 active platinum disk electrodes mounted on a 3 × 8.5 mm silicone carrier backed with PET mesh (additional flaps to fix array to tissue surface). Each of the electrodes has a diameter of about 0.7 mm. Image printed with permission from Cochlear Ltd.

Simplified brain schematic showing locations of different auditory implants. Both the penetrating auditory brainstem implant (PABI) and auditory midbrain implant (AMI) are in clinical trials. All the devices shown have been developed by Cochlear Ltd. though other auditory brainstem implants (ABIs) and cochlear implants (CIs) have been developed by various companies.
Unfortunately, the recent surge in ABI implantations has been followed by inconsistent success (Behr et al., 2007; Colletti et al., 2009; Colletti & Shannon, 2005; Grayeli, Kalamarides, Bouccara, Ambert-Dahan, & Sterkers, 2008; Lenarz et al., 2001; Otto, Brackmann, Hitselberger, Shannon, & Kuchta, 2002; Schwartz et al., 2008) and few scientific investigations directed toward understanding how to consistently and effectively activate higher auditory centers with cochlear nucleus stimulation. This understanding is crucial considering that most ABI patients experience performance levels significantly lower than CIs. There are numerous hypotheses of why certain patients (e.g., nontumor patients with head trauma or altered cochlear patency) perform better than other patients (Colletti et al., 2009; Colletti & Shannon, 2005) and how CI-based strategies and surface arrays are suboptimal for cochlear nucleus activation though they have continued to be used for the past 30 years (Kuchta, Otto, Shannon, Hitselberger, & Brackmann, 2004; McCreery, 2008; Schwartz et al., 2008; Shivdasani, Mauger, Rathbone, & Paolini, 2008). These different hypotheses have recently pushed forward new investigations into alternative types of DBS implants, such as a penetrating ABI and the auditory midbrain implant (AMI), as well as basic science experiments in animals and humans to understand how to improve current ABIs. Furthermore, the pioneering work of Vittorio Colletti (Department of Otorhinolaryngology, University of Verona, Italy) in pushing ABI use in nontumor patients has begun to shed light onto which patient populations can achieve open set speech perception with the ABI (Colletti et al., 2009), though the functional mechanisms responsible for the wide variability across patients (even those within a “good” group, such as those with altered cochlear patency) still require further investigation.
The goal of this review is to focus on one of those new directions in central auditory prostheses: the development of an IC-based implant called the AMI. We will first review the different hypotheses relating to ABI performance that led into the rationale for selecting and developing the AMI. We will then provide an overview of the animal feasibility and safety studies as well as the fresh cadaver surgical preparations performed to obtain clinical approval. Finally, we will present the initial findings in the first three AMI patients that have led to a better understanding of the advantages and limitations of the current system and potential solutions for improving the AMI for future patients.
There were many researchers, clinicians, and engineers involved with the development and implementation of the AMI. For simplicity, “we” will be used throughout the text to refer to those involved at each of the different stages of the AMI project and who are listed in the Acknowledgments section.
Rationale for an AMI
The CI is implanted into the cochlea and designed for stimulation of the remaining nerve fibers. However, there are many patients who cannot benefit from a CI because they do not have a viable auditory nerve to stimulate (e.g., because of nerve avulsion or aplasia) or an implantable cochlea (e.g., because of ossification or malformations). For these patients, the only clinically approved solution is the ABI. In the United States, the ABI is only available to NF2 patients whereas several other countries have recently obtained approval for implantation into nontumor patients. What has been quite surprising is the difference in average performance across the patient groups. In more than 600 ABI NF2 patients, only a small percentage has achieved moderate open set speech perception (Colletti et al., 2009; Schwartz et al., 2008). There are a few exceptional performers who can achieve hearing abilities approaching those of top CI patients (Behr et al., 2007; Colletti & Shannon, 2005). In our clinic, only 2 of 29 NF2 ABI patients obtain good open set speech perception though still not comparable with our top CI patients (unpublished observation). However, this is in contrast to the significantly higher number of nontumor patients who can perform well with the ABI (Colletti et al., 2009). For example, in a recent comparison reported by Colletti et al. (2009), 48 nontumor ABI patients scored an average of 59% on an open set speech test compared with an average score of 10% across NF2 patients. These differences were even greater when limiting the nontumor group to those with head trauma or altered cochlear patency (i.e., excluding those with auditory neuropathy or severe cochlear malformations). Considering that similar implant technologies, stimulation strategies, and surgical approaches are used for both patient groups, these findings suggest that the limited performance observed in NF2 patients may be related to some form of damage induced at the level of the cochlear nucleus because of the tumor and/or tumor removal process. This damage may result from tumor compression of the cochlear nucleus that can induce coding deficits in the central auditory system (Crea et al., 2009; Matthies et al., 2000) or even a compromised vasculature to the cochlear nucleus because of the tumor or its removal (Colletti & Shannon, 2005). Therefore, at least in NF2 patients, it is hypothesized that stimulating within an auditory nucleus distant from this damaged region may provide a better alternative to the ABI.
There are still questions as to whether the limited performance in NF2 patients and the large variability in hearing capabilities across nontumor patients are attributed to insufficient activation of the cochlear nucleus with an ABI. The ABI is placed along the surface of the cochlear nucleus in which the sites are aligned obliquely to its tonotopic gradient. This requires higher current levels to reach the appropriate neurons located centrally within the cochlear nucleus, thus a greater spread of current and a reduced ability to achieve frequency-specific activation of the auditory system. Considering that the ability to transmit a greater number of independent frequency channels of information has shown to be important for improved speech understanding (Friesen, Shannon, Baskent, & Wang, 2001; Shannon, Fu, & Galvin, 2004), it has also been hypothesized that the diffuse activation effects limits the performance achieved by many ABI patients (Kuchta et al., 2004; McCreery, 2008; Shivdasani et al., 2008). Recently, clinical trials have been in progress with a new type of penetrating ABI (PABI) that consists of 8 or 10 shanks, each with an activated iridium site at the tip (2,000 or 5,000 μ2) (McCreery, 2008; Otto et al., 2008; Figure 3). The rationale for the PABI was to achieve direct and more localized, frequency-specific activation of the cochlear nucleus in hopes of improving overall speech performance in NF2 patients. Encouragingly, the PABI has been able to achieve low and stable activation levels as well as a wide range of pitch percepts across sites that were implanted into the cochlear nucleus. However, there were difficulties in appropriately placing most of the sites, in which only 14 out of 72 sites across 9 patients provided auditory sensations. Furthermore, the overall performance for those patients with active sites has not yet exceeded that of current ABI NF2 patients. This does not indicate that penetrating stimulation of the cochlear nucleus will not improve performance over the surface ABI. It is clear that the cochlear nucleus is a complex neural structure (Cant & Benson, 2003; Moore & Osen, 1979; Osen, 1969; Young, Robert, & Shofner, 1988; Young, Spirou, Rice, & Voigt, 1992) and stimulation of different regions of the cochlear nucleus elicits complex activation patterns in higher auditory centers (McCreery, 2008; Shivdasani et al., 2008). Therefore, what remains to be seen is if we can improve placement of electrodes into the appropriate regions within the cochlear nucleus as well as better understand how to stimulate the complex circuitry more synergistically across multiple regions to restore sufficient speech perception.
In considering the different hypotheses discussed above, there appears to be multiple factors influencing the performance in current ABI patients, including other factors such as duration of deafness and patient-specific complications (Colletti, 2006; Grayeli et al., 2008). However, the dramatic difference in overall performance reported for tumor versus nontumor patients strongly supports the hypothesis that NF2 tumors or their removal generally compromises auditory processing at the level of the cochlear nucleus, at least what is required for restoring speech understanding with the crude stimulation patterns delivered by the surface sites of the ABI. Furthermore, the fact that many NF2 patients can still understand speech up until tumor removal (Bance & Ramsden, 1999; Colletti & Shannon, 2005; Slattery, Brackmann, & Hitselberger, 1998), even those with large tumors, suggests that auditory nuclei beyond the cochlear nucleus are still functionally intact for processing speech information. Therefore, stimulation of an auditory structure beyond the hypothesized damaged cochlear nucleus may provide improvements over ABI stimulation in NF2 patients.
The question arises as to which auditory structure would serve as an alternative location for a new auditory prosthesis. The region must be surgically accessible in humans, provide a well-defined neuronal organization that would enable systematic spatial stimulation of different functional regions and is not located too far along the auditory pathway associated with more complex coding properties. An appropriate balance among these criteria resulted in selection of the IC, particularly its central nucleus (ICC). The ICC is a converging center for almost all ascending auditory brainstem projections (Casseday, Fremouw, & Covey, 2002), which should provide access to pathways necessary for speech understanding. It also consists of a well-defined laminated organization (Figure 4). Based on anatomical similarities across mammalian species and the fact that these laminae have shown to correspond to different frequency layers in animals (Geniec & Morest, 1971; Oliver, 2005), it is inferred that the human ICC also consists of well-defined tonotopic layers. This is important for an auditory prosthesis considering that the ability to transmit specific frequency information has shown to be important for achieving high levels of speech understanding in normal hearing and CI subjects (Friesen et al., 2001; Shannon et al., 2004). Furthermore, the IC is surgically accessible in humans (see section Surgical Approach) and it is possible to modify commonly used DBS stereotactic approaches to the midbrain for safe implantation of an electrode array into the IC (Green et al., 2006; Wichmann & Delong, 2006).
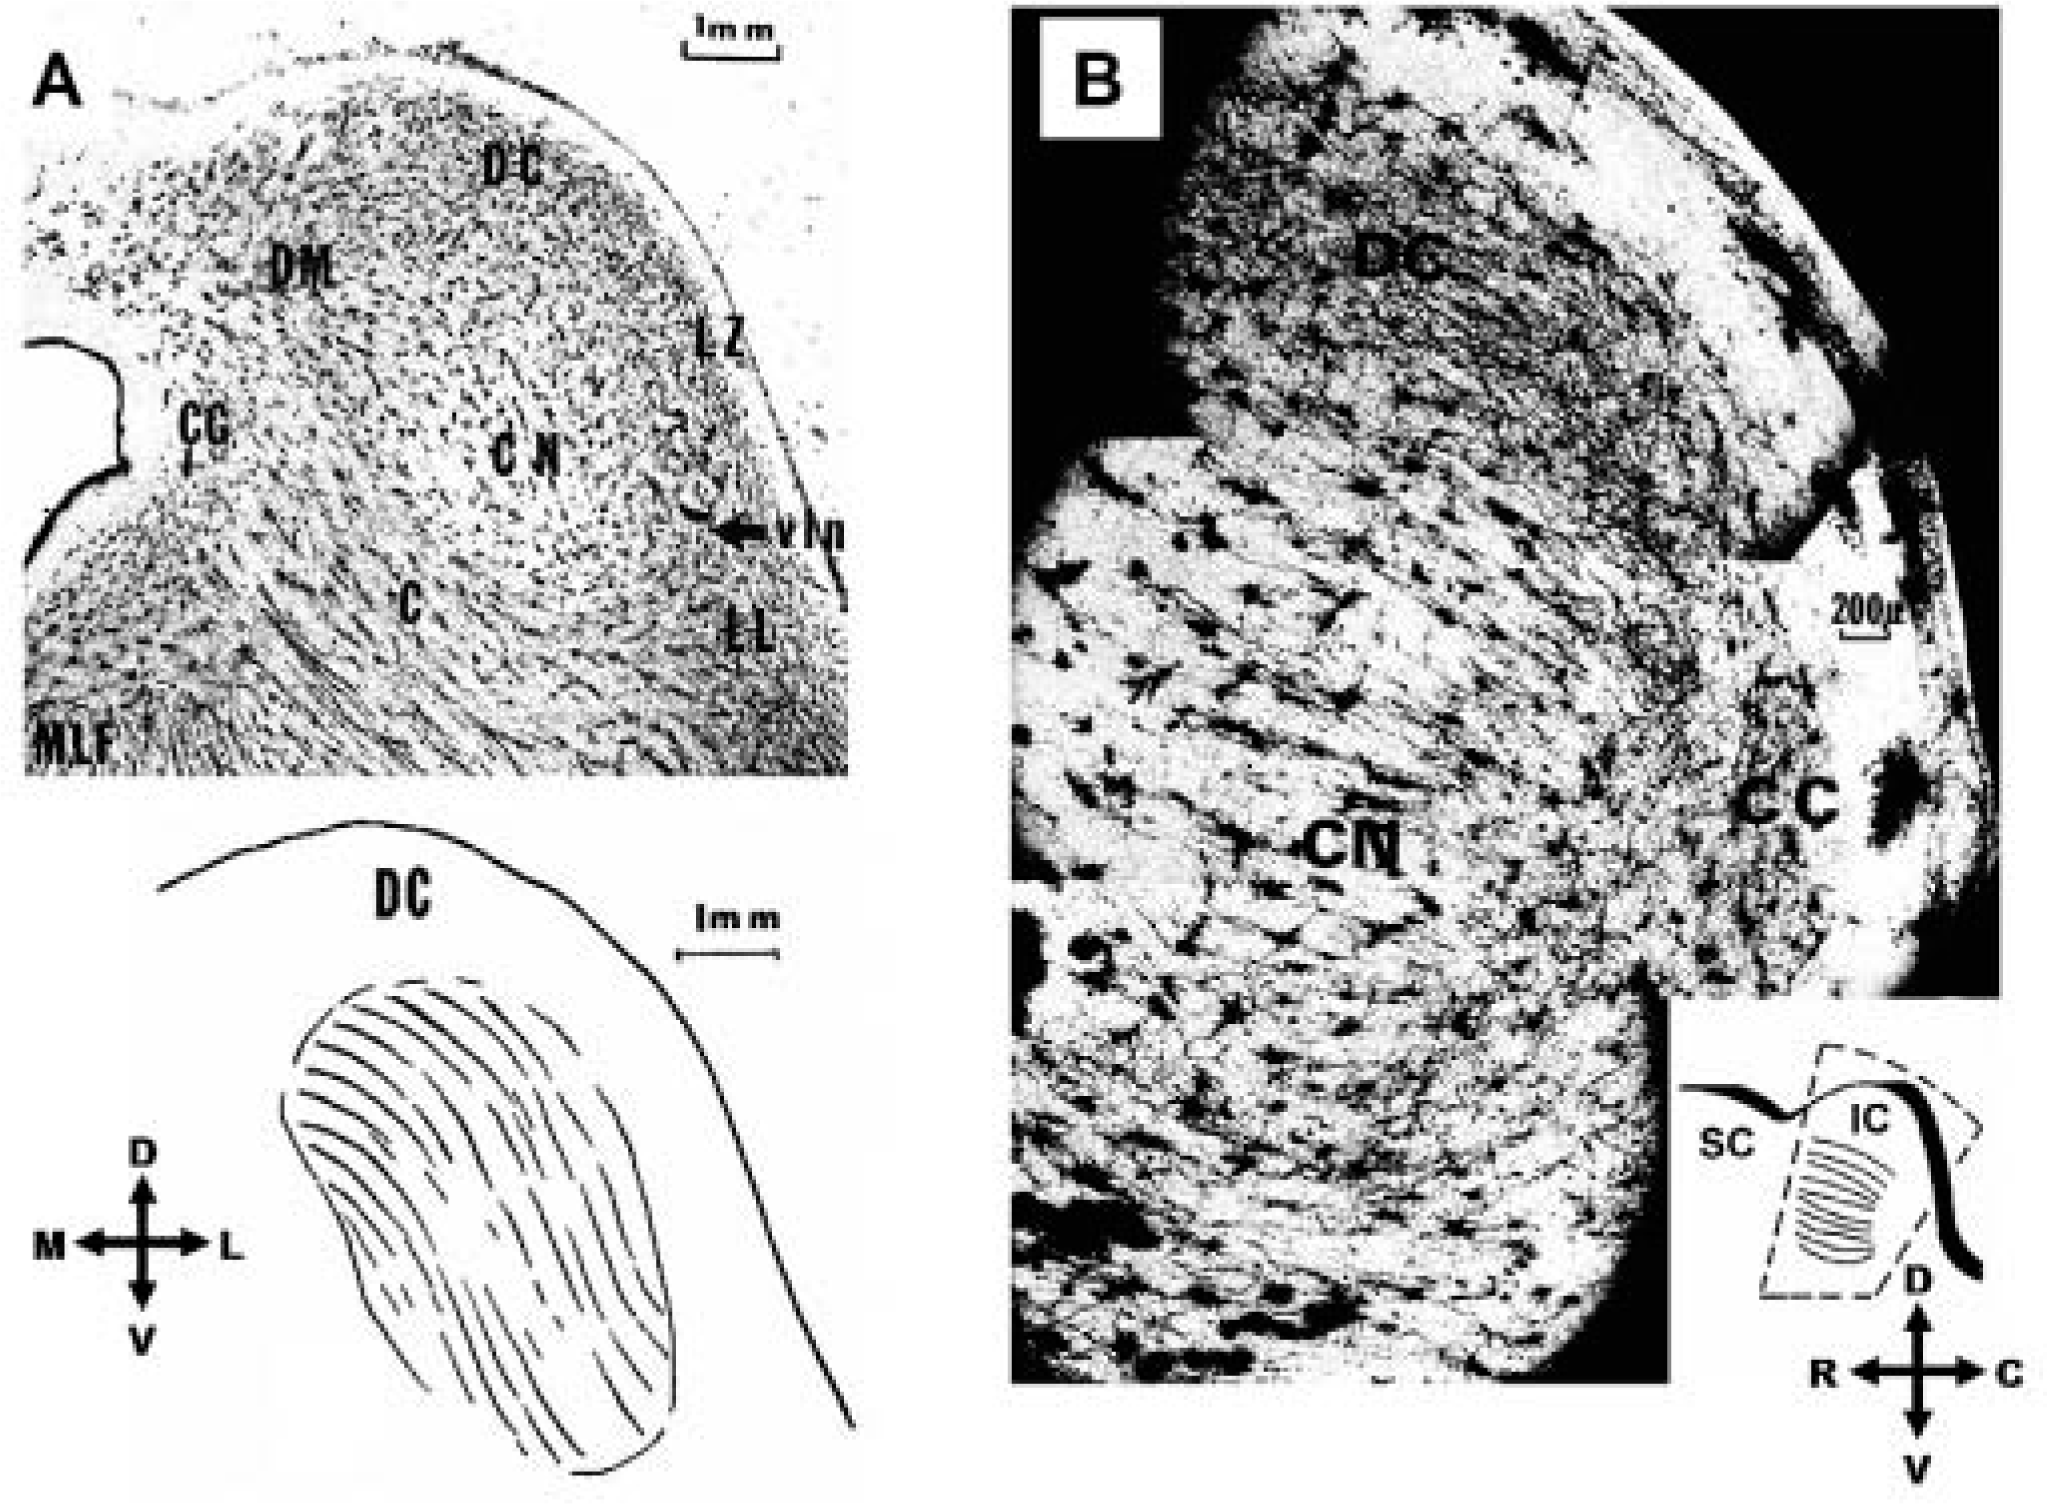
Anatomy of inferior colliculus (IC). Histological sections of the human IC depicting its different subdivisions and layered structure using the Golgi–Cox method. (A) Axial section (top) at the junction of the caudal and middle thirds of the IC of a 55-year-old man, and its simplified schematic (bottom) showing the orientation of the dendritic laminae within the central nucleus. (B) Parasagittal section at the junction of the medial and middle thirds of the IC of a 53-year-old man; inset provides orientation of the dendritic laminae within the central nucleus and indicates the location of the section (dashed lines). (C) Cuneiform area.
Although the auditory cortex is more superficially located and surgically accessible than the IC, it consists of a less defined functional organization (e.g., the tonotopic map is less consistent across animal subjects), in part due to its more plastic nature (Dahmen & King, 2007; Keuroghlian & Knudsen, 2007), and exhibits more complex coding of perceptual sound features. Lower auditory nuclei, such as the superior olivary nuclei and the lateral lemnisci, may exhibit less complex processing compared with the IC because they are lower along the auditory pathway. However, these nuclei code sound in a more diffuse manner (i.e., no one nucleus serves as a converging center of information) and with a less defined and/or skewed tonotopic organization compared with the ICC (Ehret & Romand, 1997; Nayagam, Clarey, & Paolini, 2006). Although the medial geniculate body can be approached using stereotactic methods (Owen et al., 2007; Wichmann & Delong, 2006) and provides access to most auditory projections ascending from lower centers to the auditory cortex, it will likely exhibit more complex processing compared to the IC because it is higher along the auditory pathway (Ehret & Romand, 1997; Wang, Lu, Bendor, & Bartlett, 2008).
Based on the arguments above, the IC appears to be a favorable alternative to the cochlear nucleus for a new auditory prosthesis. There have been two groups who have begun to stimulate the IC for hearing restoration. Surface stimulation (termed inferior colliculus implant) has been achieved using a Med-El ABI array (Colletti et al., 2007) and penetrating stimulation (termed AMI) has been achieved with a new Cochlear DBS array (Lenarz, Lim, Reuter, Patrick, & Lenarz, 2006; Lim, Lenarz, Joseph, Battmer, Samii, et al., 2007). Both have shown to be safe and induce auditory sensations. Interestingly, the first report of electrical stimulation of the surface of the IC was in 1964 during a tumor removal surgery (patient had a recurrent cerebellar ependymoma) in which no auditory sensation could be induced even with stimulus intensities up to 2 V, rates between 1 and 1000 pps, and durations between 0.1 and 1.0 ms (Simmons et al., 1964). It is not clear as to why this previous attempt failed at eliciting any auditory percepts to IC stimulation. Nevertheless, the recent results by (Colletti et al., 2007) demonstrate that surface IC stimulation can elicit auditory sensations. Penetrating stimulation of the auditory midbrain with the AMI (Figures 3 and 5), which is the focus of this review, can also elicit varying auditory sensations.

Auditory midbrain implant (AMI) array. (A) Image of the AMI array next to a standard deep brain stimulation (DBS) array (Medtronic Inc., Minneapolis, MN). The DBS array consists of four platinum–iridium contacts (2 mm center-to-center separation) each with a ring diameter of 1.27 mm, width of 1.5 mm, and surface area of ∼6 mm2. (B) Magnified image of the AMI array, which is 6.2 mm long (from Dacron mesh to tip of silicone carrier without stylet). Each of the 20 platinum ring electrodes (0.2 mm center-to-center separation) has a diameter of 0.4 mm, width of 0.1 mm, and surface area of ∼0.00126 mm2. The AMI array is designed to be positioned along the tonotopic gradient of the central nucleus of the inferior colliculus (IC). The array was developed by Cochlear Ltd.
Array Concept and Design
The IC is a three-dimensional structure that is somewhat spherical and consists of different regions associated with different coding features (Ehret, 1997; Oliver, 2005; Winer, 2005). Figure 4 presents both an axial and a parasagittal section of the IC with the different labeled regions. The ICC is the main ascending auditory region of the midbrain whereas the dorsal cortex receives substantial descending projections from higher auditory and nonauditory centers and is designed for modulating information transmitted along the ascending pathway. The lateral nucleus has been associated with multimodal information processing as well as modulation of ascending and descending projections to and from lower auditory centers. There are other regions within the IC along with differences in regions across species that have been identified. Although it is important to understand the coding features within the different regions of the IC across species and especially within humans for developing stimulation strategies for the AMI, our initial focus is in the coding features of the ICC because it is our implant target for the initial patients. Implanting arrays into other IC regions in addition to the ICC may be required to achieve perception of complex sound stimuli. However, to simplify the design and implementation of the AMI in the first patients, we focused on the ICC because it receives almost all ascending pathways from the brainstem en route to higher perceptual centers (Casseday et al., 2002). Thus the AMI should have access to most ascending information required for speech perception.
One of the advantages of stimulating the ICC is that it has a well-defined tonotopic organization in which its three-dimensional structure is made up of two-dimensional isofrequency layers that are aligned roughly 45° from the parasagittal plane (Figure 4). The ability to systematically activate different frequency regions, thus elicit distinct spectral percepts, has shown to be important for speech perception in CI as well as normal hearing subjects (Friesen et al., 2001; Shannon et al., 2004). Thus, the systematic tonotopic organization of the ICC makes it a promising location for an auditory prosthesis. However, if frequency is coded along one dimension of the three-dimensional structure, then what is coded along the other dimensions? It is not yet clear how sound is coded along the isofrequency layers. Some studies have shown that different features of sound are systematically coded along these ICC laminae. For example, in mice it has been shown that ICC neurons with lower pure tone thresholds, sharper frequency tuning, and greater sensitivity to slower frequency sweep speeds are located more centrally within a lamina and these properties systematically change in more concentrically outward regions (Hage & Ehret, 2003; Stiebler, 1986). In cats, it has been shown that a periodotopic (best modulation frequency) map exists along the dorsomedial-to-ventrolateral dimension of the ICC laminae (Schreiner & Langner, 1988) and shorter pure tone latencies are represented in more ventrolateral regions (Langner, Schreiner, & Merzenich, 1987). These findings suggest that frequency may be coded in one dimension while temporal, level, and even frequency interactions are coded along the other dimensions. From an engineering point of view, such an organization would be advantageous for a three-dimensional array in which appropriate spatial stimulation of the ICC could elicit different spectral, temporal, and level percepts, all features that make up the structure of a sound signal. However, there is some controversy over whether such spatial maps exist across different sound levels (Krishna & Semple, 2000; Seshagiri & Delgutte, 2007) and it is still unknown how theses maps vary across species, especially in humans. Furthermore, the question remains how we could electrically stimulate different sites, which results in synchronized activation of clusters of neurons rather than discrete activation of individual neurons, throughout the ICC to elicit the appropriate temporal and spatial neural interactions that can be decoded by higher-order neurons as meaningful auditory percepts.
Attempting to understand the intricate coding circuitry of the ICC and then being able to interpret the findings to appropriately stimulate this circuitry to restore speech perception may prove to be an ambitious feat. It may be more practical to simply implant a large number of sites throughout the ICC. In this way, a broad range of varying stimuli across the nuclei could be investigated until effective stimulation patterns are identified using more of a heuristic approach. However, this approach has its own limitations. In designing a new auditory prosthesis, especially one that will be implanted within the center of the brain, it is crucial to take every precaution to ensure that the array can be safely and chronically implanted into the brain. Demonstrating the safety of a new electrode array takes carefully planned, long-term animal studies and requires extensive steps for human approval through the appropriate governmental and clinical agencies. For an array with a greater number of sites and larger dimensions, more neural tissue will need to be displaced during implantation and stronger forces will be required to push the array into the tissue, which can result in greater brain damage. Thus, obtaining approval for such a device may be more difficult. From an engineering perspective, designing an array with a greater number of sites becomes more technologically challenging. For example, the current DBS array has four large sites, each connected to the processor via wire leads (Figure 5A). It is not possible to use the same technology to develop a three-dimensional array with a high density of small sites (e.g., 100 closely spaced 2,000 μ2 sites with a site-to-site distance of 100 μ) because of the large volume of space required for the wire leads and the inability to accurately space the sites with such small dimensions. New fabrication technologies used to develop silicon or polyimide electrode arrays can achieve such specifications (Anderson, 2008). However, these types of electrode technologies are not yet approved for chronic human use since it is not clear how safe and functional they are over long periods of time within the brain, though some initial studies have provided encouraging results (McCreery, 2008; McCreery, Lossinsky, & Pikov, 2007). Extensive safety studies still need to be performed to translate these new electrode technologies into a neural prosthesis for humans. Even if the number of sites can be dramatically increased, there are other limitations, such as a limited bandwidth for transferring data from the processor to the implanted stimulator (i.e., the stimulation sequences are transmitted across a wireless interface) and a limited amount of power than can drive the stimulator especially if current steering techniques with multisite stimulation algorithms are used. Implants with a large number of sites may require appropriate switching electronics to stimulate a subset of the total number of sites at any given time. Furthermore, the complexity of the algorithm will increase with site number in a combinatorial sense. Considering that patients would rather wear a small behind-the-ear processor (as shown in Figure 1) than a large body-worn device at the cost of less processing power, it becomes crucial to simplify the algorithms to run on smaller processors with less energy requirements.
Based on these different design considerations and issues, a balance must be reached between complexity and feasibility. On one end, we would like a three-dimensional array that can sufficiently stimulate across the entire IC. On the other end, we would like an array that is safe for human use and will not take extensive animal and in vitro studies to develop and obtain approval for clinical trials. Our research and clinical team considered the different safety and feasibility factors and decided to use an electrode array technology already approved for human use. The human prototype AMI array was derived from a clinically approved CI array developed by Cochlear Ltd (Lane Cove, Australia; Figure 5B; Lenarz, Lim, Reuter, et al., 2006). Although the array does not consist of a large number of closely spaced and small sites as is possible with silicon/polyimide technologies, it is still significantly smaller than what is currently available for clinical DBS (Figure 5A).
The AMI consists of a single-shank multisite array designed according to the dimensions of the human IC with the goal of stimulating the different layers of the ICC (Figure 5B). The advantage of this single-shank array is that it is still capable of stimulating different frequency regions while consisting of a design and material already shown to be safely used for neural stimulation in humans. The AMI electrode array is 6.4 mm long (from Dacron mesh to tip of stylet) with a diameter of 0.4 mm. It consists of 20 platinum ring electrodes linearly spaced at an interval of 200 μm. Each site has a width of 100 μm (surface area of 126,000 μm2) and is connected to a parylene-coated 25-μm thick wire (90% platinum/10% iridium). The body (carrier) of the electrode array is made from silicone rubber (30 durometer hardness) and is concentrically hollow. A stiffening element (stylet) made of stainless steel is positioned through the axial center of this silicone carrier to enable insertion of the electrode array into the IC. After the electrode array is in its final position in the midbrain, the stylet is removed and the softer silicone carrier remains in the tissue (further surgical details presented in the section “Surgical Approach”). The Dacron mesh also anchors the electrode array onto the surface of the neural tissue to minimize movement after implantation. This Dacron mesh also prevents over insertion of the electrode array into the IC during implantation. The other components of the AMI system are similar to the latest Nucleus CI system (Figure 1) consisting of a behind-the-ear microphone and processor that transmits the electromagnetic signals to the receiver-stimulator implanted under the skin. This receiver-stimulator is implanted in a bony bed on the skull near the craniotomy and is connected with a cable to the electrode array.
Feasibility and Safety Studies
Electrophysiological Studies
One major rationale for selecting the ICC as the target site for an auditory prosthesis is its well-defined tonotopic organization. We designed the AMI array based on this organization and the dimensions of the human IC, and hypothesized that AMI stimulation of the ICC would achieve frequency-specific activation. Furthermore, we expected lower thresholds than CI stimulation because of the ability to directly stimulate ICC neurons compared with the distant nature of neural activation (across the bony modiolar wall) for cochlear stimulation. The AMI sites are large due to limitations in electrode technology, as mentioned above. Yet this should also result in lower charge densities for ICC activation, thus providing a safer range of current levels for central nervous system stimulation. To test our hypotheses, we performed experiments in a ketamine-anesthetized guinea pig model in which we electrically stimulated different regions along the tonotopic axis of the ICC and recorded the corresponding neural activity across the tonotopic gradient of the primary auditory cortex (A1; Figure 6). We used single biphasic monopolar pulses (200 μs/phase, cathodic-leading) within the ICC where the return was through a wire positioned in a neck muscle. Each ICC site was stimulated with levels between 1 and 100 μA in logarithmic (dB) steps. The A1 neural activity (evoked potentials and spikes) was filtered and processed for analysis. Details are provided in (Lenarz, Lim, Patrick, Anderson, & Lenarz, 2006).

Auditory midbrain implant (AMI) electrophysiology setup in guinea pig. Drawings of the AMI array and an 8-shank silicon-substrate Michigan probe (Center for Neural Communication Technology, University of Michigan, Ann Arbor, MI) positioned along the tonotopic gradient of the central nucleus of the inferior colliculus (ICC) (A) and primary auditory cortex (A1) (B), respectively. Anatomy in (A) and (B) was derived from images presented in Malmierca, Rees, Le Beau, and Bjaalie (1995) and Wallace, Rutkowski, and Palmer (2000), respectively (not drawn to scale). Electrode sites (∼400 μm2) are represented by black dots along each A1 probe shank (sites separated by 50 μm, shanks separated by 200 μm). The asterisk corresponds to blood vessels.
In summary, the mean threshold for A1 spike activity to ICC stimulation was 27.4 μA (SD = 12.3 μA; n = 75), as shown in Figure 7A. This value corresponds to the thresholds of A1 neurons with a similar best frequency (i.e., most sensitive to a specific pure tone stimulus) to that of the stimulated ICC neurons. Although in most cases stimulation of a specific frequency region within the ICC elicited the lowest spike thresholds in a similar frequency region in A1 (67%, n = 75), thus achieving frequency-specific activation, there were cases in which the lowest threshold was elicited by A1 neurons with different best frequencies (Figure 8A). The mean value when taking the lowest A1 threshold for a stimulated ICC site regardless of best frequency was 20.7 μA (SD = 9.6 μA; n = 75; Figure 7B). For cochlear stimulation, A1 thresholds of about 67.2 μA (median value) have been reported (Bierer & Middlebrooks, 2002), which is 10 dB higher than our median value of 20 μA. Even accounting for differences in the threshold method used, these results suggested that the AMI could provide lower thresholds than CIs, which would potentially reduce overall energy consumption and current activation spread during daily use. Furthermore, current levels for AMI activation appeared to be safe for central nervous system stimulation. Our thresholds ranged from about 6 to 60 μA, which for a 200 μs/phase pulse results in a total charge per phase of 1.2 to 12 nC. For 126,000 μm2 sites, this results in a charge density per phase ranging between about 1 and 10 μC/cm2. Using a charge density per phase of about 10 μC/cm2 (7 hours of continuous stimulation at 50 Hz, anodic-leading biphasic pulses, 400 μs/phase, 0.5 cm2 surface electrodes) in cat parietal cortex, McCreery, Agnew, Yuen, and Bullara (1990) demonstrated that safe neural stimulation up to 5,000 nC/phase was possible (neural damage appears to be related to both charge density and total charge). Using much smaller sites (6,500 μm2) than our AMI sites and a higher charge density of 1600 μC/cm2, they still could safely stimulate up to 100 nC/phase. Both cases result in much higher charge and charge density values than our stimulation values. Even considering the differences in pulse duration (200 vs. 400 μs/phase) and brain region (guinea pig midbrain versus cat cortical tissue), especially because we stimulated with much fewer pulses (<7 hours at 2 Hz), it was expected that our stimulation levels would not cause noticeable tissue damage. We could not determine the maximum current level needed for AMI stimulation with our experimental setup due to the limit of the stimulator. However, even if levels reach up to 500 μA, the total charge per phase and charge density per phase will still only be about 100 nC and 80 μC/cm2, respectively, which are still well within the safe limits described above and presented in McCreery et al. (1990), Shannon (1992), and Merrill, Bikson, and Jefferys (2005). At higher levels, frequency∗∗∗ specific activation was also still possible. For example, when stimulating at 5 dB above threshold, 77% (n = 69) of the stimulated ICC sites elicited the largest evoked potential within an A1 region of similar best frequency (Figure 8B).
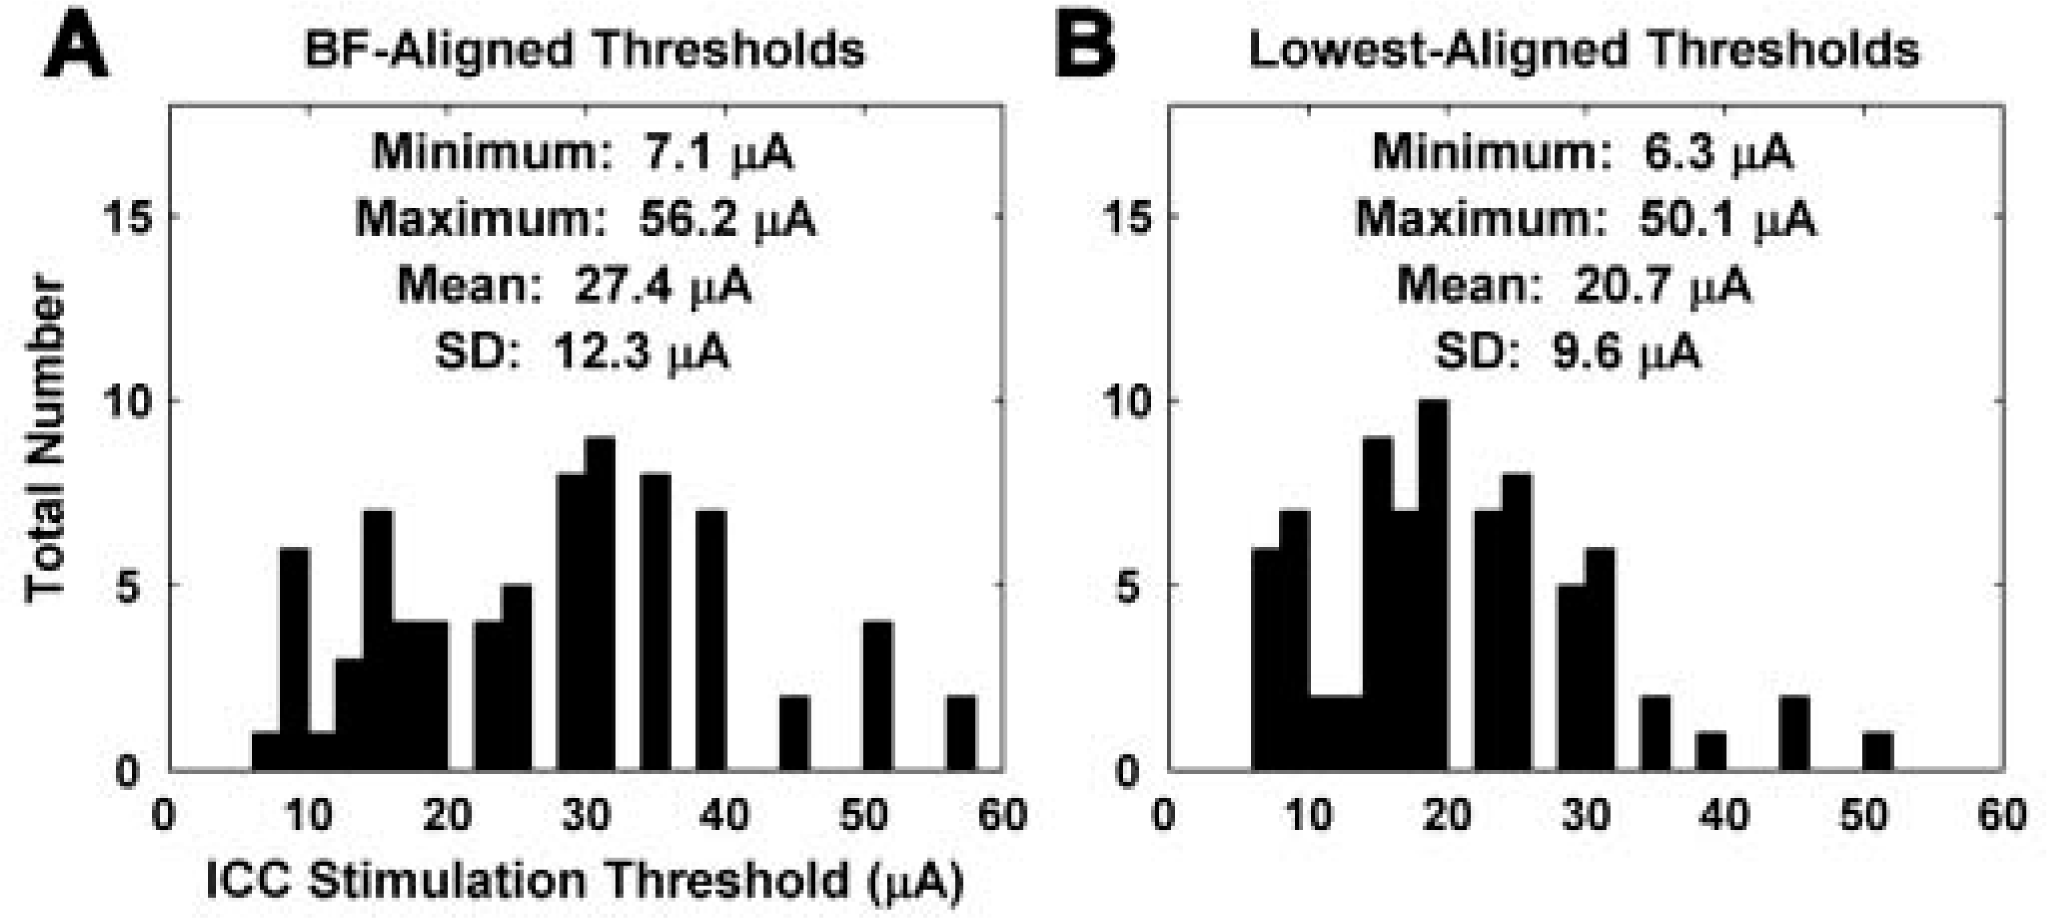
Stimulation thresholds. (A) Electrical thresholds for neural activation recorded on sites within the primary auditory cortex (A1) with the closest best frequency (BF) to the stimulated auditory midbrain implant (AMI) sites (n = 75). (B) Electrical thresholds for neural activation on A1 sites (selected from all 16 sites for a given A1 probe placement) with the lowest threshold for the stimulated AMI sites (n = 75).

Best frequency (BF) mapping plots. These plots demonstrate that stimulation of the central nucleus of the inferior colliculus (ICC) with our auditory midbrain implant (AMI) array achieves frequency-specific activation within the primary auditory cortex (A1). (A) The BF of the A1 site with the lowest threshold for a stimulated AMI site is plotted against the BF of that AMI site. Diagonal line depicts perfect mapping, which is not always possible due to the set geometry of the electrode sites thus inherent BF misalignment. Symbols: ·, closest BF site; Δ, 1 to 2 sites away from closest BF site;∗, >2 sites away. Distribution of symbols: ·, n = 23; Δ, n = 27;∗, n = 25. (B) The BF of the A1 site with the largest evoked potential peak for a stimulated AMI site (at 5 dB above threshold) is plotted against the BF of that AMI site. Symbols: · closest BF site; A, 1 to 2 sites away from closest BF site;∗, >2 sites away. Distribution of symbols: ·, n = 37; Δ, n = 16;∗, n = 16.
Chronic Animal Studies
The acute guinea pig experiments provided the initial evidence demonstrating that stimulation of the ICC with our AMI array could achieve low threshold, frequency-specific, and potentially safe activation of the central auditory system. The latter was inferred from empirical safety data collected from stimulation of the cat cortex using slightly different parameters than in our study. Furthermore, stimuli were only presented for a few hours whereas future AMI patients would be stimulated on a daily basis with much faster rates. To obtain a more realistic sense of the safety of the array both to chronic implantation and stimulation for longer periods, we performed a histomorphological study in cats. Details are provided in (Lenarz et al., 2007). The cat was selected as the animal model because its IC is similar in cytoarchitecture and size to the human IC. Eight cats were chronically implanted for 3 months, in which four of them were additionally stimulated for 60 days (4 hours/day) starting 4 weeks after implantation to assess if clinically relevant stimuli further affected the tissue response. The stimuli consisted of cathodic-leading, charge-balanced pulses in common ground mode (100 μs/phase, 250 pps, 45 μs interphase gap) using the SPEAK strategy (Cochlear Ltd.) and driven by continuous sound from a radio. Across animals and throughout the 3-month implant period, the threshold (T) and comfortable (C) levels used to program the processor ranged from 84 to 209 μA and from 93 to 256 μA, respectively. An important component of this study was that we used a similar surgical approach to expose the IC surface and implant the AMI array as would be used in the human patients.
In our experiments, we analyzed the histomorphological effects 3 months after initial array implantation, which generally corresponds to the long-term sustained tissue response. In Giemsa-stained sections, the electrode tracks in both nonstimulated and stimulated cats were surrounded by a thin fibrillary sheath. There was no significant difference in the thickness of the reactive fibrillary sheath between the nonstimulated and stimulated cats suggesting that the encapsulation process is more affected by the implantation of a foreign object rather than chronic stimulation. The average thickness of the fibrillary sheath across all nonstimulated and stimulated data was 58.1 μm (SD = 62.7). Around the fibrillary sheath, reactive gliosis was detected in both nonstimulated and stimulated cats (Figures 9C and 9D). The stimulated cats exhibited significant elevation of glial cells out to about 250 μm from the electrode track, whereas the nonstimulated cats had elevated glial cells out to about 350 μm. Intact and healthy neurons could be observed around the electrode track in both stimulated and nonstimulated ICs (Figures 9A and 9B). However, there were fewer neurons in the immediate vicinity of the electrode tracks in both animal groups. The neuron density increased to normal at about 50 μm from the track in the stimulated cats and at about 100 μm from the track in nonstimulated cats. In comparing the plots in Figure 9, it is apparent that the extent of neuronal survival is inversely related to the level of glial reaction such that a greater number of glial cells corresponds to a fewer number of neurons at each distance from the electrode track. Furthermore, it appears that chronic stimulation improved the tissue reaction (i.e., less glial cells relative to control) and led to better survival of the neurons around the electrode array. Further studies need to be performed to confirm this finding because it is based on only a few animals.

Histological summary for the auditory midbrain implant array. (A, B) Neuron density versus distance from electrode track for the nonstimulated and stimulated cats. (C, D) Glial cell density versus distance from electrode track for the nonstimulated and stimulated cats. Plots include mean across all animals (4 nonstimulated, 4 stimulated), standard deviation bars, and asterisks above the implanted/stimulated mean values that were significantly different from the control values. For further details on the analysis methods, see Lenarz et al. (2007).
Overall, these histomorphological findings demonstrated that minimal neuronal damage occurs around the electrode array due to chronic implantation and stimulation of our AMI array. These results are similar to those that have been observed with other deep brain neural implants currently used in human patients (Haberler et al., 2000; McCreery, Shannon, Otto, & Waring, 2005) and were encouraging as to the potential safety of our array for clinical use. Furthermore, all eight animals were healthy throughout the 3-month implant period, and we did not observe any complications associated with the surgical approach. In electrically stimulating the IC in cats, as well as in humans, it is possible to stimulate neighboring structures that may elicit nonauditory and even adverse effects (Geniec & Morest, 1971; Kretschmann & Weinrich, 1992; Moore, 1987; Trepel, 2004). Activation of the spinothalamic tract (caudal and ventral to the IC) and the trigeminal tract (medial and ventral) can elicit pain, temperature, and pressure sensations in the body and face, respectively. The trochlear nerve (caudal) and the superior colliculus (rostral) are associated with ocular movements. Stimulation of regions more medial and ventral to the IC, such as the periaqueductal gray and cuneiform area, can elicit pain sensations and changes in arterial blood pressure and heart rate. In all four of our stimulated animals, we did not observe any abnormal eye movements, irregular heart rates, or behavioral responses indicative of painful sensations. It is possible that the animals may have experienced some of the minor sensory effects described above, for which we were unable to measure. However, if they did occur, the level of discomfort experienced by the animals was not visually noticeable.
Surgical Approach
Considering that NF2 patients are the largest initial group of candidates for an AMI, we needed to develop a combined surgical approach that enables removal of acoustic neuromas and AMI implantation at the same surgical setting. The typical midline and paramedian supracerebellar–infratentorial approaches both provide good exposure of the IC but do not provide an appropriate lateral exposure to the cerebellopontine angle and internal auditory canal, which is necessary for tumor removal. However, a lateral suboccipital craniotomy provides access to the internal auditory canal and cerebellopontine angle as well as the IC via a lateral supracerebellar–infratentorial approach. Figure 10A shows the location of the skin incision and craniotomy required for this approach. Once the neurosurgeon cuts through the dura and folds it over the edges to expose the brain (to later allow the dura to be closed via sutures), the cerebellum and tentorium become visible (Figure 10B). The cerebellum must be retracted medially (to the right) to expose the auditory nerve behind the cerebellum. This is where the acoustic neuroma is located. Once the neurosurgeon removes the tumor, the cerebellum can be retracted downward to expose the surface of the IC. Because of the semisitting position and gravity, the cerebellum actually drops downward without any forced retraction as shown in Figure 10C. Both Figures 10C and 10D show the surface of the IC after the neurosurgeon has carefully cut through the surrounding arachnoid and pushed aside several blood vessels covering the midbrain surface. Once the surface of the IC is exposed, the AMI can be inserted into the IC (Figure 10D). There are several advantages to this approach. First of all, the insertion pathway shown in Figure 10D enables the placement of the array along the tonotopic gradient of the ICC. Second, minimal manipulation of the cerebellum and surrounding midbrain regions is required to expose the IC surface and implant the array. Furthermore, with regard to vestibular schwannoma surgery, this approach enables removal of even large tumors with the possibility of hearing preservation in patients who undergo surgery in the last hearing ear. In these cases, the function of the auditory nerve must be monitored during and after tumor removal, in which implantation would only be performed in the case of complete hearing loss.

Surgical approach to the inferior colliculus (IC). (A) Schematic drawing of the fixed head in a semisitting position and showing the skin incision (red dotted line), appropriate location for the receiver-stimulator of the auditory midbrain implant (AMI) in the temporoparietal area (red star), and the location of the modified lateral suboccipital craniotomy (yellow circle) exposing the inferior margin of the transverse sinus and the medial margin of the sigmoid sinus (blue shaded regions). The antenna placed at the top of the head is for the three-dimensional intraoperative navigation system. (B) After the skull is removed and the dura flaps pulled to the side, the tentorium (T) and cerebellum (C) are visible. The cerebellum is retracted medially (right) to expose the auditory nerve and tumor. Because of gravity, the cerebellum drops downward to expose the IC. (C) View of the left IC, trochlear nerve (TN), and the caudal branch of the superior cerebellar artery (SCA) through the lateral supracerebellar infratentorial approach after the neurosurgeon has removed the overlying arachnoid and pushed aside several blood vessels. (D) The cable extends from the AMI array that has been implanted into the IC.
We tested the surgical approach described above in several fresh human cadavers in a semisitting position. Details of these experiments are presented in Samii et al. (2007). Briefly, we observed that approaching the tentorial hiatus and dorsolateral aspect of the mesencephalon through the lateral supracerebellar–infratentorial route does not endanger the major midline venous structures in the quadrigeminal cistern. It also provides direct access to the IC with an appropriate angle for AMI insertion along the hypothesized tonotopic gradient of the ICC. Potential risks of this combined approach are partly related to tumor removal through the typical lateral suboccipital approach in the semisitting position and partly because of the supracerebellar–infratentorial approach to the IC (Ammirati, Bernardo, Musumeci, & Bricolo, 2002; Hitotsumatsu, Matsushima, & Inoue, 2003; Ulm et al., 2004; Vougioukas, Omran, Glasker, & Van Velthoven, 2005). In experienced hands, tumor removal through this approach is associated with no mortality and a low rate of minor complications (Samii, Gerganov, & Samii, 2006). Using intraoperative Doppler sonography allows early detection and thereby exclusion of additional morbidity due to air embolism. Risks regarding exposure of the IC and AMI implantation include cerebellar bleeding or infarction, which may result from either extensive retraction of the cerebellum or from interruption or coagulation of the cerebellar bridging veins. In performing the operation in the semi-sitting position, there is no need for extensive cerebellar retraction, and approaching the tentorial notch laterally helps in preserving the cerebellar bridging veins, which are mostly located medial to the trajectory of our approach. The major midline venous structures are not exposed and are therefore not in danger. The only cranial nerve surrounding the IC is the trochlear nerve, which emerges at the side of the frenulum veli below the IC and encircles the cerebral peduncle. Exposing this nerve immediately after opening the arachnoid adhesions reduces the risk for accidental damage to the nerve (Figures 10C and 10D). Also, swelling of the superior colliculus either because of manipulation in the quadrigeminal cistern or inevitable coagulation of the quadrigeminal veins may lead to a transient Parinaud syndrome consisting of a combination of impaired extraocular movements (impaired up-gaze or convergence), nystagmus, and impaired papillary reactions. These deficits are almost always transient and rarely cause permanent neurological sequelae (Stein, 1979).
Results in First Three Patients
The human and animal findings provided the necessary evidence to obtain approval for and pursue clinical trials. Five patients have been implanted with the AMI of which results from three patients have been previously published (Lim, Lenarz, Joseph, Battmer, Patrick, et al., 2008; Lim, Lenarz, Joseph, Battmer, Samii, et al., 2007) and will be reviewed in this section. The clinical trial is conducted in accordance with ISO 14155 (International Standard for Clinical Investigation of Medical Devices) and follows the Good Clinical Practice guidelines. Medical Ethics Committee and Competent Authority written approvals according to national laws were obtained and the patients signed informed consent forms prior to AMI implantation and testing.
Array Placements
Consistent with our chronic cat studies and the surgical reports discussed above, none of the patients developed any complications either because of tumor removal or because of AMI implantation. There were no transient or permanent sensory or motor deficits due to implantation trauma in the midbrain. Also none of the patients experienced transient or permanent pain sensations postoperatively because of potential lesions in the midbrain. The only complication associated with the surgery was in identifying the appropriate location to insert the AMI array along the IC surface. The goal is to implant the array along the tonotopic gradient of the ICC. To aid in placement, we used three-dimensional intraoperative navigation (Vector Vision Navigation System, Brainlab, Heimstetten, Germany) with computed tomography (CT) and magnetic resonance imaging (MRI) images based on the bone-anchored registration method, which proved to be quite effective in identifying the IC borders during our cadaver studies. However, during live surgery, we noticed that brain shifts as much as several millimeters could occur once the dura was opened, which was minimal in the cadaver preparations. Because the ICC is not a surface structure, it was difficult to accurately insert the array into the ICC without any reliable three-dimensional mapping of the IC borders.
Figure 11 provides a summary of the different locations of the array across the three patients. In the first patient (AMI-1), we implanted the array too rostral and medial resulting in its placement into the dorsal cortex of the IC. In response to the first placement, in the second patient (AMI-2) we attempted to insert the array more caudally and laterally resulting in its placement along the surface of the lateral lemniscus. From our learning experiences with the first two patients, we became more familiar with the IC surface landmarks (i.e., IC–SC border, midline, exit point of the trochlear nerve) and the extent of brain shift during surgery. Thus, in AMI-3, we were able to improve our surgical techniques and position the array into the ICC. However, even with this experience, we continued to have difficulties in accurately placing the array in our fourth and fifth patients.
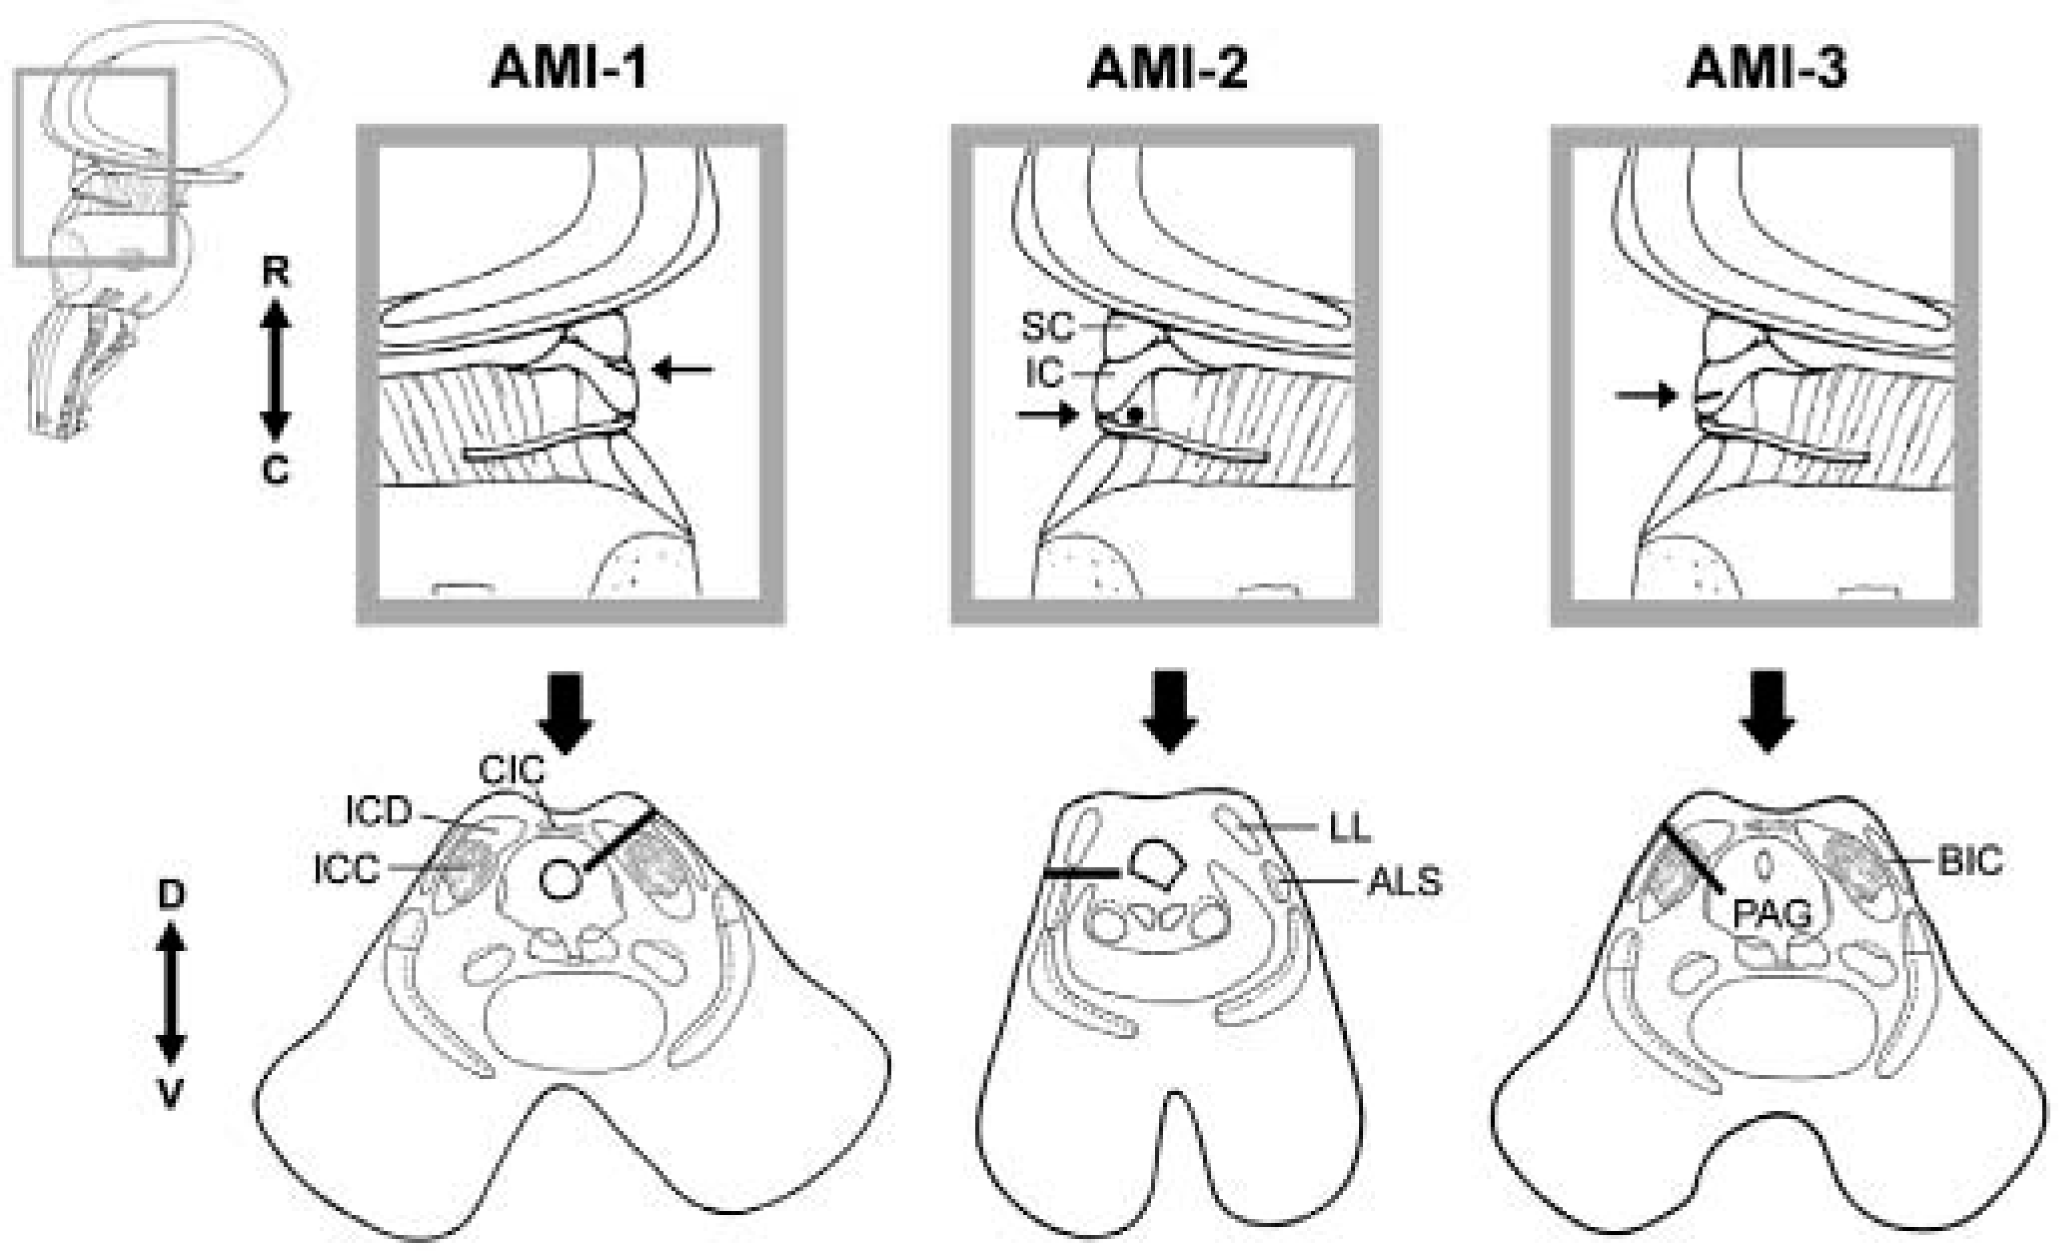
Array placement across patients. Parasagittal (top) and axial (bottom) sections showing the location and orientation of the array within the midbrain of each patient. Arrow in parasagittal section points to the caudorostral location of the array and the corresponding axial section below. The black line (or dot for AMI-2) representing the array in each section corresponds to the trajectory of the array across several superimposed computed tomography–magnetic resonance imaging (CT-MRI) slices.
Figure 12 provides an image taken during the surgery in our fourth patient. The exposure was on the left side allowing direct view of the surface of the left IC. Bordering the IC more rostrally is the superior colliculus in which a slight dip in the midbrain surface is visible in between the two structures. We can visualize roughly where the midline exists as well as the caudal edge of the IC. However, because of the curvature of the brain and the angle of the head relative to our surgical view, these landmarks can be quite deceiving. In this patient, we slightly enlarged the craniotomy to further expose the medial and caudal extent of the IC. However, we still were not certain how medial was the midline or how caudal was the caudal edge of the IC. Furthermore, it was not clear the location of the lateral edge of the IC to ensure insertion of the array into the ICC. Considering that the ICC is roughly 3 mm in diameter (Geniec & Morest, 1971), an error of just a few millimeters in identifying these landmarks as well as due to brain shifts can result in placements completely outside of the ICC. This is what we experienced in several of our patients. As will be presented in the next sections, implant location has a significant effect on overall hearing performance. In particular, the best performance was achieved by the patient implanted within the ICC. Thus, we need to improve our ability to appropriately place the array into the ICC. Possible solutions to this issue are presented in the section “Placement of the Array.”

Surgical exposure of the left human midbrain for array implantation. The midline, superior colliculus (SC), trochlear nerve (TN), and inferior colliculus (IC) are visible. However, the caudal edge of the IC and true midline are not clearly visible with the angled view of the midbrain. The asterisk corresponds to the hypothesized location of the start of the brachium of the IC based on surface IC stimulation results presented in Figure 15 and described in the section “Placement of the Array.”
Patient Fitting and Psychophysical Findings
A summary of the demographic and implant-related information for each patient is presented in Table 1. All three patients were diagnosed with the NF2 disease and required acoustic neuroma removal on one side where they were already deaf. AMI-1 had residual tonal hearing in the right ear (30–50 dB hearing loss [HL] for 0.125–1 kHz; >70 dB HL for >1 kHz). However, she scored poorly on our standard speech test used to assess implant eligibility (<10% at 110 dB HL for Freiburger monosyllable word test; CI criteria: <30% at 65 dB HL) indicating her inability to benefit from hearing aids. AMI-2 had residual tonal hearing in the left ear (>90 dB HL) and could obtain some improvements in lip-reading capabilities using a hearing aid. However, he was experiencing rapid deterioration in his hearing, which justified AMI implantation. AMI-3 was completely deaf for 6 years and had previously been implanted two times with the ABI on the left side. In both cases, the ABI became postoperatively displaced into the fourth ventricle due to the enlarged facial recess created by the large tumor that was removed. AMI-3 was then implanted with the AMI during removal of a residual acoustic neuroma on the right side.
Patients' Summary
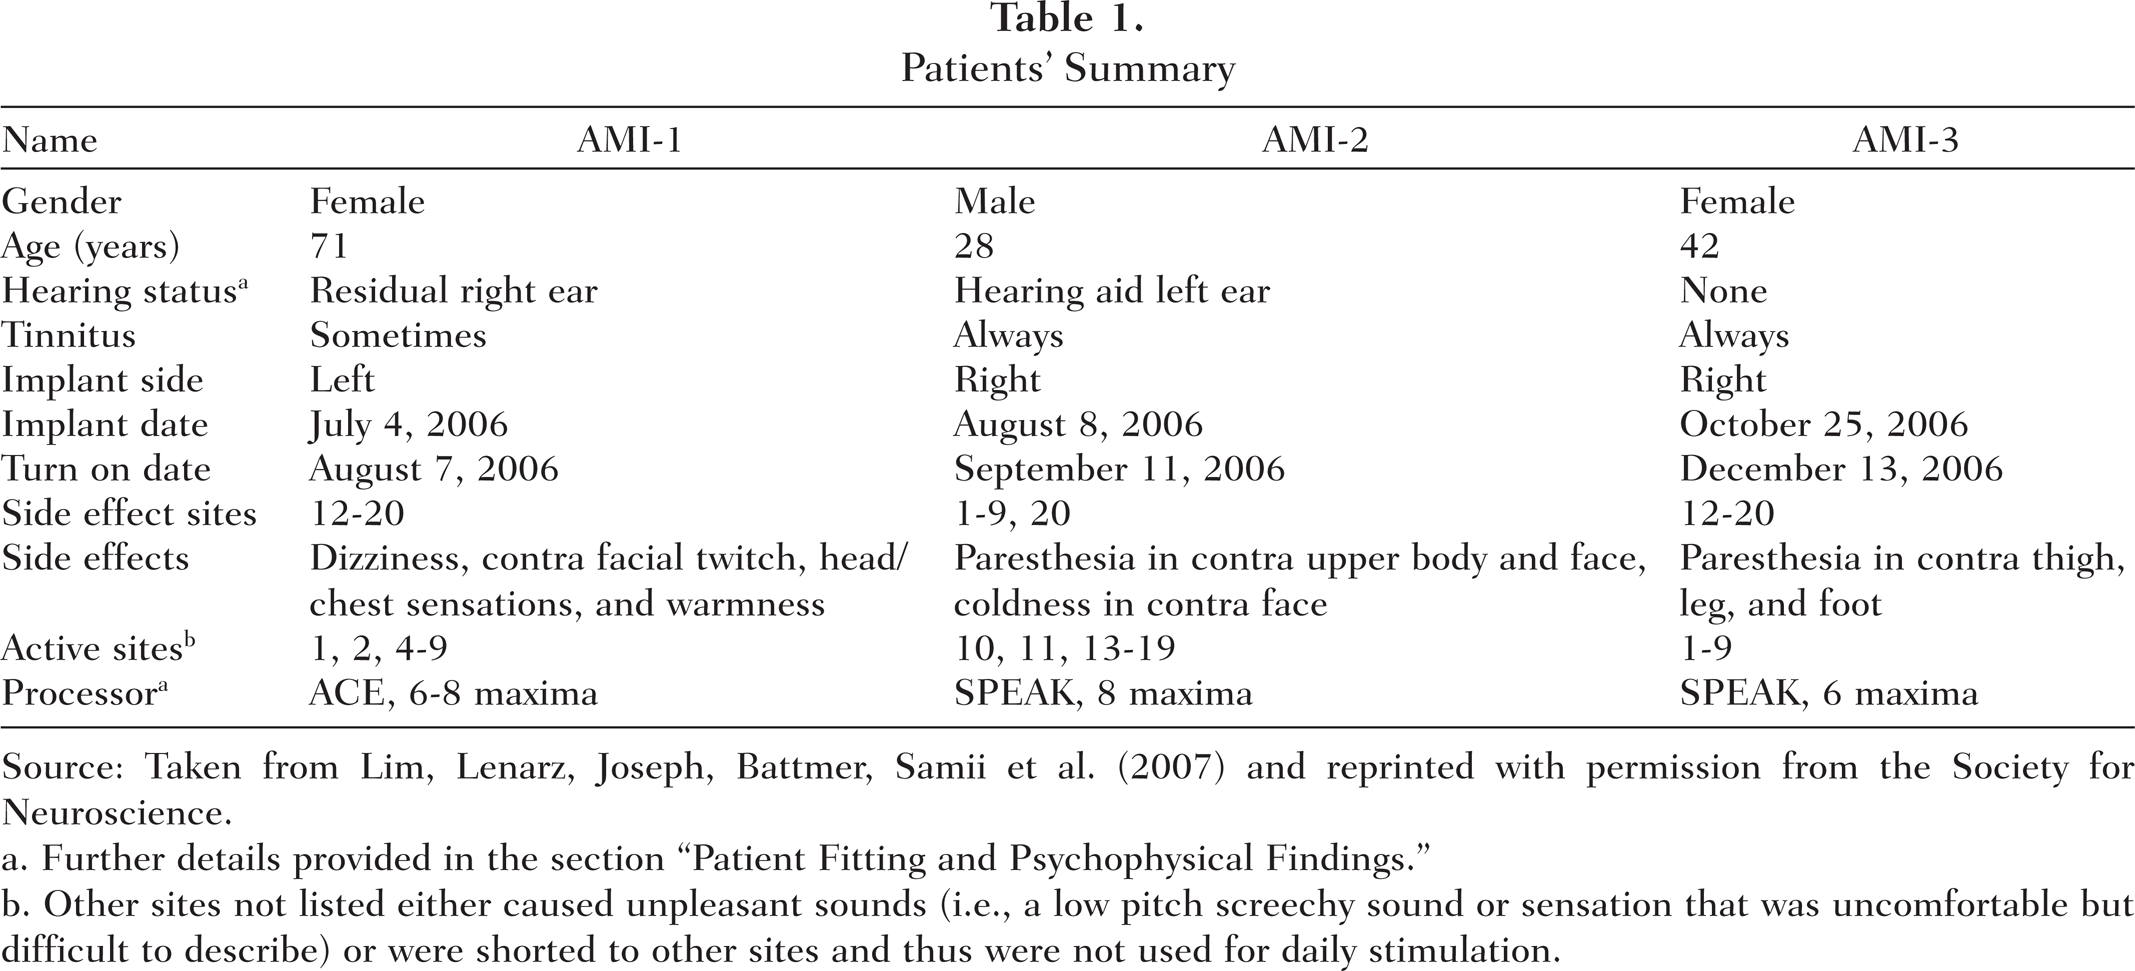
Source: Taken from Lim, Lenarz, Joseph, Battmer, Samii et al. (2007) and reprinted with permission from the Society for Neuroscience.
Further details provided in the section “Patient Fitting and Psychophysical Findings.”
Other sites not listed either caused unpleasant sounds (i.e., a low pitch screechy sound or sensation that was uncomfortable but difficult to describe) or were shorted to other sites and thus were not used for daily stimulation.
The patients returned 5 to 7 weeks after AMI implantation for their first fitting session. Because our AMI patients are the first cases of penetrating stimulation within the midbrain for hearing restoration, we were faced with the difficult task of figuring out how to stimulate these patients to restore useful hearing. For the first few testing sessions, it was crucial to have a physician present in case of any adverse reactions to electrical stimulation because it was not yet known how stimulation within the midbrain would induce different sensory and motor effects. More important, we had to be cautious of pain sensations, heart rate changes, and blood pressure effects associated with various midbrain regions. Fortunately, we did not observe any adverse or painful side effects to electrical stimulation. Nonauditory sensations consisted of paresthesia, mild temperature changes in different parts of the face and body, some dizziness, and mild facial twitches (see Table 1). However, all these side effects were avoided by turning off the corresponding sites for daily stimulation. As for auditory sensations, the patients described the percepts as tonal in nature but that some sites elicited a broad spectral percept with multiple pitches. The patients also described the sounds as having an electronic quality mixed in with the tonal percept. Furthermore, pitch and temporal percepts could be altered by changing the stimulation pulse rate and pattern as well as location of activation. These qualitative results were encouraging for AMI implementation since they suggest that at the level of the midbrain, sound still appears to be somewhat coded into elementary perceptual features of sound (i.e., tonal sounds that can be systematically elicited with varying temporal percepts). This is in contrast to stimulation of the auditory cortex in which more complex sound sensations (e.g., “swooshing of jumping rope,” “whining,” “jet engine,” “crickets”) and even a lack of perceptual changes to varying stimulus parameters (e.g. different pulse rates) have been reported (Dobelle et al., 1973; Howard et al., 2000; Penfield & Perot, 1963).
In addition to assessing the functional effects of midbrain stimulation, we also frequently measured the impedances of the sites to assess the functionality of the implanted array over time. Cochlear Ltd. has developed a testing and fitting software, Custom Sound, that enables impedance measurements and implementation of different stimulation strategies. The level unit used in this software is known as Current Level (CL), which for the AMI system (i.e., all their Nucleus Freedom systems) corresponds to CL = 127.5 × log(L/17.5), where L is level in microamperes. For measuring impedances, monopolar or common ground configurations can be used with the latter allowing identification of shorts (i.e., impedance equal to zero). Impedances are calculated by presenting a single biphasic pulse (80 CL, 25 μs/phase, 7 μs interphase gap) and dividing the measured voltage by the pulse current level. The calculation is based on the average of 8 pulses presented at 5,000 pps. Generally, the site impedances range from 3 to 20 kohm across our patients. For most sites, the impedances remained relatively stable over time. However, we did observe some electrode shorts that appeared over time (Figure 13, asterisks). AMI-1 had several shorts, AMI-2 had no shorts, and AMI-3 had one short. It is still not clear as to what may be causing these shorts. Prior to implantation, we performed extensive in vitro tests to ensure that excessive manipulation and bending of the array did not induce any shorts. We also chronically implanted the array into cats for 3 months and did not observe any obvious issues with shorts. We are currently investigating this issue to improve the design of the array before implanting future patients. In our patients, we turned off all but one of the sites of the shorted set to prevent current from flowing through more than one location during daily stimulation.

Activation levels for auditory midbrain implant stimulation. Threshold (T) and comfortable (C) levels measured in each patient using 500 ms on–off pulse trains with 250 pps, 100 μs/phase monopolar pulses. (A) T-C levels (endpoints of bar) for AMI-1 measured for four different time points (symbols) from when the implant was initially turned on. Because of rising levels over time, the implant was turned off for 48 days (after the +127 day measurement) and then T-C levels were measured again. At +4 days, only the modified T-C levels used for the daily processor rather than the actual measured values were available. Thus they are labeled with an open symbol and lighter shaded bars. (B, C) T-C levels for AMI-2 and AMI-3 measured at two different time points and demonstrating stability over time. (D) Summary of values for each patient only for the values from the first testing session shown in A, B, and C. Asterisks correspond to sites shorted to other inactive sites, except for Site 3 (shorted to active Site 9) for AMI-1, that were turned off.
The main challenge we initially faced in fitting the patients was in reducing the large parameter space for stimulation to just the essential elements required for speech perception. For the same reasons we developed an AMI array based on previously approved CI technology (i.e., concerning safety and practicality), we eventually decided to implement the first AMI patients with a CI stimulation strategy. This is not to claim that auditory coding is the same at the level of the midbrain as in the cochlea. However, there is evidence from animal studies suggesting that some general coding features of complex sound (e.g., to varying pitch or animal vocalizations) are maintained, to some extent, from the cochlea up to the auditory cortex (Cariani & Delgutte, 1996; Suta, Kvasnak, Popelar, & Syka, 2003; Syka, Suta, & Popelar, 2005; Wang, Merzenich, Beitel, & Schreiner, 1995). In particular, many neurons still respond in synchrony to the envelope of the sound signal and with a spatial representation for frequency information at the level of the midbrain as occur within the cochlea (Joris, Schreiner, & Rees, 2004; Krishna & Semple, 2000). Although many neurons located higher along the auditory pathway also tend to exhibit more complex and variable response patterns, especially at and above the primary auditory cortex (Wang et al., 2008), we do not yet have any clear indications as to how to more optimally stimulate the midbrain, particularly the ICC. Furthermore, since some ABI patients (particularly those without tumors) can converse over the telephone with CI strategies at the level of the brainstem (Colletti & Shannon, 2005), it is not too implausible to assume that CI-derived strategies may work, to some degree, at the level of the midbrain.
There are various types of stimulation strategies used in CI patients and developed by the different implant companies. However, the general architecture is similar across strategies. Basically, the sound signal is bandpass filtered into N signals corresponding to different frequency bands within the human hearing range. The envelopes of these signals are then used to amplitude modulate a pulse train (usually a set pulse rate) that is delivered to M (N > M) sites corresponding to the largest energy components. The two types of strategies arbitrarily employed in our AMI patients are the SPEAK and ACE strategies. Except for minor differences, such as a different interphase gap and pulse rate limit, these strategies are quite similar. For further details, see Patrick, Busby, and Gibson (2006). The main point is that to implement these strategies, the threshold (T) and comfortable levels (C) must be set for each site, the sites must be ordered to correspond to different frequency ranges of sound information (i.e., pitch ordering), a pulse rate and pulse width of stimulation needs to be selected, and various minor parameters need to be adjusted. Thus, our goal of the first testing sessions was to determine these different parameters.
Figure 13 presents the T and C levels measured for different sites in each patient over the first 3 to 4 months as the patients continued to use their implant on a daily basis. The T and C levels for AMI-1 continued to rise reaching the compliance voltage of our stimulator (at +125 days). Because of this rise in levels, we turned off the processor for 48 days to assess if levels would return to usable levels. The activation levels decreased dramatically but not completely to the initial values. It is not clear as to what may be causing these adaptive effects. One hypothesis is that the stimulation rates and patterns are overdriving the neurons located within the dorsal IC region, which receives a large number of projections from higher auditory and nonauditory centers (Winer, 2005) and may be designed for adapting to and modulating various stimuli (Perez-Gonzalez, Malmierca, & Covey, 2005). We are currently investigating various stimulation strategies for effective and stable activation in AMI-1. The other two patients exhibited stable activation levels over time (Figures 3B and 3C), suggesting that location of stimulation, thus the type of neurons activated, is important for AMI implementation. The auditory sensations and/or side effects associated with each site have generally remained stable indicating minimal movement of the implant over time. What was also encouraging was that monotonic loudness growth functions were observed in all three patients in whom higher current levels induced louder percepts (Lim, Lenarz, Joseph, Battmer, Samii, et al., 2007). There were some concerns that loudness percepts would not change systematically with current level considering animal studies that have revealed a complex pattern of excitatory and inhibitory projections from different brainstem nuclei into the ICC (Cant & Benson, 2006; Loftus, Bishop, Saint Marie, & Oliver, 2004; Oliver, 2005) as well as the existence of both monotonic and nonmonotonic rate-level functions throughout the ICC (Le Beau, Malmierca, & Rees, 2001; Ramachandran, Davis, & May, 1999; Syka, Popelar, Kvasnak, & Astl, 2000). This monotonic loudness behavior is particularly important for implementing the CI strategy since it requires that loudness is coded by current level in which pulse trains presented on a given site are amplitude-modulated by the envelope of the filtered sound signal.
In addition to T and C levels, we also needed to set the pulse phase duration and pulse rate of stimulation. Based on various psychophysical tests presented in more detail in (Lim, Lenarz, Joseph, Battmer, Patrick, et al., 2008), we selected a pulse rate of 250 pps, pulse width of 100 μs/phase, and monopolar configuration. Briefly, 250 pps was high enough to avoid noticeable rate pitch effects (i.e., lower rates elicit confounding low pitch percepts) and the lowest rate available for daily stimulation to minimize adaptive effects (i.e., high rate stimulation can cause the loudness to decrease over time). These parameters also achieved the largest drop in thresholds in which using longer pulse widths and higher pulse rates (thus greater total charge) did not decrease the thresholds by much more, whereas using shorter pulse widths and slower pulse rates substantially increased threshold levels. This was important for identifying stimuli that requires less total charge (thus more energy efficient activation) yet was still reasonably within the compliance voltage limits of the stimulator (1,750 μA) and the safety limit for brain stimulation defined by previous safety studies (McCreery et al., 1990; Merrill et al., 2005; Shannon, 1992). In terms of pitch ordering the sites, we performed various tests (i.e., pitch scaling and pitch ranking) in the three patients. These results are presented in (Lim, Lenarz, Joseph, Battmer, Samii, et al., 2007). Although each patient can detect differences in pitch percepts depending on the stimulated site, we only observed a systematic pitch organization in AMI-3. This is consistent with findings from animal studies in that the array in AMI-1 and AMI-2 is not aligned along any known tonotopicorganization whereas the array in AMI-3 is aligned along the tonotopic gradient of the ICC (i.e., lower pitch percepts more superficial and higher pitch percepts in deeper regions). It must be emphasized that we did not observe this systematic pitch organization for the first 6 months of stimulation, as was initially reported in (Lim, Lenarz, Joseph, Battmer, Samii, et al., 2007). In fact, stimulation of all sites elicited predominantly low pitch sounds. However, during the 6-month follow-up session, AMI-3 expressed that annoyingly high pitch percepts could be perceived during daily stimulation. After performing extensive pitch tests, we identified a systematic pitch organization for the first time within the human ICC and consistent with animal findings (Lim, Lenarz, Joseph, Battmer, Samii, et al., 2008). It appears that dramatic plastic effects to midbrain stimulation is possible and may be reversing deficits induced by long periods of deafness (AMI-3 was deaf for 6 years and had only low-frequency residual hearing prior to complete deafness). Details of these pitch and plasticity results observed in AMI-3 will be presented in a separate publication.
One interesting functional finding we observed across our patients was the effects of stimulation of different midbrain regions on the perceived direction of the induced sound sensation. These findings are also presented in (Lim, Lenarz, Joseph, Battmer, Samii, et al., 2007). The array in AMI-1 is located within the dorsal cortex of the IC. Stimulation of all her sites elicited sound sensations that appeared to originate from both ears, which is consistent with animal findings showing that the dorsal cortex of the IC consists of fibers projecting bilaterally from both ICs (Malmierca, Hernandez, & Rees, 2005; Malmierca, Rees, Le Beau, & Bjaalie, 1995; Saldana & Merchan, 2005). AMI-1 expressed that the sounds could be heard in both ears with different loudness percepts depending on the stimulated site and level. However, she had difficulties in describing any systematic directional shifts in sound for the different stimuli. In contrast, the other two patients heard sounds originating from only one side for stimulation of all their active sites: the ipsilateral side for AMI-2 and the contralateral side for AMI-3. The interesting aspect of these results is that stimulation of all active sites (spanning 1.7–1.9 mm distance) in AMI-2 and AMI-3 elicited sounds originating from only the ipsilateral and contralateral direction, respectively. This would suggest the existence of somewhat segregated sound localization pathways projecting through the lateral lemniscus and the ICC. In animals it has been shown that different brainstem nuclei associated with monaural or binaural features project in a somewhat segregated pattern to different regions of the ICC (Cant & Benson, 2006; Loftus et al., 2004; Roth, Aitkin, Andersen, & Merzenich, 1978) and even up to A1 (Andersen, Roth, Aitkin, & Merzenich, 1980; Middlebrooks & Zook, 1983; Rutkowski, Wallace, Shackleton, & Palmer, 2000). However, these projection patterns are quite complex with many overlapping regions. Thus how the 2 patients perceive percepts predominantly from only one side for stimulation across a large midbrain region, and even that AMI-2 hears all sounds ipsilaterally though we know excitatory projections to the midbrain predominantly arise from the contralateral ear, remains an interesting question.
At least from a psychophysical point of view, the overall initial results have been encouraging. We know from studies in CI and normal hearing subjects that the ability to obtain temporal, level, and spectral cues are important for understanding speech (Friesen et al., 2001; Loizou, Dorman, & Fitzke, 2000; Rance, Cone-Wesson, Wunderlich, & Dowell, 2002; Shannon et al., 2004; Shannon, Zeng, Kamath, Wygonski, & Ekelid, 1995; Zeng & Galvin, 1999). All three patients obtain systematic loudness percepts with current level and a range of pitch percepts across their different sites that were pitch ordered for their daily stimulation strategy. We did not present any of our temporal coding results since they are not yet published. However, based on preliminary results (unpublished observation, Robert V. Shannon), AMI patients obtain gap detection and modulation detection thresholds within the range of CI and ABI patients.
Speech Results
Overall, it is apparent that location of stimulation can greatly affect hearing performance. AMI-1, who is implanted in the dorsal cortex of the IC, obtains the least benefit from the AMI. This is mainly due to the adaptive effects experienced during daily stimulation in which the loudness decreases and thresholds increase over time. During the speech tests, in which silent (recovery) periods are followed by speech presentation as well as during daily situations when intermittent sound is presented and perceived at a loud enough level, the patient is able to extract some temporal and pitch information from the sound signal. Generally, improvements in hearing have been limited to lip-reading enhancement and environmental awareness. AMI-2, who is implanted on the surface of the lateral lemniscus, obtains slightly greater improvements in vowel, number, and consonant recognition than AMI-1. Although both patients use their implants on a daily basis and express the importance of the implant for enhancing lip-reading and environmental cues, the overall speech perception performance has been below our initial expectations, particularly due to the inappropriate placement of the arrays. Stimulation of the array in AMI-2 is placed along the surface of the lateral lemniscus and elicits frequent side effects at higher levels across many of the sites. However, these side effects arising from stimulating the sites individually are not noticeable when stimulating across different sites during daily stimulation.
A more encouraging outcome has been observed in AMI-3, whose array was implanted within the intended target, the ICC. As shown in Figure 14, AMI-3 obtained about 50% correct for vowels, 20% for consonants, and 40% for numbers with the AMI alone indicating that she obtains a significant amount of sound information with her implant after 1 year of daily stimulation. She also obtained benefits in her speech tracking scores. Generally, ABI NF2 patients in our clinic do not obtain any speech tracking with the implant alone. The average lip-reading enhancement (difference between lip-reading plus ABI and lip-reading alone) for the ABI in NF2 patients (those with a Cochlear Nucleus 22 or 24 device; n = 14) is about 12 words per minute (unpublished observation). AMI-3 achieved a lip-reading enhancement of 26 words per minute, which suggests that if the AMI can be implanted into the correct target of the ICC, then it has potential to provide improvements in hearing performance over the average ABI patient. This is encouraging for the AMI because its goal is to provide a hearing alternative to the ABI in NF2 patients. However, we still need to provide further improvements in overall hearing. Some ABI patients, as discussed in the Introduction, can achieve high levels of speech perception even without lip-reading cues. Furthermore, normal hearing subjects obtain a speech tracking score of about 85 to 100 words per minute (Strauss-Schier, Battmer, Rost, Allum-Mecklenburg, & Lenarz, 1995), which is much greater than the 33 words per minute (with lip-reading) obtained by AMI-3.

Speech scores for AMI-3 at 1 year. Vowel test (chance level of 10%) consisted of five long (e.g., BAAT, GAAT) and five short (e.g., BAT, GAT) words randomly read to the patient (four times) and the patient had to repeat the word. Consonant test (chance level of 7.7%) consisted of 13 meaningless consonant words (e.g., ABA, AGA) repeated four times. Freiburger number test (open set, chance level <1%) consisted of 20 German numbers between 13 and 99 (2 to 5 syllables). Speech tracking (modified open set, chance level of 0%) involved reading a story to the patient who was asked to repeat the words of the cited sentences. The number of correct words in 5 minutes was obtained and divided by 5 to obtain the correct number of words per minute. V (visual), lip reading alone; A (audio), implant alone; AV (audiovisual), both lip reading and implant. Lip reading enhancement is the difference between AV and V. All scores are the average across two testing sessions. Further details on the methods are presented in Lim et al. (2007).

Surface midbrain stimulation method. Electrically evoked middle latency responses were recorded to surface midbrain stimulation during implant surgery under sufentanil anesthesia. A bipolar electrode is positioned in three different locations (top images) and stimulated to induce evoked potentials (bottom plots) recorded with surface needles (signal, high forehead; reference, nape of neck; ground, low forehead). The stimulus consisted of a short burst of 5 pulses (100 μs/phase, 7 μs interphase gap) at 1,200 pps, which was repeated at 7.4 Hz. The current level was 220 CU (a level unit used by the Freedom implant system from Cochlear Ltd.), which corresponds to 930 μA. The curves are averages of 500 stimulus repetitions. The abscissa of the curves corresponds to time in milliseconds and the ordinate corresponds to amplitude in microvolts. A millimeter scale was placed on the surface of the midbrain and is visible to the right of the electrode. The evoked response increases in magnitude as the electrode stimulates a more rostral and lateral surface location. If the start of the brachium of the inferior colliculus corresponds to where the response begins to increase in magnitude, then it should be located somewhere between the “middle” and “more caudal-medial” positions, which is how we estimated its location in Figure 12.
Current Issues and Potential Solutions
The initial results in our first three patients have been encouraging in terms of the safety of AMI implantation and stimulation as well as the ability to elicit auditory sensations with varying level, pitch, and temporal cues. However, there are several issues we have encountered across our patients. The most critical issue is if we can accurately place the array into the ICC considering that speech understanding was strongly dependent on which midbrain region we stimulated. Even if we are able to implant the array into the ICC, another issue is if we will be able to achieve open set speech perception without lip-reading cues comparable with the top CI patients. AMI-3 was implanted into the ICC and obtains a wide range of ordered pitch percepts, monotonic loudness growth functions with current level, and some temporal cues comparable with CI patients. However, these available cues do not sufficiently fuse together with CI-based strategies to achieve high levels of speech perception. This may be an issue of placement within the ICC and/or an indication that we need more appropriate stimuli that could require a greater number of sites throughout the three-dimensional ICC instead of just a single linear array. In the following sections, we will discuss these issues along with potential solutions and research directions for improving AMI placement and implementation.
Placement of the Array
The surgical approach was developed in fresh cadaver preparations, in which we were able to place the array into the center of the IC based on visual landmarks and three-dimensional intraoperative brain navigation (based on CT–MRI images). However, during AMI implantation of our first patients, brain shifts of several millimeters prevented the accurate use of brain navigation. Although the typical visual landmarks were visible (i.e., border of superior colliculus and IC, midline, caudal edge of IC, and trochlear nerve), they did not provide a consistent and clear orientation of where to implant the array along the IC surface to ensure placement of the sites into the ICC. As shown in Figure 12, it is difficult to tell how medial is the midline (i.e., cannot actually see the true midline from that view) and how caudal is the caudal edge of the IC due to the curvature of the brain and the oblique angle of the surgical view relative to the midline. One solution is to enlarge the craniotomy to expose the opposite IC as well as the exit point of the trochlear nerve (located at the caudal edge of the IC). This should allow us to determine the true midline plane and the most caudal portion of the IC, respectively. In the initial patients, we used a more conservative approach to restrict the size of the craniotomy to what was necessary to remove the acoustic neuroma and then expose the surface of the IC. In future patients, it will be a significant advantage for AMI placement by increasing the size of the surgical exposure. However, we must assess if an increased exposure will add any significant risks to the patients, particularly in exposing and manipulating major midline venous structures to identify the midline. A midline approach to the IC has been safely performed and reported previously (Colletti et al., 2007; Samii, Carvalho, Tatagiba, Matthies, & Vorkapic, 1996; Stein, 1971, 1979; Ulm et al., 2004).
The benefit in identifying the caudal edge of the IC is that we can normalize the distance between that edge and the border between the superior colliculus and IC to identify the center of the IC. This will at least ensure we can place the array into the ICC with respect to the caudal-to-rostral direction. However, we still need another landmark along the medial-to-lateral direction. By using a larger surgical exposure, we could identify the true midline but are still without a landmark for the lateral edge of the IC. Based on preliminary experiments in guinea pigs in which we electrically stimulated different locations along the surface of the IC with a bipolar electrode and recorded electrically evoked middle latency responses (needle electrodes at the vertex referenced to the back of the head with a ground wire near the nose), we observed different activation responses that depended on stimulation location. Based on the limited number of animals and the ability to elicit a wide range of curve shapes to different stimulation locations, we are not yet able to provide a summary of how the specific features of the curves change with stimulation location. However, one general trend we observed was that stimulation of most surface regions required high current levels for activation (unpublished observation). This is consistent with the high current levels (i.e., ∼20–80 nC vs. stimulation within the ICC of 6–25 nC for AMI-3 shown in Figure 13) required to reach threshold and comfortable levels in the one patient who was stimulated on the surface of the IC (Colletti et al., 2007) and the ability to shut off ICC neurons, thus the ascending sound pathway, through electrical stimulation of the outer IC regions (Jen, Sun, & Chen, 2001; Jen, Zhou, Zhang, Chen, & Sun, 2002) because of complex inhibitory interactions (Kelly & Caspary, 2005; Merchan, Aguilar, Lopez-Poveda, & Malmierca, 2005). This may also explain why a previous attempt at stimulating the surface of the IC resulted in no auditory sensations (Simmons et al., 1964). However, as we stimulated more rostrally and laterally toward the brachium of the IC, we began to observe larger responses (unpublished observation), which likely results from effectively stimulating the bundle of outgoing fibers from the IC to the thalamus. These preliminary results raised the question if it might be possible to stimulate the surface of the IC and measure the size of the neural response to identify the start of the brachium of the IC. This would provide a lateral landmark in which we could normalize the distance between that point and the midline to identify the center of the IC along the medial-to-lateral direction. If we are able to identify specific response patterns to different stimulation locations along the IC surface, then this would also provide an electrophysiological correlate of where to insert the array to reach different regions of the ICC.
Based on these preliminary data, we investigated the surface stimulation method in one of our patients during AMI implantation. Figure 15 presents images of three different stimulation locations of a bipolar electrode that was placed along the IC surface. The image corresponds to the same exposure shown in Figure 12. The presented results are consistent with our preliminary animal findings in which stimulation of the IC surface requires high current levels to elicit a middle latency response. In this patient, we had to increase the current to 220 CU, which corresponds to 930 μA (5 biphasic pulses presented at 1,200 pps, 100 μs/phase, 7 μs interphase gap), to observe a response at all three locations. As we stimulated more rostrally and laterally, we elicited larger responses with the same stimulus. The magnitude of the response increased dramatically over a 6-mm distance, which is based on the millimeter scale that is visible on the IC surface to the right of the electrode. These results were encouraging as to the potential for using surface IC stimulation to identify the brachium of the IC. We only have data from one patient and limited data from animal experiments. Thus, we cannot yet make any definitive claims as to the consistency and effectiveness of this method across subjects. However, we will continue to investigate this method in animals to determine how accurately we can identify where to insert the array along the IC surface to reach different regions of the ICC. As will be discussed in the next section, where we stimulate within the ICC appears to have significant effects on activation properties. We will also continue to collect these data during future AMI implantation in future patients to assess consistency across patients. The hope is that with a larger surgical exposure, we can accurately identify the midline and caudal edge of the IC; and through surface IC stimulation, we can identify the start of the brachium of the IC and surface locations corresponding to appropriate trajectories into specific ICC regions. These additional landmarks should improve the accuracy and consistency of AMI placement within the ICC and hopefully hearing performance in future patients.
ICC Location Effects
As discussed in the previous section, it is crucial that we improve our surgical techniques for ensuring placement of the AMI array into the ICC. However, we may need to also ensure proper placement into specific regions of the ICC. AMI-3 is implanted into the ICC and obtains a wide range of ordered pitch percepts, monotonically increasing loudness with current level, and various temporal cues. However, as shown in Figure 14, she is still not able to obtain open set speech understanding without lip-reading cues as occurs for many CI patients. One recent hypothesis is that she is implanted into an ICC region with unfavorable coding properties for speech perception, at least when artificially activated with electrical stimulation. In a previous study in guinea pigs, different regions throughout the ICC were electrically stimulated and the corresponding neural responses were recorded in A1. Figure 16A shows how a bi-shank multisite array was inserted into the ICC with each shank aligned along its tonotopic axis and each site was positioned into a different frequency region. Based on acoustic-driven responses, the site along each shank located in a specific frequency region was identified and matched to a site in A1 within a similar frequency region (Figure 16B). Multiple placements were made throughout the ICC to stimulate different locations along one specific isofrequency lamina, thus neurons with a similar best frequency, while the corresponding neural activity was recorded in the main input layer of A1. Further details on the methods and results are presented in Lim and Anderson (2006, 2007).

Inferior colliculus stimulation setup in guinea pig. Drawings of the multisite probes positioned along the tonotopic axis of the inferior colliculus central nucleus (ICC) (A) and a best frequency column of the primary auditory cortex (A1) (B). Anatomy in A and B were derived from images presented in Malmierca, Rees, Le Beau, and Bjaalie (1995) and Wallace, Rutkowski, and Palmer (2000), respectively (simplified and not drawn to scale). Asterisk corresponds to blood vessels.
In general, we observed that stimulation along the isofrequency dimension of the ICC elicited different activation properties in A1. Figure 17A shows how stimulation of a rostral–ventral ICC region elicits spike activity in A1 with thresholds below 10 μA. However, when stimulating a more caudal–dorsal region, spike thresholds could exceed 60 μA, which is a difference greater than 17 dB. Figure 17B more clearly displays the threshold drop in a two-dimensional plot in which the thresholds are plotted as a function of the steepest gradient axis from Figure 17A (thick black line) in which 0 corresponds to the circle. There is also greater variability in threshold values in the more caudal–dorsal region whereas in the rostral–ventral region the thresholds tend to be homogeneously low (<10 μA). These findings suggest, at least in terms of functional activation of A1 in response to ICC stimulation, that the rostral–ventral region represents a spatially distinct output region from the caudal–dorsal region.

Stimulation location effects on thresholds. (A) Contour plot of activation thresholds recorded in the primary auditory cortex (A1) as a function of stimulation location along the laminae within the central nucleus of the inferior colliculus (ICC). Dots correspond to each location (n = 44). For thresholds greater than our maximum level of 56.2 μA, we set them equal to 60 μA for better visualization of the gradient. (B) Thresholds as a function of stimulation location along the steepest gradient axis from (A) (black line), which is aligned 11° off the caudorostral direction. 0 (along abscissa) corresponds to location of open circle in (A).
The organization observed in Figure 17A was also present for level discrimination steps (based on a signal detection theory method using spike rate), evoked potential magnitudes, first spike latencies, and spiking precision (i.e., SD of first spike latencies). Figure 18 provides a simplified summary of these results. There was some variation in the borders across features, especially for latency and spiking precision. However, the general organization across features was consistent with the depiction in Figure 18, which was obtained by normalizing and summing all the contour plots for the different features. These results are presented in more detail in (Lim & Anderson, 2007). In summary, stimulation of more rostral and ventral regions along an ICC lamina elicited lower thresholds, smaller discriminable level steps (in microamperes), and larger evoked potentials in A1. Stimulation of those regions usually elicited cortical activity with shorter latencies and greater spiking precision. We have also observed that stimulation of caudal regions of the ICC exhibits degraded frequency-specific activation in A1 in which a sustained response slightly above spontaneous activity tends to be elicited across all sites along the tonotopic gradient of A1 (Lim, Lenarz, Joseph, Battmer, Anderson, et al., 2007).

Summary of stimulation location effects. Schematic describing the effects of stimulation location within an isofrequency lamina of the central nucleus of the inferior colliculus on different coding parameters calculated from the elicited activity in the main input layer of the primary auditory cortex (A1). Arrows indicate how different parameter values (labeled with text) change for stimulation along an ICC lamina that were estimated from our data presented in (Lim & Anderson, 2007). The different shaded regions (light vs. dark gray) represent, in a simplified manner, two functionally distinct regions that appear to exist within an ICC lamina for output projections ascending to A1. Results correspond to laminae with best frequencies between 9 and 23 kHz.
The findings in Figure 18 suggest that at least two spatially distinct functional output regions exist along the isofrequency laminae of the ICC with different coding properties: a rostral–ventral region and a caudal–dorsal region. From our results, we cannot rule out that the different coding properties observed in A1 for these two regions are an artificial effect of electrical stimulation of the ICC. All we can claim is that there are differences in anatomical and/or biophysical properties between these two regions that would cause differences in electrical activation properties. However, these functional regions are consistent with recent anatomical findings in gerbils in which Cant and Benson (2006) showed that neurons from the cochlear nuclei and nuclei of the lateral lemniscus project throughout the ICC. However, inputs from the LSO and MSO project predominantly to more rostral and lateral (i.e., ventral along an ICC lamina) locations. This suggests that two distinct regions (possibly with subregions) exist within the ICC of gerbils: a caudal–medial region and a more rostral–lateral region (see Figure 19 for overall summary). They further showed that these different regions project to distinct locations along the caudorostral (isofrequency) dimension of the ventral division of the medial geniculate body (MGBv): the caudal–medial ICC region projects predominantly to the caudal third of the MGBv whereas the rostral–lateral ICC region projects predominantly to the rostral two-thirds of the MGBv (Cant & Benson, 2007). A caudorostral organization within the MGBv has also been shown in cats, in which A1 (and the anterior auditory field) receives most of its projections from the rostral MGBv but few from the caudal MGBv (it projects more to the posterior auditory field) (Rodrigues-Dagaeff et al., 1989). It was further shown that the caudal MGBv generally exhibits longer and more widely distributed latencies, a less defined tonotopic organization, less excitatory responses, degraded synchronization properties, and systematic differences in other sound features compared with the rostral MGBv. Considering that we observed longer latencies with greater spiking jitter, degraded frequency-specific activation, and less overall excitatory and spatially synchronized activity (i.e., higher thresholds and smaller evoked potentials) in A1 in response to stimulation of the caudal–dorsal ICC region compared with the rostral–ventral region, it is possible that this caudal–dorsal region in guinea pigs also projects predominantly to the caudal MGBv as observed in gerbils and has few projections to A1 as observed in cats. This is interesting in that, traditionally, the ICC has been viewed as a single nucleus with properties associated with the lemniscal pathway (i.e., good tonotopy and projections to the ventral division of the medial geniculate body and A1). However, these recent anatomical and electrophysiological findings suggest that we may need to refine our traditional views on how sound information is being coded in these higher auditory centers. More importantly and at least for electrical stimulation of the auditory midbrain, we may obtain degraded activation properties when stimulating the caudal-dorsal region along the isofrequency dimension of the ICC in humans.

Simplified schematic of segregated functional pathways. There appears to exist some segregation of functional pathways corresponding to different coding properties from the brainstem up through the inferior colliculus central nucleus (ICC), ventral division of the medial geniculate body (MGBv), and several subregions of the auditory cortex as described in previous animal studies (Cant & Benson, 2006, 2007; Lim & Anderson, 2007; Rodrigues-Dagaeff et al., 1989). There exists at least two segregated functional pathways originating from the ICC and maintained up to the auditory cortex in which one pathway (dark gray) corresponds to properties that may be more favorable for an auditory midbrain implant. Note that there are some overlapping projections across regions that are not displayed.
Based on CI and normal hearing studies, the ability to achieve stronger and more spatially synchronized activation, enhanced temporal precision, better level coding, and more localized frequency-specific activation are all important for speech perception (Friesen et al., 2001; Nelson, Schmitz, Donaldson, Viemeister, & Javel, 1996; Pfingst, Burnett, & Sutton, 1983; Rance et al., 2002; Shannon et al., 1995, Shannon et al., 2004). AMI-3 obtains a wide range of pitch, temporal, and loudness cues to ICC stimulation. However, AMI-3 is implanted into the caudal–dorsal region of the ICC, which may not enable sufficient activation or appropriate fusion of the elicited cues to restore open set speech perception. Even the thresholds were significantly higher than expected. The thresholds ranged from 6 to 12 nC (Figure 13D), which is not lower than what has been typically observed for CI patients (5–20 nC) using similar stimuli (Pfingst, Zwolan, & Holloway, 1997; Shannon, 1985). If we are stimulating in direct contact with neurons using the AMI array, which is not the case for CI stimulation (i.e., CI stimulates distant neurons through a bony modiolar wall), we should observe significantly lower thresholds as was predicted by our previous animal studies (Lenarz, Lim, Patrick, et al., 2006; Lim & Anderson, 2006). Instead, we observed high thresholds, which is consistent with our location hypothesis and suggests inappropriate activation of the caudal–dorsal region of the ICC with electrical stimulation. Therefore, if we can place the AMI array into a more rostral–ventral ICC region, and assuming these location effects observed in animals occur in humans, then patients may obtain higher levels of speech perception.
Temporal Coding
One ongoing hypothesis is the location effect discussed in the previous section. Another hypothesis focuses on the way temporal features of sound (i.e., amplitude fluctuations over time) are coded at the midbrain level. AMI-3 is implanted into the ICC and obtains a wide range of pitch percepts that systematically vary from low to high when stimulating shallow to deeper sites within the ICC, respectively. The organization of these pitch percepts is consistent with what is expected from animal models of the tonotopic gradient within the ICC (Geniec & Morest, 1971; Oliver, 2005). Considering that psychophysical studies have shown that vowel recognition is highly correlated with the ability to detect sufficient spectral (i.e., place pitch) cues (Blamey & Clark, 1990; Dorman, Dankowski, McCandless, Parkin, & Smith, 1991; Hillenbrand, Getty, Clark, & Wheeler, 1995; Throckmorton & Collins, 1999), it is expected that AMI-3 would perform well on the vowel test. AMI-3 achieved a score of about 50% (chance level = 10%) with the AMI alone (Figure 14) indicating that she is obtaining sufficient cues to differentiate among many of the vowels (10 total vowels presented). However, her consonant scores (∼20%) are only moderately above chance level (7.7%). The fact that sufficient transmission of temporal cues is a dominant factor in consonant as well as speech recognition (Shannon et al., 1995; Smith, Delgutte, & Oxenham, 2002; Teoh, Neuburger, & Svirsky, 2003; Throckmorton & Collins, 1999; Van Tasell, Greenfield, Logemann, & Nelson, 1992; Van Tasell, Soli, Kirby, & Widin, 1987), it raises the possibility that AMI-3 may be obtaining sufficient pitch information but insufficient temporal cues for open set speech perception.
The question arises if coding of temporal features of sound stimuli changes from the cochlea up to the IC. There is some convincing evidence from animal studies demonstrating a shift in temporal coding properties from the cochlea up to the auditory cortex (Lu & Wang, 2000; Phillips, Hall, & Hollett, 1989; Snyder et al., 2000). In particular, higher auditory neurons become less capable of synchronizing to high rate stimuli. Cochlear neurons are capable of synchronizing to acoustic and electrical stimuli that repeat at rates exceeding 1,000 Hz whereas neurons at the midbrain and cortical levels generally synchronize to rates of a few hundred and tens of hertz, respectively. The ongoing hypothesis is that the representation of high rate changes in the stimulus waveform become coded less by a temporal code and more by a spatial code (possibly through a spike rate and/or interval timing code) in higher auditory centers (Bartlett & Wang, 2007; Lu, Liang, & Wang, 2001; Schreiner & Langner, 1988; Wang et al., 2008). Considering that frequency is coded along one dimension of the ICC, this raises the possibility that temporal features may be coded spatially along the isofrequency laminae. There are animal studies that have shown that various temporal features, such as periodicity and latencies, are coded systematically along these ICC laminae (Langner & Schreiner, 1987; Schreiner & Langner, 1988) under certain stimulus conditions (Krishna & Semple, 2000; Seshagiri & Delgutte, 2007). Thus, it is possible that we may need to stimulate along the frequency axis of the ICC to transmit varying pitch percepts and across different regions within these isofrequency laminae to transmit sufficient temporal information. This is distinctly different from how CI stimulation transmits temporal cues. The cochlea is a one-dimensional structure that codes for different frequencies based on the location of activation. Temporal features are generally transmitted based on the temporal firing patterns of the neurons within each and across different frequency regions. Thus for CIs, it is sufficient to stimulate the different sites with various temporal patterns to transmit temporal cues to higher centers to achieve intelligible speech perception. This may not be the case for ICC stimulation in which AMI-3 performs poorly on consonant and speech tracking tests possibly because of distorted temporal cues. This is not to claim that individual neurons within the ICC lack the ability to convey some information about the temporal structure of the sound stimulus. Part of the initial rationale for using a single shank array and CI-based strategies, apart from our limited understanding for a better alternative, is that ICC neurons still appear to exhibit some general representation of the stimulus waveform as occurs at the cochlear level (Cariani & Delgutte, 1996; Suta et al., 2003). In other words, many neurons still respond in synchrony to the envelope of the sound signal and with a spatial representation for frequency information (Joris et al., 2004; Krishna & Semple, 2000). This neural representation of the stimulus becomes more complex and abstract in higher auditory centers as neurons begin to create an internal representation for the different features of the stimulus rather than a direct representation of the stimulus waveform (Wang et al., 2008). However, at least for speech perception in quiet, which can be sufficiently achieved even with crude temporal (<50 Hz modulations) and spectral (<4 bands) cues (Shannon et al., 1995; Shannon et al., 2004), we expected that CI-based strategies would be capable of restoring some speech perception based on the coding properties of ICC neurons. Our initial results in AMI-3 suggest that this may not be the case though results from a greater number of patients implanted into the ICC, including those without NF2 to rule out any tumor-related effects, are needed to confirm this idea. There is a possibility that multisite stimulation across the ICC laminae may be required for effective transmission of temporal information important for speech perception that cannot be achieved simply by stimulating a single array trajectory within the rostral-ventral ICC as hypothesized in the previous section.
One quite interesting result we observed across our three patients in line with the temporal–spatial hypothesis is presented in Figure 20, which plots detection thresholds for pulse trains with different rates (for pulse phase duration of 100 μs) for two different sites from each patient. The pulse trains were presented repeatedly for 500 ms at 1 Hz and adjusted in level until the patient could hear the stimulus. Further details on the methods and results are presented in Lim, Lenarz, Joseph, Battmer, Patrick, et al. (2008). All curves across patients and sites exhibited similar shapes in which the current threshold decreased dramatically from 75 to 250 pps and then flattened out for higher rates. This is surprising in that each patient was stimulated in a distinctly different midbrain region (i.e., lateral lemniscus, ICC, or dorsal cortex of IC) yet exhibited similar pulse rate effects. Basically, direct stimulation of midbrain neurons elicits increasing loudness with pulse rate but only for rates below 250 pps (i.e., for pulses separated by more than 4 ms). For higher rates, in which a greater number of pulses are presented for a set stimulus duration of 500 ms (repeated at 1 Hz), there appears to be no noticeable effect on the perceived loudness.

Thresholds versus pulse rate for midbrain stimulation. Current thresholds (in dB relative to 1 mA) are plotted as a function of pulse rate (75, 150, 250, 500, 720, 900, 1200, 2400 pps) for two sites (e.g., s2, s5, etc.) in each patient. Stimuli consisted of 500 ms pulse trains (100 μs/phase, 7 μs interphase gap, cathodic-leading pulses) repeated at 1 Hz. Dashed line corresponds to a rate of 250 pps, which is the rate at which all curves across patients, thus for different midbrain regions, began to flatten out.
What is significant about these results, in addition to the lack of differences across midbrain regions, is that they differ drastically from what has been observed for CI stimulation. A typical CI curve (green; taken from nine examples across nine patients in our clinic) is presented in Figure 21 and is consistent with what has been shown in previous studies (Kreft, Donaldson, & Nelson, 2004; McKay & McDermott, 1998; Shannon, 1985; van Wieringen, Carlyon, Macherey, & Wouters, 2006) in which the threshold monotonically decreases for increasing rates (even above 5000 pps for phase durations less than 100 μs). Usually below 200 pps there is a slight drop in threshold with increasing rate. In contrast, AMI stimulation (blue is an example taken from Figure 20) exhibited thresholds that decreased rapidly with increasing pulse rates up to about 250 pps and then remained relatively constant for higher rates. Based on acoustic and CI stimulation studies (Forrest & Green, 1987; McKay & McDermott, 1998; Moore, Peters, & Glasberg, 1996; Viemeister & Wakefield, 1991), it has been hypothesized that the central auditory system temporally integrates sound information within a window of roughly 5 ms, which can account for the decrease in threshold for CI pulse rates higher than about 200 pps. In other words, more pulses are detected within this 5 ms time window that increases the loudness percept. For rates higher than 1000 pps, there are likely summation effects associated with charge integration across pulses that further depolarizes the neural membrane to elicit greater activation (Butikofer & Lawrence, 1979; Cartee, van den Honert, Finley, & Miller, 2000; Middlebrooks, 2004). To account for the slight decrease in thresholds for increasing rate for lower pulse rates (i.e., <200 pps) as well the temporal resolution limit of the auditory system (e.g., for gap detection), it has been proposed that the system performs “multiple looks” in which each look (over a 3-ms window) is stored in memory to enable improved detection and discrimination of the perceived sound (Viemeister & Wakefield, 1991). These “multiple looks” occur over a longer time scale and likely in higher perceptual centers compared with the 5-ms “temporal integrator.” However, these hypotheses do not explain the shape of the AMI curves.
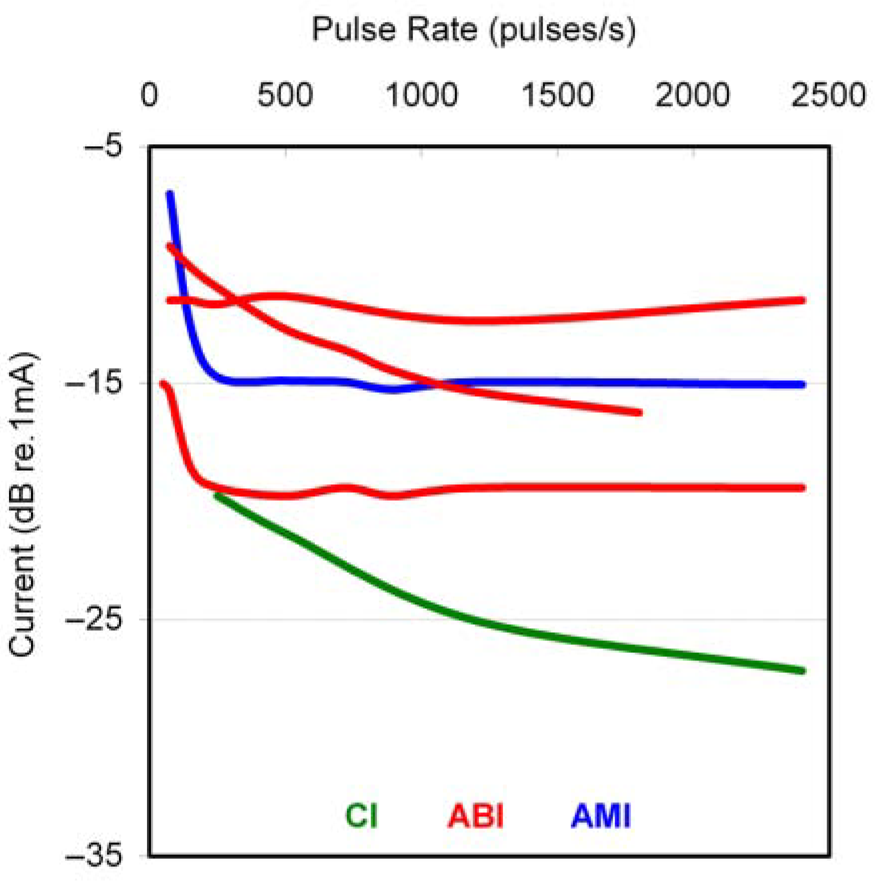
Threshold versus pulse rate across implant patients. Threshold (in dB) versus pulse rate curves for cochlear implant (CI, green), auditory brainstem implant (ABI, red), and auditory midbrain implant (AMI, blue) stimulation. CI and ABI data were obtained from patients in our clinic. One typical CI curve (taken from 9 examples across 9 patients), several ABI curves (3 distinct curves observed across 15 examples from 9 patients), and one typical AMI example from Figure 20 are included. The shape of the CI curve differs dramatically from the AMI curve. The ABI curves can have a shape similar to the CI curve or the AMI curve suggesting that properties relating to pulse rate stimulation may be shifting from the cochlea up to the midbrain in which the brainstem represents the transition point.
The differences in curve shapes between CI and AMI stimulation raises the possibility that the “temporal integrator” may exist at or below the midbrain level. This would explain why stimulation of different midbrain regions exhibited similarly shaped curves that flatten out after about 200 to 250 pps. Otherwise, if the “temporal integrator” was above the midbrain, then the additional pulses delivered to midbrain neurons with higher pulse rates should also decrease threshold levels. This would further suggest that neurons located at and beyond the level of the ICC no longer can be activated with high pulse rates to robustly transmit temporal features to higher perceptual centers. It is possible, and consistent with the discussion above, that high rate features of the stimulus need to be coded by spatial activation patterns throughout the ICC rather than just one site within each isofrequency lamina. The importance of the “temporal integrator” is to track the perceived loudness of the incoming input based on the temporal fluctuations of the stimulus. If ICC stimulation requires this temporal coding to be performed based on a spatial code, then stimulating only one site may provide distorted temporal cues to higher centers. This could partly explain the limited speech perception by AMI-3. Although this temporal–spatial hypothesis is quite speculative based on the limited data and requires further investigation to confirm the extent of spatial coding of temporal features throughout the ICC, our initial findings at least indicate that the way neurons are being temporally activated with electrical stimulation at the level of the midbrain have drastically changed from that of the cochlea (the brainstem may serve as the transition point as shown in Figure 21). Therefore, stimulation strategies originally designed for CIs and that are currently used in our AMI patients are likely suboptimal for the ICC. It must be emphasized that from our results, we cannot yet claim that the observed findings truly represent functional differences in temporal coding properties between the cochlea and IC because they may be an artificial effect of electrical stimulation. However, the point is that there are distinct differences in electrical activation properties between the two regions that suggest the need for different stimulation strategies, at least for providing higher temporal rates of activation that may be important for speech perception.
Future Directions for the AMI
Based on our animal and human findings, it is apparent that location of stimulation within the midbrain as well as within the ICC dramatically affects activation properties and hearing performance. The most crucial issue we currently face is ensuring accurate and consistent placement of the array into the appropriate ICC region. Therefore, the immediate goal will be to develop new surgical and electrophysiological techniques, as described in the section “Placement of the Array,” to improve array placement. However, even with such improvements, the question still remains as to which ICC region to implant our single-shank array. Based on our animal findings, we believe that implanting a rostral–ventral region of the ICC will provide greater improvements in hearing performance than currently observed in AMI-3. This is not to claim that AMI-3 does not receive significant improvements in her hearing capabilities with the AMI. She obtains improvements in lip-reading enhancement and environmental awareness on a daily basis and has expressed that her quality of life has been dramatically enhanced with the AMI. Her performance level is comparable to current ABI NF2 patients. Thus, even with placement into a hypothesized suboptimal ICC region (i.e., a caudal–dorsal region), we still have succeeded in providing our patient with a safe implant that has greatly improved her quality of life on daily basis.
We acknowledge the possibility that even if we can implant an array into the rostral–ventral region of the ICC, we may still not observe dramatic improvements in open set speech perception because of the need for sufficient spatial activation throughout the ICC to accurately transmit temporal information. We will continue to perform psychophysical studies to assess how varying temporal patterns of electrical pulse stimuli elicit different temporal percepts across CI, ABI, and AMI patients. This will provide insight into how temporal coding properties have changed from the cochlea up to the midbrain that will guide development of new AMI stimulation strategies. Furthermore, it will further support or refute the need for a three-dimensional array in future patients. The reason for not immediately using a three-dimensional array is the added risk for inserting multiple shanks into the human midbrain. However, if we can show from our human studies as well as further animal studies that we can improve temporal as well as spectral and level activation properties to multishank stimulation, then we can push for the development and translation of such a device. The hope is that through parallel studies in our current AMI patients and well-defined animal electrophysiology and safety studies, we will be able to develop a new generation AMI that will more effectively deliver cues sufficient to restore high levels of speech perception comparable to the CI. Whether this can be achieved with a single shank array placed into an appropriate region of the ICC or requires a three-dimensional array that spatially activates throughout the ICC remains to be seen.
Footnotes
Acknowledgments
We would like to thank Gert Joseph, Urte Rost, Joerg Pesch, and Rolf-Dieter Battmer for involvement with AMI patient fitting and testing at Hannover Medical University; Madjid Samii, Amir Samii, and the International Neuroscience Institute (Hannover, Germany) for successful AMI surgery; and the engineers and scientists at Cochlear Ltd. (Lane Cove, Australia), including James F. Patrick, Frank Risi, Godofredo (JR) Timbol, and Peter Gibson, for AMI development and technical assistance. We would also like to thank David J. Anderson for providing the scientific pathway for performing the initial AMI feasibility experiments at the University of Michigan; and Günter Reuter, Uta Reich, Gerrit Paasche, and Alexandru C. Stan for involvement with the animal safety studies at Hannover Medical University.