
Abstract
A fundamental step in improving the quality and consumer acceptability of wild watermelon (Citrullus lanatus) is the process of juice clarification. The aim of this research was to investigate the physicochemical properties of crude wild watermelon (Citrullus lanatus) juice and to optimise the processing conditions, incubation time, incubation temperature and enzyme concentration for the enzymatic clarification of the crude juice. Crude wild watermelon juice samples were treated with pectinase enzyme in different concentrations (0.05 to 0.15 w/w%), at different incubation temperatures (30–50 oC) and for different incubation durations (60–180 min). The effects of the different treatments on turbidity, clarity, viscosity, lightness, and brix were determined. The response models adequately predicted turbidity, clarity, and viscosity at R2 > 0.5, but not lightness considering that R2 < 0.5. The model was statistically significant in predicting turbidity (R2 = 0.86), clarity (R2 = 0.81), viscosity (R2 = 0.97) and brix (R2 = 0.94) – but not lightness (R2 = 0.24) at p < 0.05. The enzyme concentration did not significantly affect turbidity, clarity, and lightness, but it did significantly affect brix positively (p < 0.05). Response surface methodology software was used to determine optimal clarification conditions. In conclusion, the optimum conditions for crude watermelon juice clarification were 0.15 w/w% enzyme concentration, 60 min incubation time and 60 oC incubation temperature. The optimum output parameters were 14.18 NTU for turbidity, 0.04 Abs for clarity, 52.30 L* value for lightness, 1.96 cps for viscosity and 3.08% for Brix.
INTRODUCTION
Many indigenous crops remain unexploited by food processing establishments, despite being drought resistant and heat stress tolerant; these crops can contribute to income generation and poverty alleviation in many indigenous communities in Africa as they contain relevant nutrients and require limited agricultural input (Chivandi et al., 2015). Fruit juice can be processed from wild watermelon pulp as these fruits contain a considerable amount of water (Paris, 2015). Like their conventional counterparts, wild watermelons also contain vitamins and minerals (Tola and Ramaswamy, 2015). Crude fruit juices from wild watermelon would be cloudy and often not desirable without further processing due to the presence of different types of polysaccharides, proteins, tannins and metals which may hamper the filtration processes (Saxena et al., 2014). Pectins (which are the major component of the primary cell wall and middle lamella of most fruits) have been found to be more present in wild watermelon than in conventional watermelon and therefore can influence the texture and quality of the juice of wild watermelon fruits (Wang et al., 2016). The clarification of wild watermelon juice by enzymatic treatment will improve the quality of the juice by reducing viscosity (Castro Domingues et al., 2011), convert sucrose to oligosaccharide (Johansson et al., 2016) and reduce turbidity with limited polyphenol loss, and allow for quicker filtration (Rinaldi et al., 2013). The clarification processes often include centrifugation, enzymatic treatment and/or the application of clarifying agents such as gelatine, bentonite, silica solution and polyvinyl pyrrolidone (Castro Domingues et al., 2011). Commercial enzymes available for the clarification of wild watermelon juice include protease pectinases, cellulases and hemicelluloses (Aghajanzadeh et al., 2016). The incorporation of value-added juice products from wild watermelon into the commercial food chain can benefit indigenous populations (Mabhaudhi et al., 2019); hence the need to investigate the clarification of wild watermelon juice. The aim of this research was to determine the proximate, mineral and vitamin C concentration of wild watermelon juice, to investigate the effect of incubation time, temperature, and enzyme concentration on enzymatic clarification of wild watermelon juice and to optimise the clarification conditions for the enzymatic clarification of wild watermelon juice using response surface methodology (RSM).
MATERIALS AND METHODS
Enzyme source and collection of wild watermelon fruits
Pectinase powder (1 U/mg) was bought from Sigma Aldrich, South Africa. Mature wild watermelon fruits were purchased from a local farmer in the Capricorn District in the Limpopo Province of South Africa and stored in a cold room (4–10 ͦ C). Mature wild watermelon fruits are oval, have a tough rind and are dull in colour. Fruits are considered matured if they break open when dropped from 50 cm above a hard surface. The presence of the dried and brown-coloured tendril at the area where the stem joins the main vine and the presence of a creamy yellow spot that develops at the section of the watermelon fruit that is in contact with the soil are characteristic. Ripe fruits have a bright orange colour and pale red seeds.
Extraction of watermelon juice
Fruits were peeled, deseeded, cut into small pulp pieces using a kitchen knife and blended using a blender (Omniblend 111, Durban, South Africa) for 2–3 min at maximum speed until a homogeneous fruit pulp was formed. The juice was filtered using cheesecloth and pasteurised by heating it in a water bath (Labcon, Johannesburg, South Africa) at 90 °C for 5 min. Then the pasteurised juice was stored in a refrigerator at 0–3 °C, and up to 30 L of crude watermelon juice were processed for further analysis (Abdullah et al., 2007).
Mineral analysis
Minerals of crude juice were determined using an inductively coupled plasma emission (ICPE) 9000 spectrometer (Shimadzu, Kyoto, Japan), and the following minerals were analysed: potassium, phosphorus, magnesium, calcium, sodium, iron, selenium, copper, and zinc (Labbe et al., 2016). For sample digestion, 3 ml each of wild watermelon juice samples were placed into polytetrafluoroethylene (PTFE) pressure vessels. Then 5.0 ml of 70% nitric acid (approximately 300 ml were required) and 1.0 ml of 30% hydrogen peroxide (approximately 100 ml were required) were added to the vessel and digested under pressure in an automatic Titan MPS microwave sample preparation system (Perkin Elmer, Waltham, USA) and digestion system for 10 min. The extract was diluted by adding deionised water up to the 50 ml mark. The results were expressed as mg per g and all measurements were carried out in duplicate.
Vitamin C analysis
The vitamin C content of the crude juice was determined by using the PerkinElmer 200 Series HPLC system with UV detector (Perkin Elmer, Walthan, USA) procedure (Brause et al., 2003). The standard solutions were prepared as follows: Approximately 5.0 mg of ascorbic acid was dissolved in 100 ml of water (to give a 50 g/ml concentration). From that, 2, 4, 6 and 8 ml was diluted with 10 ml of water (to give 10–40 g/ml concentration). To each standard, 10 mg dithiothreitol (DTT) was added. HPLC water was used throughout. The test solutions were prepared as follows: Mobile phase used was KH2PO4 (0.5%, w/v), pH 2.5, with dithiothreitol (0.1%, w/v). Approximately 5.0 g KH2PO4 was inserted into a 1 L volumetric flask and 950 ml water was added. Then 1.0 g dithiothreitol was added to the solution and stirred until it was dissolved, and pH adjusted to 2.5 with concentrated phosphoric acid. Water was added to the 1 L mark, and the solution was filtered through a 0.45 µm membrane. Next, 1 ml of juice was diluted with 10 ml of water and then added into the standard solutions, after which 1 ml of dithiothreitol solution was added. The instrument was set up according to the following parameters: detector: 254 nm, set flow rate at 0.5 ml/min. Water was run through the column for 30 min, followed by the mobile phase for 1 h to equilibrate the system. 50 µl of the calibration standards was injected. The peak response was plotted, ensuring linear plots. Then 50 µl of the test samples was injected, repeating the samples that were not within the calibration range.
Determination of total sugars
Total sugar content was analysed by using HPLC (Perkin Elmer, Walthan, USA) following the manufacturer's protocol and glucose, fructose and sucrose (Sigma Aldrich, Darmstadt, Germany) were used as standards. 2.5 g each of glucose, fructose and sucrose were weighed and dissolved in 25 ml volumetric flasks with acetonitrile and distilled water (50:50) to the mark. The flasks were shaken until the contents were dissolved to produce 10% stock solutions. The standard solutions were prepared as follows: Glucose, fructose and sucrose standards were prepared at 0.5, 1.5, 2.5, 3.5 and 5.5% in 10 ml volumetric flasks. They were mixed with 0.5, 1.5, 2.5, 3.5 and 5.5 ml stock solutions, respectively, with acetonitrile and distilled water (50:50) to the mark and the solutions were mixed thoroughly. Next, 2 ml of each homogenised solution was pipetted from 0.5, 1.5, 2.5, 3.5, 4.5 and 5.5 standard solution to obtain 0.167, 0.5, 0.833, 1.167, 1.5 and 1.833%, respectively, into a vial. The mobile phase was prepared as follows: Sodium phosphate (156.01 mg) was weighed and mixed with water to the 100 ml mark to produce 10 Mm sodium phosphate solution. Acetonitrile (78 ml) and sodium phosphate solution (22 ml) were mixed in a 250 ml beaker and degassed by using an ultrasonic bath. The sample solution was prepared as follows: The juice sample (12.5 ml) was diluted with acetonitrile and distilled water (50:50) in a 50 ml volumetric flask to the mark. The diluted juice was filtered through the 0.45 µm filter paper. Peak identification was based on HPLC retention times compared with those of selected standards. Quantitation was based on the standard external method applying calibration curves fitted by linear regression analysis using Statistica 5.0 software (StatSoft, Tulsa, OK). The calibration curves were obtained by plotting peak area (mV/min) versus the amount injected (range covered, 0.2–2 g/100 mL). The carbohydrate content was then expressed as % carbohydrate. All measurements were taken in duplicate.
Determination of fibre content
Fibre content was determined by using the neutral detergent method (Garcia et al., 1997). Approximately 1 ml of wild watermelon was boiled in the solution of sodium lauryl sulphate at neutral pH for 1 h. It was allowed to precipitate for at least 1 h at room temperature and the precipitate was decanted through Whatman filter No. 54. The remaining residue was transferred into the crucibles and was washed with a small amount of ethanol (78%). The glass crucibles (with the precipitate) were heated for 1 h at 525 oC, adding approximately 1 g celite 545 (ignited overnight at 525 oC, cooled and stored in a stoppered container; an approximate total of 5 g was required). The crucibles were dried overnight, cooled and weighed to the nearest 0.1 mg. W (% total dietary fibre) = (Weight of crucible + Weight of residue) – Weight of crucible/Weight of sample x 100. All measurements were taken in duplicate.
Ash determination
Ash was determined by the dry-ashing method using a high-temperature muffle furnace (Lasec, Johannesburg, South Africa). The weights of the crucible and the sample (2.0 g) were taken (in duplicate) using a balanced scale (Lasec, Johannesburg, South Africa). The crucible with the juice was put in the muffle furnace (Lasec, South Africa) at 600 oC for 2–3 h until the ash turned white. White ash indicates the absence of carbon. The crucible was cooled to room temperature in a desiccator. The weight of the ash was calculated as % Ash (wet basis) = Mass ASH x100/Mass WET (Sani, 2013).
Protein content determination
Protein content was measured by means of the Dumas combustion method using Tru Spec N (Leco Corporation, Michigan, USA) (Saint-Denis & Goupy, 2004). The equipment was calibrated using EDTA (ethylenediamine tetra acetic acid) (Leco Corporation, Muchigan, USA), to give 51–61% protein on the display monitor. Approximately 0.2 g of freeze-dried crude juice samples were inserted into the carousel and the analysis was initiated. The results were displayed as % protein and all measurements were taken in duplicate.
Fat content determination
The fat content of crude wild watermelon juice was determined by using the Soxhlet extraction method. The weights (W1) of dried samples (3–4 g) were put in the flask. The extraction involved weighing the extraction flask and adding 85 ml of petroleum ether (an approximate total of 300 ml was required) and extracting for 44 h (or 80 cycles). The remaining ether was evaporated on a steam bath. The flask was dried in an oven at 100–102 oC for the required time to obtain constant weight (W2). The flask was cooled in a desiccator. After completion, the extracted fat was weighed, and the fat content calculated by the formula: Fat percentage (g/100 g) = 100(W2-W1)/Sample weight. All measurements were taken in duplicate (Jae-min & Seun-Kook, 2015).
Turbidity measurement
Turbidity was measured using a portable HANNA H1 83414 turbidimeter (Hanna Instruments, Johannesburg, South Africa) (Sin et al., 2006; Abdullah et al., 2007). A sample of extracted wild watermelon juice was placed on the calibrated turbidimeter, and the results were expressed as nephelometric turbidity units (NTU). All measurements were taken in duplicate.
Viscosity measurement
The viscosity of wild watermelon juice was determined using a Malvern Kinexus rotational rheometer (Malvern Panalytical Company, Worcestershire, England, UK) (Akhtar et al., 2011) and a CP1/60 spindle. The sample was poured into the rheometer cell, which is surrounded by a temperature-controlled vessel, and allowed to equilibrate at 25 oC for 5.0 min before measurement. Viscosity was measured at shear rates in the range 0.993 – 1.002 s−1 using continuous shear, with a 60s delay time and a 60s integration time at each shear rate. Measurements were taken in duplicate.
Total soluble solids (TSS)
TSS were determined by using a portable refractometer (Metler Toledo, 30GS, Johannesburg, South Africa). The equipment was first calibrated using distilled water, then the juice TSS was read. The measurements (duplicate) were expressed as % soluble solids (Abdullah et al., 2007).
Clarity measurement
Clarity was measured by using the Genesys 20 UV-VIS spectrophotometer (Thermofischer Scientific, Johannesburg, South Africa) at 660 nm. The equipment was calibrated using distilled water, and clarity was measured in absorbance (abs) (Sin et al., 2006).
Lightness (L* value) measurement
L* value of the juice was measured using a portable colorimeter (Konica Minolta Sensing Americas Inc., Johannesburg, South Africa) at room temperature. The Commission Internationale de L’Eclairage reference measures system L* value on a numerical scale where brightest white = 100 and black = 0. The L* value differences between the samples and the standard (control) was calculated using the resulting calorimetric values according to the formula: ΔL* = L* sample - L* standard (which was the difference in lightness and darkness ( + = lighter, - = darker) (Arsad et al., 2015).
Enzymatic treatment of wild watermelon juice
Approximately 500 ml of wild watermelon juice was subjected to enzymatic treatment for each experiment, as shown in the central composite experimental design in Table 1. The range of variables for enzymatic treatment of wild watermelon juice were enzyme concentration (X1): 0.05–0.15 w/w%, incubation time (X2): 60–180 min and incubation temperature (X3): 30–50 oC. The temperature of the system was controlled using a water bath (Labcon shaking water bath). The choice of these treatment conditions was guided by similar studies previously done on other fruit juices: carambola juice by Abdullah et al. (2007) and sapodilla juice by Sin et al. (2006). The pH of the juice was between 4.8 and 5.0. At the end of enzymatic treatment, the sample was pasteurised by heating it in a water bath of 90 oC for 5 min (Abdullah et al., 2007). The treated juices were filtered using Whatman No. 1 filter paper, and the filtrate was collected for analysis.
Central composite experimental design employed for enzymatic clarification of wild watermelon juice.
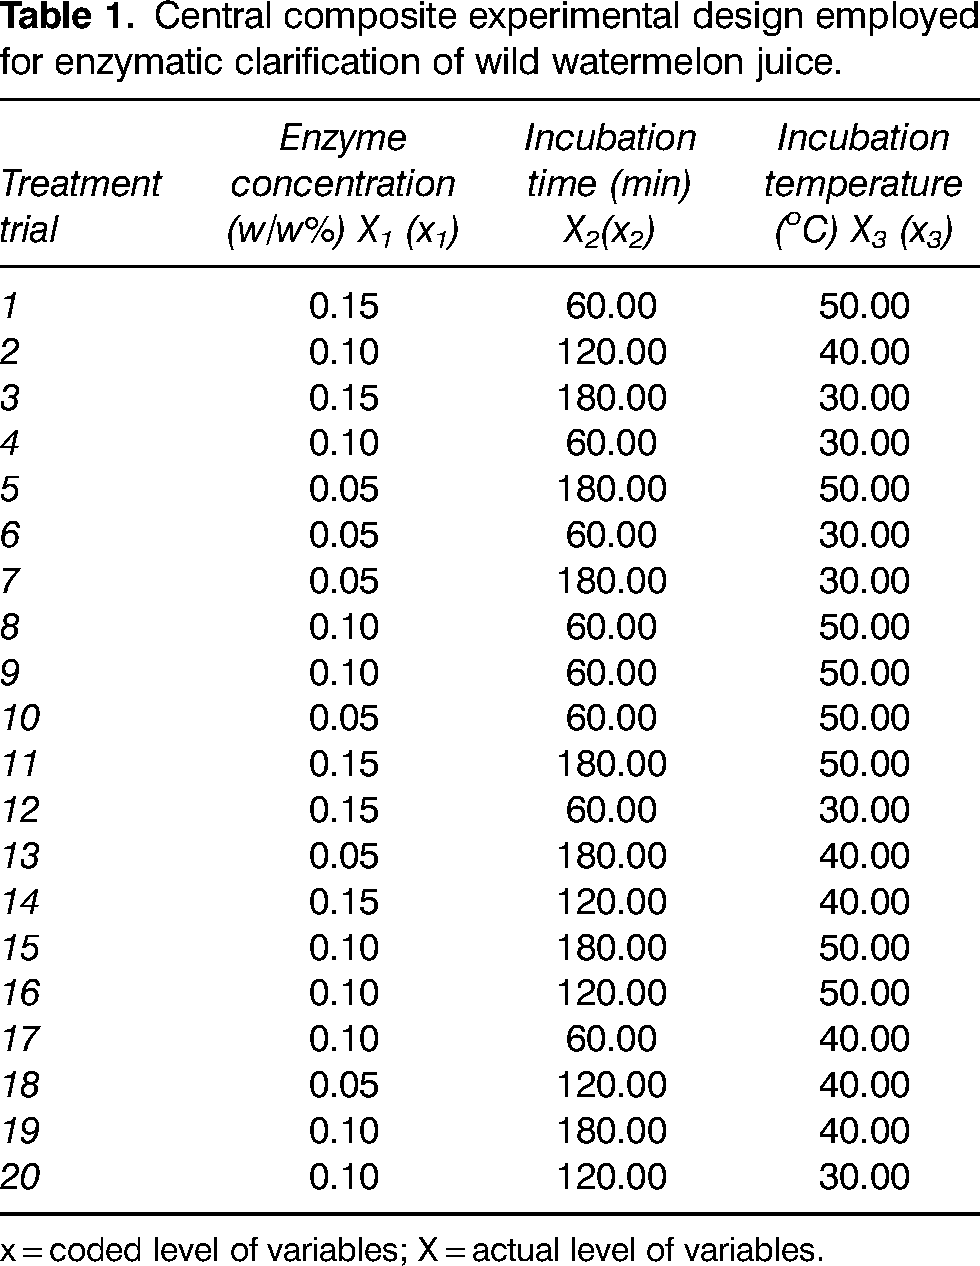
x = coded level of variables; X = actual level of variables.
Statistical analysis
RSM software was used to generate the experimental designs and statistical data with the help of Design Expert 11 software. Up to 20 different experiments were randomly chosen per the central composite design configuration for the three selected variables. The dependent variables (y) that were measured are (1) turbidity (y1), (2) clarity (y2), and (3) viscosity (y3), (4) L* value (y4) and (5) brix (y5) of wild watermelon juice. The independent variables used in this study are enzyme concentration (x1), incubation time (x2) and incubation temperature (x3) (Table 1) were represented in the polynomial function below.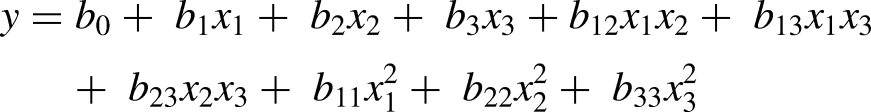
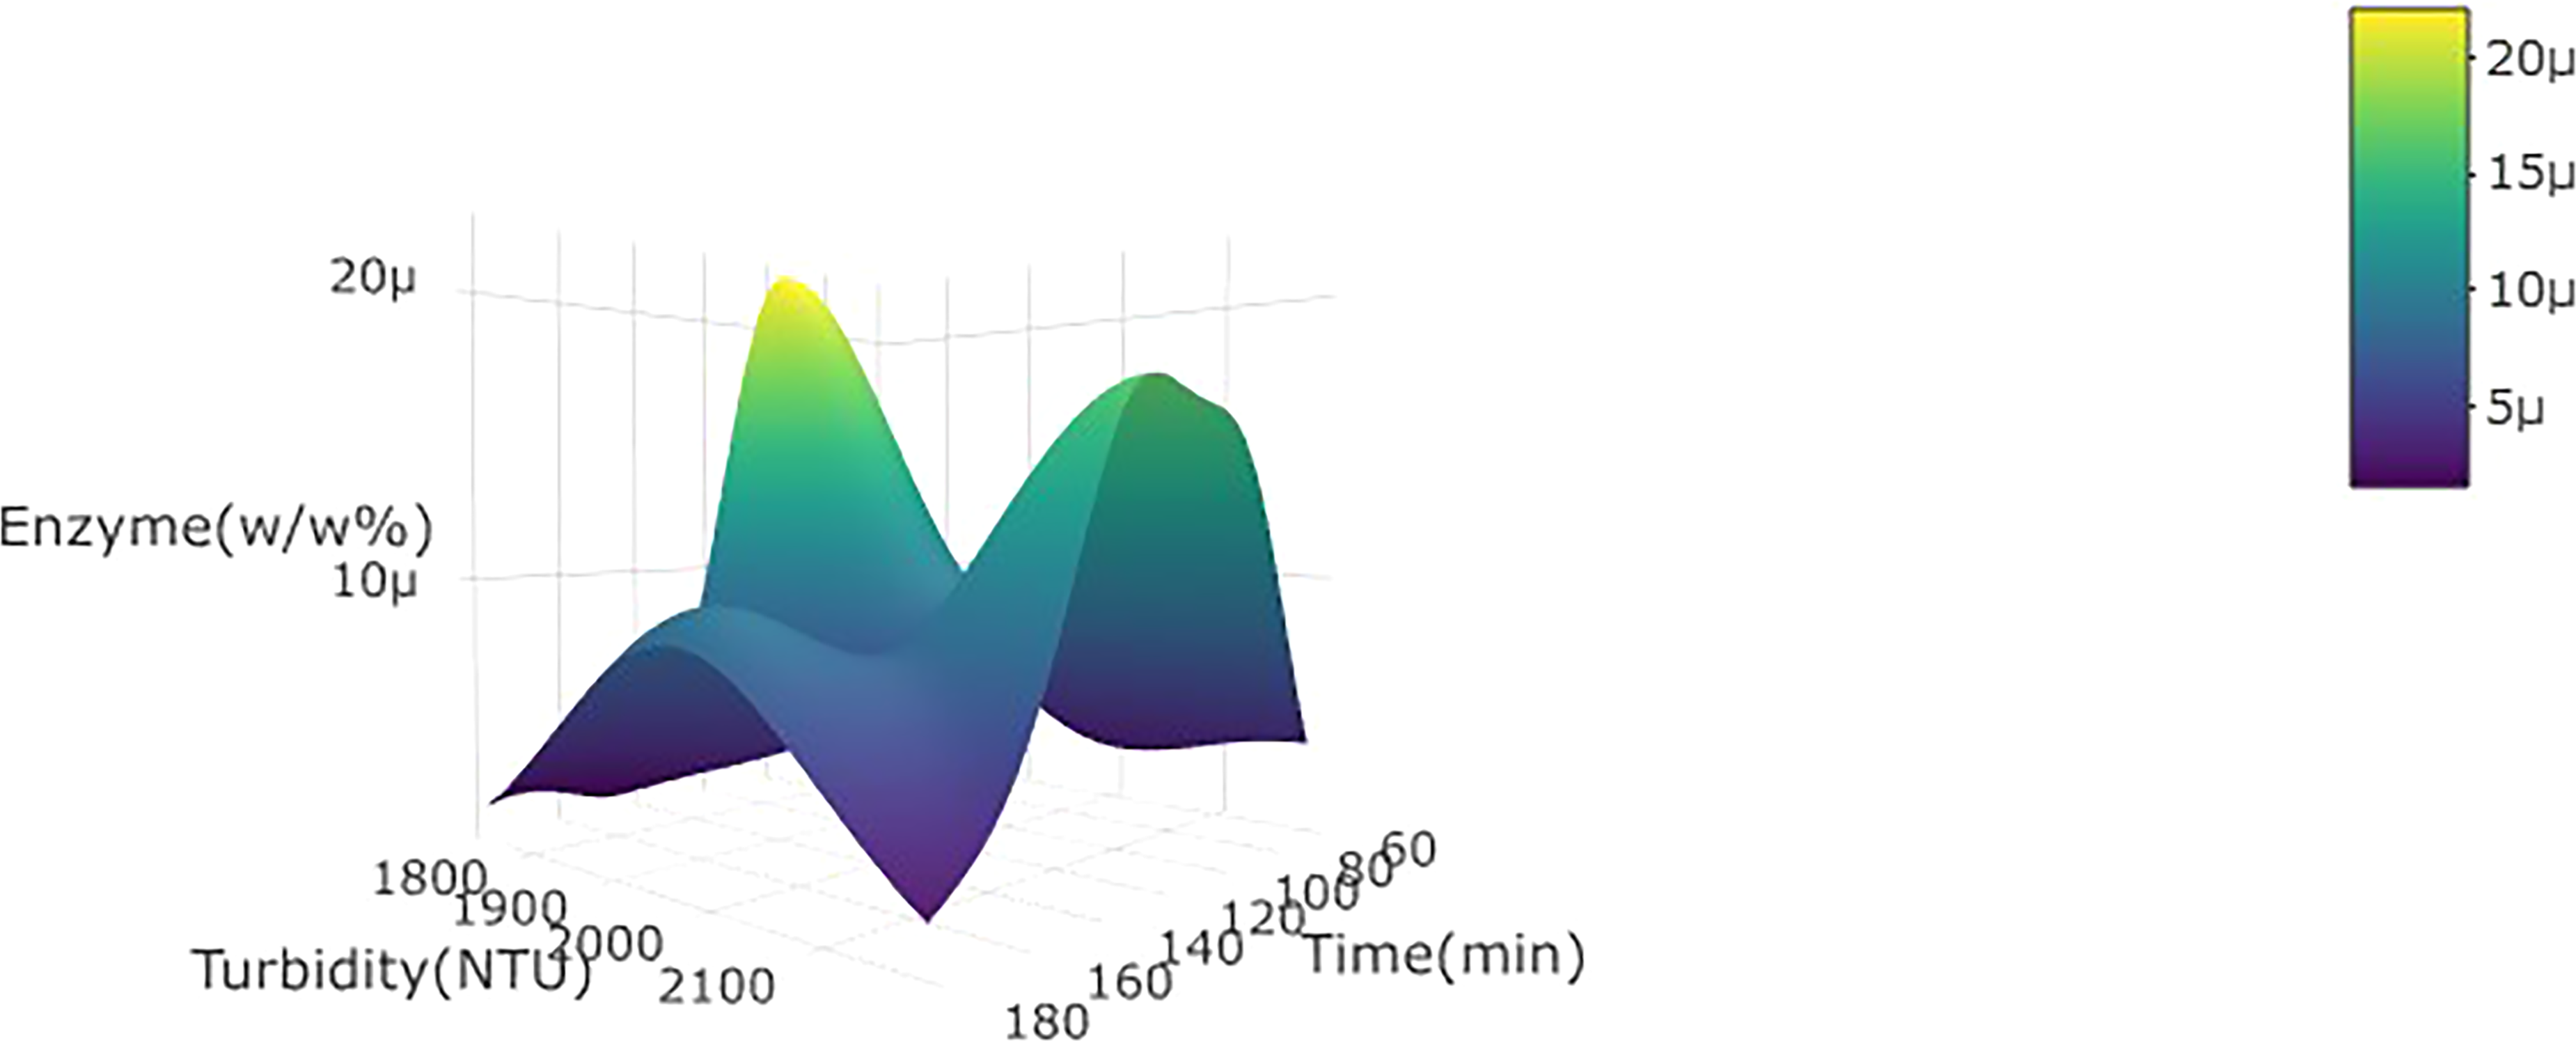
3d plot for turbidity of wild watermelon juice as a function of enzyme concentration (w/w%) and incubation time at 30 °C.
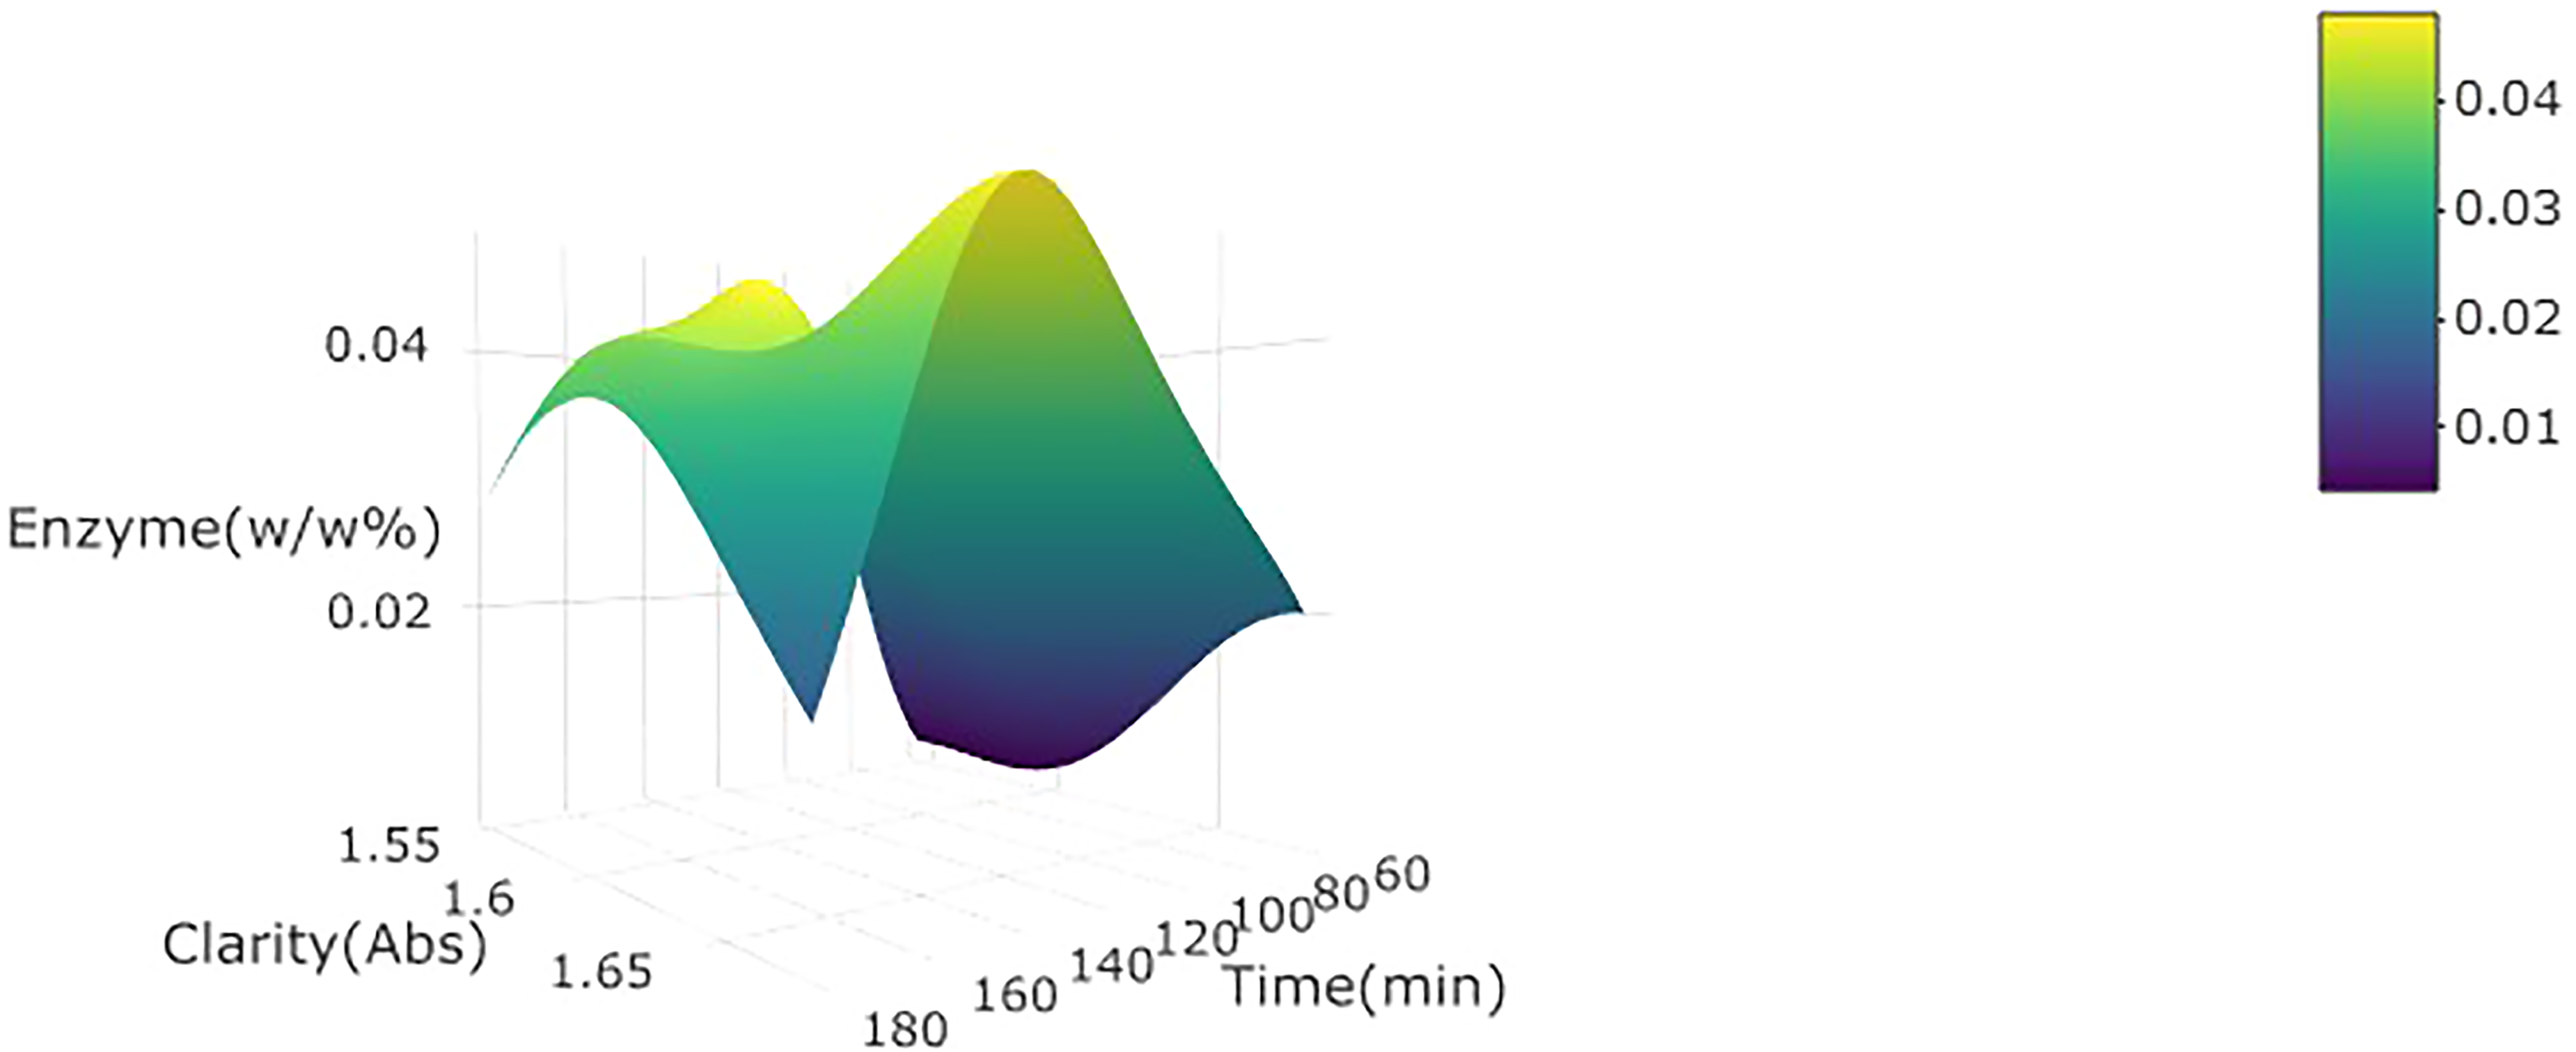
3d plot for clarity at 660 nm of wild watermelon juice as a function of enzyme concentration (w/w%) and incubation time at 30 °C.
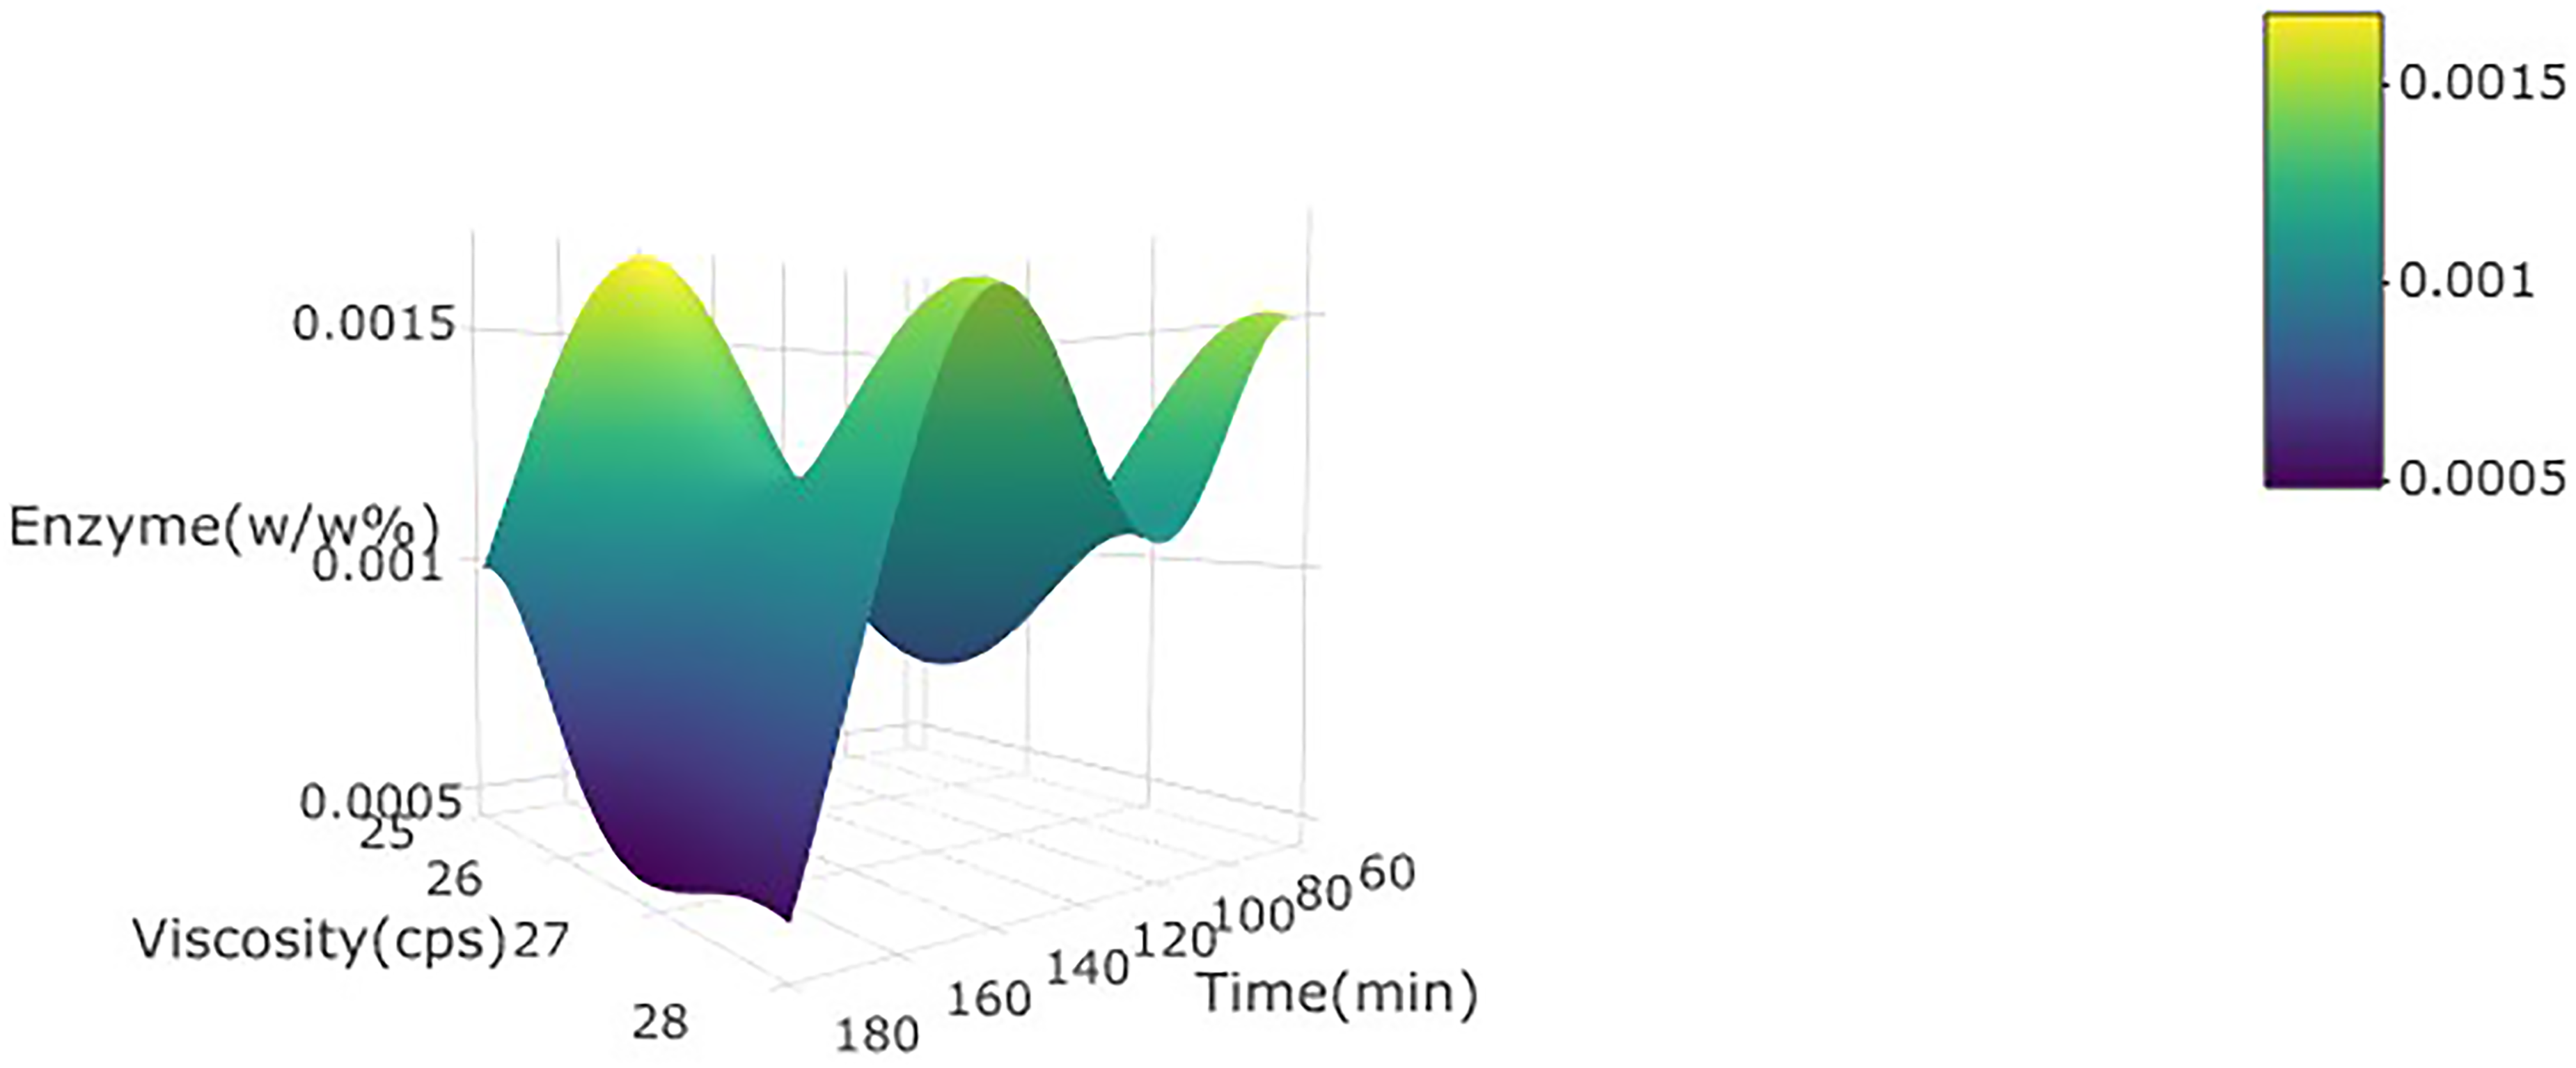
3d plot for the viscosity of wild watermelon juice as a function of enzyme concentration (w/w%) and incubation time at 30 °C.
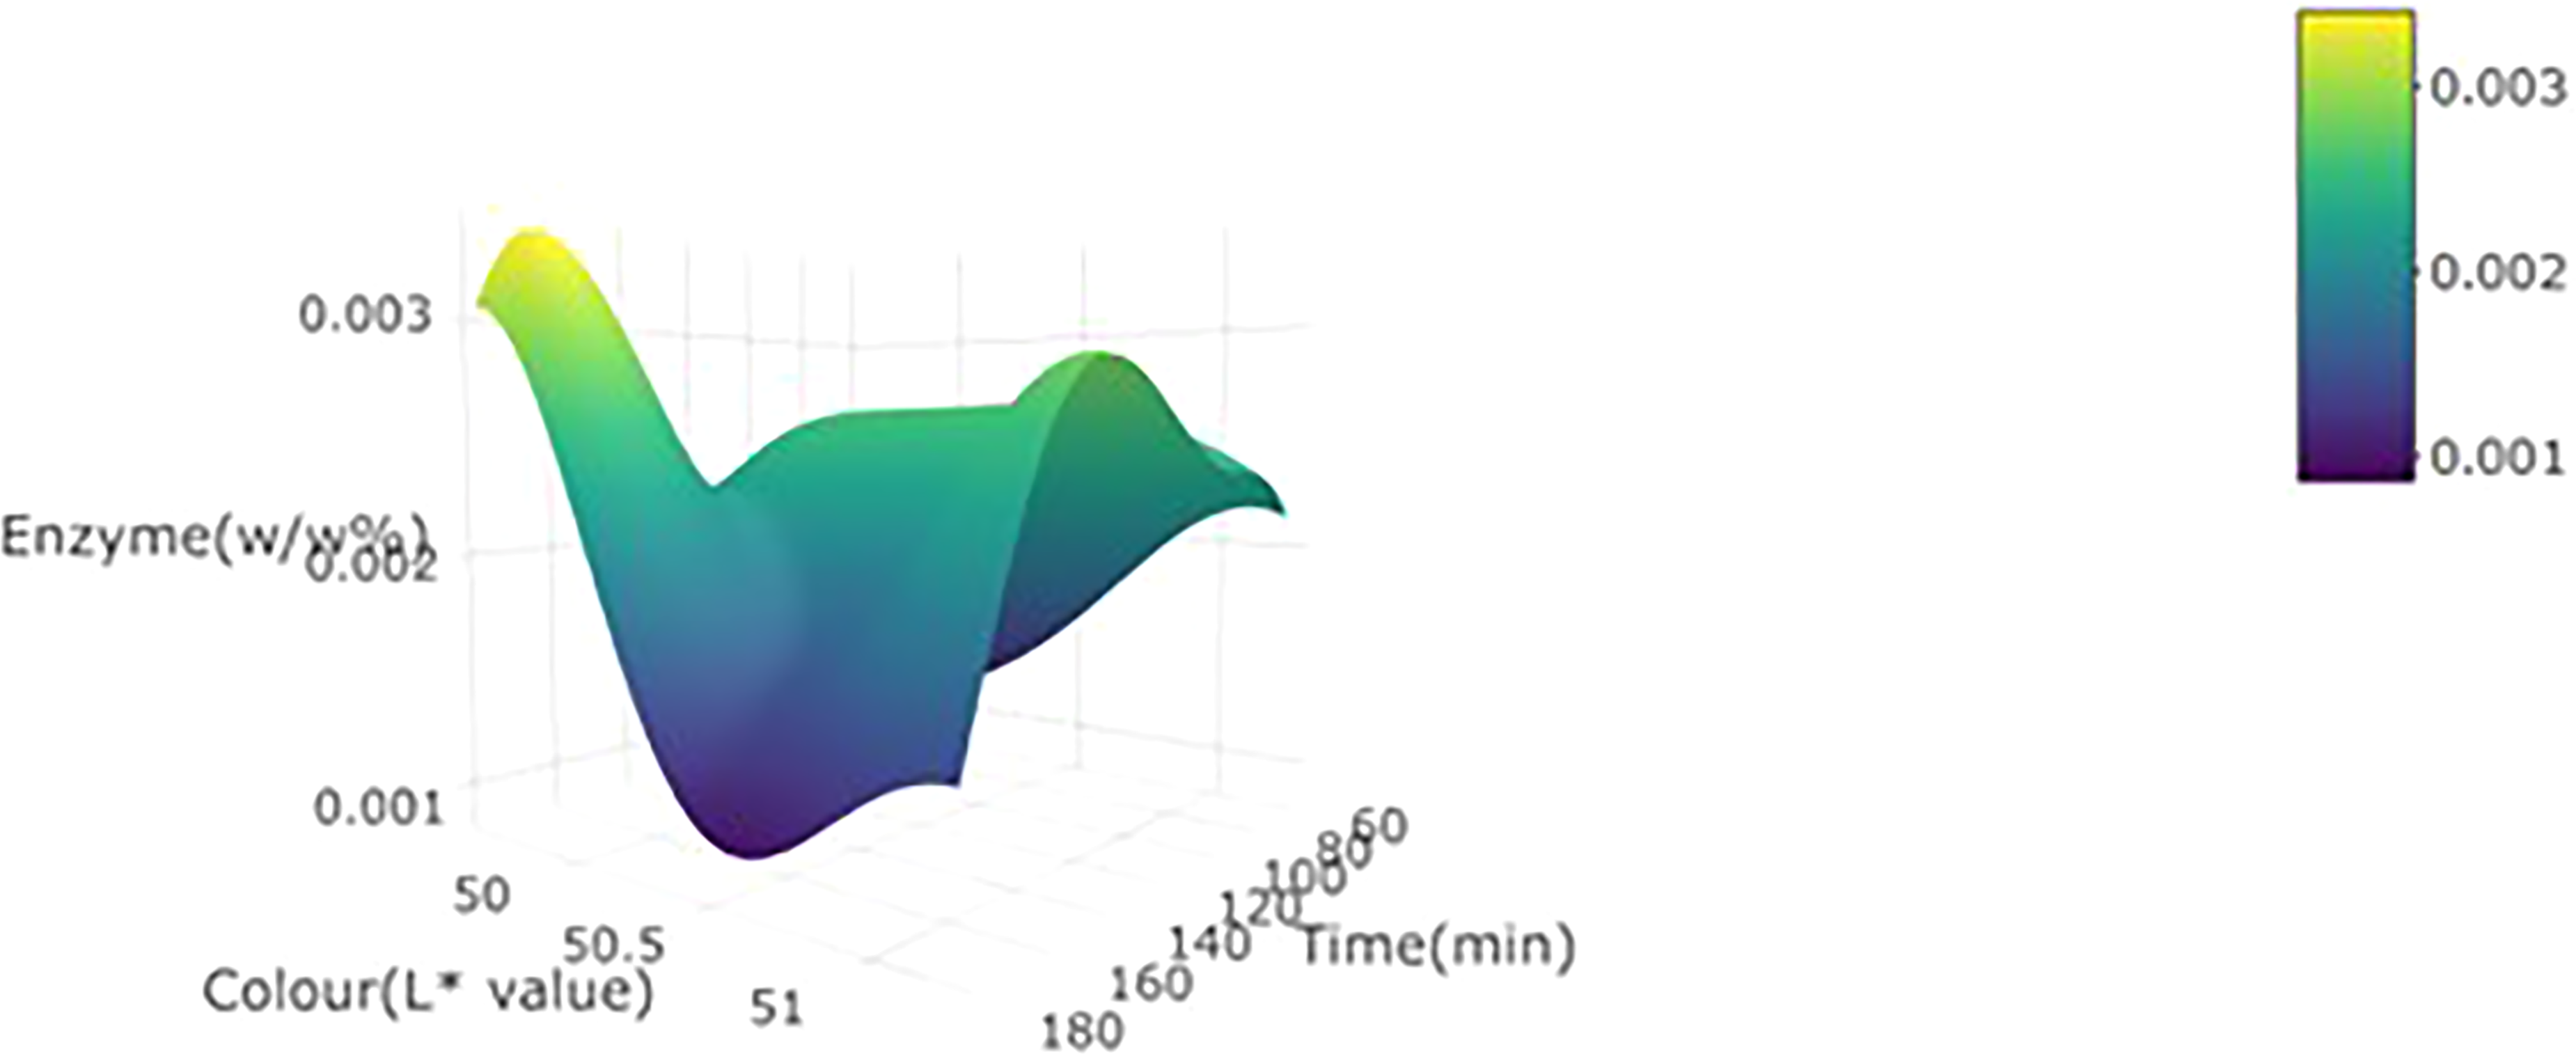
3d plot for L* value of wild watermelon juice as a function of enzyme concentration (w/w%) and incubation time at 30 °C.
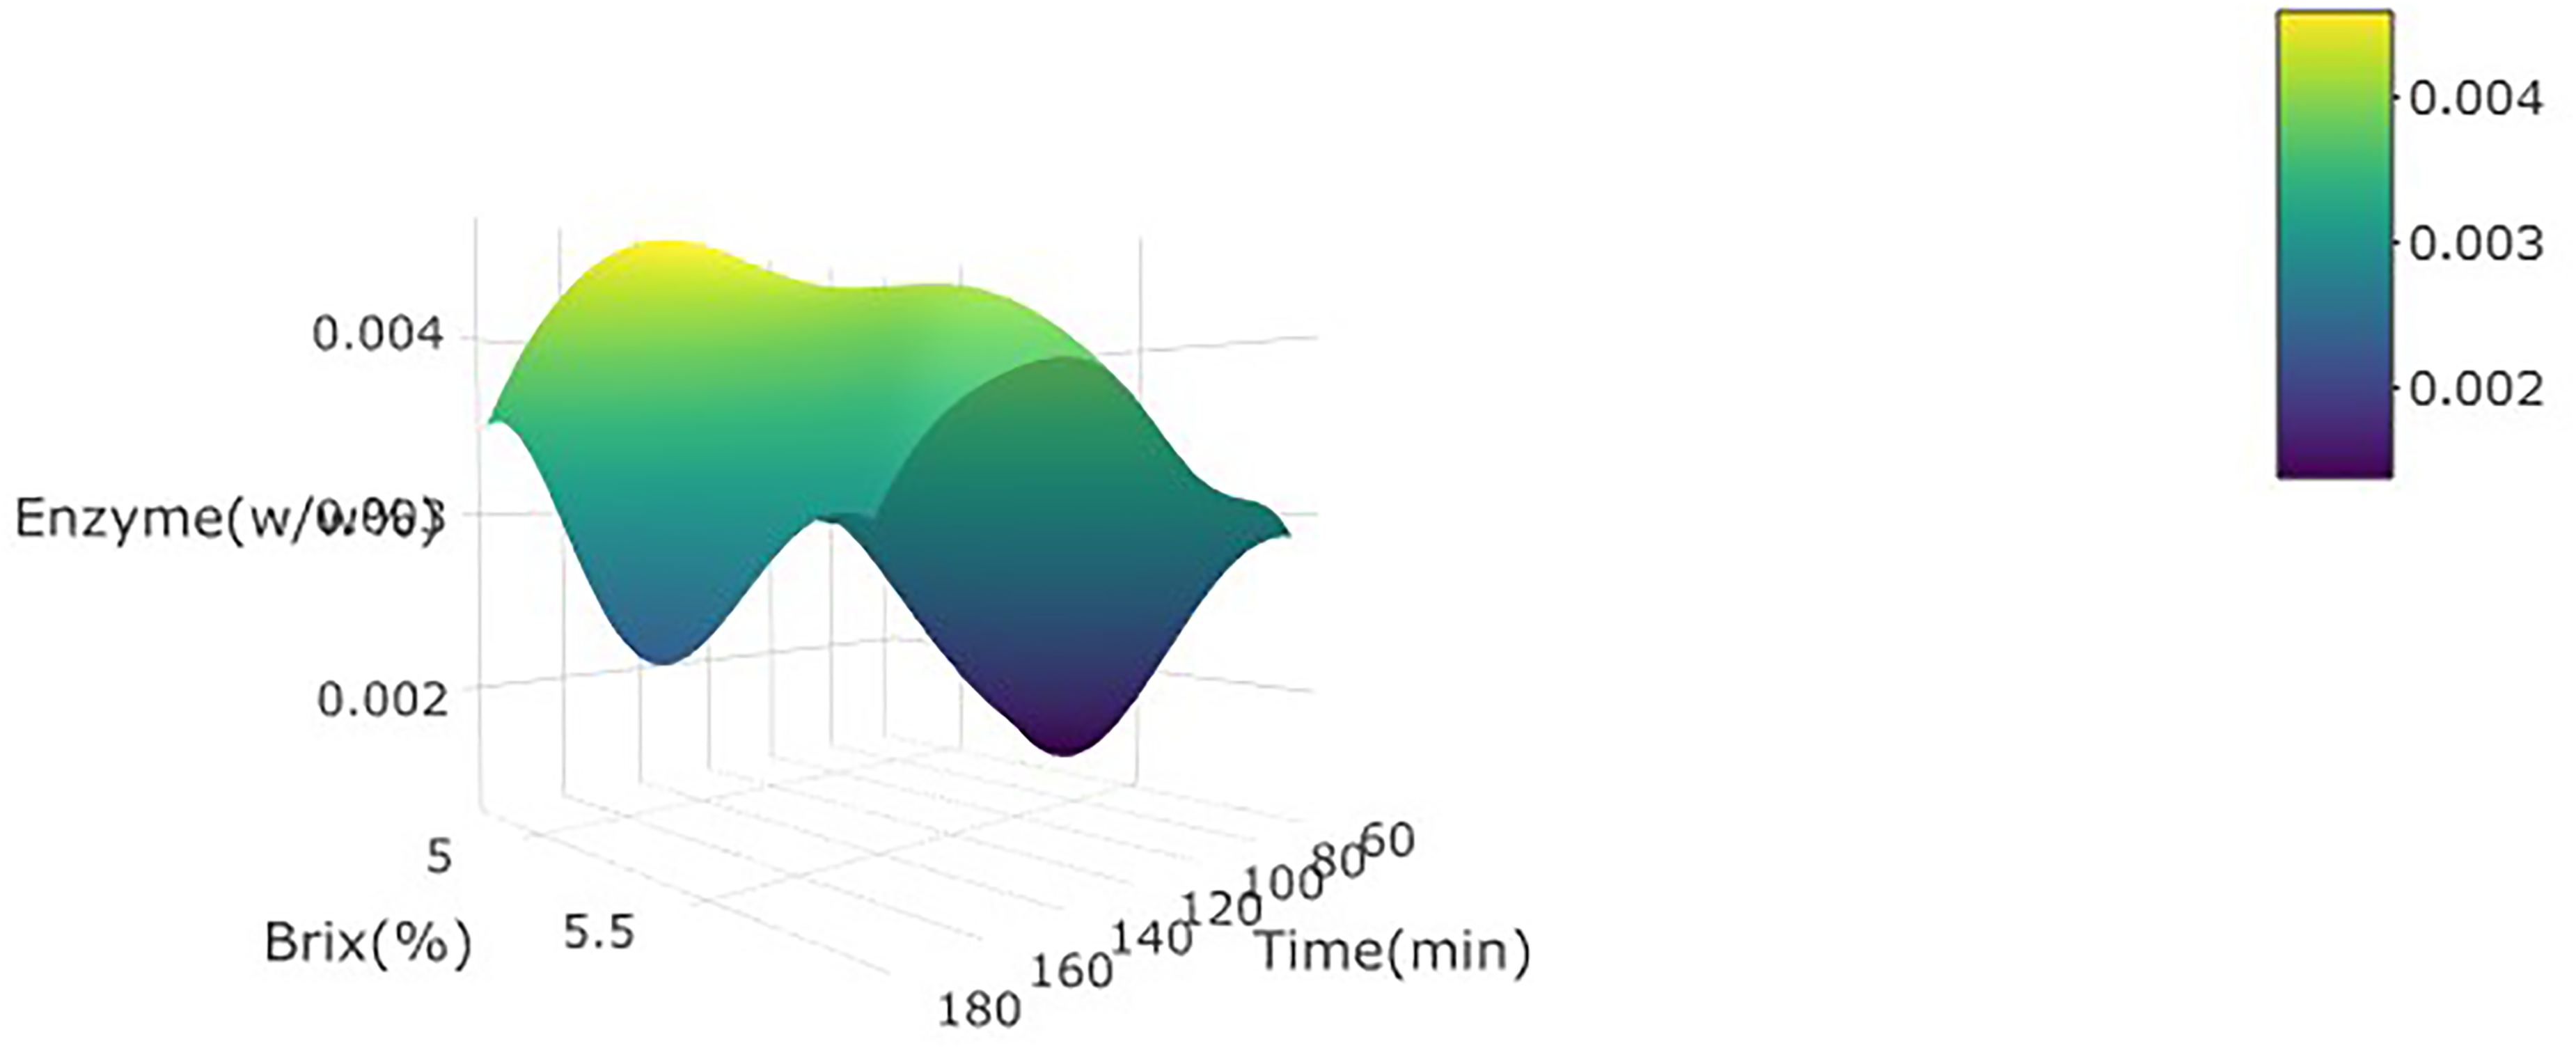
3d plot for brix of wild watermelon juice as a function of enzyme concentration (w/w%) and incubation time at 30 °C.
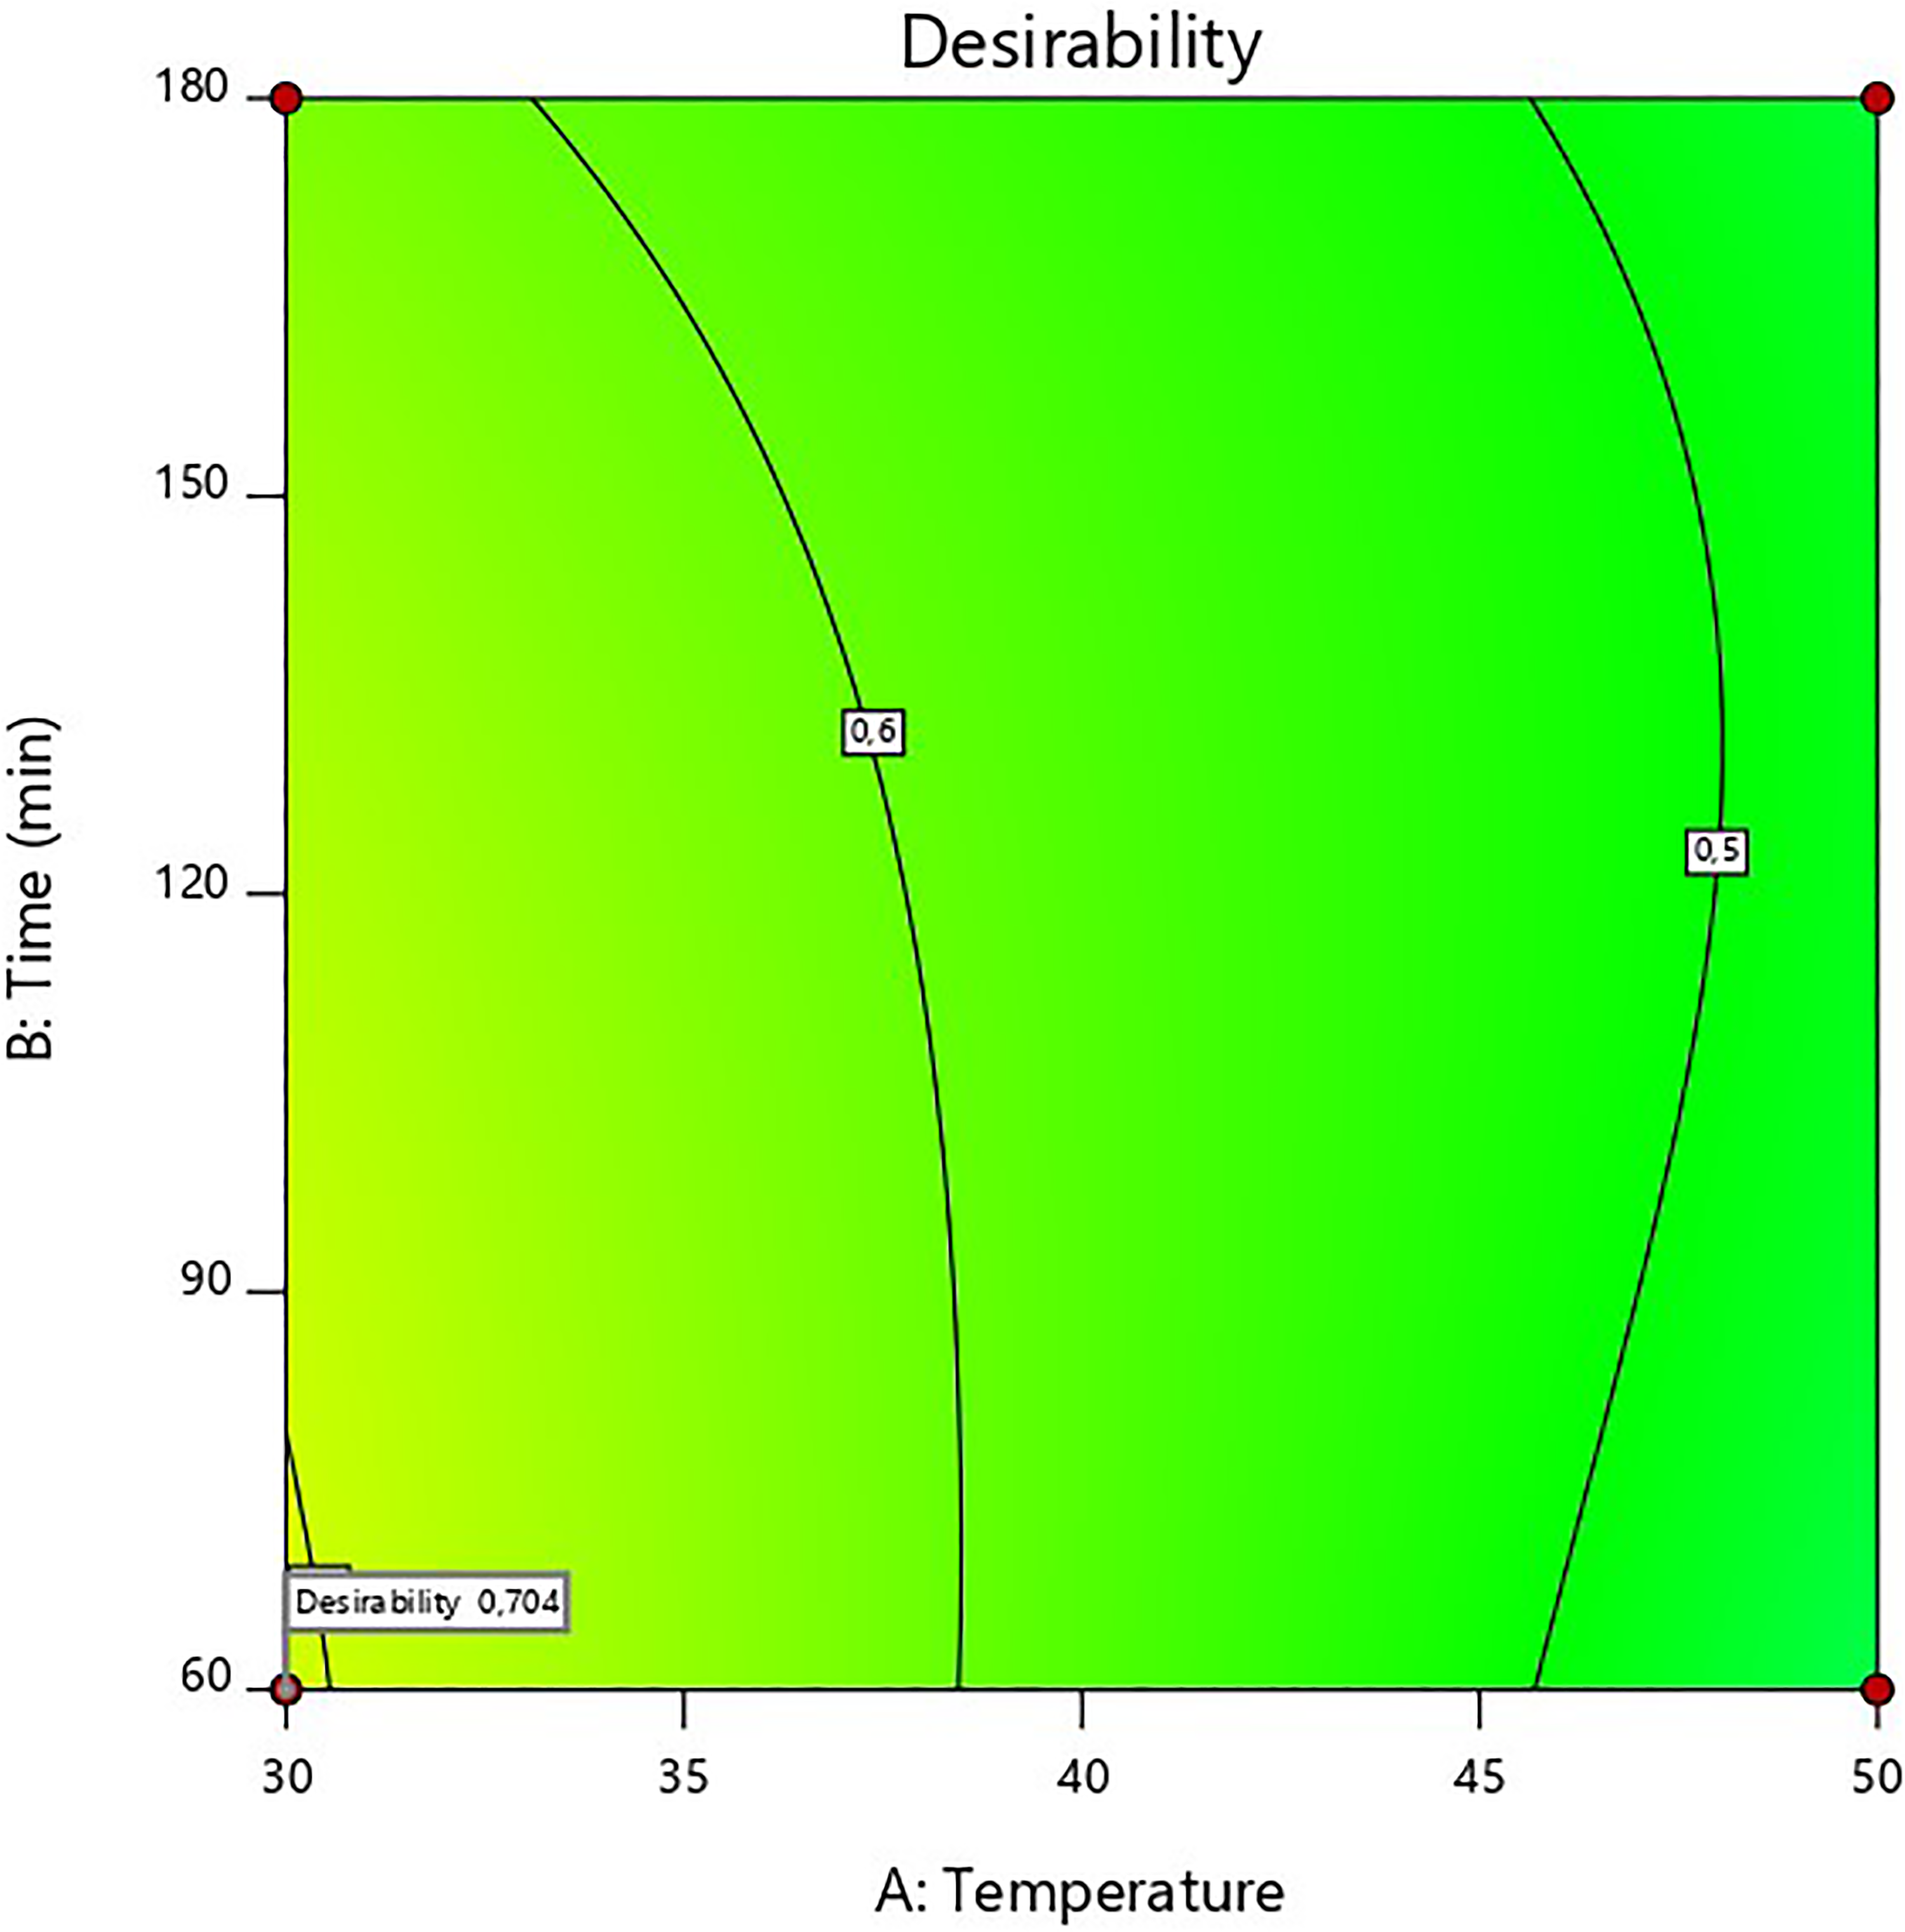
Contour plots for optimum conditions of turbidity, clarity, L* value, viscosity and brix as a function of enzyme concentration, incubation time and incubation temperature at 30 °C
Regression coefficients and R2 values for five response variables for enzymatic clarification of wild watermelon juice.
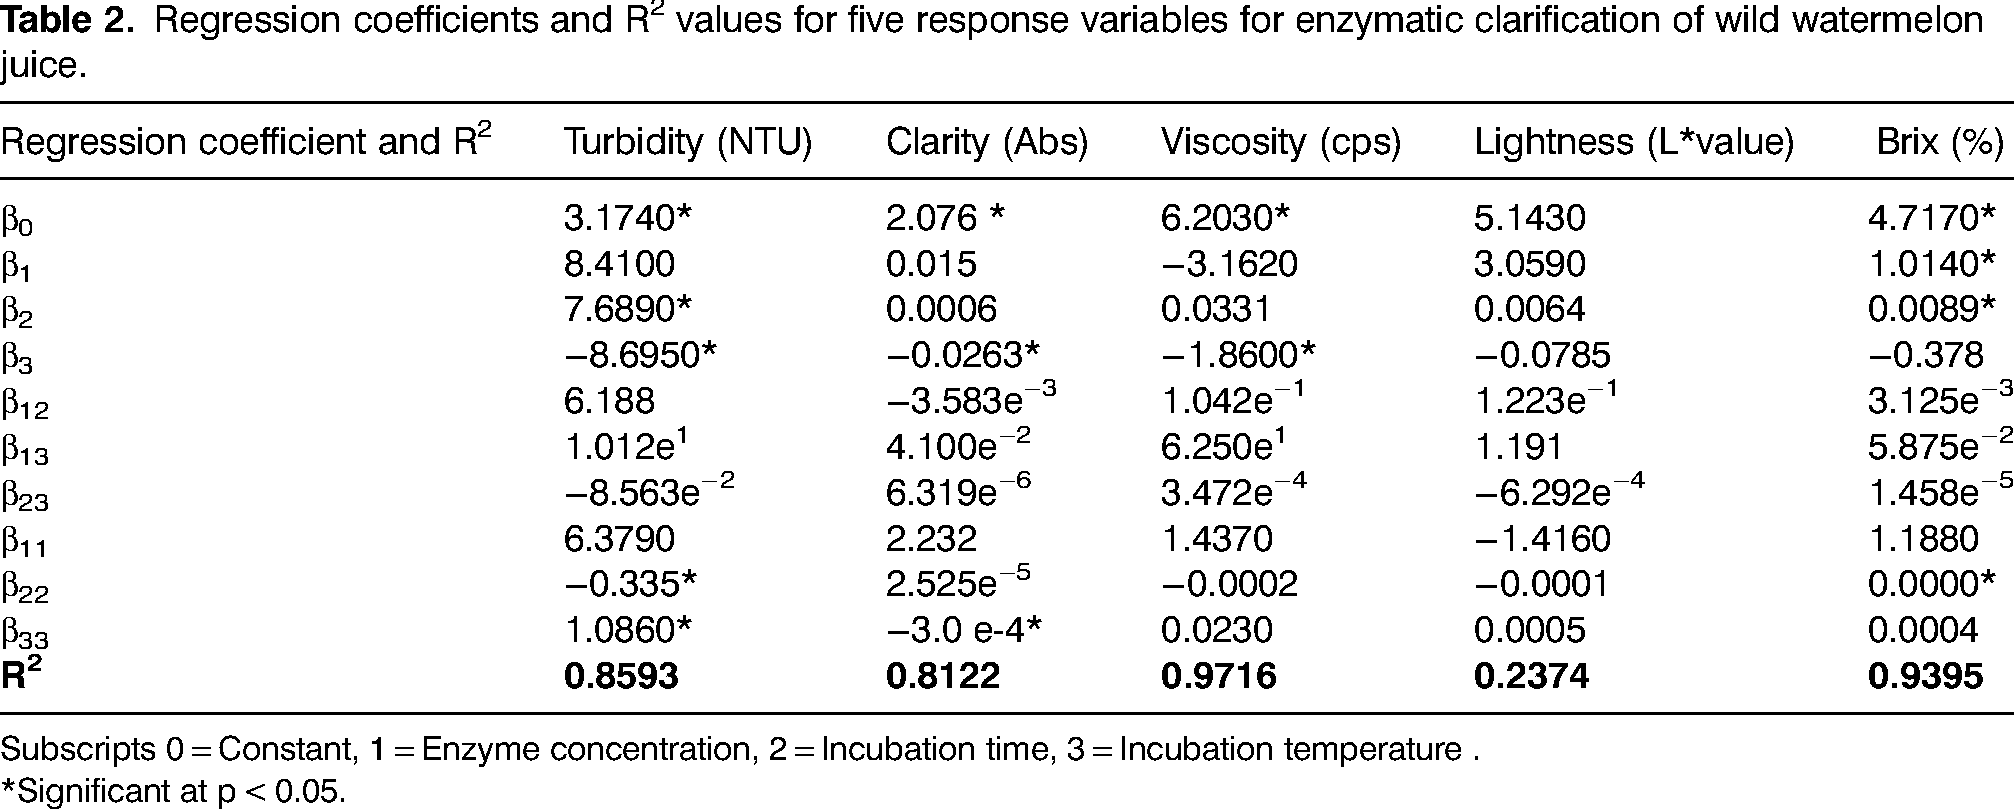
Subscripts 0 = Constant, 1 = Enzyme concentration, 2 = Incubation time, 3 = Incubation temperature .
*Significant at p < 0.05.
RESULTS AND DISCUSSION
Statistical considerations
The model was statistically significant in predicting turbidity (R2 = 0.86), clarity (R2 = 0.81), viscosity (R2 = 0.97) and brix (R2 = 0.94) as the regression coefficients were significant at p < 0.05 and the regression coefficients (R2) were higher than 0.8, an indication that the model was a good fit. Conversely, the model was not statistically significant in predicting lightness (R2 = 0.24) at p > 0.05 R2, which was lower than 0.5 (Tables 2 and 3). It should be noted that when R2 reaches unity, the regression model becomes better (Sin et al., 2006). The 3D plots for turbidity, clarity, L* value, viscosity and brix of wild watermelon juice as a function of enzyme concentration and incubation time developed using R Studio version 3.6.2 are presented in Figures 1 to 5. The contour plot for optimum conditions is presented in Figure 6.
Regression models of five response variables for the enzymatic clarification of wild watermelon juice.
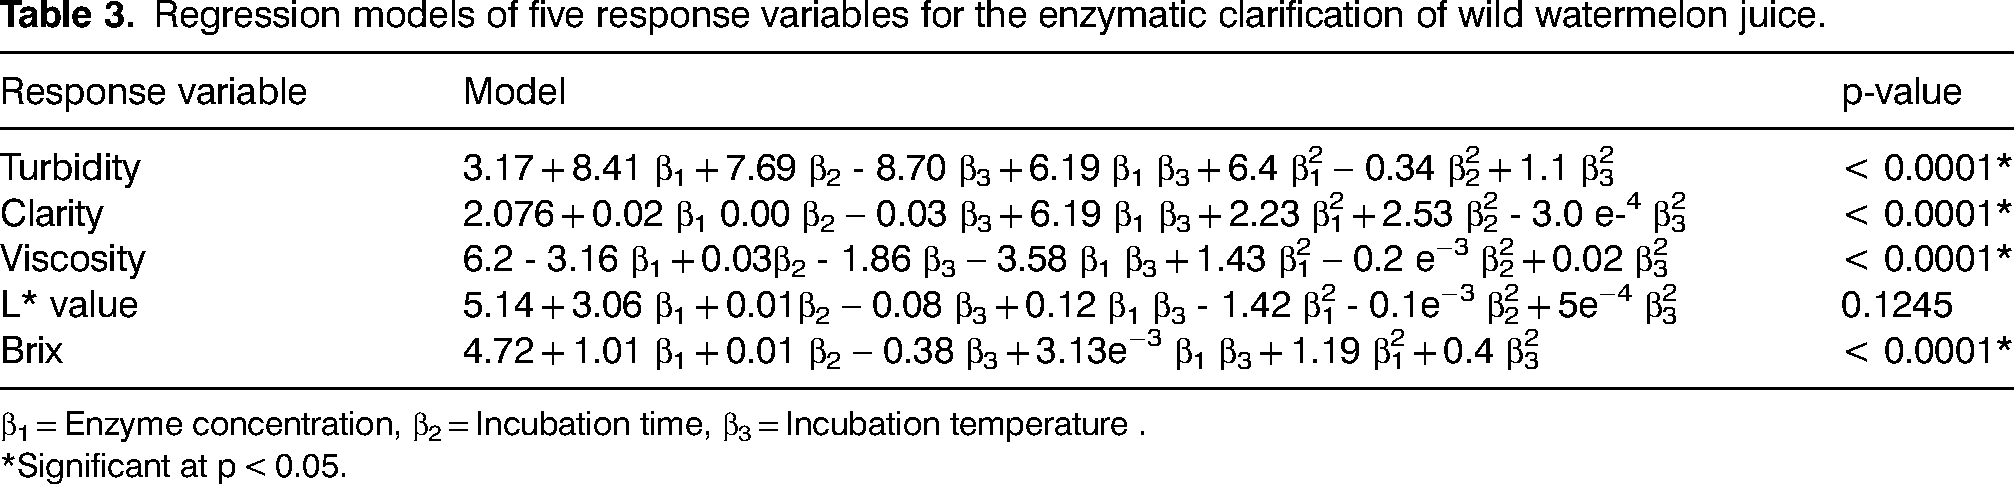
β1 = Enzyme concentration, β2 = Incubation time, β3 = Incubation temperature .
*Significant at p < 0.05.
Proximate and mineral composition of crude wild watermelon juice
The wild watermelon juice had 4.295 g/100 g sugar, 0.9985 g/100 g fibre and 10.135 g/100 g protein. Potassium was the most abundant mineral at 39.3 mg/L, with a relatively smaller amount of magnesium (2.12 mg/L), sodium (1.89 mg/L), calcium (1.42 mg/L), iron (0.49 mg/L), zinc (0.15 mg/L), phosphorus (0.34 mg/L) and manganese (0.048 mg/L). The vitamin C content was found to be 2.99 mg/L. The consumption of wild watermelon juice can boost the intake of potassium, sodium and magnesium, which can regulate blood pressure and reduce the risk of stroke, cardiovascular disease and coronary heart disease in adults (Steffensen et al., 2017). The presence of minerals such as potassium, magnesium, sodium, calcium, iron and phosphorus implies that the juice can help fight mineral deficiency (Chuku and Chinaka, 2014). The juice of the wild watermelon contained less vitamin C (2.990 mg/L) than conventional watermelon (40.8 mg/L) (Nweze et al., 2015), lemon juice (130.5 mg/L) and orange juice (125.4 mg/L – 127.8 mg/L) (Tareen et al., 2015). Vitamin C is an essential antioxidant that plays a role in various enzymatic reactions and the biosynthesis of hormones and collagen metabolism in the body, and is essential for the prevention of scurvy in humans as well as the prevention of coronary heart disease, stroke and cancer (Wang et al., 2021).
Turbidity, viscosity, brix and L* value of crude wild watermelon juice
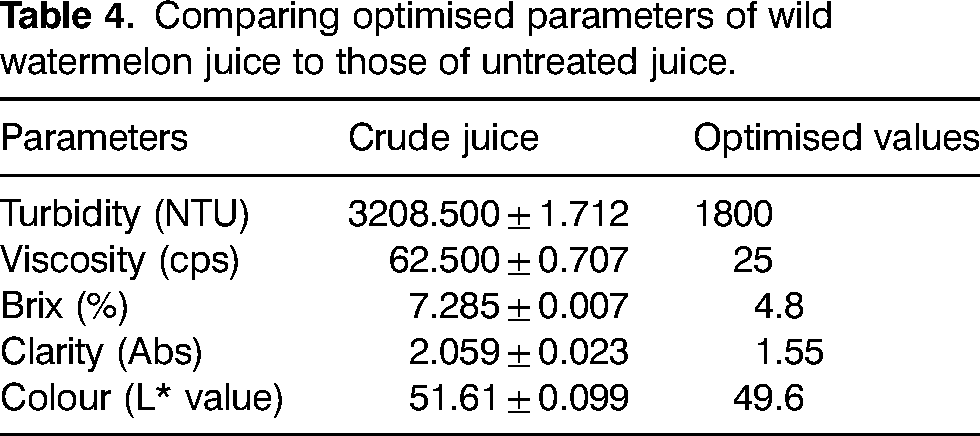
Crude wild watermelon juice had a relatively high turbidity, viscosity and brix compared to optimised values (Table 4) and this may be attributed to pectin polysaccharides, tannin and metals suspended in the juice; hence the need for enzymatic treatment (Ucan et al., 2014; Verma et al., 2018). The brix value of crude wild watermelon was low compared to that of other fruits because of the small amounts of dissolved solids such as sucrose, fructose, vitamins, minerals, amino acids, proteins, hormones and other nutrients in the juice (Ugwu et al., 2018).
Comparing optimised parameters of wild watermelon juice to those of untreated juice.
Effects of enzymatic treatment on turbidity and clarity
The enzyme concentration did not significantly (p < 0.05) affect the turbidity and clarity of wild watermelon juice in either linear or quadratic terms (Table 2). The fragmented unit of pectin polysaccharide by pectinase (Ucan et al., 2014) may have been subjected to flocculation and sedimentation – which explains why turbidity and clarity were not significantly affected in this study (Saxena et al., 2014). The higher enzyme concentration is expected to cause an increase in the rate of hydrolysis of pectin particles in the wild watermelon juice. The incubation time significantly (p < 0.05) affected turbidity positively in linear terms, and this can be attributed to the degradation, over time, of the pectin polysaccharide into fragments, thus increasing the turbidity of wild watermelon juice during the initial stages (Hanine et al., 2016). The incubation temperature significantly (p < 0.05) affected turbidity and clarity negatively in linear terms. This can be attributed to the formation of a gel by pectin polysaccharide and related hydrolysed particles due to high temperatures, which in turn leads to agglomeration and sedimentation (Hanine et al., 2016) (Figures 1 and 2).
Effects of enzymatic treatment on viscosity
The enzyme concentration and incubation time did not significantly (p > 0.05) affect viscosity positively in the linear term. This is because of the breakdown unit of pectin polysaccharide undergoing flocculation, agglomeration, and sedimentation as soon as it is produced due to the gelation effect of temperature (Saxena et al., 2014) (Figure 3).
Effects of enzymatic treatment on lightness (L* value)
The effect of all treatment (enzyme concentration, temperature, and incubation time) on L* value was not significant (p = 0.013) in either the linear or quadratic manner. This may be attributed to the fact that most of the dominant pigments in wild watermelon juice are not related to the pectin compounds and are therefore not affected by pectin degradation (Figure 4).
Effects of enzymatic treatment on brix
Both enzyme concentration and incubation time significantly (p < 0.05) influenced the % brix positively in the linear term. An increase in the enzyme concentration over time boosted the action of pectinase on the pectin molecules in the juice. This phenomenon is explained by Saxena et al. (2014): the increased pectinase action will consequently give effect to the degradation of pectin molecules, resulting in the release of the dissolved substances such as soluble sugars, B vitamins, minerals, and vitamin C (Arsad et al., 2015). The degradation and separation of the cell wall eventually affects the release of the nutritional composition of the interior cells (Norjana & Noor Aziah, 2011) (Figure 5).
Optimised clarification parameters
RSM software was used to obtain the optimum clarification conditions by superimposing the contour plots of all the responses. The desirability functions used to determine the optimum clarification conditions were minimum turbidity, minimum absorbance, minimum viscosity, minimum % brix and maximum lightness. The superimposed plot (Figure 6) shows the optimum output parameters to be as follows: turbidity – 1800 NTU; clarity – 1.55 Abs; L* value – 49.6; viscosity – 25 cps; brix – 4.8%. The optimum parameters are as follows: enzyme concentration – 0.15 w/w%; temperature – 30 oC; incubation time – 60 min, desirability value – 0.704. Overall, the enzymatic treatment of wild watermelon juice resulted in a decrease in turbidity and viscosity. A similar effect has also been reported for blueberry, blackcurrant and raspberry (Bender et al., 2016).
CONCLUSION
The proximate and mineral analyses show that crude wild watermelon juice contained a total sugar content of 4.295 g/100 g and potassium was the most abundant mineral with a value of 39.3 mg/L. Enzymatic treatment shows that the incubation temperature significantly reduced turbidity, viscosity, and clarity of wild watermelon juice, whereas the incubation time caused a significant increase in turbidity and brix. A statistical analysis was conducted by employing the response surface methodology tool. The optimum process parameters (incubation time, incubation temperature and enzyme concentration) for the enzymatic clarification of wild watermelon juice were found to be useful in helping to understand the juice clarification process. The 3D plots for individual response parameters (turbidity, clarity, viscosity, lightness, and brix) against the independent variables (time and concentration) designed were able to display the relationship between the different variables. The recommended enzyme clarification conditions are lower incubation temperature (30 oC), lower incubation time (60 min) and higher enzyme concentration (1.5 w/w%). The desirability function of the combined conditions for juice clarification is 0.704. For product development of wild watermelon juices, the optimum parameters would be useful in juice clarification processes to obtain the best quality of the juices. It is essential that future studies be conducted for improved clarification of the juice. It is also necessary to improve the sensory quality of the juice to make it more palatable for better consumer acceptance.
Footnotes
ACKNOWLEDGEMENTS
The authors would like to thank the Department of Life and Consumer Sciences, University of South Africa for their support.
DECLARATION OF CONFLICTING INTERESTS
The author(s) declared no potential conflicts of interest with respect to the research, authorship, and/or publication of this article.
FUNDING
The author(s) received no financial support for the research, authorship, and/or publication of this article.