
Abstract
Avalanching plays a crucial role in granular materials dynamics, in particular in the evolution of the shape of the leeward side of sand dunes. This paper presents a physically-based mathematical model capable of reproducing the kinematic evolution of the surface of sand piles and to obtain eventually the stationary configurations, in the presence of external sources as well. Simulation results with different boundary conditions and geometries are reported in order to show the high flexibility of the model. The model is also validated by means of comparison with the experimental results of different authors.
1. Introduction
One of the crucial phenomena that contributes to the evolution of sand piles is the formation of avalanches in regions with steep slopes. In fact, for instance, the sand that is transported by the wind in dunes accumulates and then spontaneously slips when the steepest slope exceeds the angle of repose, which in general depends on the properties of the media, firstly grain size and density, and in the case of dry sand it is close to 32°. Experimental approaches are useful to obtain an estimation of the angle of repose, but they are hard to be used in complex processes involving the interaction of wind with the substratum, for instance, to evaluate the evolution of the sand bed level, or of the dune eventually interacting with other structures.
Such mathematical models are also of interest for other similar natural phenomena, such as snow avalanches, landslides, debris accumulation, scour and sediment transport, and also in industrial applications, for instance in the stocking processes of many different materials including rocks, seeds, and all media composed of discrete particles.
Our interest in understanding and simulating the dynamics of sand slides is part of a wider effort consisting in deducing a complete model that also includes sand erosion, transport, and sedimentation [1]. In such a model, sand deposition and avalanches together with sand erosion contribute to determining the free boundary between the sand bed and the multiphase flow composed of sand grains transported by the wind, which includes the saltation layer in the region closer to the sand bed. In this framework, the specific need addressed in this article is to deduce a sand avalanche model that is able to describe the evolution of the sand bed in a simultaneously accurate, simple, and fast way. The final engineering aim of the complete model is then to devise and numerically test the efficacy of protection measures for human infrastructure in arid environments, such as roads and railways, pipelines, industrial facilities, farmland, towns, and buildings.
Detailed avalanche models have been developed in the past, starting from the pioneering papers by Savage and Hutter [2], in which hydrodynamical models, based on Saint-Venant equations, were originally proposed. They started from the incompressibility condition and momentum conservation equations in the flowing layer and then integrated them over the thickness of the rolling layer, not considering erosion and deposition. This gap was then filled, for instance, by Douady et al. [3], Khakhar et al. [4], and Gray [5]. A detailed analytical study of Savage and Hutter’s model has been performed by Colombo et al. [6]
A variational approach has also been suggested. Aronsson et al. [7] introduced the p -Laplacian operator in order to model a non-homogeneous superficial diffusion. Prigozhin [8] developed a variational model based on mass balance for the sand pile and assuming the surface flow is directed down the path of steepest descent subject to a slope constraint. Prigozhin and Zaltzman [9] allowed the coefficient in front of the gradient of the sand pile to vanish if the slope is below a threshold. Other successful approaches are based on the theory of self-organized criticality [10] and cellular automata [11].
Bouchaud et al. [12] paved the way to the so-called two-layer models. This modeling approach starts from the assumption that sand piles can be divided into a static and a rolling layer and include source terms as well. The model consequently uses two variables, the local height of the static layer and the local density (or height) of the rolling layer, linked by an exchange term that allows static grains to start moving. The drift downhill velocity of the rolling grains is considered constant. A modified version of the two-layer model has been proposed by de Gennes and coauthors [13–16]. Prigozhin and Zaltzman [9] overcame the constant velocity hypothesis by assuming a proportionality with the gradient of the height of the sand pile. In the models proposed by Hadeler and Kuttler [17, 18], velocity is usually constant, though it is mentioned that it might depend on the slope (see, for instance, [19, 20]). An exchange term proportional to the difference between the slope of the sand bed and the angle of repose governs the transfer of sand between the static and the rolling layer.
A detailed analytical study of this type of models has been performed by Cannarsa and coworkers [21–24] for different boundary conditions, whereas Falcone and Finzi Vita [25–27] also focused on the proper numerical integration method.
In spite of the fact that two-layer models can describe several situations well, they present some drawbacks such as the presence of artifacts when the boundary of the domain changes type (from a wall to an open end) [23, 26], the difficulty in controlling what happens at the boundary due to the hyperbolic character of the equations, and the formation of artificial valleys on the top of the sand pile due to the discontinuity of downhill velocities on the two slopes, or in situations in which the maximum height of the sand pile should be reached close to a wall [28].
A further important problem occurs when applying the model to configurations with supercritical initial profiles, that is when the sand pile initially has a portion of the slope with an angle larger than the angle of repose, as in the experiments in [29–36], where the lateral surfaces of the sand pile are vertical and there is no external sand flux. In this case, in general, it is hard to identify the proper initial conditions to be joined to the two-layer models. Moreover, it can be shown that the evolution and the final configuration crucially depend on how the initial profile is divided into a static and a rolling part. Paradoxically, if it is assumed that at the beginning all the sand is static, as it would look natural to do, then the system would not evolve at all.
In this work, we deduce a simple model, that for sake of convenience we will call Degenerate Parabolic Sliding Model and shorten as DPSM, for the height of the sand pile deduced on the basis of a mass balance equation under the assumption that the thickness of the creep layer is small and that sand grains in it flow down the direction of the steepest descent due to gravity. We show that the stationary configurations satisfy the eikonal equation, as classically known and previously found in other two-layer models (see [17]). The model is flexible with respect to boundary conditions and influx terms and is experimentally validated against column collapse results in [29, 30, 35, 36].
This paper is organized as follows. In Section 2, we derive the model based on a suitable physically-based closure of the mass balance equation. Discretization and numerical aspects are dealt with in Section 3, where the meaning of the model is also described from a discrete point of view. Then the results from the numerical simulation of the degenerate parabolic sliding model are reported and validated against several experimental results in Section 4. In Section 5 we draw some conclusions.
2. The degenerate parabolic sliding model
Consider a control volume

where

where

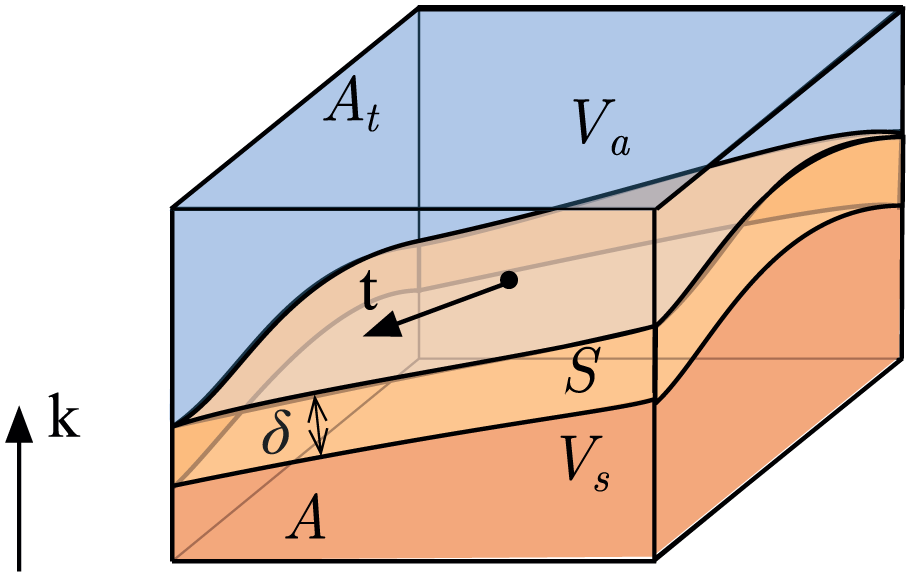
Definition of the domains and the subdomains
Evolution of the sand pile profile on an open table due to a constant source q = 0.05 located in the sub-intervals
Even if in the following we will assume that some sand may be transported through the boundary of
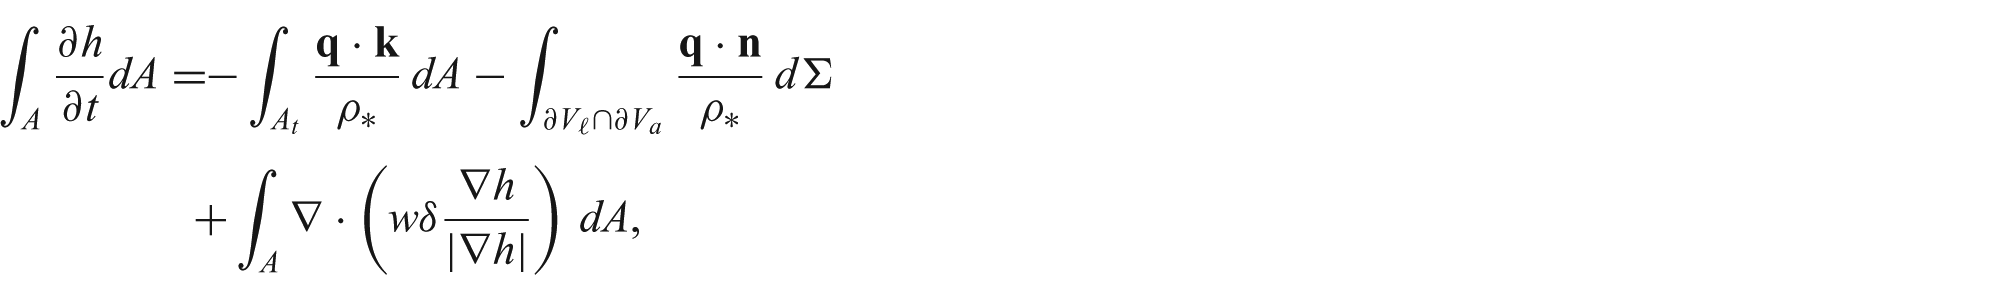
Balance of mass states that the mass of the sand contained in the volume can change due to the flux of sand through the boundary. In order to evaluate it we distinguish between the flux in the creep layer and that coming through the air, which can be written as
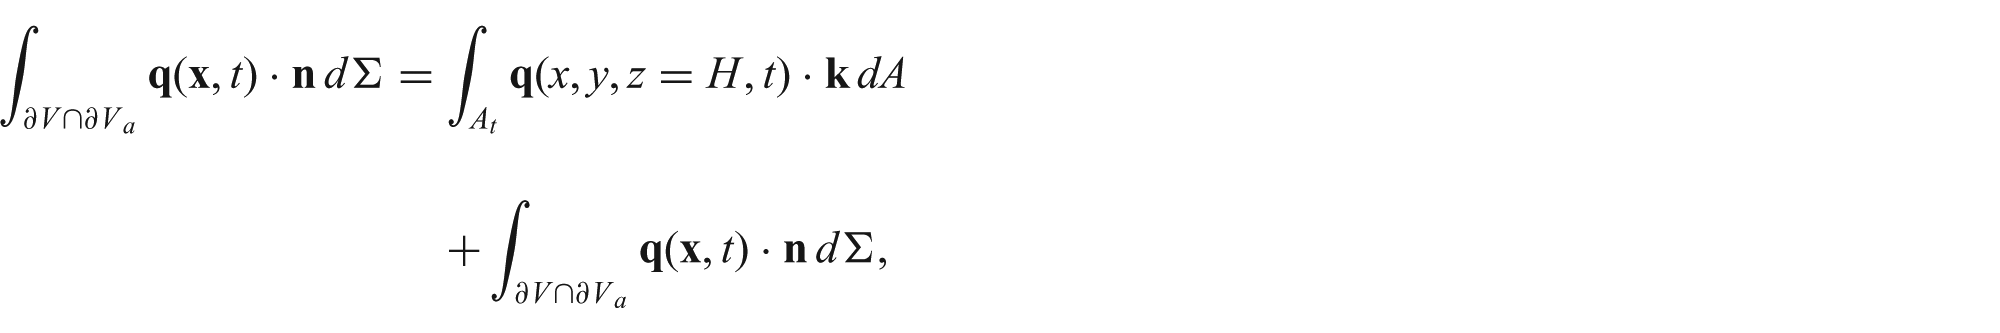
where the first term is the outflux through the top of the cylinder and the second is that through the lateral surface.
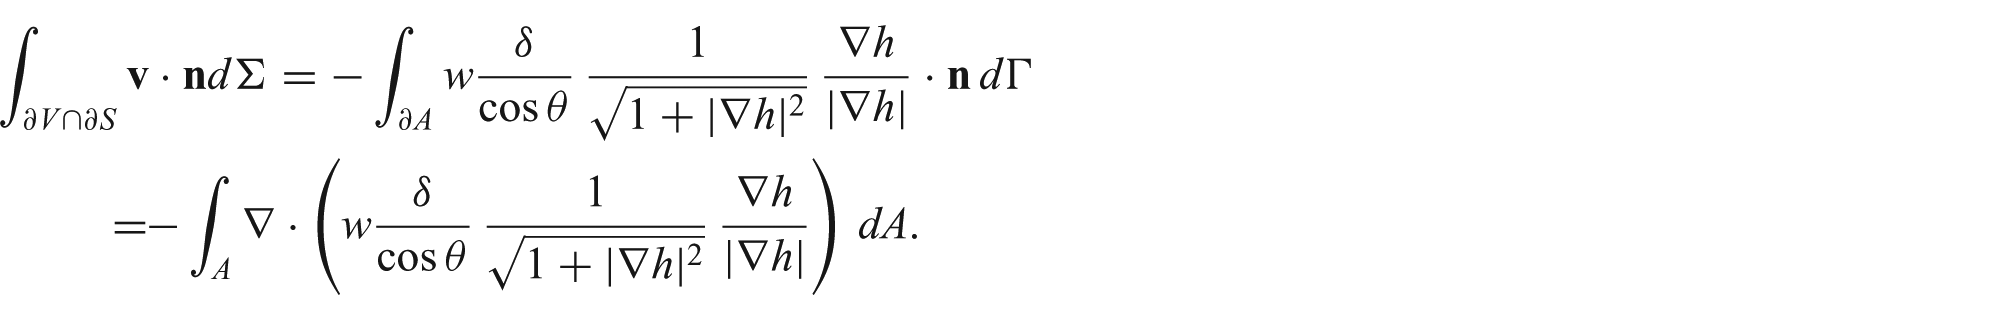
The main hypothesis to evaluate the contribution due to the motion of the sand grains in the creep layer S is that sand grains move in the direction

where the speed w will be then identified as the limit velocity of a body sliding down a slope under the action of gravity, friction, and a drag force taken to be proportional to its speed, due to the impact with the other grains of the sand bed. This means that

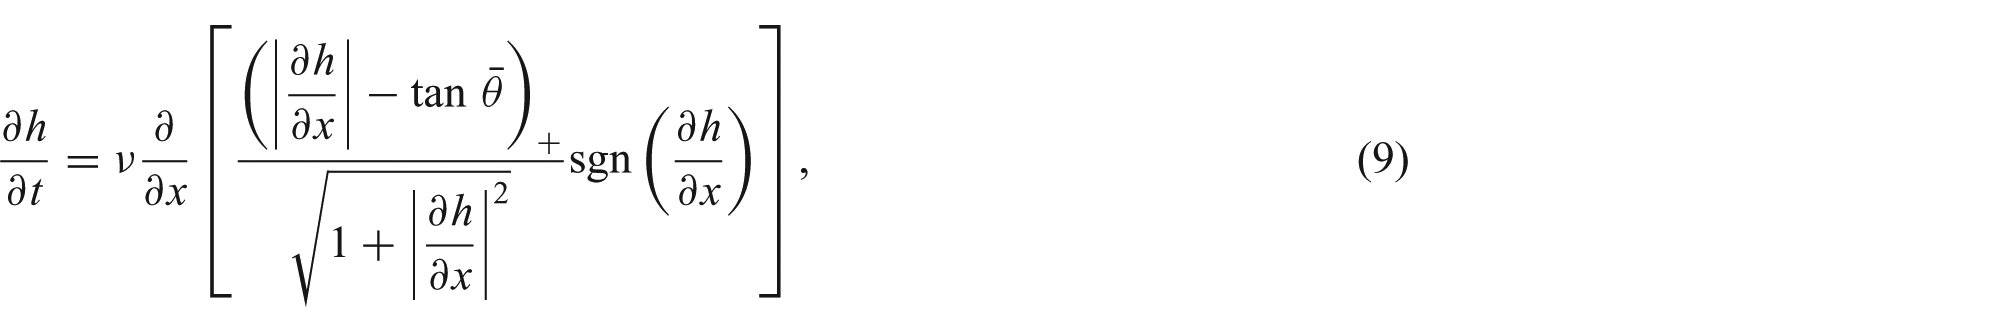
Coming to the sliding speed w, simplifying consistently the microscopic structure of the sand bed, by a simple body diagram on the single sand grain we assume that, on average, motion is triggered if the component of the gravitational force along the surface (

where
Equation (3) states, for instance, that if the local slope is subcritical (i.e. with an angle that is smaller than the angle of repose), then sand grains will not move. In the supercritical case (i.e. when the angle of the slope is larger than the angle of repose) the speed increases with the slope. The speed increases when the energy loss mechanisms due to the interactions among the grains, modeled through w, decreases.
An alternative way to obtain the sliding speed is to describe the motion in the creep layer as the flow of a Bingham fluid. In this case the bilinear behaviour expressed in Eq. (3) is replaced by a parabolic behaviour above a threshold value related to the yield stress. More in general, using a Herschel-Bulkley fluid with a power γ would lead to a relation with a positive part term elevated to the power
Taking into account of the relationship between θ and

Computing then the flux contribution (1), one has

where using the same argument used for the evaluation of the sand flux, the density of the grains was approximated with the close packing density

and, therefore,
Mass balance then leads to
that by the usual continuum mechanics methods can be localized to

where ν = Wδ and
The evolution equation for the height of the sand pile is then a parabolic equation that may degenerate if the maximum slope in a point forms an angle with the horizontal plane that is smaller than the angle of repose. As done before, in the following we will refer to this point (or subregion) as subcritical, whereas the complementary situation will be called supercritical. In the following, we will also extend these definitions to the entire sand pile, calling subcritical distribution of sand a configuration in which every point is subcritical. In this case, the evolution equation reduces simply to

We use the term supercritical distributions of sand for those cases characterized by the presence of regions where the situation is supercritical. In supercritical regions, one has the parabolic equation

degenerating on the border of the time-dependent subdomain.
Looking for stationary configurations, it can be trivially observed that any
One can then define the critical (or limit) stationary solution as the one satisfying exactly the eikonal equation

everywhere. It is well known (see, for instance, Hadeler and Kuttler [17]) that the solutions of the eikonal equations are related to the shape of the larger sand pile that can be obtained by pouring sand on an open plate. Thus, for instance, one has a cone if the plate is a circle and a pyramid if the plate is a regular polygon.
3. Finite difference discretization
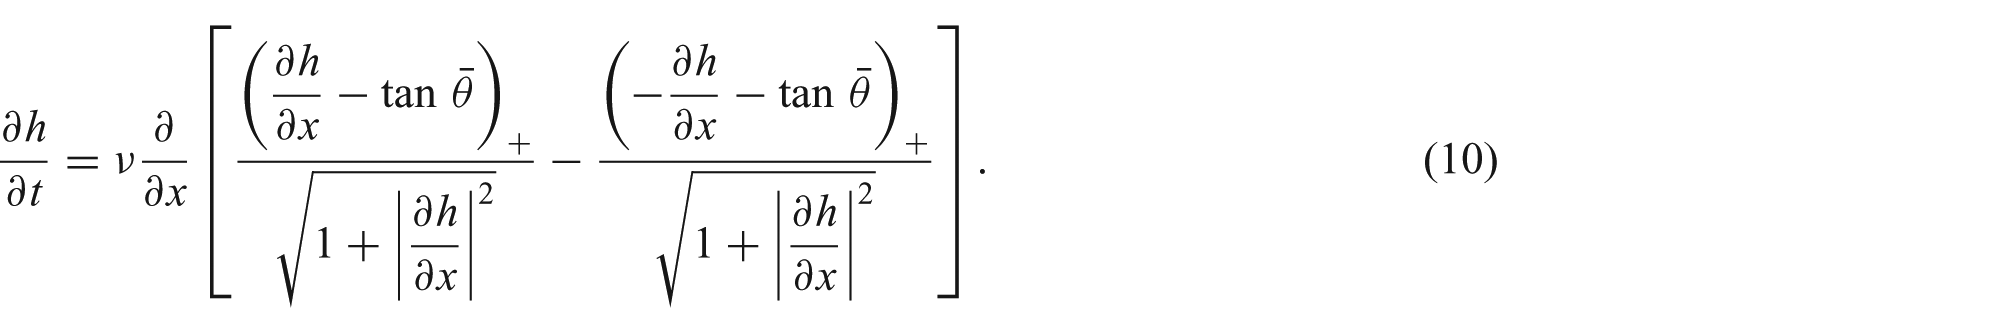
In this section, we discretize Equation (6) and we will discuss the resulting discrete model showing that it has a specific physical interpretation. For the sake of clarity, we consider the one-dimensional version of Equation (6) without an external source
where
The last term inside the square brackets gives the direction of flux and can be replaced by
Considering a uniform spatial discretization, calling
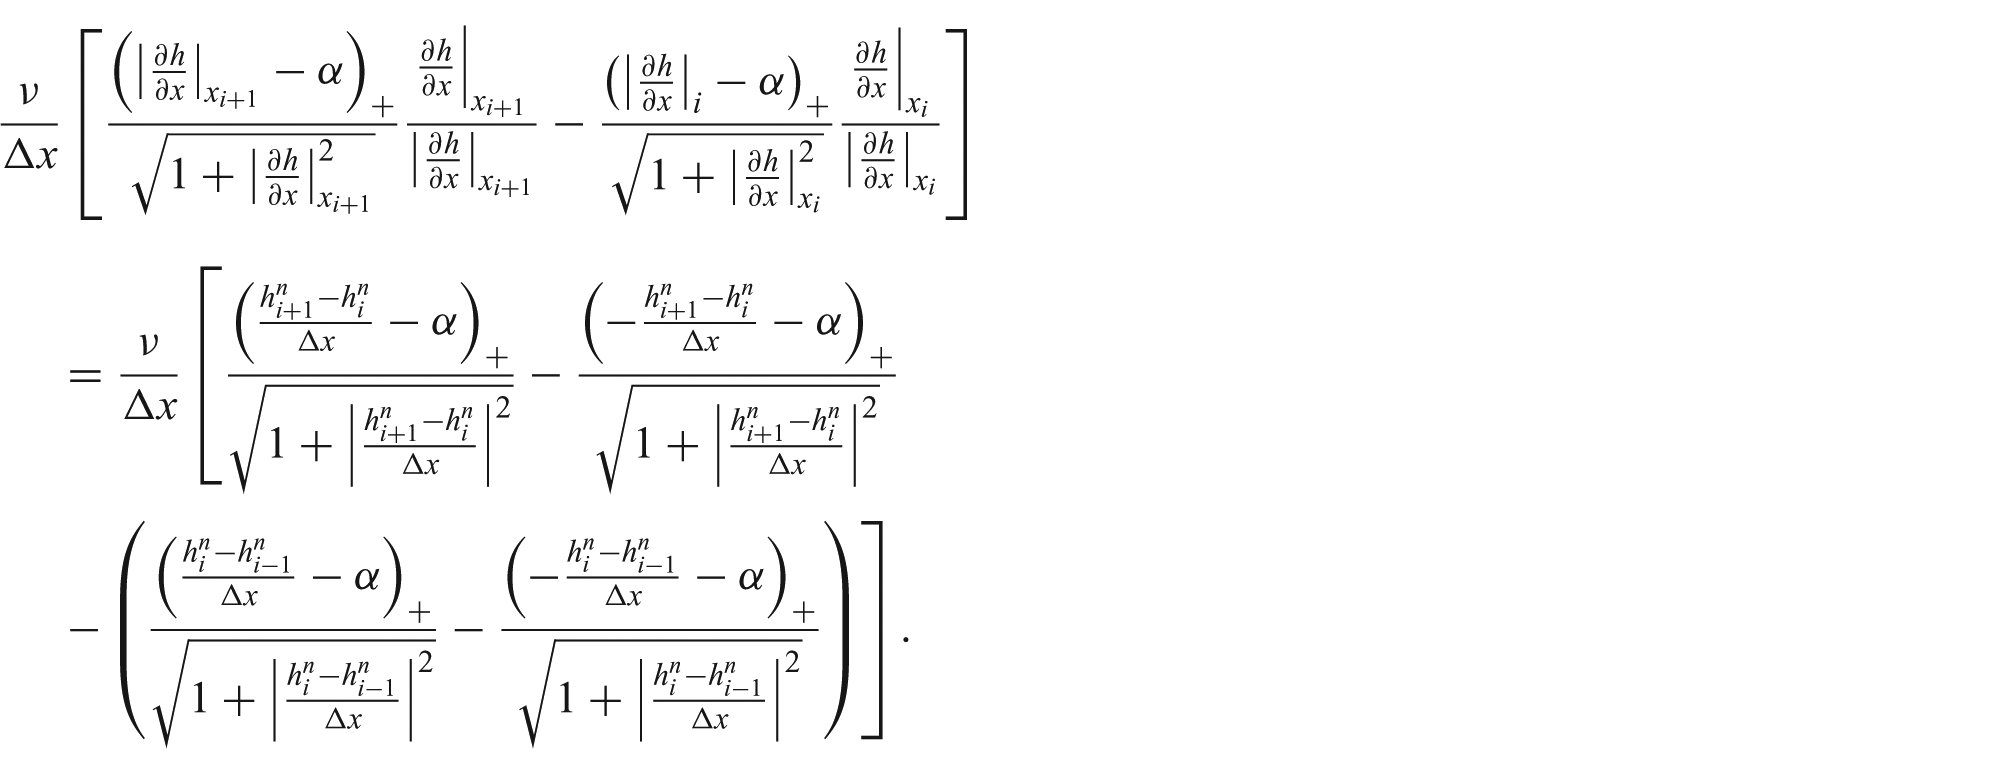
Rearranging terms and introducing time discretization, Equation (10) becomes
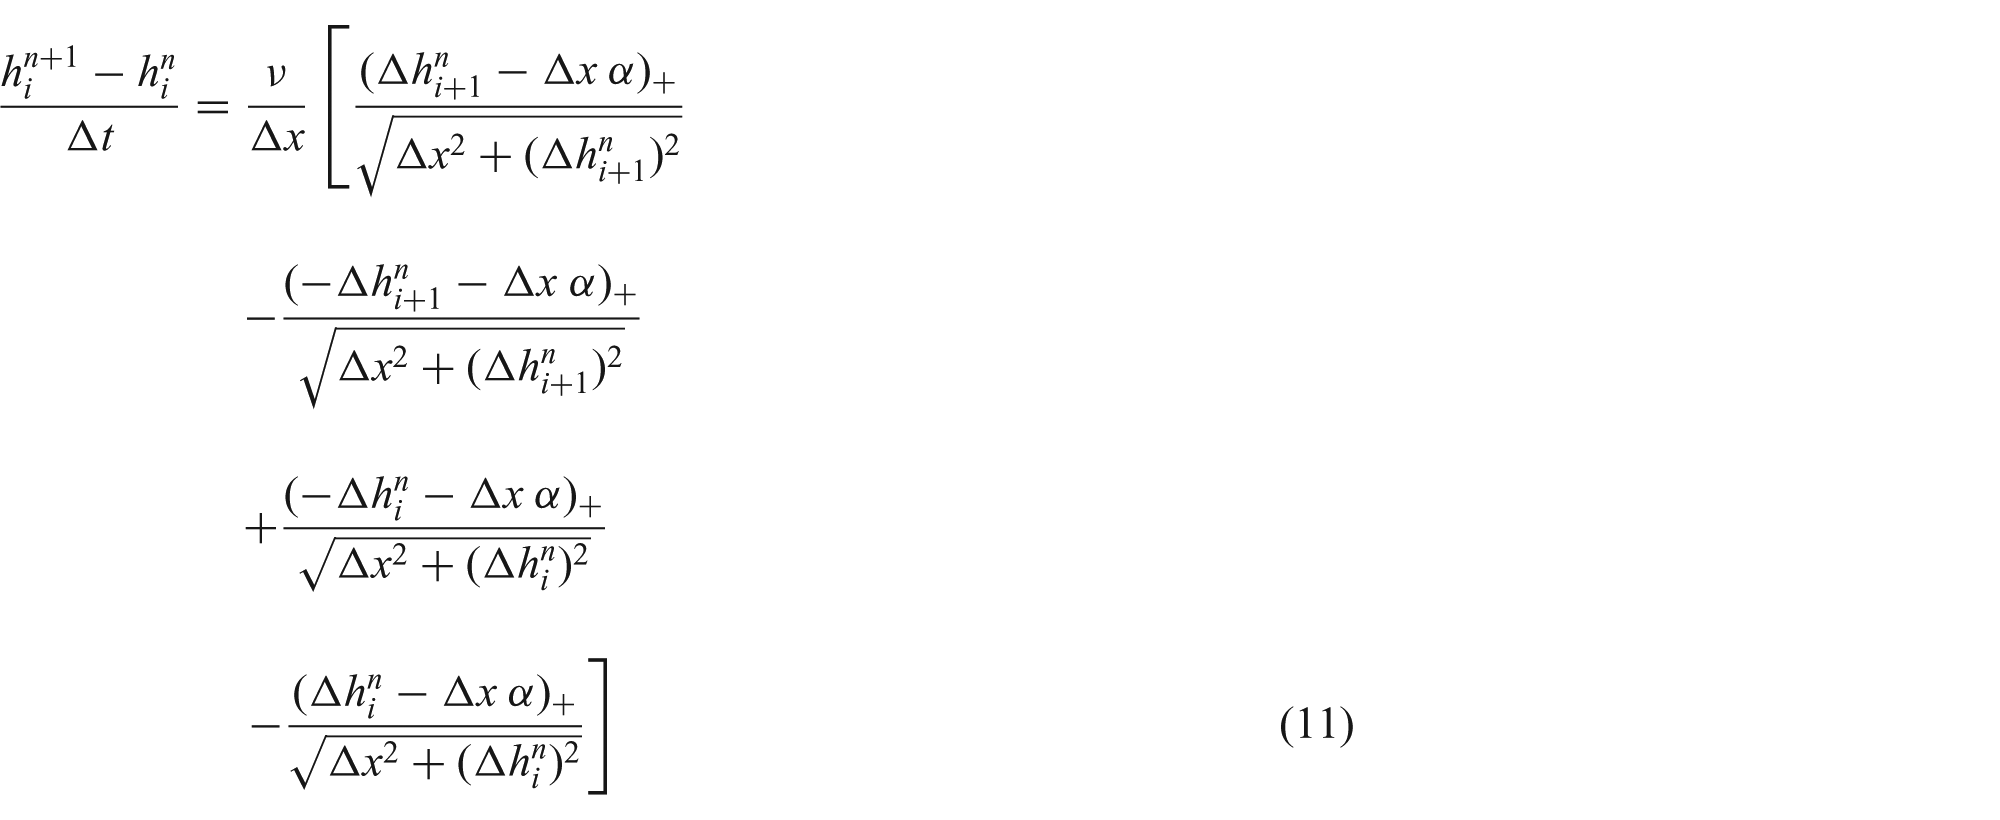
where
In the general case, in which the i -th node has
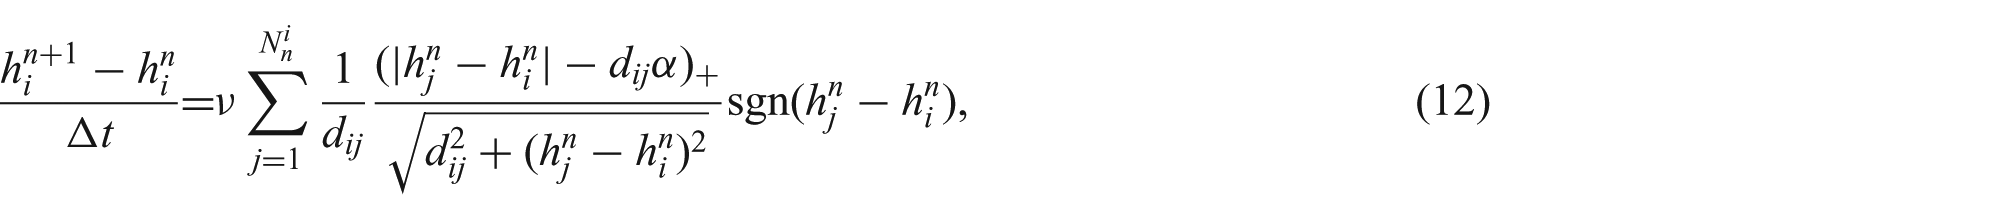
where
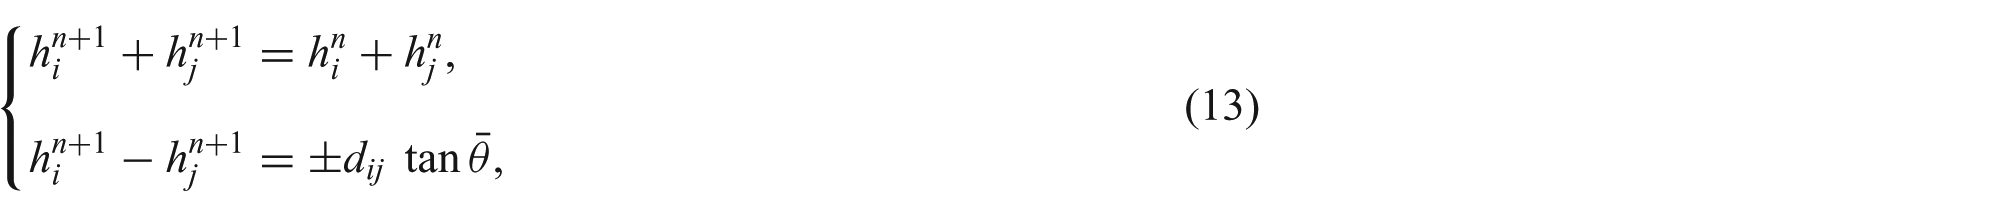
whose solution is
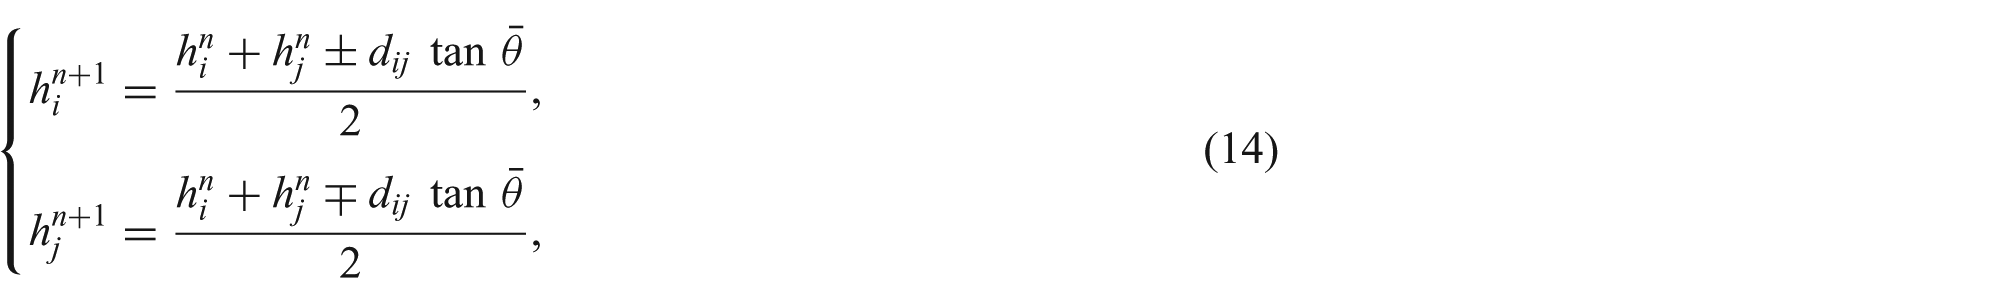
which can be seen as the stationary solution of Equation (12) for the couple i –j.
In next section we apply this discretization scheme using a uniform Cartesian grid. Each node can exchange mass with all the nodes sharing with it a face of the grid. Actually, the scheme can be used with others grid as well, as it is based on mass exchange between neighbours. For stabilization, the mass exchange allowed in each iterative step is bounded as described in [37].
4. Numerical simulations
In this section, the degenerate parabolic model (6) is applied in one- and two-dimensional domains with different boundary conditions in order to show its robustness. Two types of boundaries can be conceived: an open end

The latter refers to the case in which the domain ends with a wall. In this case, the proper boundary condition is

or

This boundary condition can be satisfied either when

In the following, two main problems will be examined in detail. In the first, discussed in this section, mass is supplied in some subregions of a domain that is surrounded either by open boundaries, or by walls, or by a combination of them. In the second problem, discussed in the following section, evolution starts from a pile of sand that is supercritical somewhere and there is no mass supply. Specifically, we will start from a cylindrical pile of sand redistributing its mass on an infinite plane in order to compare the outcome of the degenerate parabolic model with existing experimental results.
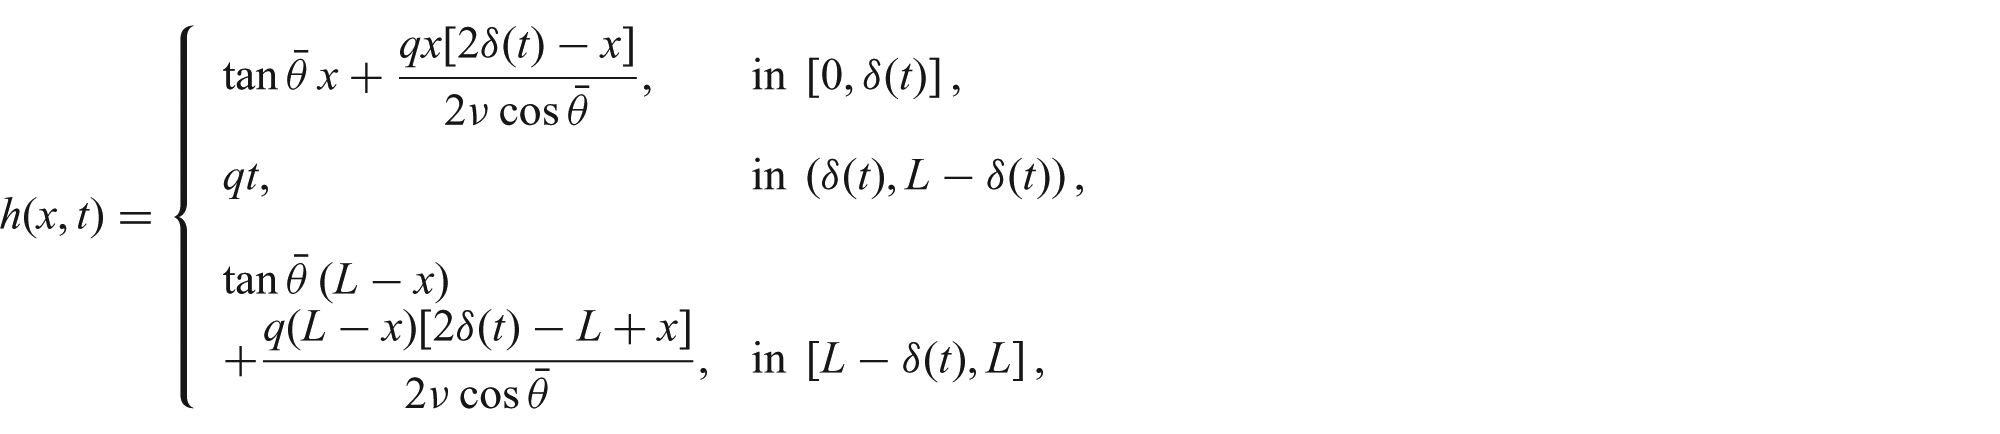
Before going to the simulations, in order to understand the structure of the expected solution, let us consider the case in which the mass supply q is constant everywhere. If there are walls all around the domain, then the solution is trivially a constant h rising at a velocity q. In the opposite case, if all the borders are open, one can look for an approximate stationary solution when q ≪ ν∕L where L is the characteristic dimension of the domain. Consider first the one-dimensional problem in the interval [0,L]. The solution vanishes on the border x=0 and then increases. This suggests we should look for a solution in [0,L] of the type

where distances are made dimensionless with L. Hence, in dimensional terms,

and symmetrically

Hence, the steady state is locally concave with an almost triangular shape.
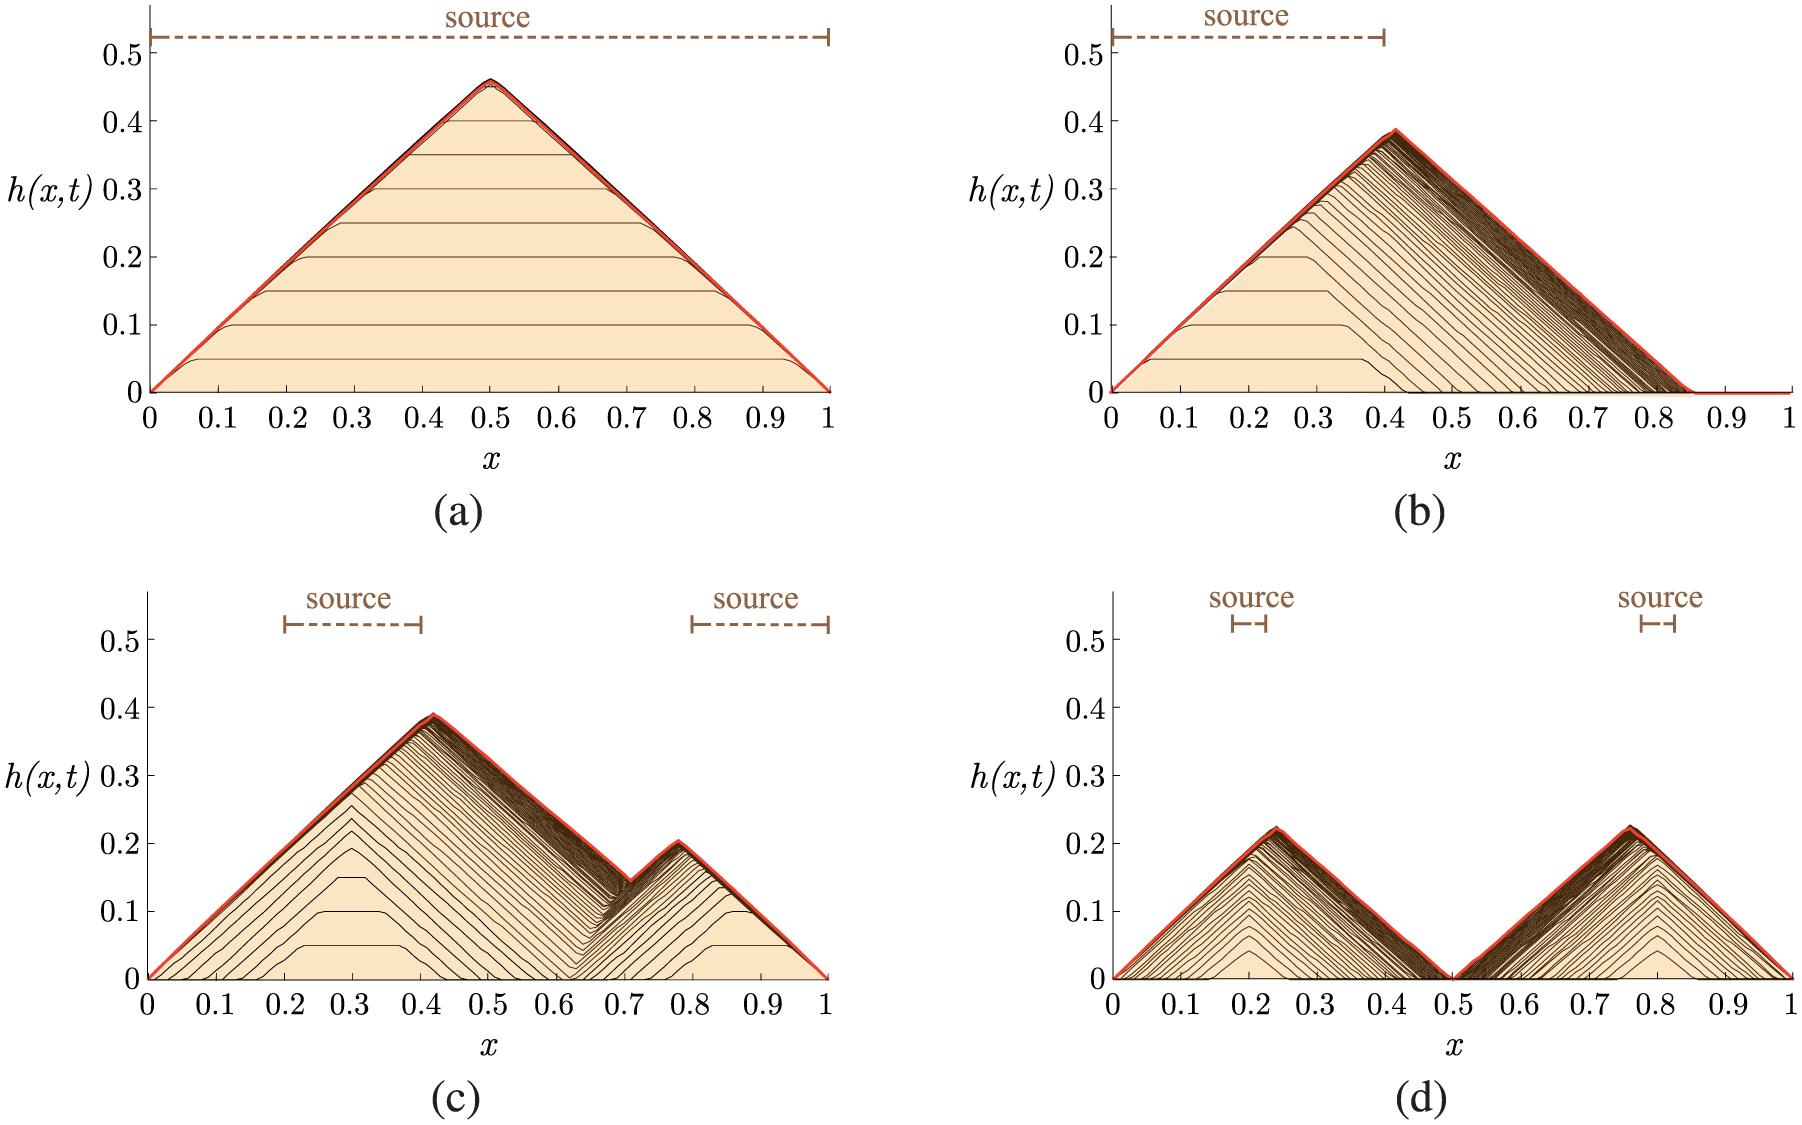
The above discussion also gives an idea of how the solution tends to this stationary state (see Figure 3(a)). In fact, in the central region the sand pile grows with a flat profile rising with velocity q, then growing in an almost trapezoidal shape
with δ(t) given by

until

Thereafter, the trapezoidal shape takes the almost triangular shape in Equations (15) and (16).
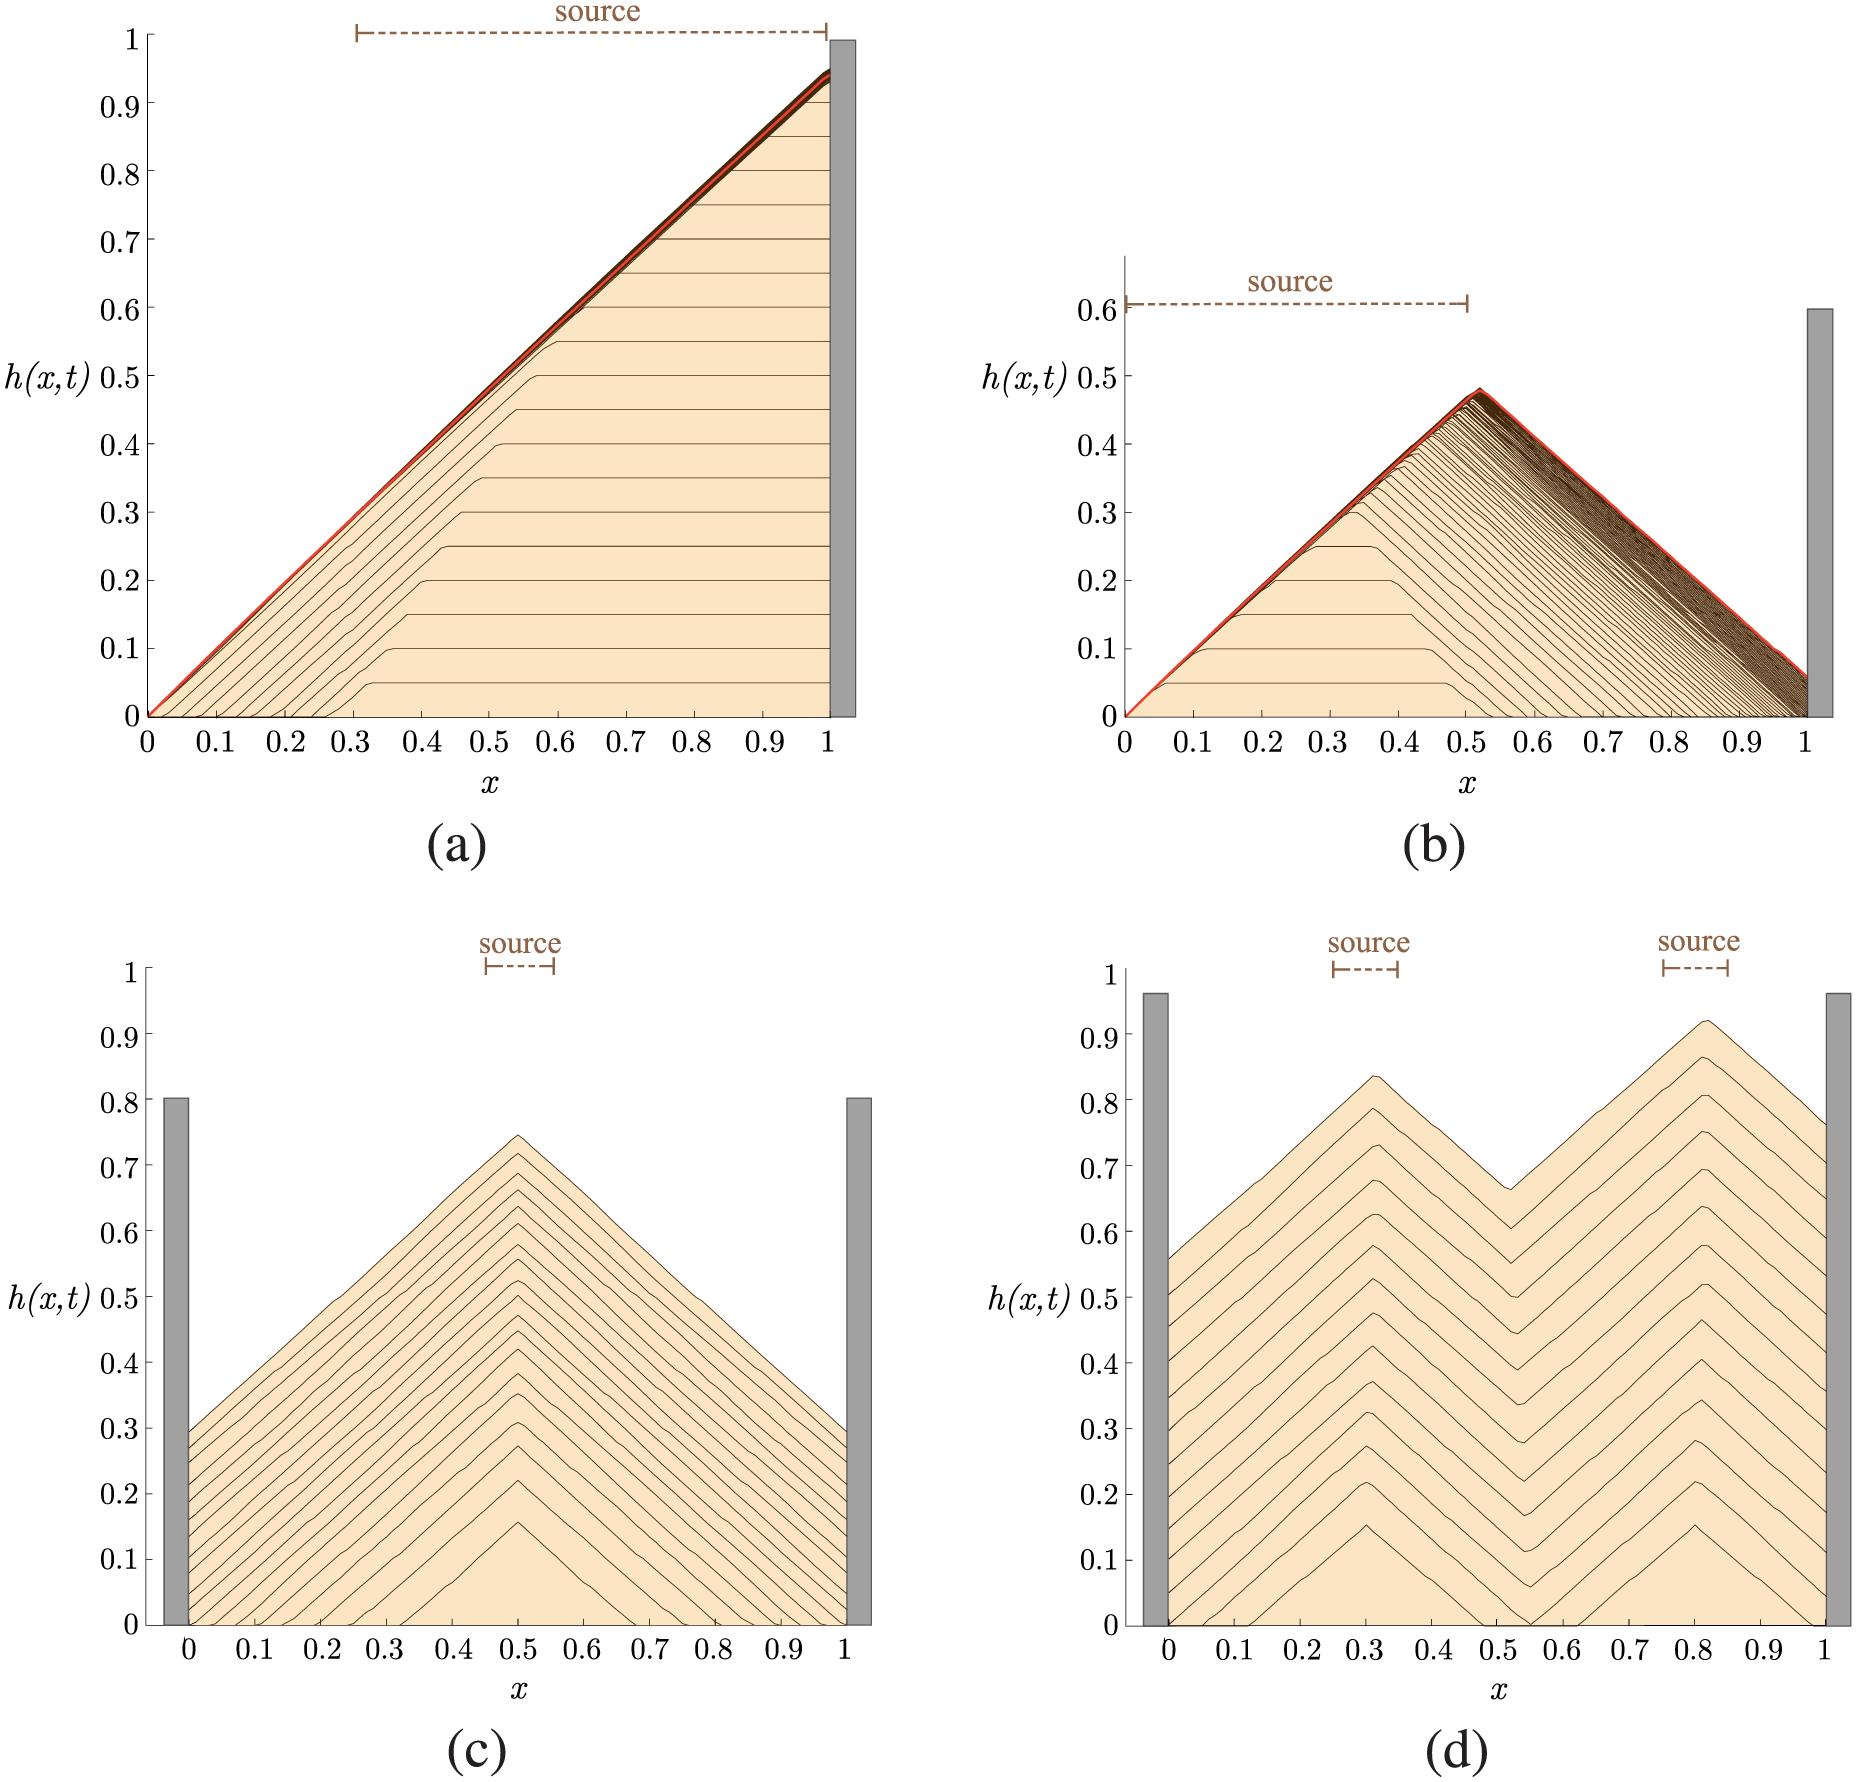
Evolution of the sand pile profile on a table in the presence of a wall. In (a,b), there is an open end on the left and a wall on the right. In (c,d), there are walls on both sides. Sand is constantly poured with q = 0.05 in the sub-intervals
Note that when the input interval is not the entire domain, the peak does not always correspond to the center of the location of the source term as observed in [16]. In fact, focusing for instance on Figure 3(b), the profile starts having a trapezoidal shape with the oblique sides having an angle equal to the angle of repose (fixed here to 45° for easier comparison with the results of the simulations obtained using a two-layer model [26]). One of the sides ends with the end of the open table and it is fixed. This means that after some time the shape becomes an isosceles triangle. The tip gradually moves to the right because part of the sand poured on the top of the triangle moves to the left side and drops down the plate while the part moving on the right side remains on the table. This continues until the tip reaches the end of the interval of the source because at this point all the sand is poured on the left side of the triangle dropping down the plate. Similar dynamics hold for Figure 3(c,d). In all of them, the coefficient ν is normalized to 1 corresponding to a suitable rescaling of time. The simulation set-ups were chosen to compare the results with those obtained by Falcone and Finzi Vita [26] using the two-layer model. In this comparison the reader must be aware that our h should be compared with the sum of the resting and the motile layer. If the former is very similar to our results (especially the minimal solution of the two-layer model), the latter has sometimes unphysical behaviors.
With respect to Figure 3, in Figure 4(a,b) there is a wall at the right extremum of the interval. In Figure 4(a), the profile starts off flat close to the wall having an oblique slope close to the other extremum of the source domain. In Figure 4(b) the evolution is similar to the case in Figure 3(b), but for the fact that when the sand reaches the wall it stops and does not drop down the plate. However, no further sand accumulates in the region [0.5, 1] after the tip of the triangle has reached x = 0.5 because all the sand flows to the left. We note that, as shown in the careful numerical results presented in [25], in two-layer models the height of the sand pile on the right of the input interval continues to grow (see their Figure 1).
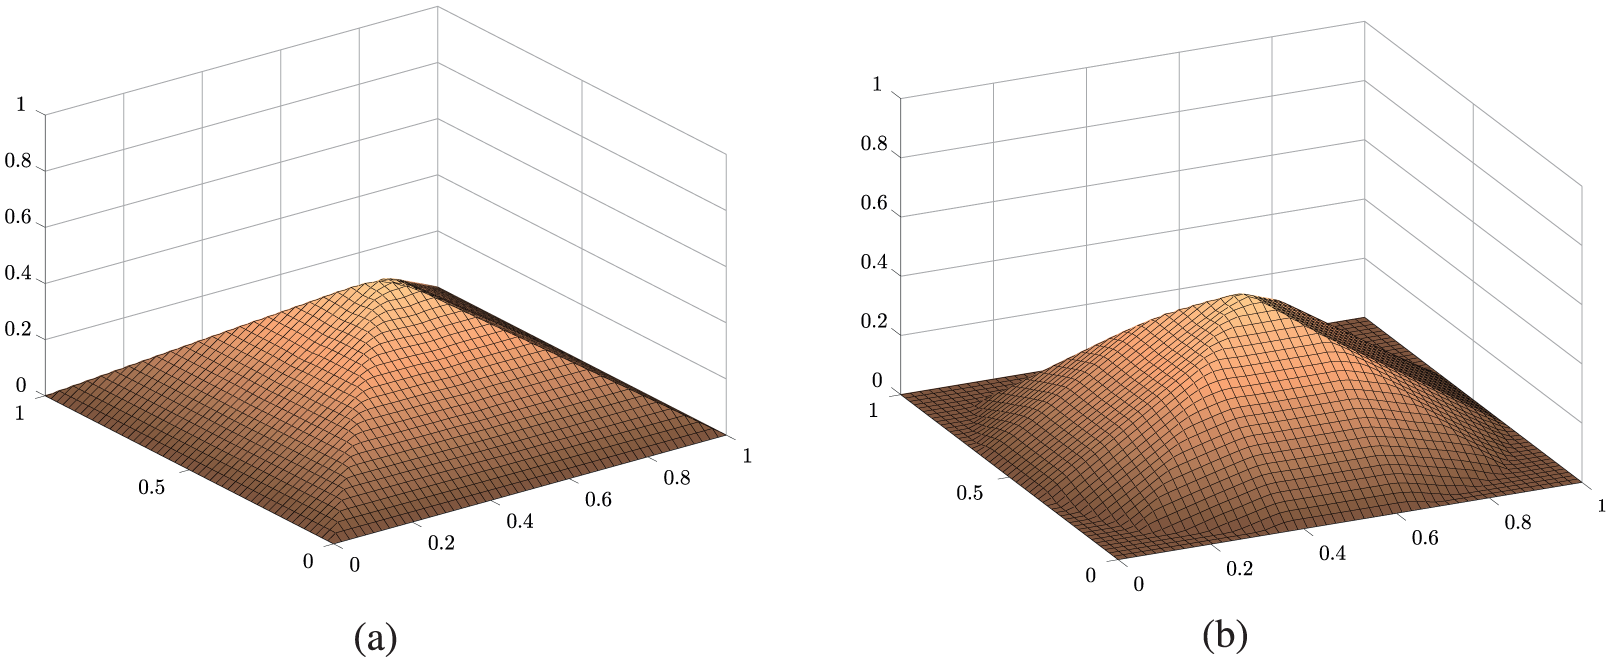
Stationary profile of a sand pile on a square open table due to a constant source q∕ν = 0.5
located in the subdomains: (a)
In Figure 4(c,d) there are walls on both sides, which implies that there are no stationary solutions, but the “container” gradually fills. In fact, in the literature, these correspond to silo filling problems in one dimension. We note that for the set-up of Figure 4(c), Finzi Vita [28] noted an unphysical “small depression in the central region corresponding to the source support,” which is not present here. Solutions of the two-layer models, though supported by analytical results, are smoother then expected. Conversely, the model presented here has no problem in generating and handling the well-known formation of corners.
In Figures 5 and 6, two-dimensional simulation results are shown in different domain configurations. In Figure 5(a), the classical pyramidal shape for the open table problem is obtained when sand is poured everywhere, while in Figure 5(b) it is only poured in a central square region, so that only the central portion of the sides of the boundaries is reached by sand (and the slopes flattens up) and not the corners.
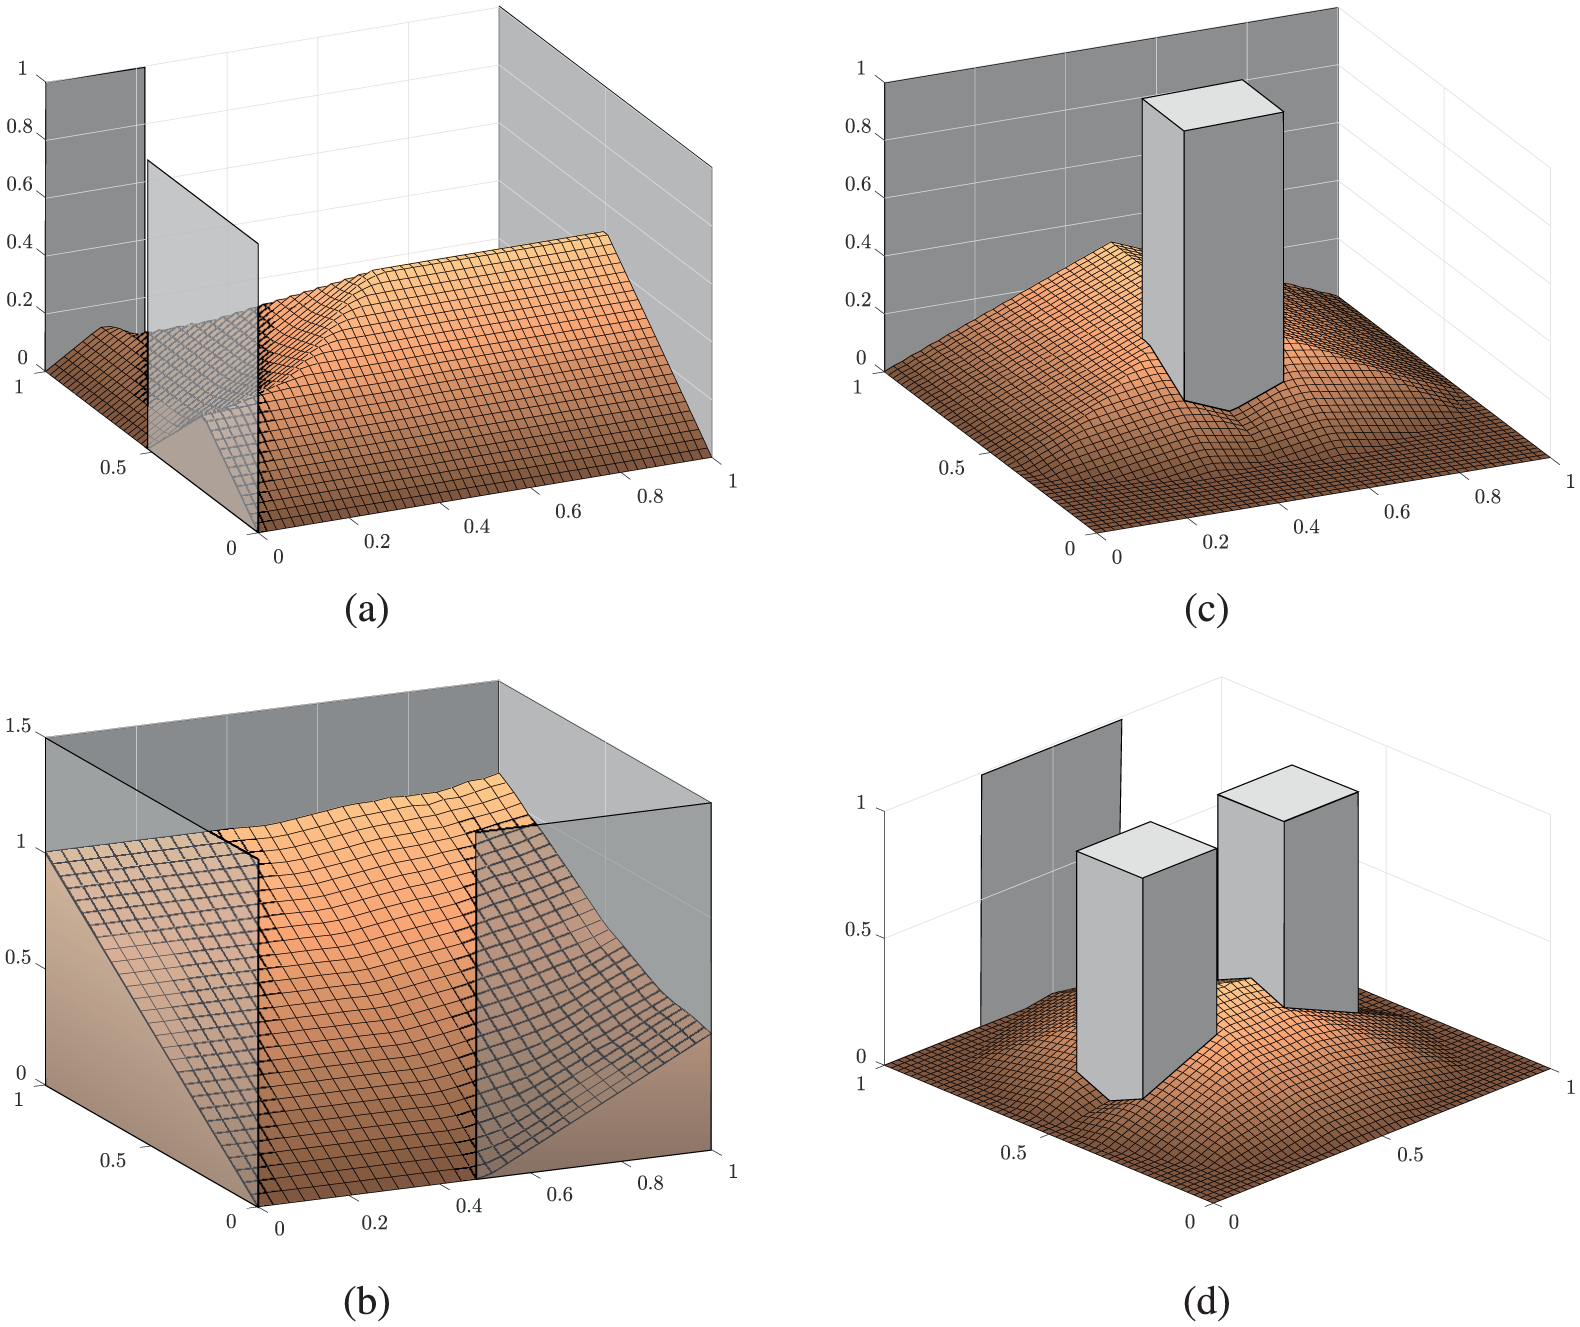
Two-dimensional simulations in the presence of walls and obstacles with constant source q∕ν = 0.5 (a,c), q∕ν = 0.05 (b), and q∕ν = 0.1
(d) in the subdomains: (a, b)
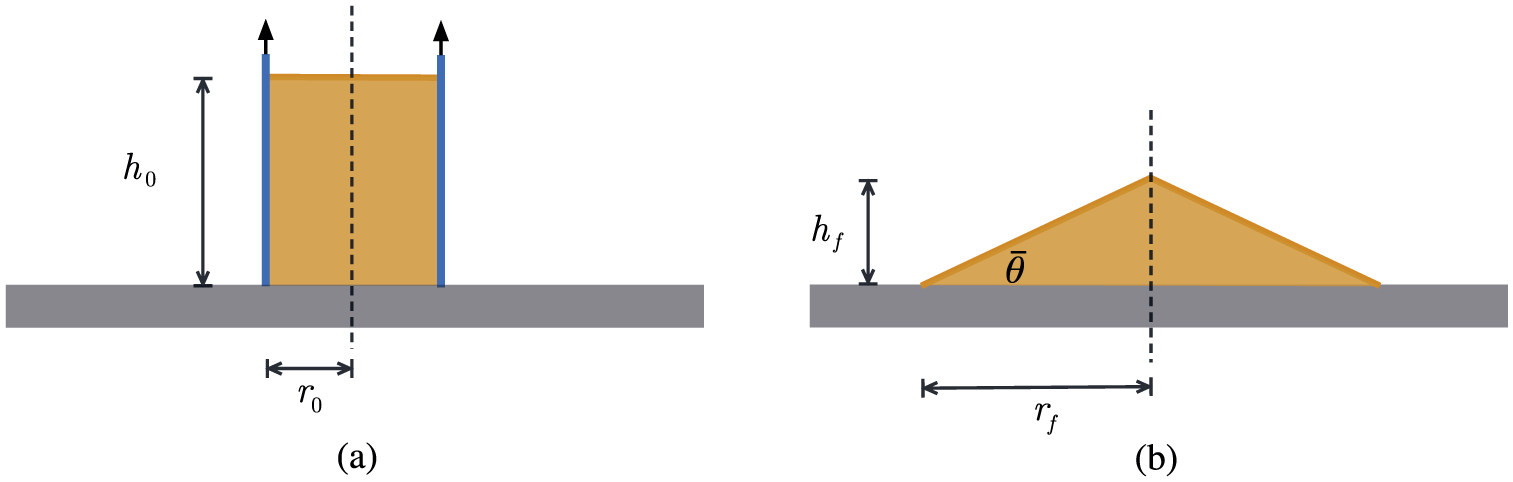
Set up of the experiments (a) initial state; (b) final state.
As in the one-dimensional cases, the results of the simulations can be compared with those obtained using the two-layer models in [23, 25], always recalling that the height of the pile is the sum of the heights of the static and the rolling layers in two-layer models. In particular, the final pile surfaces of Figure 5 can be compared with those in [25], while results in Figure 6(a,b) can be compared with those obtained in [28]. We note that in this case the solution of the two-layer model presents peaks for the rolling layer, and therefore for the total height of the sand pile, at the extrema of the walls where there is a switch between a Dirichlet and a Neumann boundary condition (see their Figures 3–5). Such an undesired effect is not produced by the DPSM proposed here.
Figure 6 (c,d) show the behavior of the DPSM in more complex configurations. We note in particular the formation of discontinuities in the slope on the side of the column opposite to the one where sand is poured. In fact, there the two flows going around the opposite sides of the column(s) meet with a critical slope.
5. Experimental validation: axisymmetric dam-break granular flows
In this section, we validate the mathematical model through a comparison with experimental results from different authors. The experiment performed by Lajeunesse et al. [29], Lube et al. [30], Thompson and Huppert [35], and Roche et al. [36] consists of filling a cylindrical tube of radius
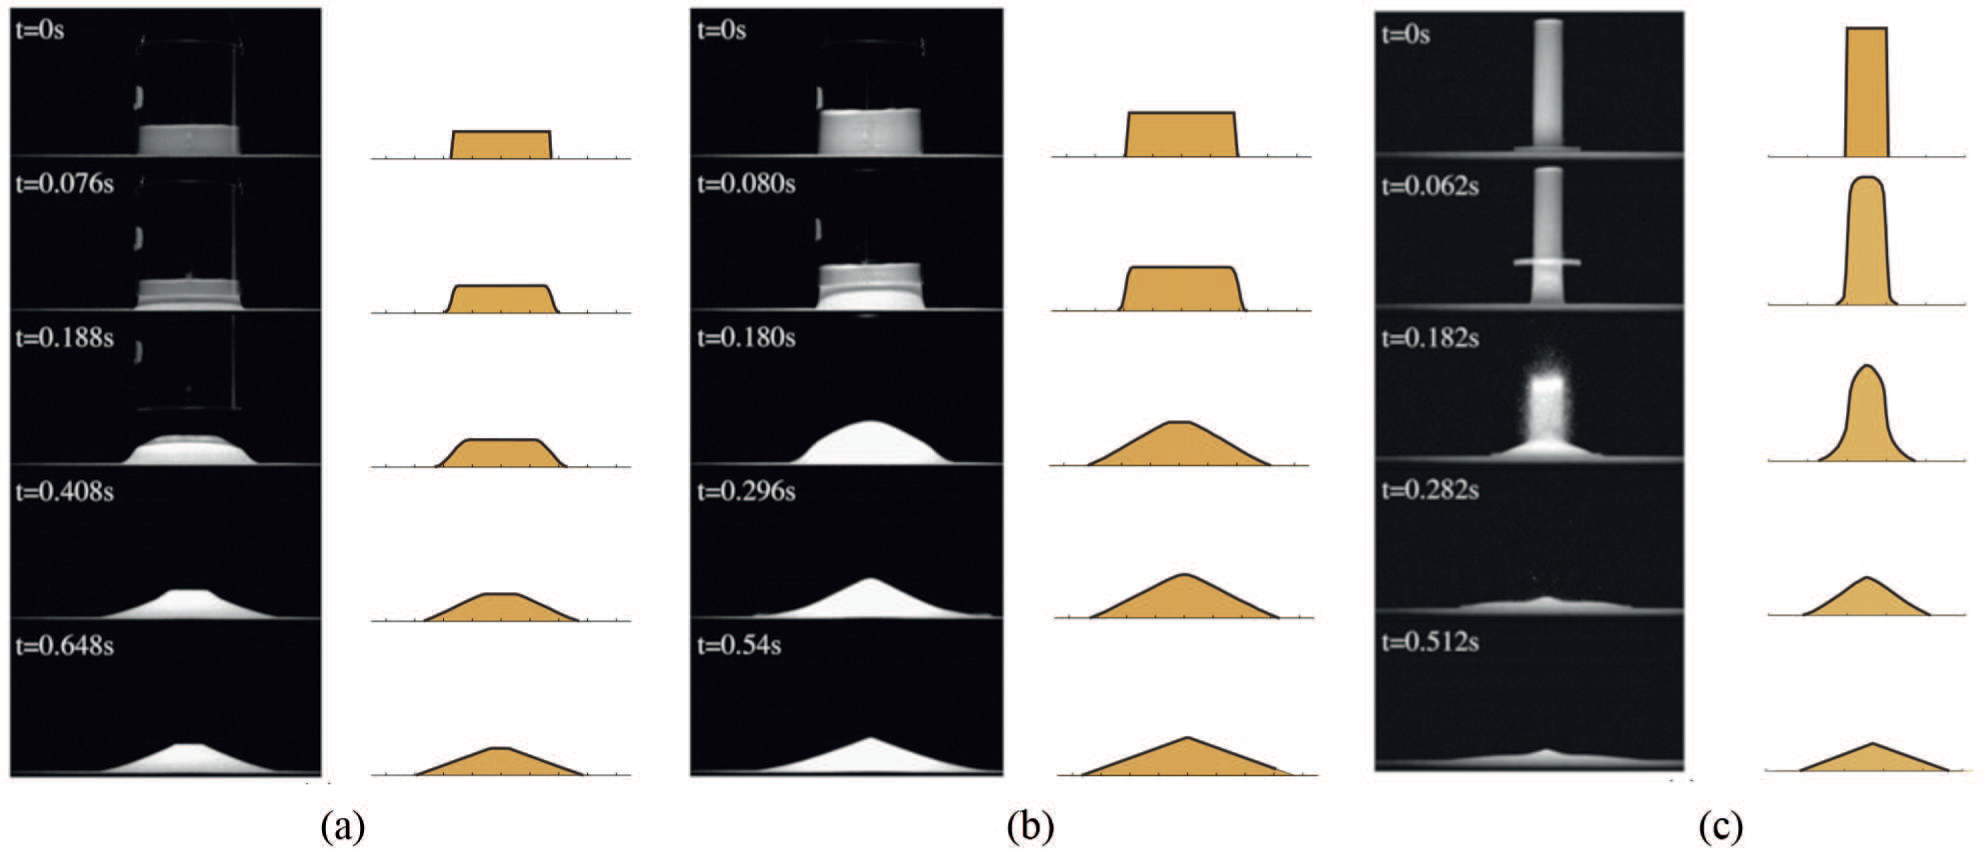
Comparison of the evolution of dam-break between experiments from Lajeunesse et al. [27] (left column) and simulations obtained on the basis of DPSM (right column): (a) a = 0.56 giving rise to a truncated cone; (b) a = 0.8 giving rise to a cone, (c) a = 5.4 with strong inertial effect not included in the DPSM.
Lajeunesse et al. [29] discussed the results as a function of the aspect ratio of the column, defined as
The critical value 0.74 is not surprising. In fact, a cylinder with aspect ratio equal to 0.74 has the same volume as a cone with the same height and base angle nearly equal to 23°. The small discrepancy is due to the fact that a free fall of grain and inertial effects are always present, especially at larger aspect ratios and these phenomena are not included in the model. In addition, while in the cylinder the sand packing is near the close-packing value, in the cone the sand might not be so compact.
It is also observed that when the aspect ratio grows (say α > 3) the dynamics related to grain falling become prevalent with respect to grain sliding. Actually, for aspect ratios much larger than one, the entire column falls down giving rise to a Mexican hat shape with angles that are shallower than the angle of repose due to stronger inertial effects and a dynamics that is different from that studied in this paper. For this reason, we actually compare the outcomes of the degenerate parabolic model only with experimental data in the range 0 ≤ a ≤ 2.
A comparison of the experimental results and the outcome of the model proposed here is plotted in Figure 8, which shows the outcome of the simulation for a = 0.56, 0.8, 5.4, together with a reproduction of the experimental snapshots in [29]. From a qualitative point of view, the final configurations obtained by means of computational simulation are very close reproductions of the experimental ones, as well as intermediate non-equilibrium steps in the first two cases. The third one is not because the entire column collapses down and actually there is no creep layer.
Lube et al. [30] performed the same experiment using sand, salt, and other different granular materials, which have angles of repose between 30° and 35°. Consequently, the value that separates the truncated cone from the cone regime is different. In spite of the variability of the angle of repose, they give a unique range for all the cases: a < 1 for truncated cone shapes and a > 1 for cone shapes. Roche et al. [36] performed this experiment using coarse and fine granular material as well as dry and fluidized media. In the light of model-validation purposes, we only consider the dry cases. Thompson et al. [35] carried out experiments with a wide range for the aspect ratio a, giving just a few values in our range of interest.
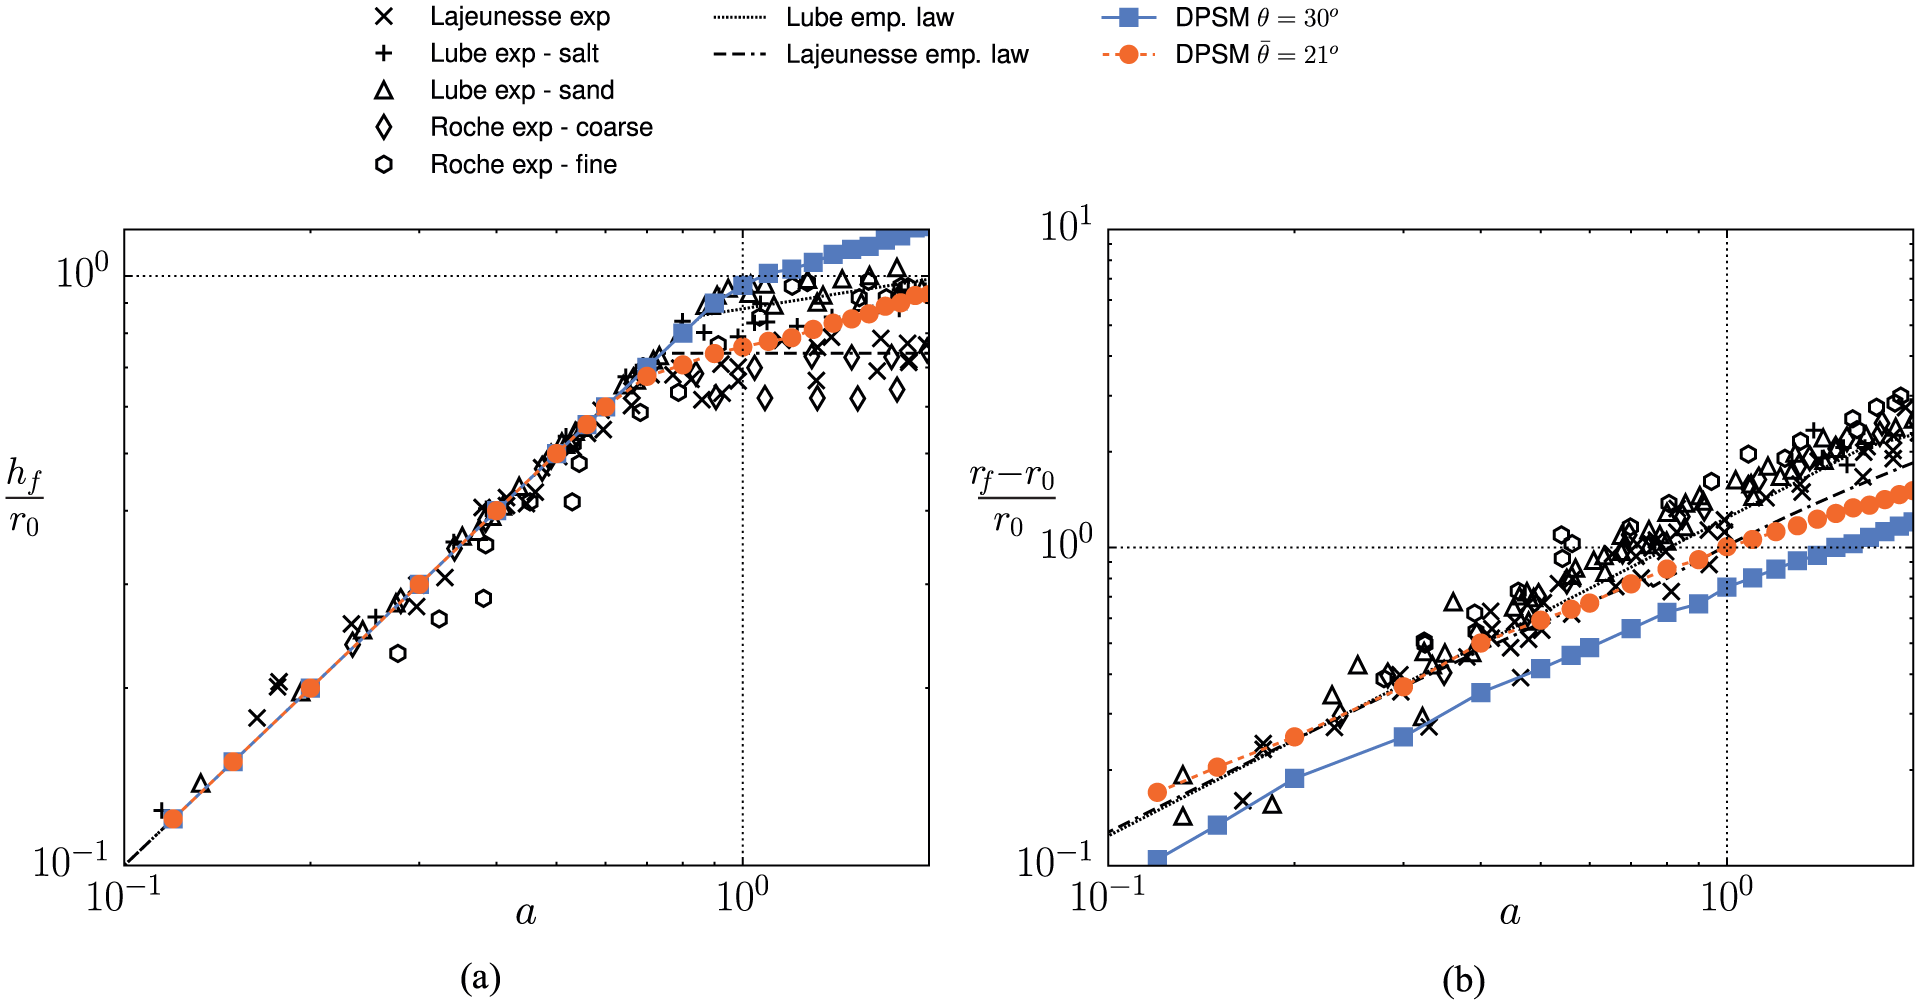
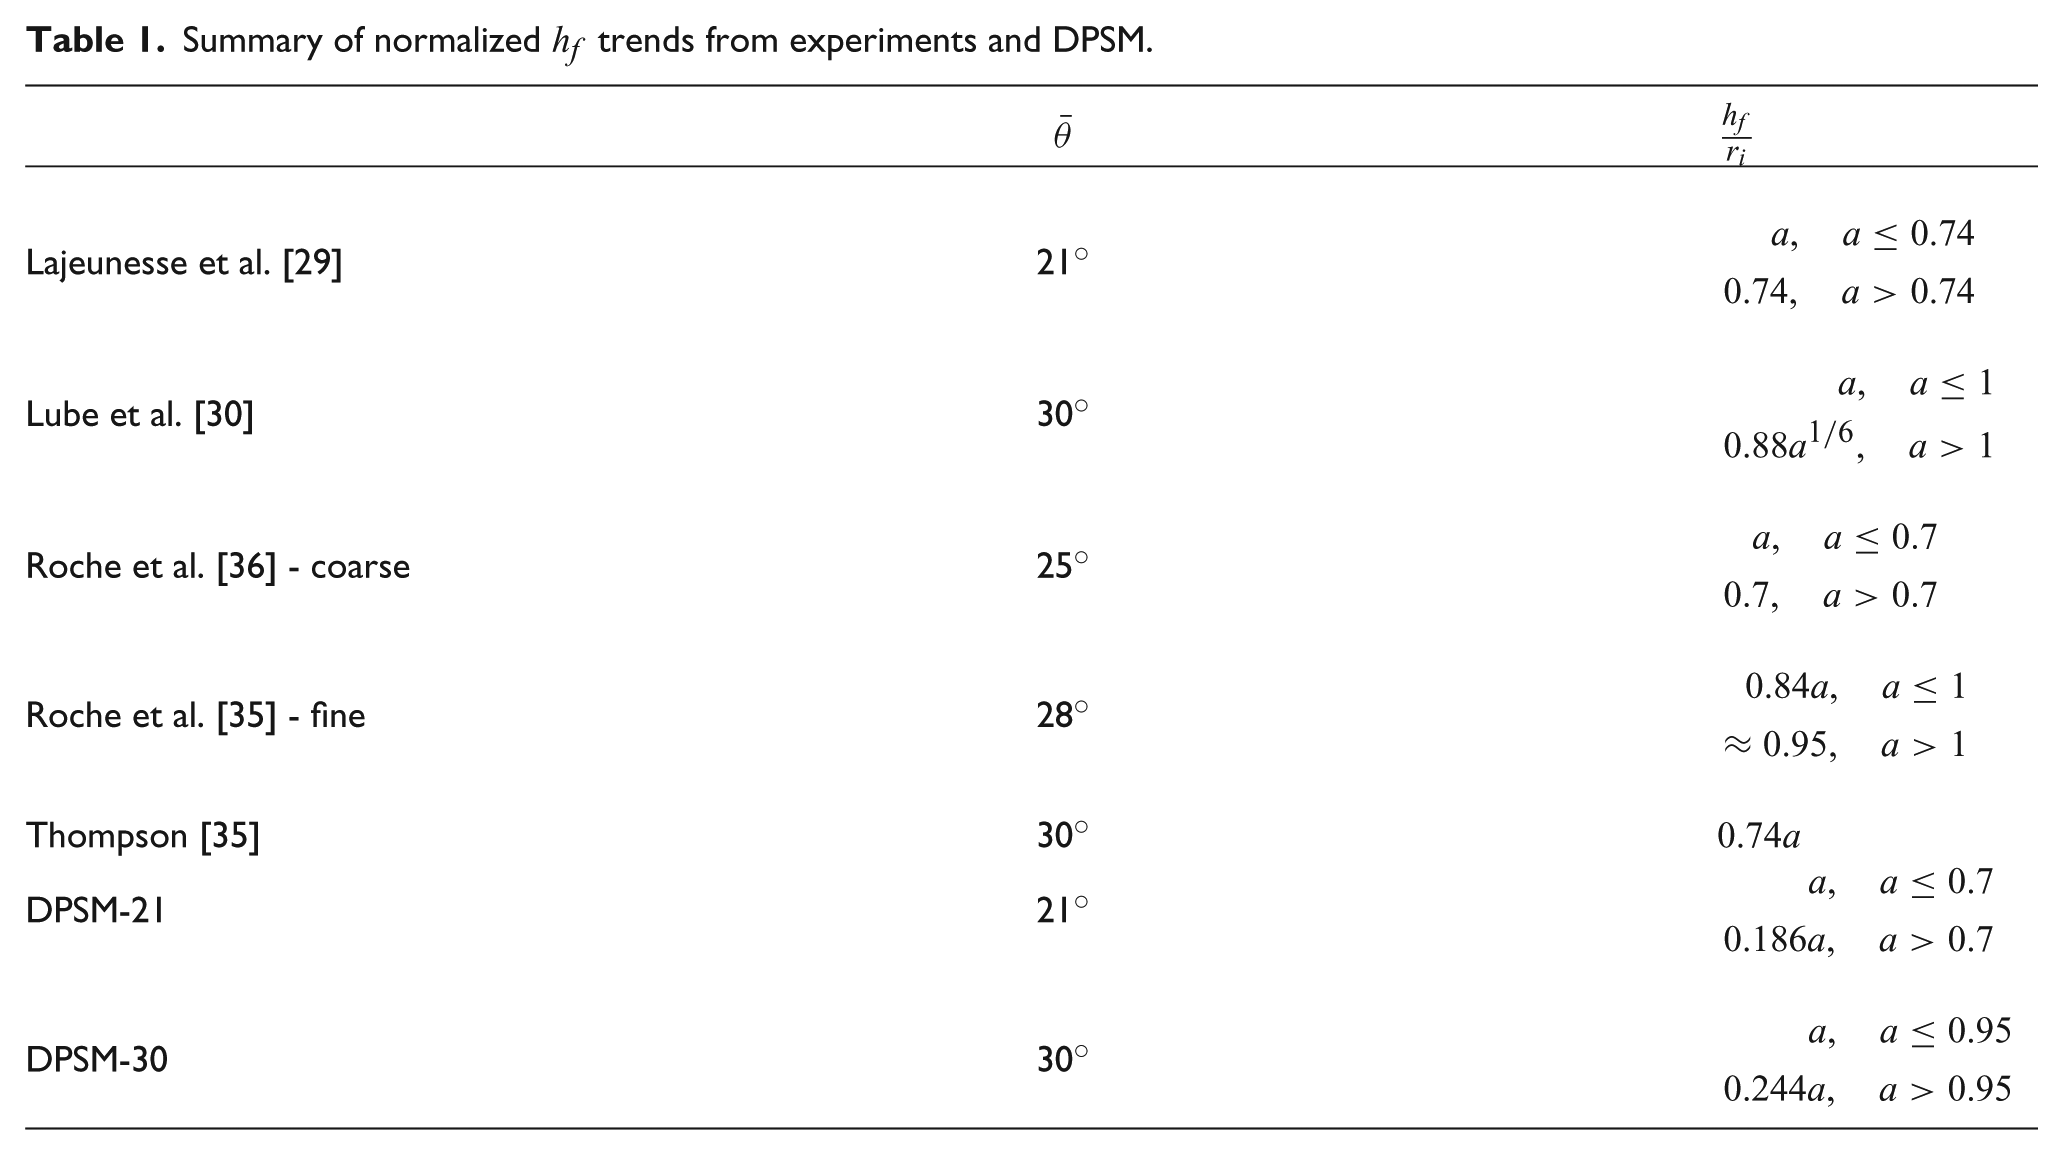
In Figure 9 the outcome of the degenerate parabolic model is compared with the experiments mentioned above focusing on the characteristic dimensions of final pile configuration for different aspect ratios. In particular, Figure 9(a) shows the normalized final height of the pile
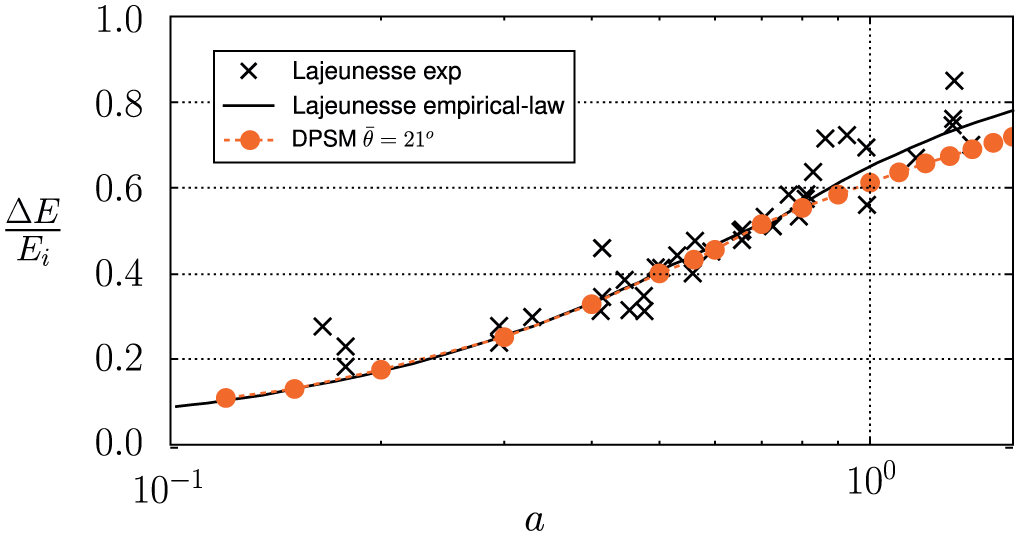
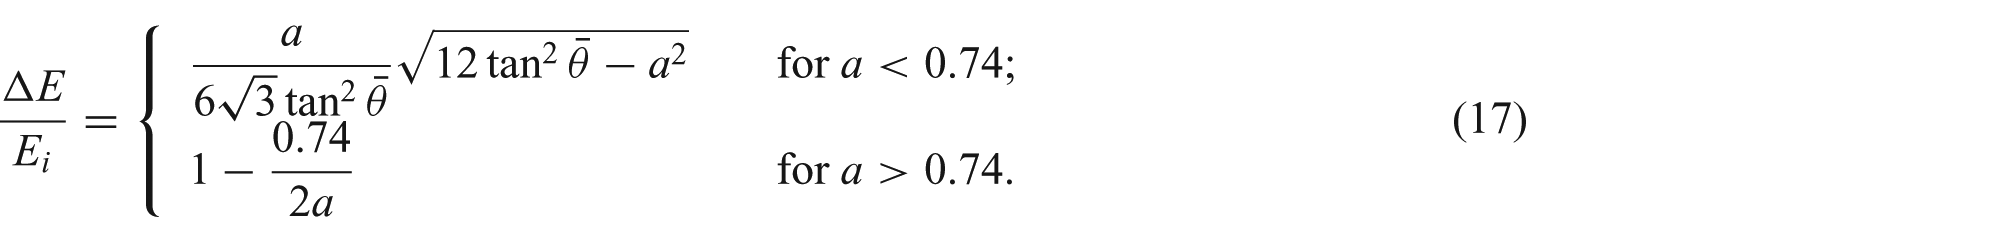
Normalized potential energy dissipation for different initial aspect ratios, comparison between numerical simulation, experimental measurements, and semi-empirical law (17).
Figure 9(b) shows normalized radial displacement. The DPSM-21 curve matches accurately its empirical counterpart (specifically, Lajeunesse et al. [29]), even though for high aspect ratio the effect of free fall dynamics beginning to be visible. In fact, as reported by Lajeunesse et al. [29] and Lube et al. [30] in this regime, the final surface slope is smaller than the angle of repose, leading to higher final radius. Surprisingly, the results of Lube et al. [30], dealing with
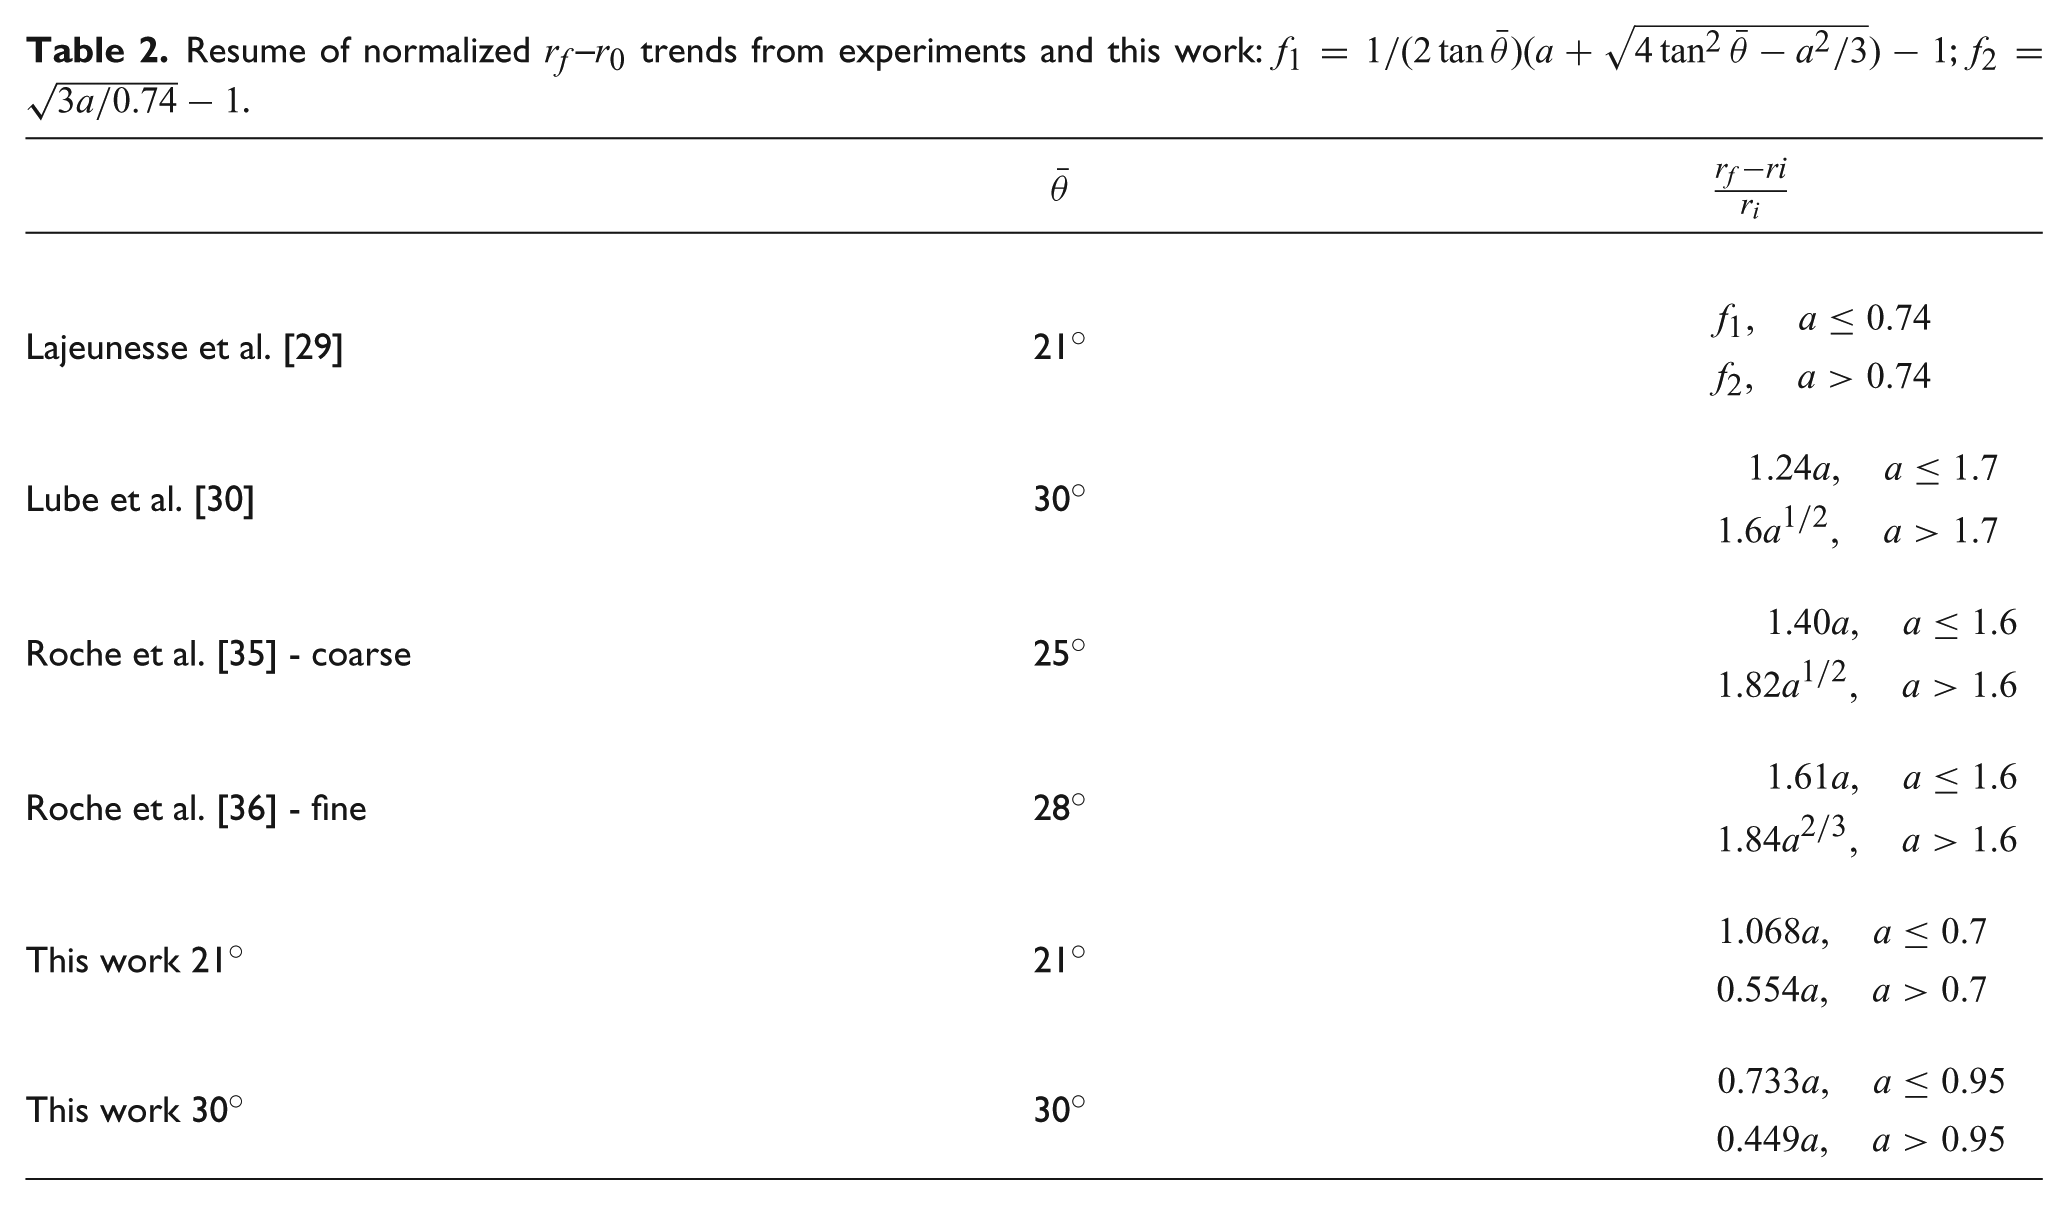
Tables 1 and 2 summarize the results and provide fitting curve formulas of experimental and numerical trends. As far as the degenerate parabolic model is concerned, data have been fitted with linear curves, differentiating according to the aspect ratio regimes defined previously.
Summary of normalized
Resume of normalized
Lajeunesse et al. [29] also provided potential energy dissipation during the dam-break for different aspect ratio experiments. We compare their empirical trend with the degenerate parabolic model using
Application of the DPSM to dune dynamics.
Again, for high aspect ratios, free-fall dynamics lead to a slight difference in the final configuration and in the dissipated energy accordingly.
6. Discussion
In this work, we have deduced a degenerate parabolic model for sand slides based on continuum mechanics methods. It is assumed that the thickness of the creep layer is small, that the sand density in it is close to close packing, and that grains move in the direction of the steepest descent with the velocity limited by friction and a drag force that mimics the interaction among grains. Owing to the above assumptions, the model cannot describe the massive motion of granular materials in their generality, such as the one recently studied by Edwards and Gray [43].
However, despite its simplicity, the model is able to catch all the classical behaviors of sand piles in different conditions, such as starting from supercritical conditions, growing because of external material pouring, in the presence of walls and obstacles or with open boundaries. Each of these particular cases does not require any ad-hoc modifications of the model. From a numerical point of view, different examples have been reported, in one and two dimensions, with different boundary conditions and internal obstacles, in order to show the high flexibility of the model, which actually does not present any problems in addressing these kinds of issues. Moreover, numerical validation by means of comparison with different experimental works on column collapse has been provided. It shows the capability of the model to reproduce experimental results in a satisfactory way, from both the qualitative and the quantitative point of view. if the aspect ratio of the column is not too large because in that case sand grains fall rather than slide and intertial effects not included in the model become important.
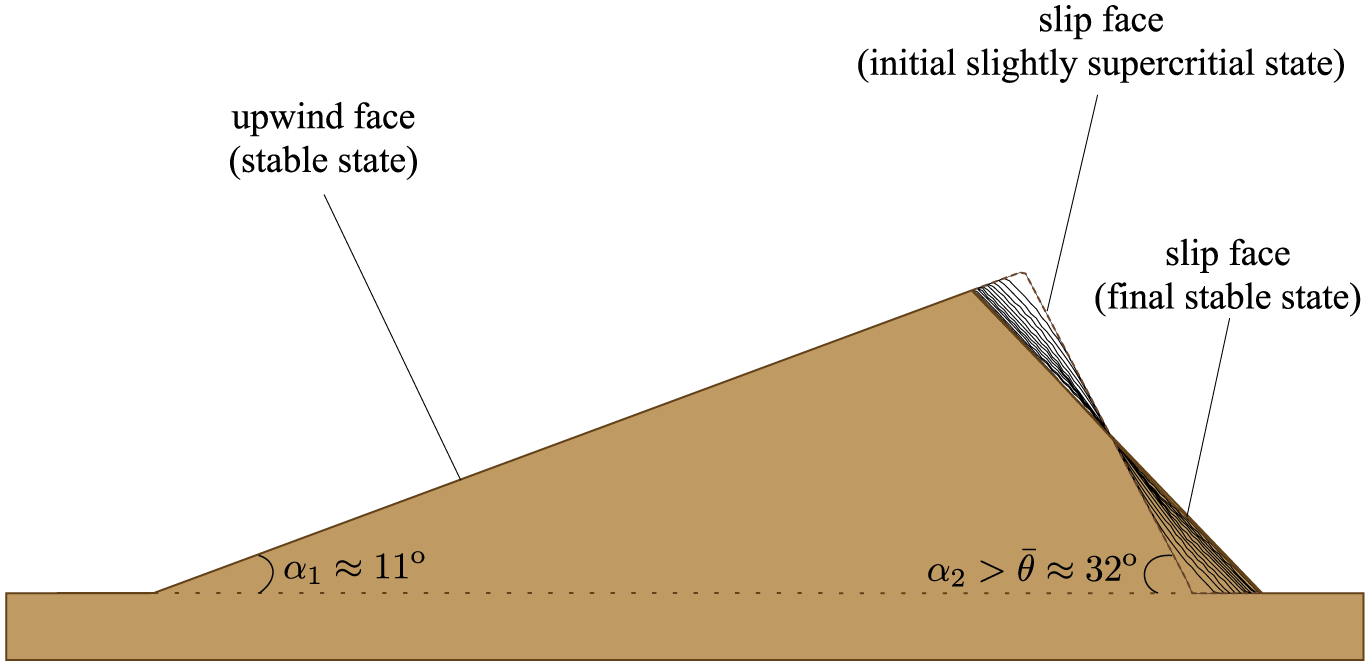
It is worth pointing out that the DPSM can be used in dune dynamics applications and sand-bed evolution, where avalanching locally acts to modify slightly supercritical configurations formed by the continuous transport of sand from the upwind to the downwind side of the dune. Referring to Preziosi et al. [1] for more details on how the fluid dynamic coupling could be performed, in Figure 11, we show an example of how a transverse dune with a slightly supercritical slip face would evolve to reach a stable configuration.
All the previous characteristics make the degenerate parabolic model very interesting to describe sand avalanches, in particular when coupling between multiphase turbulent fluid dynamics and the dynamics occurring at the sand surface is required. In fact, the model meets the requirements of describing the evolution of the sand surface in an accurate way, but at the same time it is computationally fast, which is a relevant plus considering the highly demanding multiphase simulations.
Footnotes
Appendix
Referring to Fig. 11, the direction
The direction of the tangent to this curve in
Acknowledgements
The study has been developed in the framework of the Windblown Sand Modeling and Mitigation joint research, development and consulting group (WSMM group) established between Politecnico di Torino and Optiflow Company. The authors wish to thank Luca Bruno and Lorenzo Raffaele, members of the WSMM group, for the helpful discussions about the topics of the paper.
Funding
This work was supported by the Istituto Nazionale di Alta Matematica and Regione Piemonte. The research activity of L. Preziosi and A. Lo Giudice has been developed within the MSCA-ITN-2016-EID SMaRT research project. This project has received funding from the European Union’s Horizon 2020 research and innovation programme (grant agreement No.721798).