
Abstract
Introduction
The outdoor recreation industry in Texas has witnessed a large growth. There are no publications about the epidemiology of outdoor recreation injury and mortality in Texas. This work analyzes the Texas Parks and Wildlife Department (TPWD) outdoor injury reports to address this gap.
Methods
We analyzed TPWD injury incident reports filed from July 2012 to April 2021. Statistical analysis included descriptive statistics, Wilcoxon Rank Sum test for continuous data, χ2 analysis for categorical data, Fisher exact test for small sample cross tables, and two multivariable logistic regression models for the effects of season, activity, and location on morbidity and mortality.
Results
There were 4882 outdoor recreational events, including injuries (n = 4401, 90.1%), mortalities (n = 124, 2.5%), and search and rescue operations (n = 357, 6.4%). The injury and mortality rates were 5.20 and 0.15 per 100 000 visits, respectively. Activities preceding injury included hiking (n = 1112, 24.3%), walking/running (n = 1078, n = 23.6%), water sports (n = 533, 11.6%), biking (n = 393, 8.6%), and climbing (n = 260, 5.7%). The most common injuries were skin-related (n = 1194, 27.1%), musculoskeletal (n = 804, 18.3%), and heat injuries (n = 393, 8.9%). Activities preceding mortality included water sports (n = 52, 42.6%) and hiking (n = 20, 16.4%). Injuries contributing to mortality included respiratory events and drowning (n = 46, 37.41%), cardiac events (n = 13, 10.5%), and heat injury (n = 9, 7.3%). Most incidents occurred in Hill Country (n = 1170, 24.01%) and Prairies and Lakes (n = 1144, 23.48%) areas.
Conclusion
This study evaluates outdoor recreational injuries in the state of Texas. It uncovers and summarizes important trends that may inform the development of prevention and education efforts.
Keywords
Introduction
Outdoor recreation participation has been steadily growing. The COVID-19 pandemic spurred growth in outdoor participation in 2020, and that growth has continued through 2022 when the outdoor recreation participant base reached a record 168.1 million participants accounting for 55% of the U.S. population ages 6 and older. 1 The participant base is also becoming more diverse in terms of ethnicity, race, education, and age. Outdoor recreation offers many benefits for individuals and society. It enhances physical fitness, mental well-being, skill acquisition, social connections, and environmental consciousness. 2 Outdoor recreation has multiple health benefits, including reduced blood pressure, stress (estimated by salivary cortisol), incidence of type II diabetes, and all-cause and cardiovascular mortality. 3 Outdoor recreation is also having an increased economic impact as demonstrated by a 4.8% growth in the gross domestic product (GDP) contributed through outdoor recreation compared to that of the overall US economy GDP growth of 1.9%. 4 In that same report, Texas was one of the top three states contributing to economic growth related to outdoor recreation across several categories.
Texas state parks opened in the 1930s. Texas Parks and Wildlife Department (TPWD) manages Texas state parks. TPWD reports more than nine million visitors annually. Texas state parks have diverse environments, including forests, deserts, mountains, prairies, and others. TPWD divides the state into 7 natural areas: South Texas Plains, Prairies and Lakes, Pineywoods, Panhandle Plains, Hill Country, Gulf Coast, and Big Bend Country. 5 Popular activities encountered at TPWD regions include biking, birding, camping, shooting sports, hiking, and water sports.
There are no studies on the epidemiology of outdoor injury and mortality in the state of Texas. The incidence and prevalence of outdoor injury and mortality have been reported in different regions, including California, 6 New Hampshire, 7 and Arizona. 8 In this study, we use TPWD injury incident reports to evaluate outdoor mortality and morbidity. This can help future wilderness use, guide prevention efforts, and inform future policies.
Methods
Sample and Variables
This study is a retrospective analysis of the TPWD injury incident reports filed from July 2012 to April 2021. Data collected included the year and month of each case incident, activity pre-incident, nature and body part of injury, outcome of incident, and type of transport. Age, gender, and other demographic or personal characteristics were not available for analysis. To enable data analysis, we grouped and coded available data. We deduced and coded the season for each incident as follows: winter included incidents from November to January, spring included February to April, summer included May to July, and autumn August to October. We classified locations per the TPWD seven natural areas. We classified injury types as mortality, illness or injury, or search and rescue. When mortality existed with any other incident type, we counted the incident as mortality only. External emergency services called to the scene included emergency medical services (EMS), air evacuation, fire department, and other (law enforcement or animal control). Activities included biking, water-related sports (fishing, swimming, boating, canoeing, kayaking, and diving), hiking, walking or running, climbing, operating a motor vehicle (driving, riding scooter, or motorcycle), horseback riding, lifting or carrying, engaging in fire-related activities (burning, building campfire, extinguishing fire, or fireworks), shooting or hunting, camping, and other activities (including cleaning, having a birthday party, mowing, doing manual labor, or sitting). The data collection forms allowed for the use of “running,” “walking,” and “hiking” simultaneously or alone. Therefore, when the database combined “walking” and “running” with “hiking,” we counted the incident as “hiking” only. However, when “walking” or “running” were used alone, we counted the incident as “walking or running.” We did this to account for the diversity of TPWD locations and activities—for example, tripping while walking on a boat dock should not count as “hiking.” We classified the nature of injury into skin-related injury, musculoskeletal injury, heat exposure or heat stroke, cold exposure or hypothermia, neurological, organ-related trauma, medical event (including hypoglycemia, fatigue, and dehydration), cardiac events, gastrointestinal event, respiratory event, infection or inflammation, poisoning, mental health event, allergic reaction, insect or animal related, or other. Body parts involved included the abdomen or pelvis, lungs, eye, head or neck, face, body (back, shoulder, chest wall, or hips), arms, legs, the entire body (systemic issue), or central nervous system. We added COVID-19 as a covariable to the analyses, using March 13, 2020, as the cutoff date for lockdown.
Statistical Analysis
We use descriptive statistical methods to describe the study variables. Continuous data were analyzed using the Wilcoxon Rank Sum test and categorical data were analyzed using χ2 analysis and Fisher exact test for small sample cross tables (<5). Data are reported as mean ± standard deviation or frequencies and percentages for nominal data. To determine predictors of mortality and morbidity incidence, we ran two multivariable logistic regression models, adjusted for season, type of activity, and park location. We present multivariable results as odds ratios (OR) along with their corresponding 95% confidence intervals (CI). We generated receiver operating characteristic (ROC) curves and calculated the area under the curve (AUC) to visualize the predictive performance of each model. We performed statistical analyses using STATA 17 (STATA Corp, College Station, TX), and an a priori P-value of <.05 was used to indicate significance.
Results
Prevalence of Outdoor Injuries
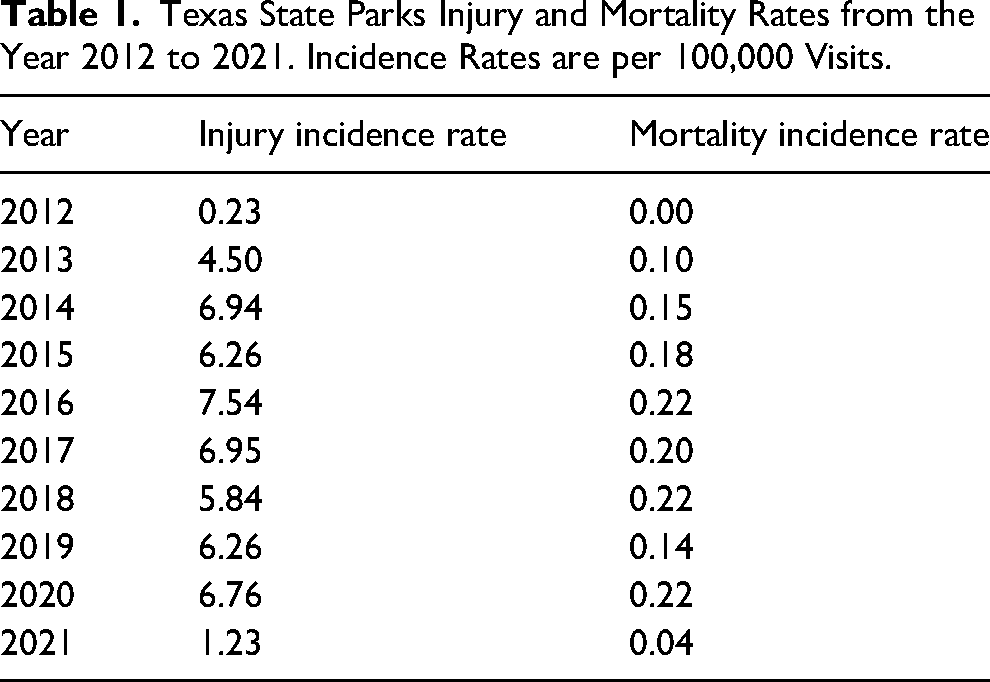
Between 2012 and 2021, TPWD reported 84,568,790 visits with an average of 9,396,532 visits every year. 5 The highest number of visitors was reported in 2021, accounting for 11.6% of total visitors across the 9-year study period, followed by the yearly average in 2017 (11.2%). Over this period, in total, there were 4882 recreational injuries, medical events, or mortalities in Texas state parks. Most incidents were injuries, accounting for 90.1% (n = 4401) of incidents. Only 2.5% (n = 124) of incidents were fatal, with the remaining 6.4% (n = 357) of incidents leading to search and rescue operations. The total injury rate was 5.20 per 100,000 visits across all parks, with a mortality rate of 0.15 per 100,000 visits. The injury and mortality rates per year are presented in Table 1.
Texas State Parks Injury and Mortality Rates from the Year 2012 to 2021. Incidence Rates are per 100,000 Visits.
Injury and Activity Characteristics
Hiking was the most common preinjury activity (n = 1112, 24.3%), followed closely by walking/running (n = 1078, n = 23.6%), water sports (n = 533, 11.6%), biking (n = 393, 8.6%), and climbing (n = 260, 5.7%) (Table 2). Activities most likely to precede mortality included water sports (n = 52, 42.6%) and hiking (n = 20, 16.4%). Emergency services were involved in 50.1% (n = 2446) of incidents, half of which required medical attention (24.9%, n = 1215). Air evacuation was necessary for 20.5% (n = 249) of injuries receiving medical attention. Injuries sustained while hiking (11.3%), walking/running (7.3%), or engaging in water sports (6.9%) more commonly involved emergency medical services.
Prevalence of Pre-injury Activities in Texas State Parks from 2012 to 2021.
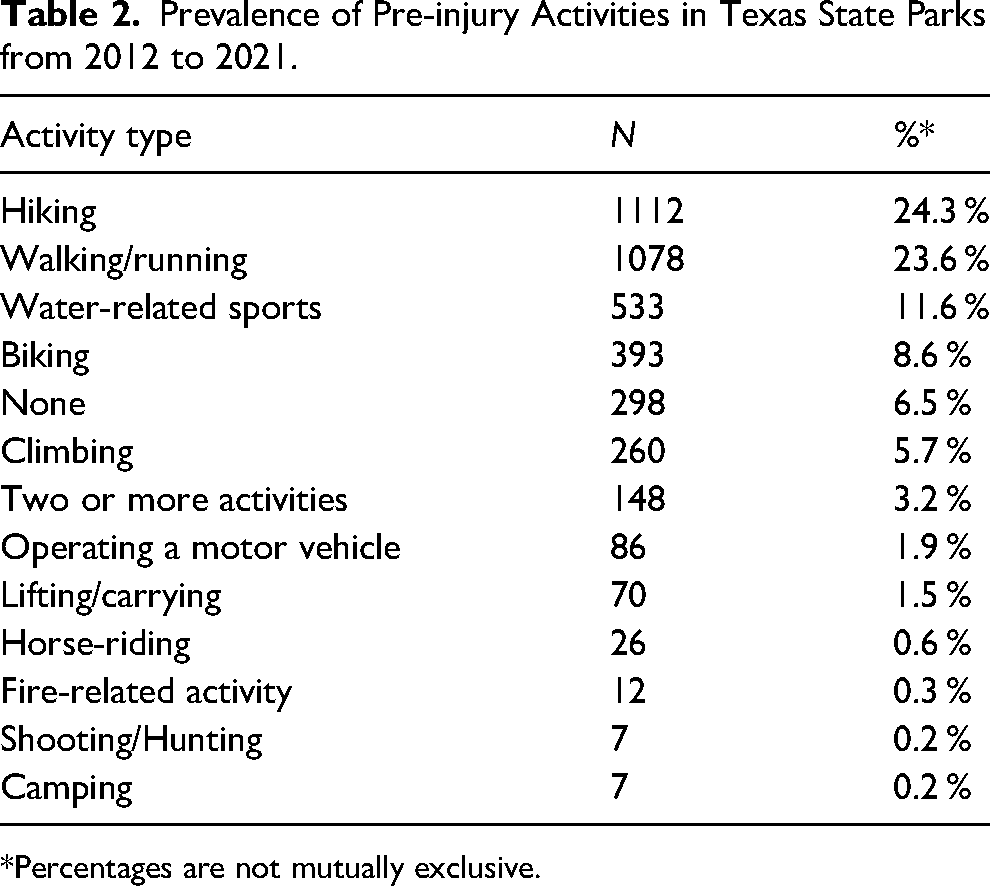
*Percentages are not mutually exclusive.
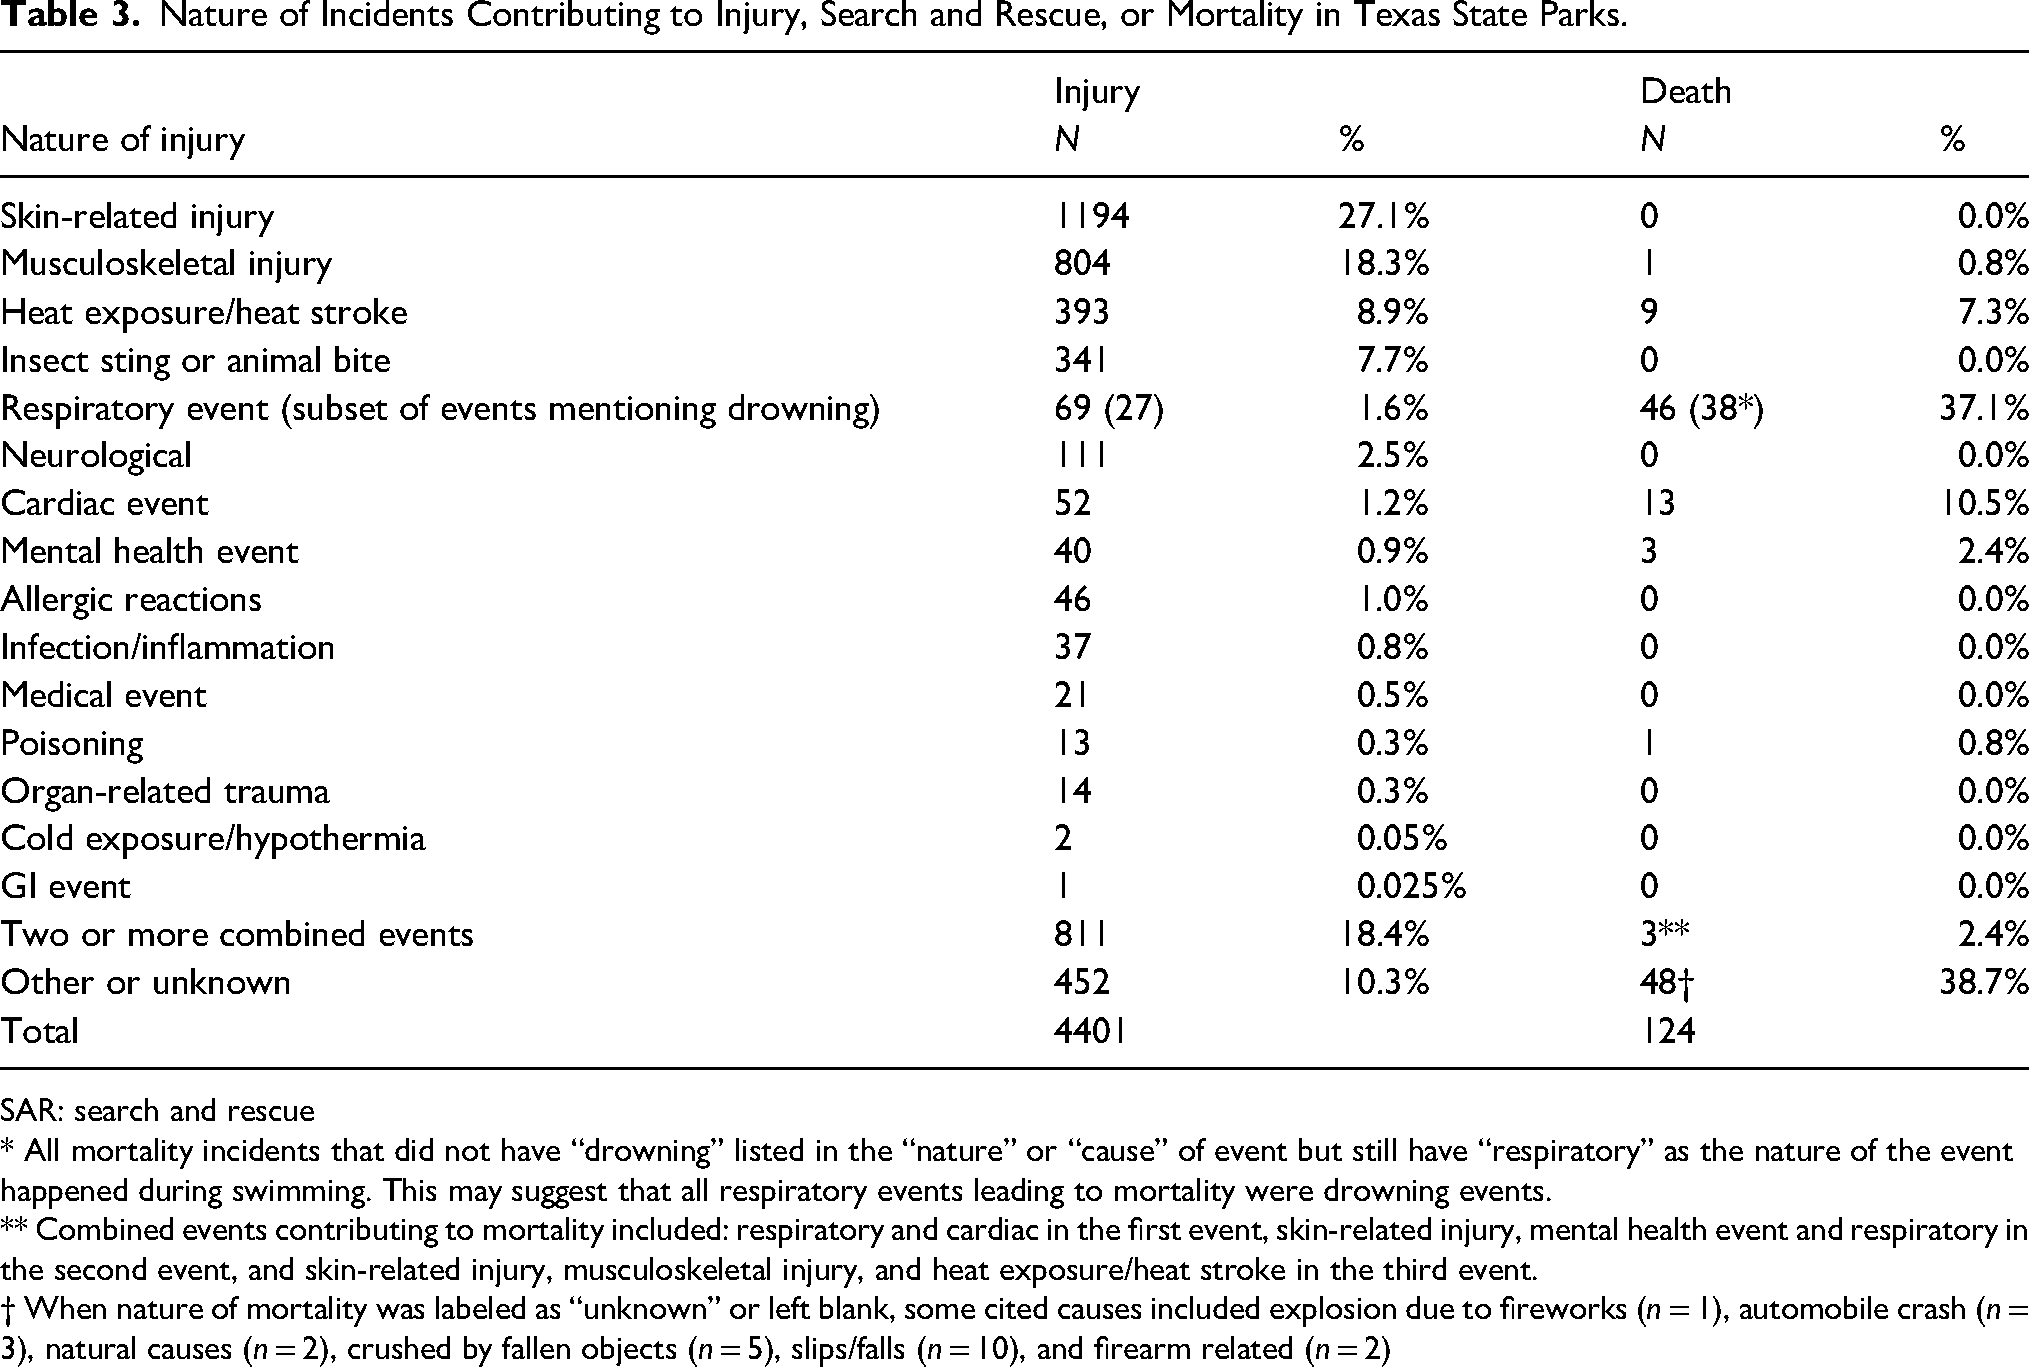
The nature of injuries contributing to an injury report or mortality is outlined in Table 3. Most common were skin-related injuries (n = 1194, 27.1%), followed by musculoskeletal injuries including fractures or dislocations (n = 804, 18.3%), heat exposure or heat stroke (n = 393, 8.9%), stings or animal bites (n = 341, 7.7%), and respiratory events (n = 69, 1.5%), which included 27 drowning incidents (0.6%). It was not possible to distinguish between stings and animal bites as they were classified together in the original dataset. Cold exposure and hypothermia, neurological issues, and cardiac and respiratory events were less common, each accounting for less than 3% of injuries.
Nature of Incidents Contributing to Injury, Search and Rescue, or Mortality in Texas State Parks.
SAR: search and rescue
* All mortality incidents that did not have “drowning” listed in the “nature” or “cause” of event but still have “respiratory” as the nature of the event happened during swimming. This may suggest that all respiratory events leading to mortality were drowning events.
** Combined events contributing to mortality included: respiratory and cardiac in the first event, skin-related injury, mental health event and respiratory in the second event, and skin-related injury, musculoskeletal injury, and heat exposure/heat stroke in the third event.
† When nature of mortality was labeled as “unknown” or left blank, some cited causes included explosion due to fireworks (n = 1), automobile crash (n = 3), natural causes (n = 2), crushed by fallen objects (n = 5), slips/falls (n = 10), and firearm related (n = 2)
Of the mortalities in Texas state parks during the nine-year period, 75 were accidental (61.0%) and 4 were suicides (3.25%). Accidental deaths were primarily caused by respiratory events (n = 46, 37.1%). The majority of these events were clearly labeled as “drowning” (n = 38). However, all remaining respiratory incidents happened during swimming. This may suggest that all respiratory events were drowning events. The next more common cause of mortality was cardiac events (n = 13, 10.5%), followed by heat exposure or heat stroke (n = 9, 7.3%).
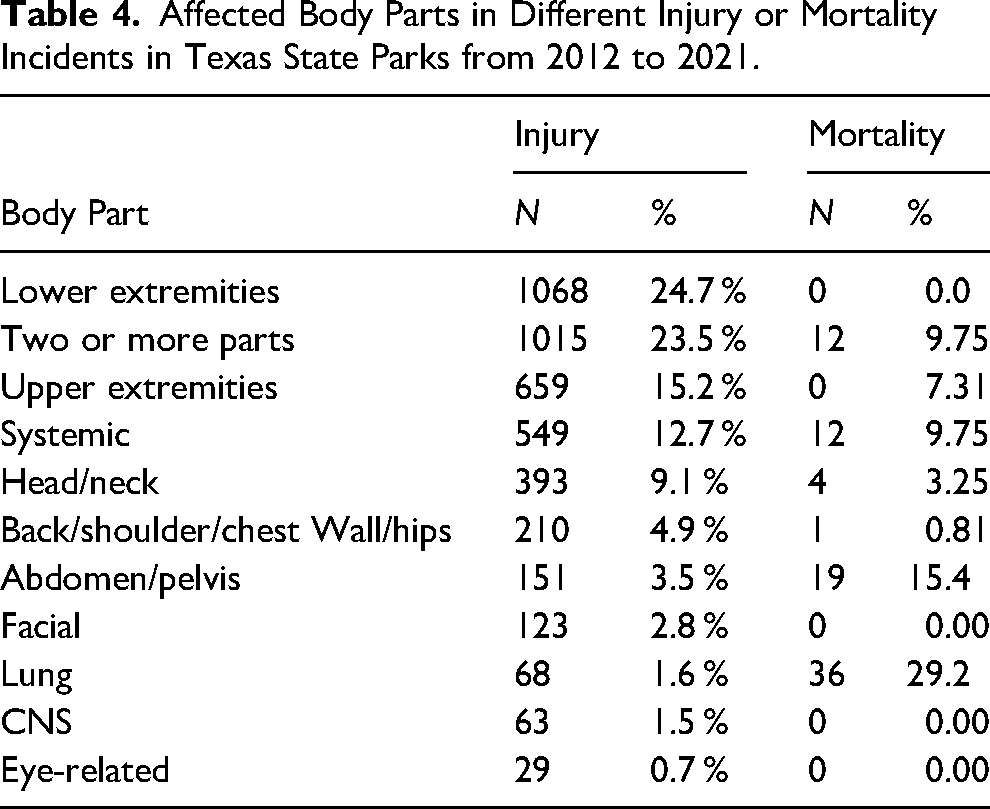
Table 4 presents the frequency of different body parts affected by incidents reported. Lower extremities were the most frequently injured body part (n = 1068, 24.7%), followed by upper extremities (n = 659, 15.2%). Injuries involving two body parts occurred in 1105 cases (23.5%), and systemic issues (including dehydration, exhaustion, and heat or cold injury) were reported in 549 cases (12.7%). Head and neck injuries accounted for 9.1% of injuries (n = 393), while back, shoulder, chest wall, and hip injuries were next most common (n = 210, 4.9%), along with abdomen and pelvis injuries (n = 151, 3.5%). Fatal incidents were more likely to result from injuries affecting the lung (n = 36, 29.2%) and abdomen/pelvis (n = 19, 15.4%).
Affected Body Parts in Different Injury or Mortality Incidents in Texas State Parks from 2012 to 2021.
Geographic Variation
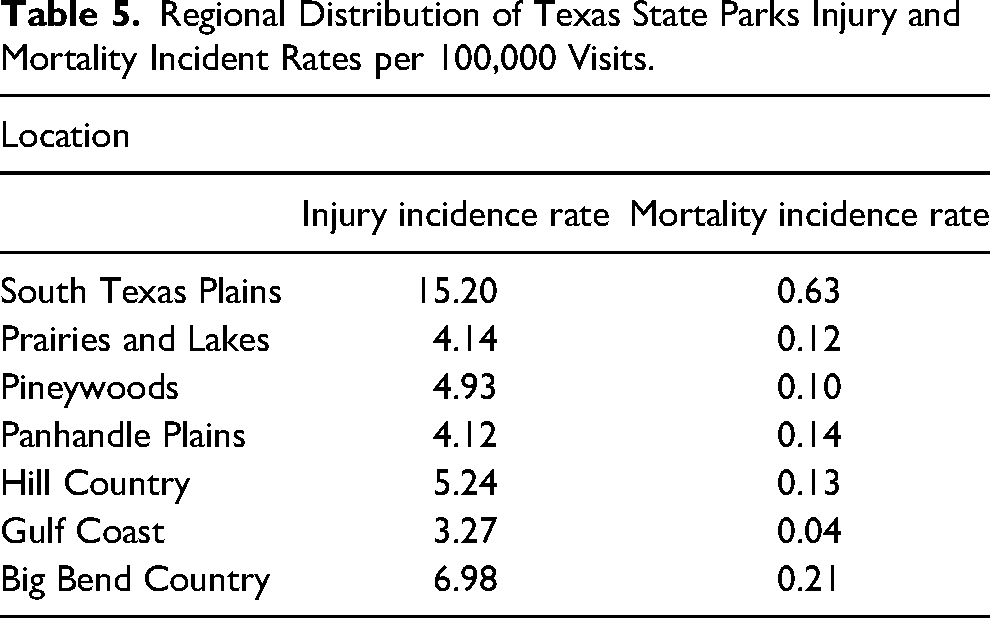
As shown in Figure 1a, the geographic distribution of the incidents indicated that almost half of the incidents occurred in parks located in two regions, Hill Country (n = 1170, 24.01%) and Prairies and Lakes (n = 1144, 23.48%) areas. This was followed by the South Texas Plains area (n = 846, 17.36%). The remaining four regions each represented under 10% of all incidents. Figure 1b shows the incident rates of these same regions per 100,000 visitors. This demonstrates that while Hill Country and Prairies and Lakes had close to half the incidents in this study, their incident rates, 6 and 5, respectively, were similar to other regions: Pineywoods = 5, Panhandle Plains = 5, and Gulf Coast = 3. South Texas Plains had the highest incidence rates for injury (15.2 per 100,000 visits) and mortality (0.63 per 100,000 visits), followed by Big Bend Country (6.98 per 100,000 visitors and 0.21 per 100,000 visitors, respectively). This is shown in Table 5.
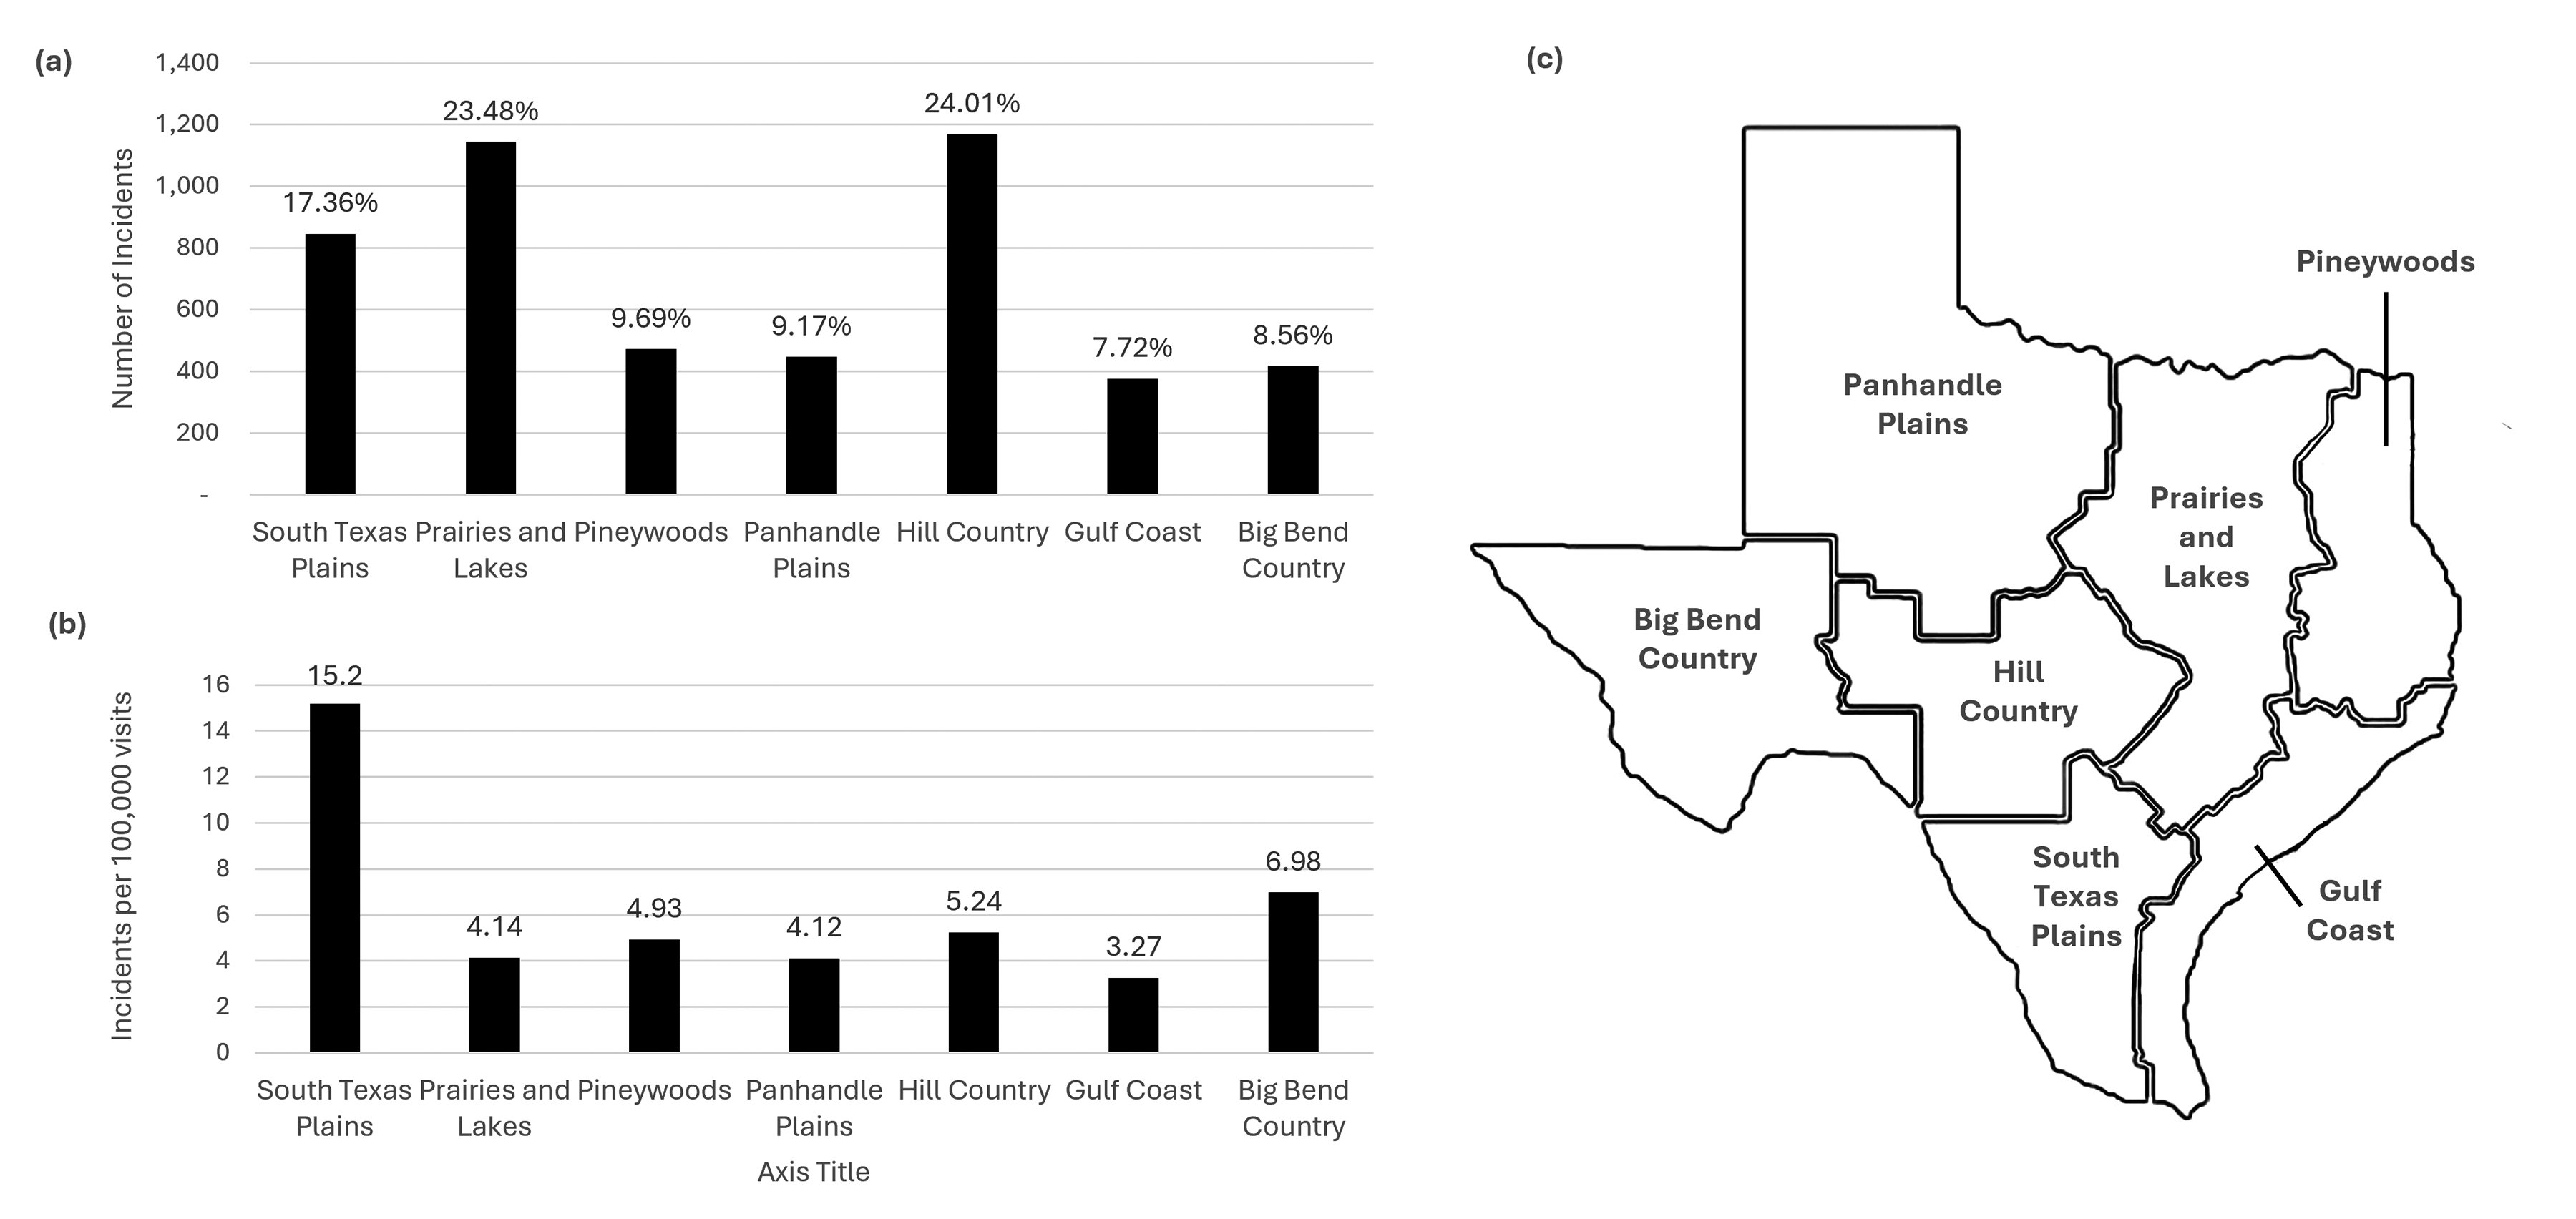
(a) Number of incidents by geographic distribution. (b) Incidence rate by geographic region adjusted for number of visitors. (c) Map of Texas Parks and Wildlife regions.
Regional Distribution of Texas State Parks Injury and Mortality Incident Rates per 100,000 Visits.
Statistically significant associations between the nature of injury and park location were also found (P < .001). Insect stings or animal bites (n = 320) were most reported in the Prairies and Lakes (n = 105, 30.9%) and South Texas Plains regions (n = 74, 21.7%). Musculoskeletal injuries (n = 808) were mostly experienced in Hill Country (n = 227, 28.1%) and Prairies and Lakes (n = 174, 21.5%) regions. Heat exposure/heat strokes (n = 411) were mostly reported in parks in Hill Country (n = 104, 25.3%), South Texas Plains (n = 94, 22.95%), and Prairies and Lakes (n = 72, 17.5%).
Seasonal Variation
Over a third of incidents (n = 1877, 38.4%) occurred during summer, with the rest mostly occurring during fall or spring (Figure 2). Injuries were significantly less likely to occur during the winter months (P = .009). During the summer months, visitors were mostly reported hiking (n = 409, 8.32%), walking/running (n = 384, 7.86%), water-related sports (n = 332, 6.80%), and biking (n = 147, 3.01%). Mortality rates did not significantly vary by season (P = .568).
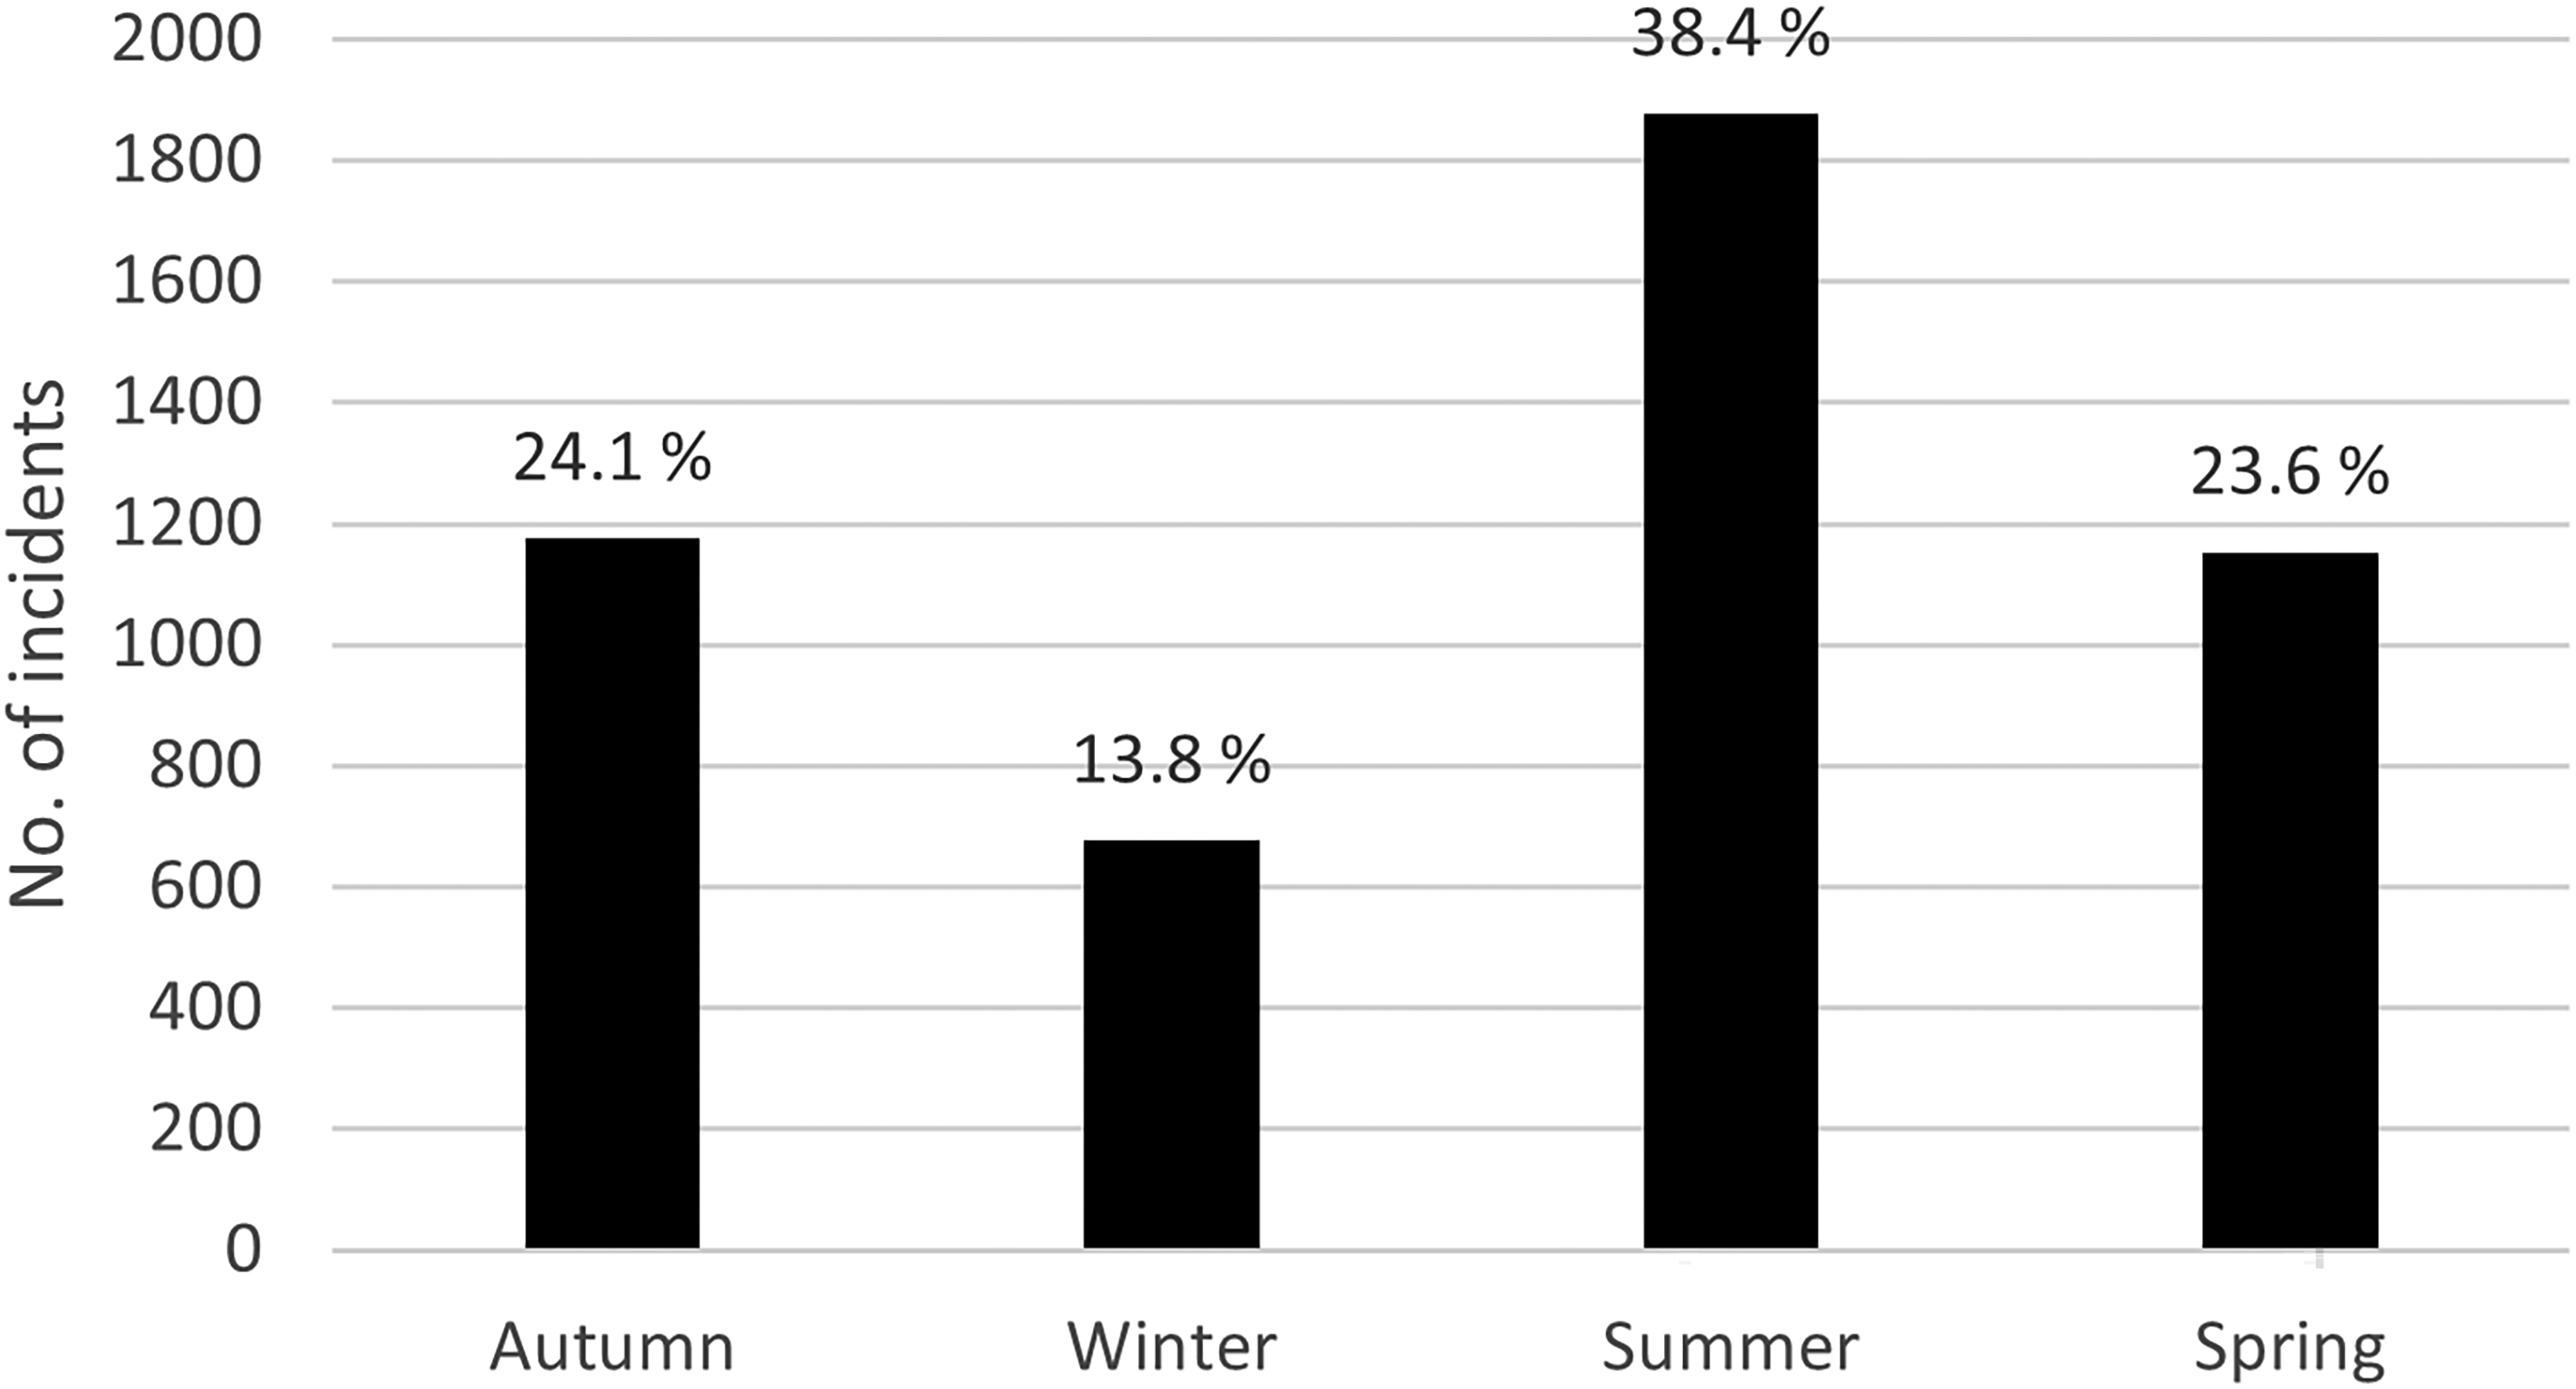
Number of incidents by season.
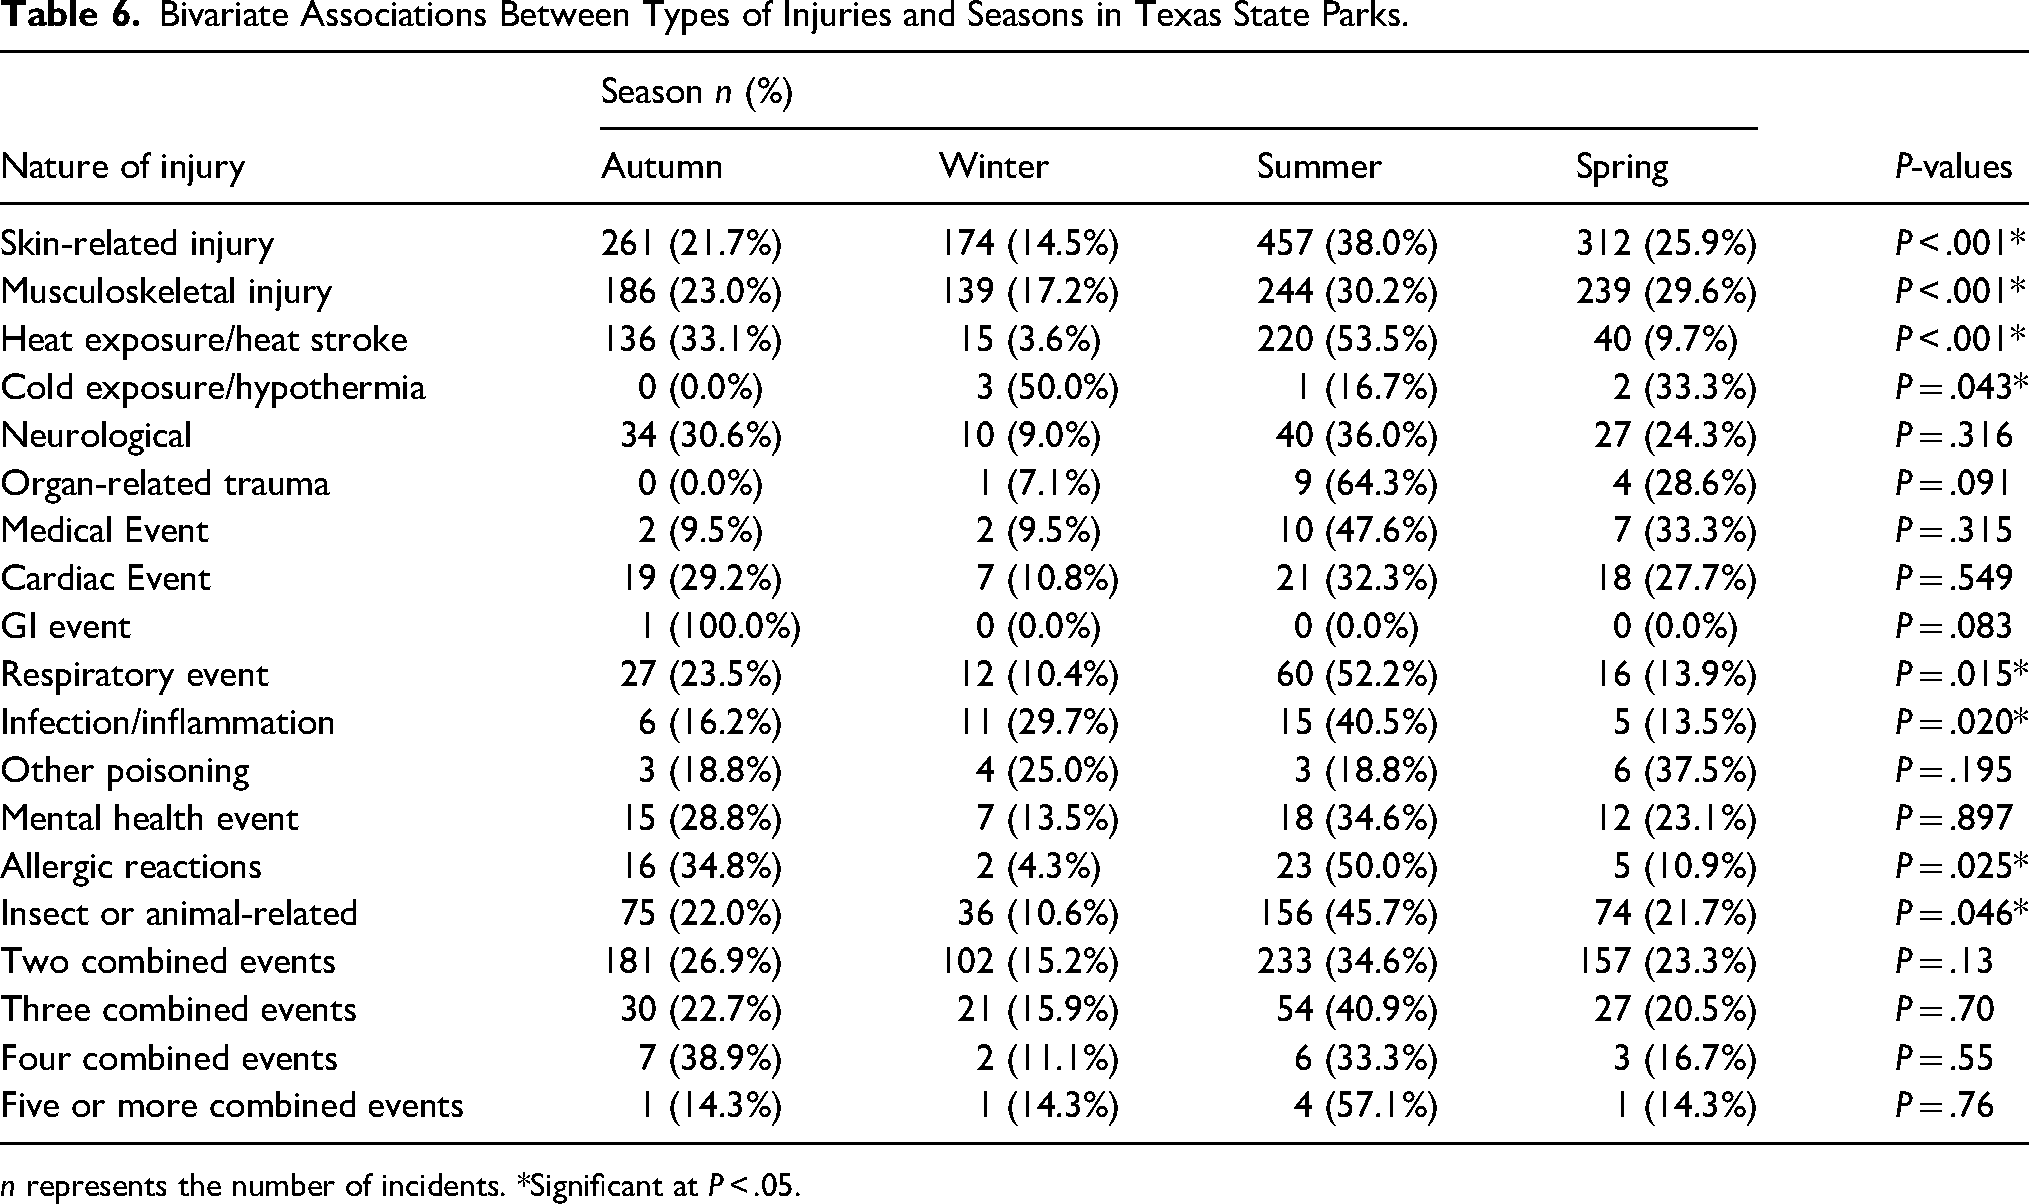
Bivariate associations between types of injuries and season showed statistically significant differences in the injury nature during different months of the year (P < .001; Table 6). Skin-related injuries were more frequent in the summer (n = 457, 38.0%), followed by spring (n = 312, 25.9%), autumn (n = 261, 21.7%), and winter (n = 174, 14.5%) [P < .001]. Similarly, musculoskeletal injuries were most common in summer (n = 244, 30.2%) and spring (n = 239, 29.6%), with fewer occurrences in autumn (n = 186, 23.0%) and winter (n = 139, 17.2%) [P < .001]. Not surprisingly, heat exposure and heat stroke were predominantly seen in summer (n = 220, 53.5%), with fewer cases in autumn (n = 136, 33.1%), spring (n = 40, 9.7%), and winter (n = 15, 3.6%) [P < .001]. Cold exposure and hypothermia were rare, with half of the cases occurring in winter (n = 3, 50.0%) and the rest evenly distributed between summer (n = 1, 16.7%) and spring (n = 2, 33.3%) [P = .043].
Bivariate Associations Between Types of Injuries and Seasons in Texas State Parks.
n represents the number of incidents. *Significant at P < .05.
Respiratory events, infections, and inflammation and allergic reactions were all more likely to occur in the summer. The same trend was also observed for insect or animal-related incidents, with close to half (n = 156, 45.7%) being in the summer and only 10.6% (n = 36) occurring during the winter months.
COVID-19
Analyses of park data post-COVID-19 revealed the highest increase in visitors to parks in the Prairies and Lakes and Big Bend Country regions, with a 144% increase in visitors in both regions. The rate of injuries during the COVID-19 period was 152% higher (5.61 vs 3.68 per 100,000 visitors, respectively). Almost half of the fatal incidents (n = 18) that occurred during the COVID-19 lockdown period were reported in the South Texas Plains (n = 8, 44.4%).
Table 7 presents the analyses of incident predictors pre- and during the COVID-19 lockdown period. Statistically significant trends were observed for the number of visitors by location, incidents by activities, nature of injuries, and body parts affected. Specifically, during the COVID-19 lockdown period, incidents were more likely to result from hiking (n = 240, 37.8%, P < .001) and biking (n = 67, 10.6%, P < .001) than pre-COVID-19. All of the body part injuries except injuries of the Lung, Head/Neck, and Central Nervous System showed highly significant differences between pre-COVID and during COVID periods.
Predictors of Injury or Mortality Incidents in Texas State Parks Pre- and During COVID-19 Lockdown.
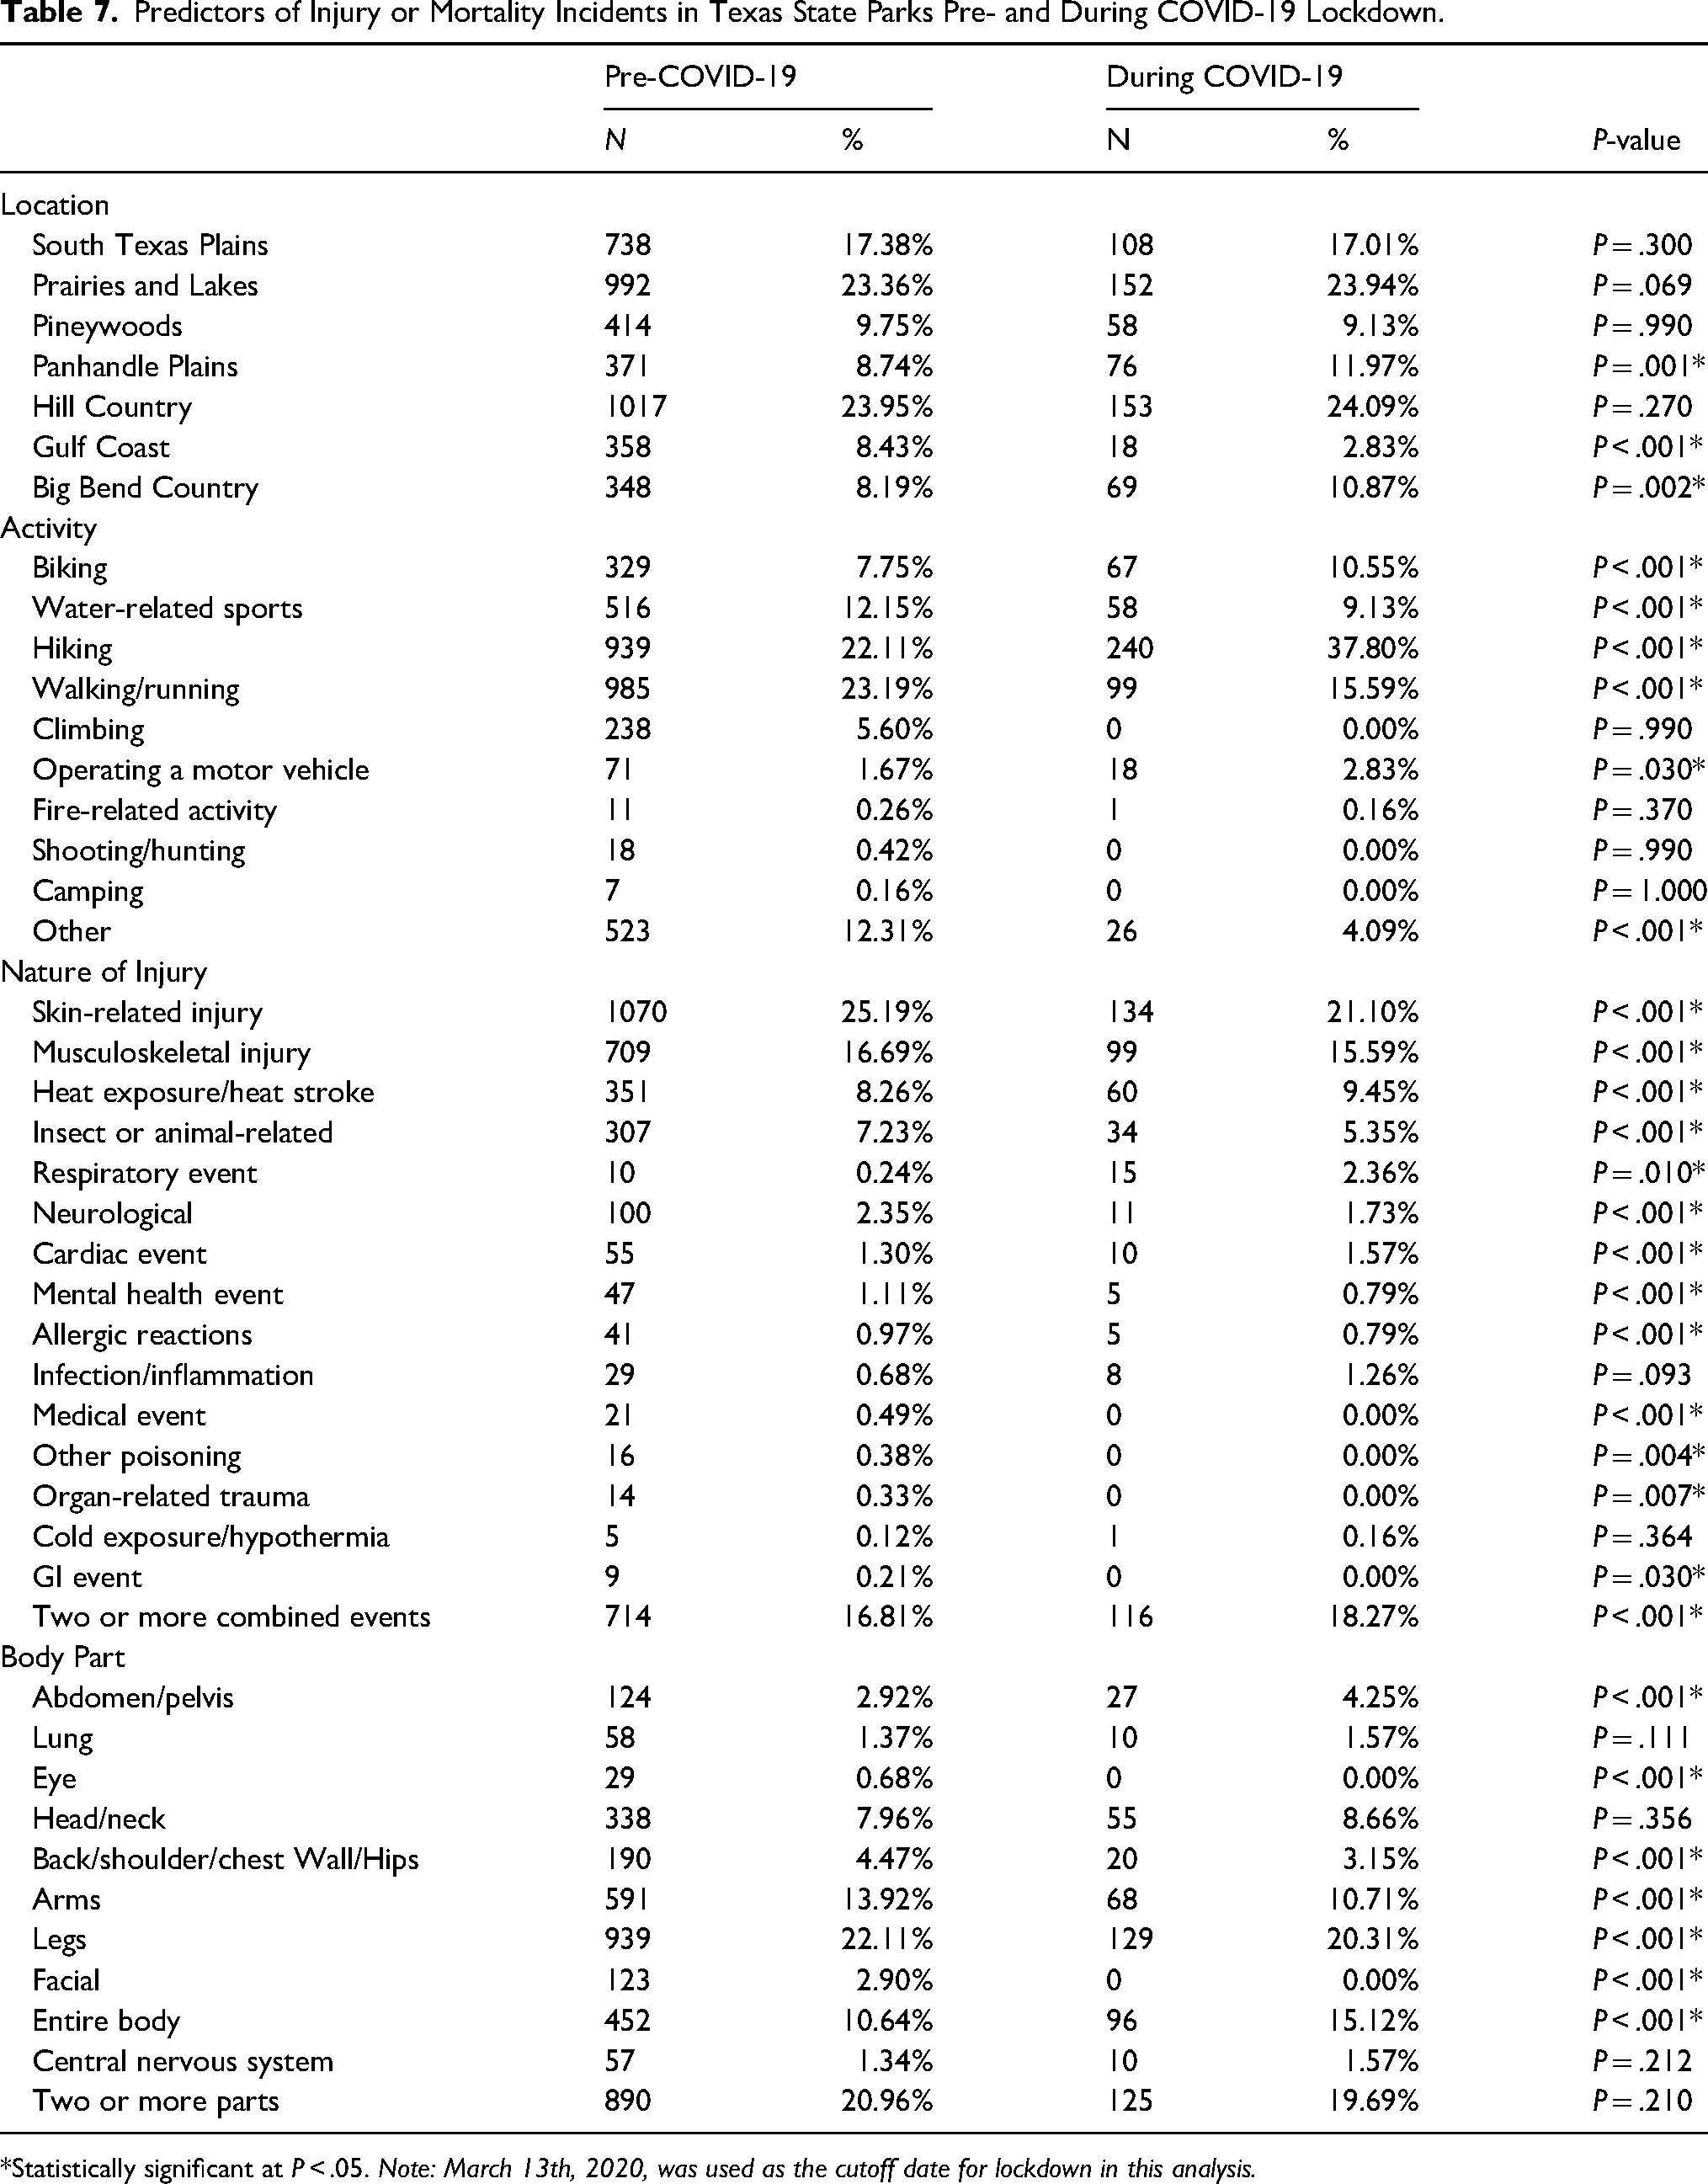
*Statistically significant at P < .05. Note: March 13th, 2020, was used as the cutoff date for lockdown in this analysis.
Multivariable Analysis of Injury and Mortality Predictors
Table 8 presents significant associations between the odds of injury and several covariates, including season, location, and certain activities. Odds of injury were significantly lower in spring (OR = 0.739, 95% CI: 0.570–0.960, P = .023) and winter (OR = 0.645, 95% CI: 0.478–0.871, P = .004) compared to summer.
Predictors of Injury Incidents in Texas State Parks.
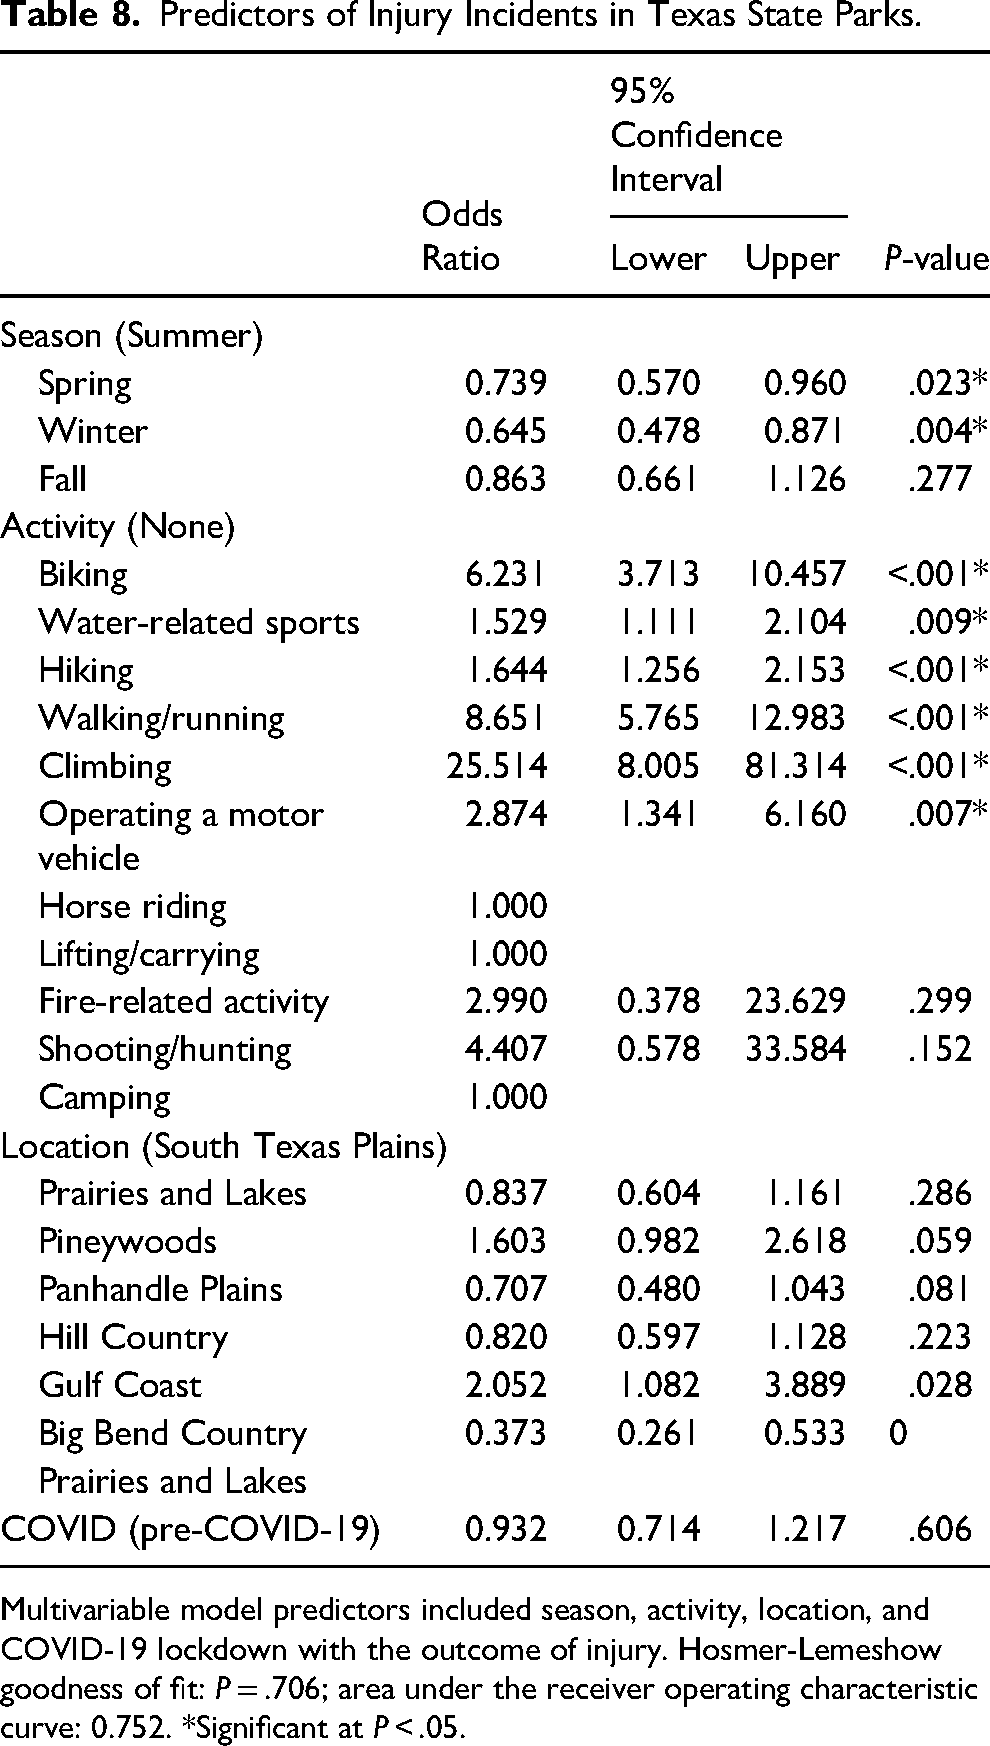
Multivariable model predictors included season, activity, location, and COVID-19 lockdown with the outcome of injury. Hosmer-Lemeshow goodness of fit: P = .706; area under the receiver operating characteristic curve: 0.752. *Significant at P < .05.
The highest odds of injury were among visitors who went climbing (OR = 25.14, 95% CI: 8.00–81.314, P < .001), followed by those who went hiking (OR = 8.65, 95% CI: 5.765–12.983, P < .001) or biking (OR = 6.23, 95% CI: 3.713–10.457, P < .001). Compared to park visitors in the Big Bend region, the highest odds of injury were in the Gulf Coast region (OR = 5.51, 95% CI: 2.885–10.509, P < .001).
Season and park location were not significant predictors of mortality (P > .05; Table 9). However, engaging in water-related sports increased the odds of mortality by threefold across Texas State Parks (OR = 3.25, 95% CI: 1.867–5.665, P < .001). In contrast, lower odds of mortality were observed for those who went hiking (OR = 0.481, 95% CI: 0.250–0.927, P = .029) or climbing (OR = 0.177, 95% CI: 0.070–0.447, P < .001) than those who did report engaging in any activity.
Predictors of Mortality Incidents in Texas State Parks.
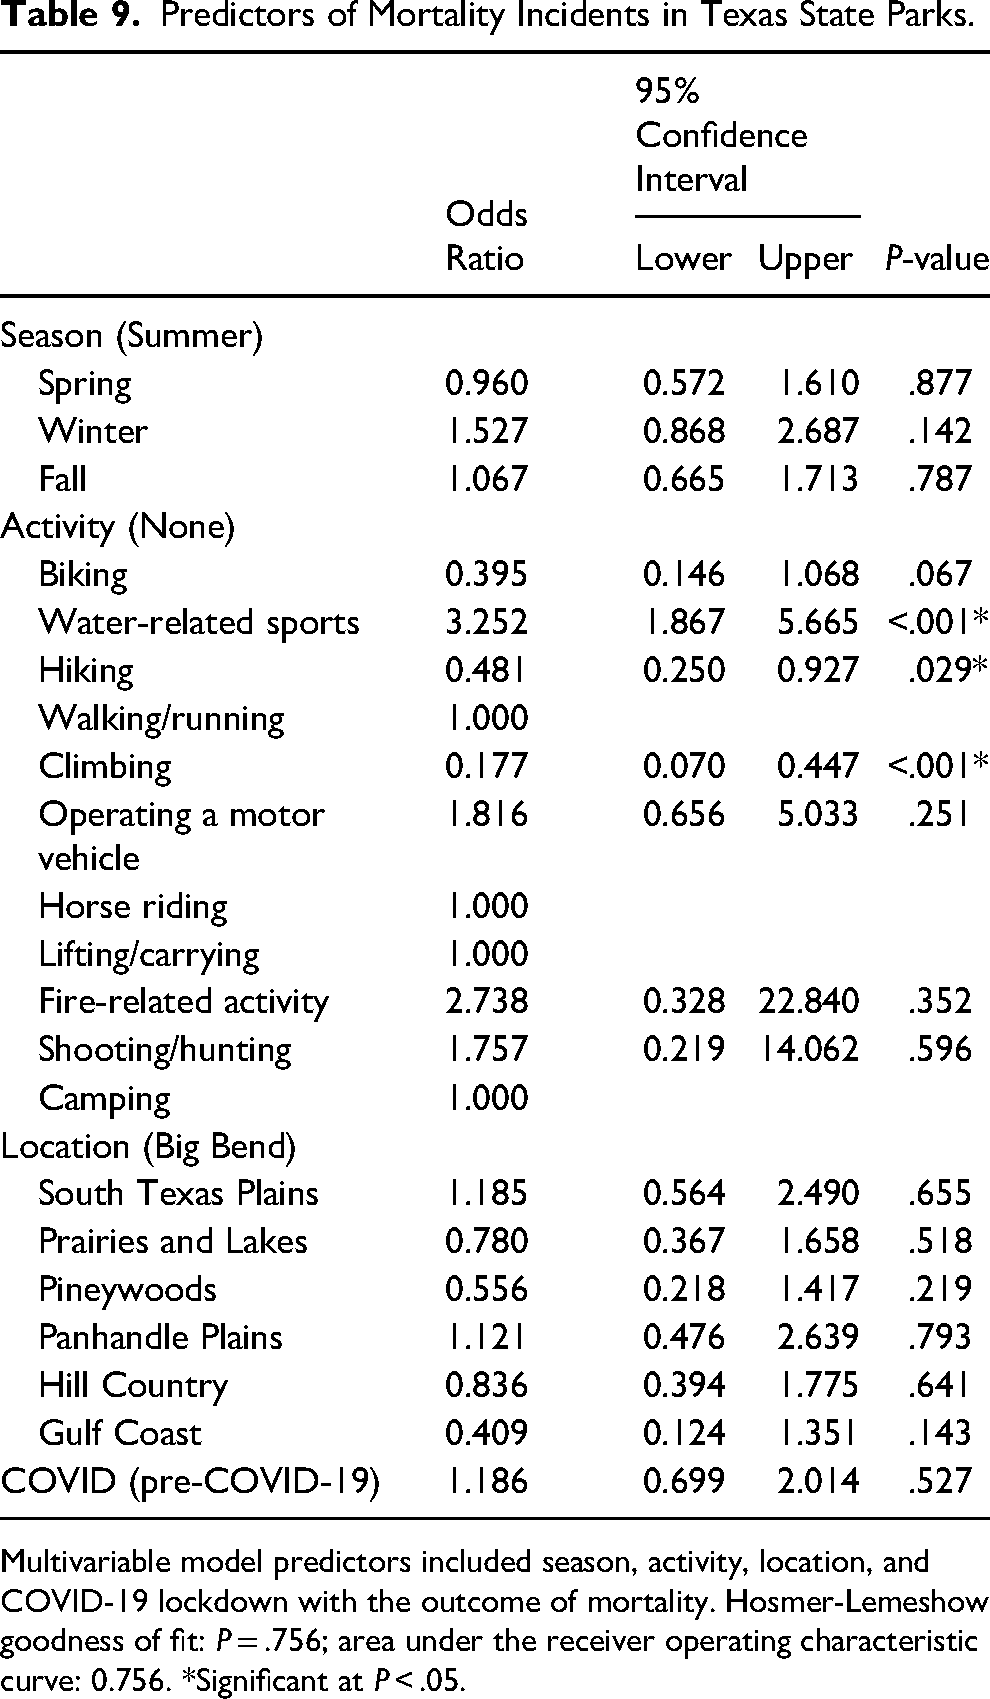
Multivariable model predictors included season, activity, location, and COVID-19 lockdown with the outcome of mortality. Hosmer-Lemeshow goodness of fit: P = .756; area under the receiver operating characteristic curve: 0.756. *Significant at P < .05.
Discussion
Prevalence and Incidence of Outdoor Recreational Injury and Mortality
This study evaluated the prevalence and characteristics of outdoor recreation–related injuries and mortalities in Texas state parks. Only per-visit data were available for analysis. Studies available for comparison contained retrospective data from regional search and rescue logs in Pima County in Arizona, 8 analysis of two Washington state 9 and eight California 6 national park incidence reports compared to visits, all National Park Service mortalities over two years, 10 and EMS activations over 4 years, 11 EMS activations in Shenandoah National Park, 12 New Hampshire Fish and Game Department wilderness search-and-rescue reports, 7 national emergency department visits with outdoor recreational injuries, 13 and analysis of British Columbia Trauma Registry for patients sustaining injuries while engaged in outdoor recreational activities. 14 In addition to the variations in data sources, it is important also to consider that the above regions represent a wide diversity of terrain, altitude, weather, demographics, and nature of outdoor recreational activities that limit direct comparisons.
Total number of injuries over this study period was 4401 with an injury rate of 5.20 per 100,000 visits over a nine-year period. For reference, emergency department visits due to outdoor recreation–related injury in the United States was 72.1 per 100,000 population in 2005 and 2006, 13 535 injuries were reported in Washington state national parks between 1997 to 2001, 9 9.2 injuries per 100,000 in California national parks between 1993 and 1995, 6 and 126 injuries (39.3%) of search and rescue victims in New Hampshire between 1999 and 2001. The lower reported-injury rate in the Texas state parks data compared to previous studies may be explained by improved services, education, and access to the outdoors in more recent years. The mortality rate over the study period was 0.15 per 100,000 visits. For context, reported mortality in other states was 2.24 per 100,000 visits in Washington state national parks 9 and 0.26 per 100,000 visits in California national parks. 6 Direct comparisons are not possible due to the different time periods, geography, weather, activities, and nature of databases used in these studies. Additionally, it is important to put into context that outdoor recreation morbidity and mortality are uncommon. The overall incidence of fatalities in the National Park Service from 2007 to 2011 was approximately 1 death for every million visitors. 10 In addition, outdoor recreation in a university-sponsored program was safer than traditional college sports, even when high-contact sports were excluded from the comparison. 15 An analysis of 1206 teenage scouts showed an overall injury rate of 7%, with less than 1% of participants requiring advanced medical care beyond first aid. 16 Another outdoor expedition program demonstrated no mortalities over 59,058 person-days with 2.42 medical events, including 1.27 medical evacuations per 1000 person-days. 17
Causes and Characteristics of Outdoor Recreational Injury and Mortality
Comparing the leading causes of injury and mortality and the activities leading to them is important for identifying national and regional trends that may be used to improve resource utilization and prevent injuries. In this study, hiking (n = 1112, 24.3%) and walking/running (n = 1078, n = 23.6%) were the leading preinjury activities, followed by water sports (n = 533, 11.6%). The leading preinjury activities in Washington state national parks were hiking (55%) and winter sports (15%), 9 while in California they were hiking (29.3%) and skiing/snowboarding (5.1%). 6 Hiking was also the most common activity (57.3%) resulting in wilderness search and rescue in New Hampshire. 7 In British Columbia, the leading causes of outdoor injury were cycling (31%), all-terrain vehicle operation (30%), and horseback riding and snowmobiling (22% each). 14
The most common injuries in this study were skin-related injuries (n = 1194, 27.1%%), musculoskeletal injuries including fractures or dislocations (n = 804, 18.3%%), heat exposure or heat stroke (n = 393, 8.9%), and stings or animal bites (n = 341, 7.7%). Nationally, fractures (27.4%) and sprains or strains (23.9%) were the leading causes of emergency room visits due to outdoor recreational injuries. 13 Fractures and soft tissue injuries, including skin lacerations, strains, and sprains, were also the leading injuries in other states.6,7,9 In this study, extremities were the most frequently injured body part. This is similar to patterns observed in other studies, with extremity injury being the most common injury site.12,14,16,17 As in prior research, water sports (n = 52, 42.6%) and hiking (n = 20, 16.4%) were the most likely activities to precede mortality in this study. In Washington State Parks, hiking (58%) and mountaineering (26%) were most likely to lead to mortality. 9 In New Hampshire, water-related activities (37.5%) and hiking (25%) were the leading pre-mortality activities. 7 While hiking is the most common preinjury or pre-mortality activity in all studies reviewed, the second most common causes vary, highlighting the importance of understanding regional variations and terrains to better tailor education programs for field staff and prevention efforts in state parks. In one study, National Park Service mortality was most commonly related to transportation-related activities (26%), water-based activities (23%), and land-based activities (18%). 10 This difference in causes of mortality may be related to improvements in motor vehicle safety since this study was conducted in 2004, the different nature in databases, or both.
The leading causes of mortality in this study were respiratory events (including drowning) (n = 46, 37.1%); it is likely that all respiratory incidents resulting in mortality were drowning as described in Table 3, cardiac events (n = 13, 10.5%), and heat exposure/heat stroke (n = 9, 7.3%). This is comparable to previously reported causes of mortality in outdoor recreation.6–9
Seasonal Variation
Over a third of incidents (n = 1877, 38.4%) occurred during the summer months. This is similar to the pattern observed in Washington State national parks, with most recreational injuries occurring during the summer months, 9 and the National Park Service experiencing peak mortality in the summer months. 10 This could be explained by increased utilization during vacations and the summer months being the peak time for outdoor recreational activities.
Effects of the COVID-19 Pandemic and Lockdown
Texas state parks witnessed a 144% increase in visitors after COVID-19 lockdown, with a proportionate 152% increase in injury rate. This is similar to a study showing an increase in pediatric hospital admissions with outdoor recreational outdoor injury during the COVID-19 lockdown. 18 However, it is important to note COVID-19 lockdowns were associated with decreased mental well-being in adolescents, which was largely counteracted by outdoor recreation. 19 Therefore, increased rates of injury that are likely due to increased utilization of outdoor spaces should not be used to justify reduced access but rather to increase preparedness during lockdowns or similar events.
Limitations of This Study and Recommendations for Future Outdoor Injury and Mortality Surveillance
This TPWD database has several advantages, including a detailed description of injury causes, nature, location, mortality, and other valuable details. This provides valuable information and insights into outdoor injury and mortality. Future efforts should consider collecting data related to age group, race, ethnicity, gender, injury time, pre-existing comorbidities, and whether the incident was associated with alcohol use. Male gender and alcohol use are commonly associated with outdoor injury and mortality20,21 and nighttime activities. 20 Another study showed a similar distribution of EMS activations between males and females, but males were more likely to have traumatic injury, whereas in females, the EMS activation was more likely illness-related. 12 Male victims were more likely to use snowmobiles while female victims were more likely to use horses in one study. 14 Age is another important factor, and it is common to see a bimodal distribution with age as it relates to outdoor recreation injury, with young adults and older adults representing the two peaks in incidence with variations in activity types too.10,14 Trauma caused 29% of National Park Service mortalities, whereas medical events caused 28%. 11 In another study in one national park, EMS activations due to medical (nontraumatic) causes went up from 27.9% in victims without significant medical history to 61.6% in those with significant medical history, 12 which demonstrates the importance of collecting data about preexisting comorbidities.
Additional limitations may include the retrospective nature of this study and not tracking the outcome of the incidents after evacuation outside the park, which may lead to missing some mortalities. Additionally, this study did not evaluate the impact of changes in available resources over the study period. This includes improvements in safety programs, training, outdoor gear, connectivity, and smart devices, which may all have impacts that were not measured by this study.
Conclusions
This is the first study to evaluate outdoor recreational injuries in the state of Texas. While the results are limited by the nature of the database used and the absence of demographic features, the findings are valuable as they uncover important trends about the nature of injuries and regional and seasonal variations. This report and other similar reports should not detract from the excellent safety profile of outdoor recreation and should be used to glean insights for the continued development of prevention and education efforts.
Footnotes
Author Contribution(s)
Declaration of Conflicting Interests
The author(s) declared no potential conflicts of interest with respect to the research, authorship, and/or publication of this article.
Funding
The authors received no financial support for the research, authorship, and/or publication of this article.