
Abstract
Introduction
Musculoskeletal (MSK) injuries in US trail sports are understudied as trail sport popularity grows. This study describes MSK injury patterns among hikers, trail runners, and mountain bikers from 2002 through 2021 and investigates MSK injury trends acquired during mountain sports.
Methods
The National Electronic Injury Surveillance System (NEISS) was used to identify US emergency department (ED) patients from 2002-2021 (inclusive) who endured MSK injuries during hiking, trail running, or mountain biking. Injury rates and national estimates were calculated across demographics.
Results
9835 injuries were included (48.4% male, 51.6% female). Injuries increased over time, with 1213 from 2002-2005 versus 2417 from 2018-2021. No sex differences existed before 2010, after which female injury rates exceeded those of males. The following findings were statistically significant, with P<0.05: females endured more fractures and strains/sprains; males endured more lacerations; concussions and head injuries were higher among those <18 y; dislocations and strains/sprains were higher for 18 to 65 y; fractures were higher for >65 y; <18 y had high mountain-biking and low running rates; 18 to 65 y had high running rates; and >65 y had low biking and running rates. Although all diagnoses increased in number over time, no significant differences existed in the proportion of any given diagnosis relative to total injuries.
Conclusions
MSK injuries during trail sports have increased since 2002. Males endured more injuries until 2009, after which females endured more. Significant sex and age differences were found regarding injury diagnosis and body parts. Further studies are needed to confirm these trends and their causes.
Introduction
Trail sports are popular sources of recreational activity, with participation increasing over the past 2 decades.1–3 More than half of the US population participates in outdoor activities, and the US National Park Service saw a nearly 20% rise in annual recreation visits over the past 15 y.4–6
With trail-sport participation comes injury risk. One study found that 5.2 per 100 000 Yellowstone visitors were injured between 2003 and 2004. 7 Although studies have reported mortality rates among summer mountain sports 8 and injury patterns for specific trail activities (eg, hiking) or locations, 9 literature is lacking regarding musculoskeletal-specific (MSK-specific) injury patterns across various summer mountain and trail sports throughout the United States.
The aim of this study was to describe MSK injury patterns and prevalence in the United States due to hiking, trail running, or mountain biking (herein referred to as “trail sports”). Given that NEISS is limited to the past 2 decades, we included all available data from 2002 to 2021.
Methods
Data source
We retrospectively reviewed the National Electronic Injury Surveillance System (NEISS) database from the US Consumer Product Safety Commission. NEISS collects and reports data on injuries related to consumer products. 100 hospitals across the United States contribute data, serving as a representative sample of all US hospitals with emergency departments (EDs).10,11 Limitations of NEISS include time constraints to only the preceding 2 decades, possibility that the selected sample and its national estimates do not accurately represent national data, and limited product codes under which to categorize injuries, which could lead to inconsistent injury categorizations. 12
Reported parameters include age, sex (male, female, nonbinary/other), race, Hispanic ethnicity status, injured body part and diagnosis, injury location, fire involvement, use of substances surrounding incident, product code, narrative description, and statistical weight for national estimates. Existing studies have used NEISS to describe activity-specific injury patterns and report epidemiological trends among US EDs.13–19 Specifics regarding the source of NEISS data and updates are available through the US Consumer Product Safety Commission website. 10
Because this database includes publicly accessible, de-identified data that are freely published through a government website, this study was exempt from review through the institutional review board.
Data extraction
We first filtered data by diagnosis code (ie, injury type). Included codes were 50 (amputation), 52 (concussion), 53 (contusions, abrasions), 54 (crushing), 55 (dislocation), 57 (fracture), 59 (laceration), 61 (nerve damage), 63 (puncture), and 64 (strain, sprain).
To narrow the sample to trail sports, we filtered by the following product codes: exercise without equipment (code 3299); and two-wheeled, powered, off-road equipment (code 5036). 20 We applied a formula in Microsoft Excel (Version 16.59, Microsoft, Redmond, WA) to search narratives for terms related to “hiking,” “running,” “jogging,” or “biking” that co-occurred with “mountain” or “trail.” This formula included wildcards to control for misspellings and reduce missed data. Narratives that included terms related to biking, running, or jogging with no mention of “trail” or “mountain” were excluded.
This process was repeated for each annual report from 2002 to 2021. Data were organized into the following subgroups: year (2002-2005, 2006-2009, 2010-2013, 2014-2017, 2018-2021), activity (hiking, running, biking), sex (male, female; no nonbinary/other data), and age (<18 y, 18-65 y, >65 y).
Statistical analysis
Analyses were based on previous published studies that used NEISS. 21 The svyset Stata function (SE 17.0, StataCorp LLC, College Station, TX) was used to calculate national estimates, 95% confidence intervals, and adjusted Wald tests with weighted survey data. Data were present in weighted calculations, and subpopulation analyses were used to compare observations. 22
Results
Only statistically significant (P<0.05) results are reported.
Characteristics by sex
9835 total injuries were included (4725 [48.4%] males, 5110 [51.5%] females). From this sample, the national estimate was 1,146,630 total MSK injuries attributable to trail sports. Injuries increased over time, from 1213 in 2002-2005 versus 2417 by 2018-2021. Females had higher injury rates from 2010-2013, 2014-2017, and 2018-2021, with no sex difference before 2010 (Table 1, Figure 1). Female injury rates were higher than those of males in the 18-65 y and >65 y groups, with no sex difference in the <18 y group. Among Whites and American Indian/Alaskan Natives, females had higher injury rates. Females also had higher injury rates among the ethnicity subgroup “Not Hispanic” (Table 1).
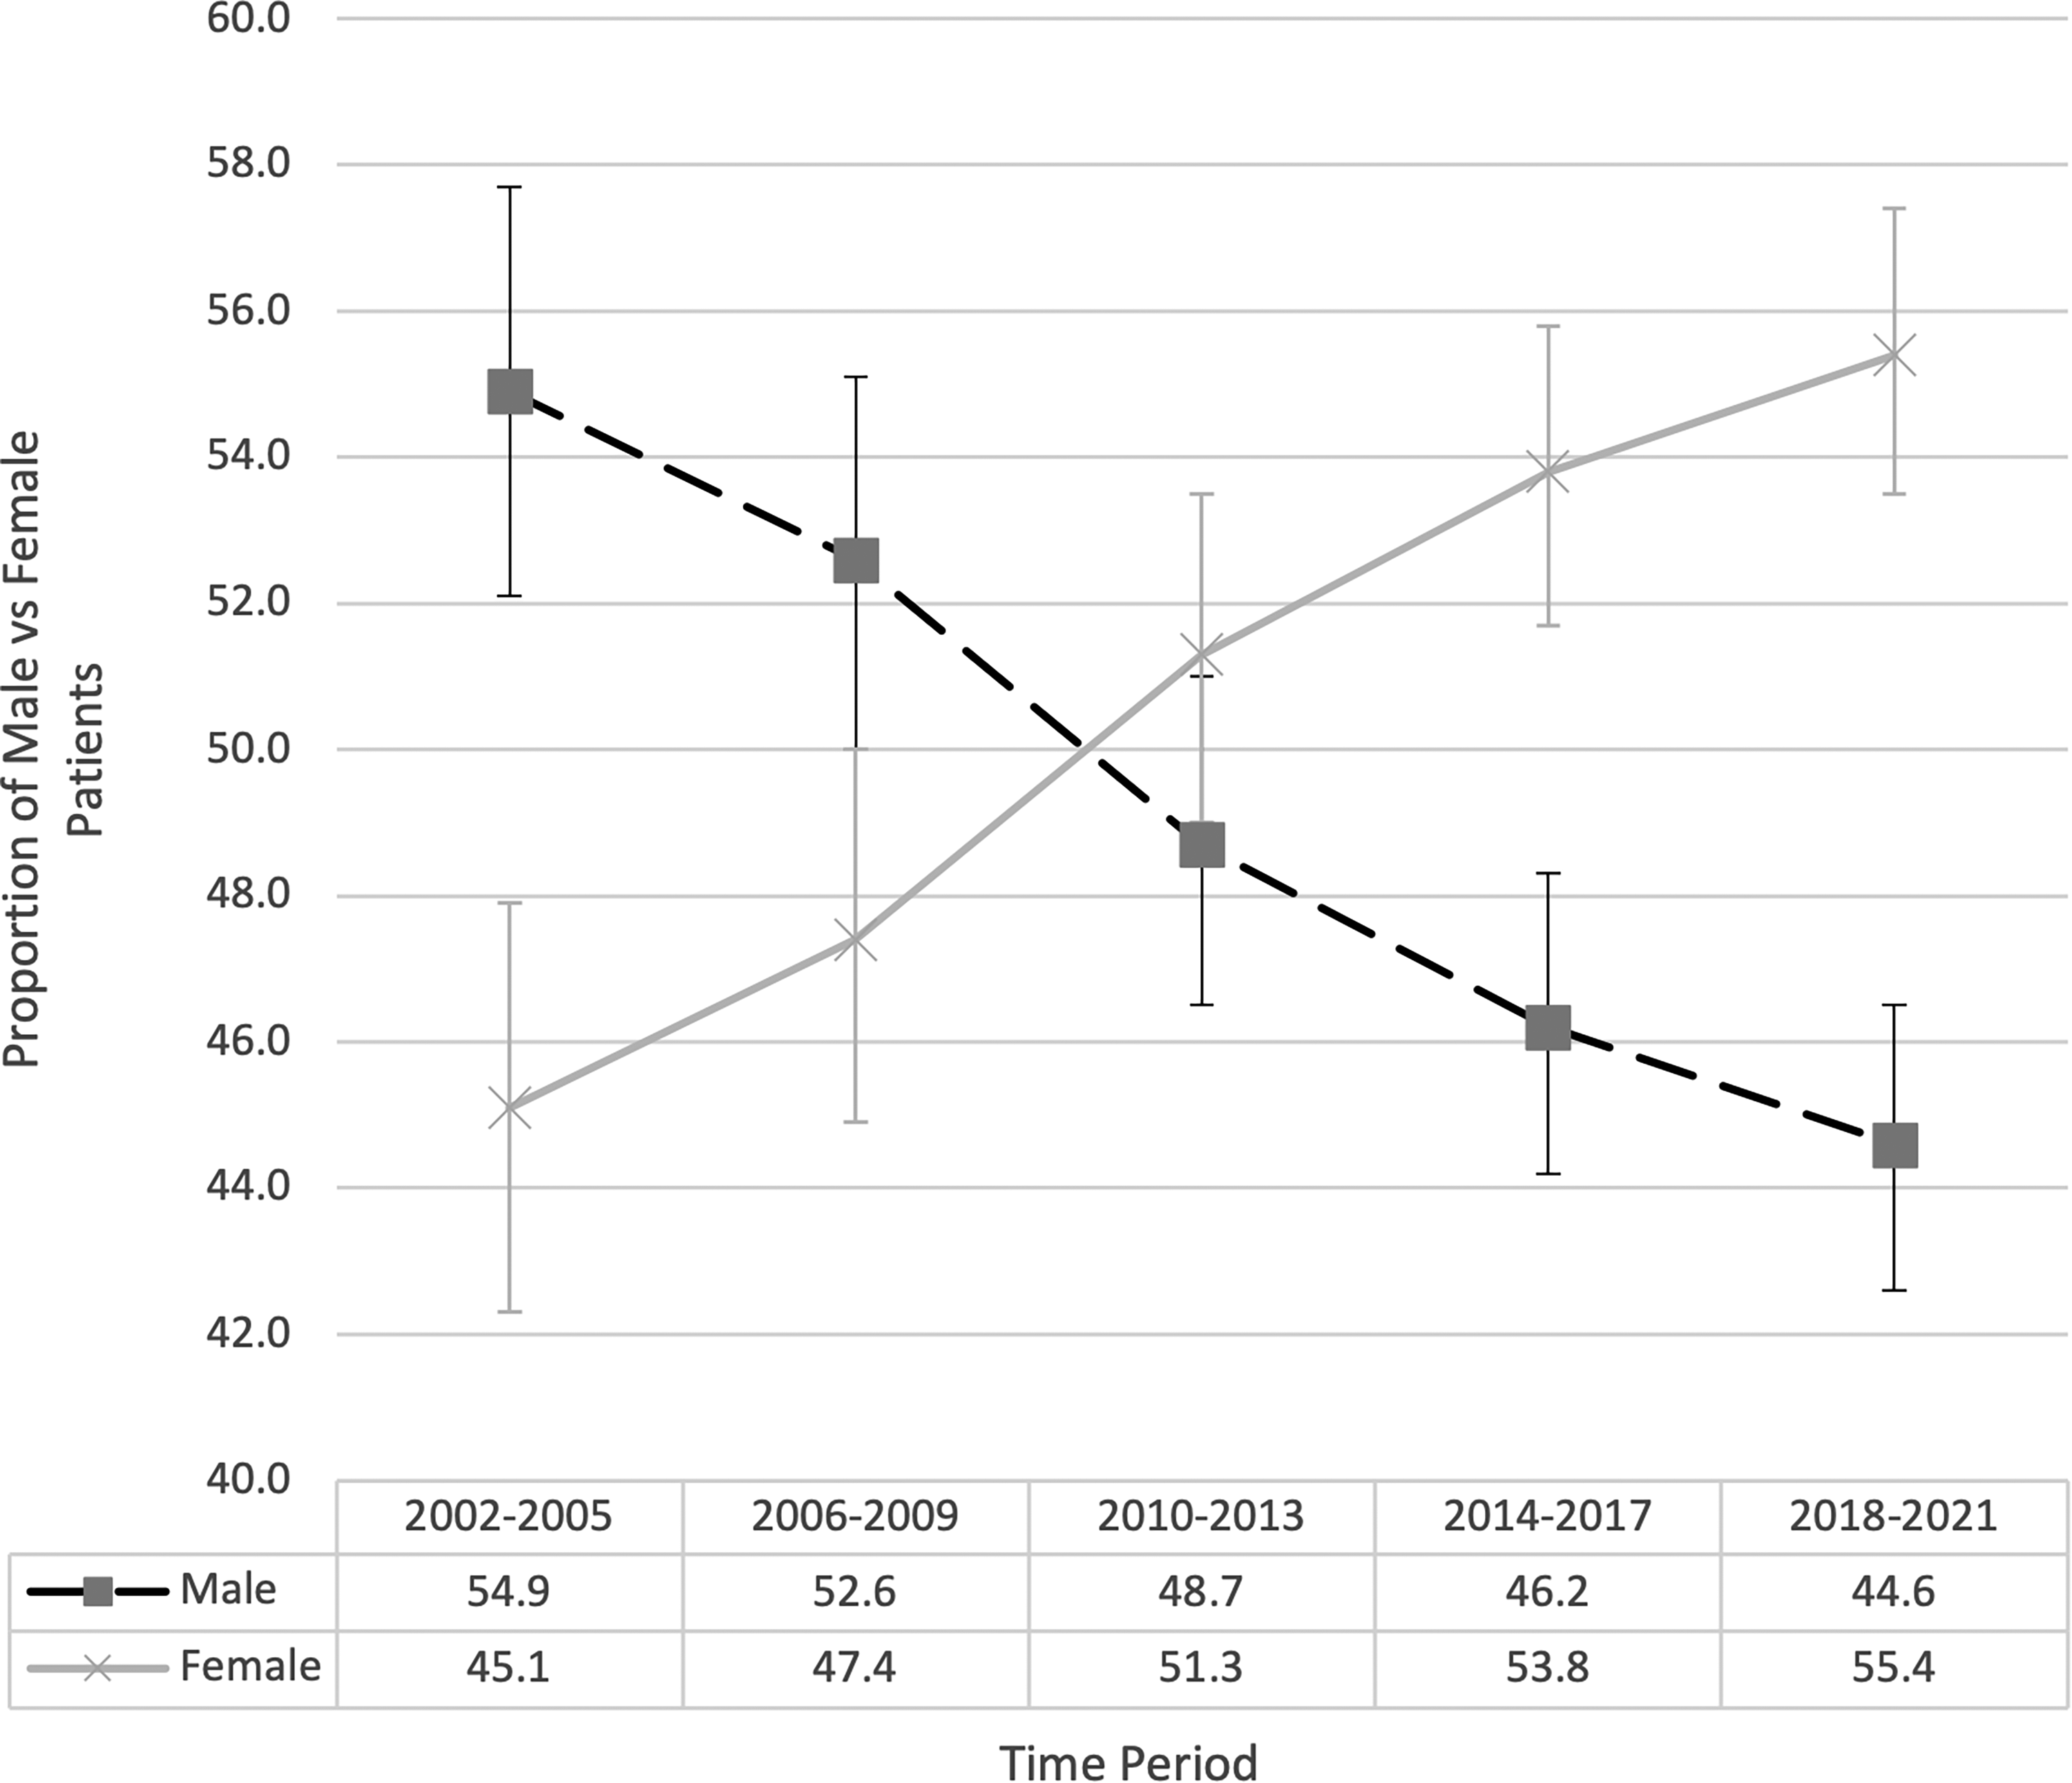
Total number of MSK trail sport injuries presented to US EDs by sex, 2002-2021.
Demographics.
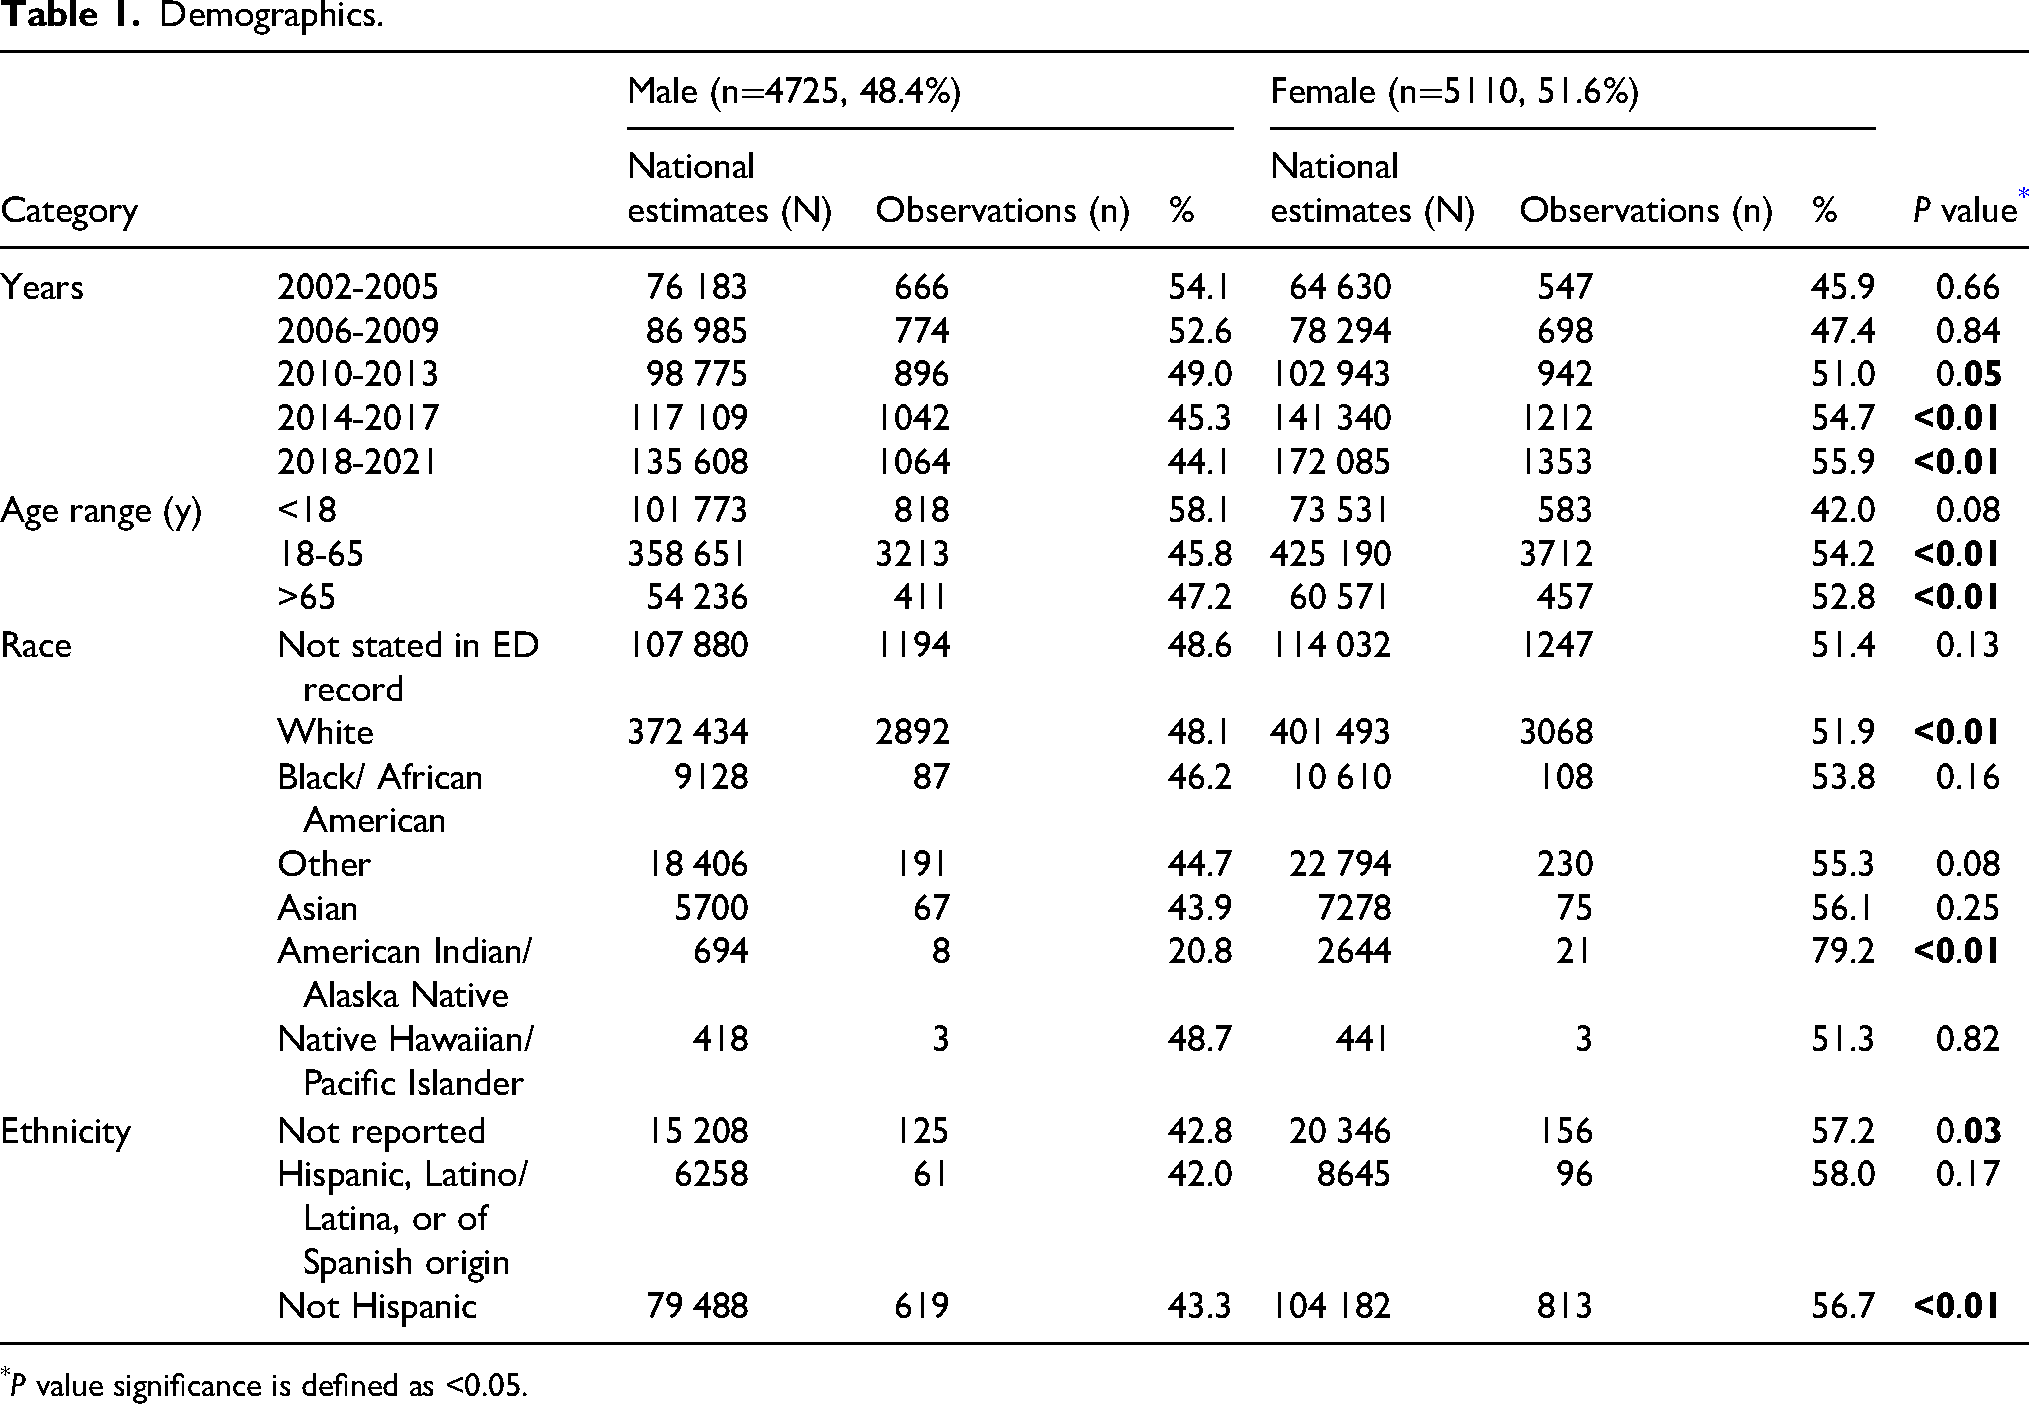
P value significance is defined as <0.05.
Outdoor activity participation exhibited racial disparities, with 72% of participants identifying as White in 2021. 23 Therefore, observed sex differences may not accurately represent female injury trends for underrepresented groups.
Injury patterns
Trail running had a higher rate of injuries from 2002-2005 compared to its nationally estimated proportion of total injuries. Mountain biking accounted for a lower proportion of injuries from 2014-2017 and 2018-2021, as did hiking from 2014-2017 (Table 2).
Total number of injuries by activity type over time.
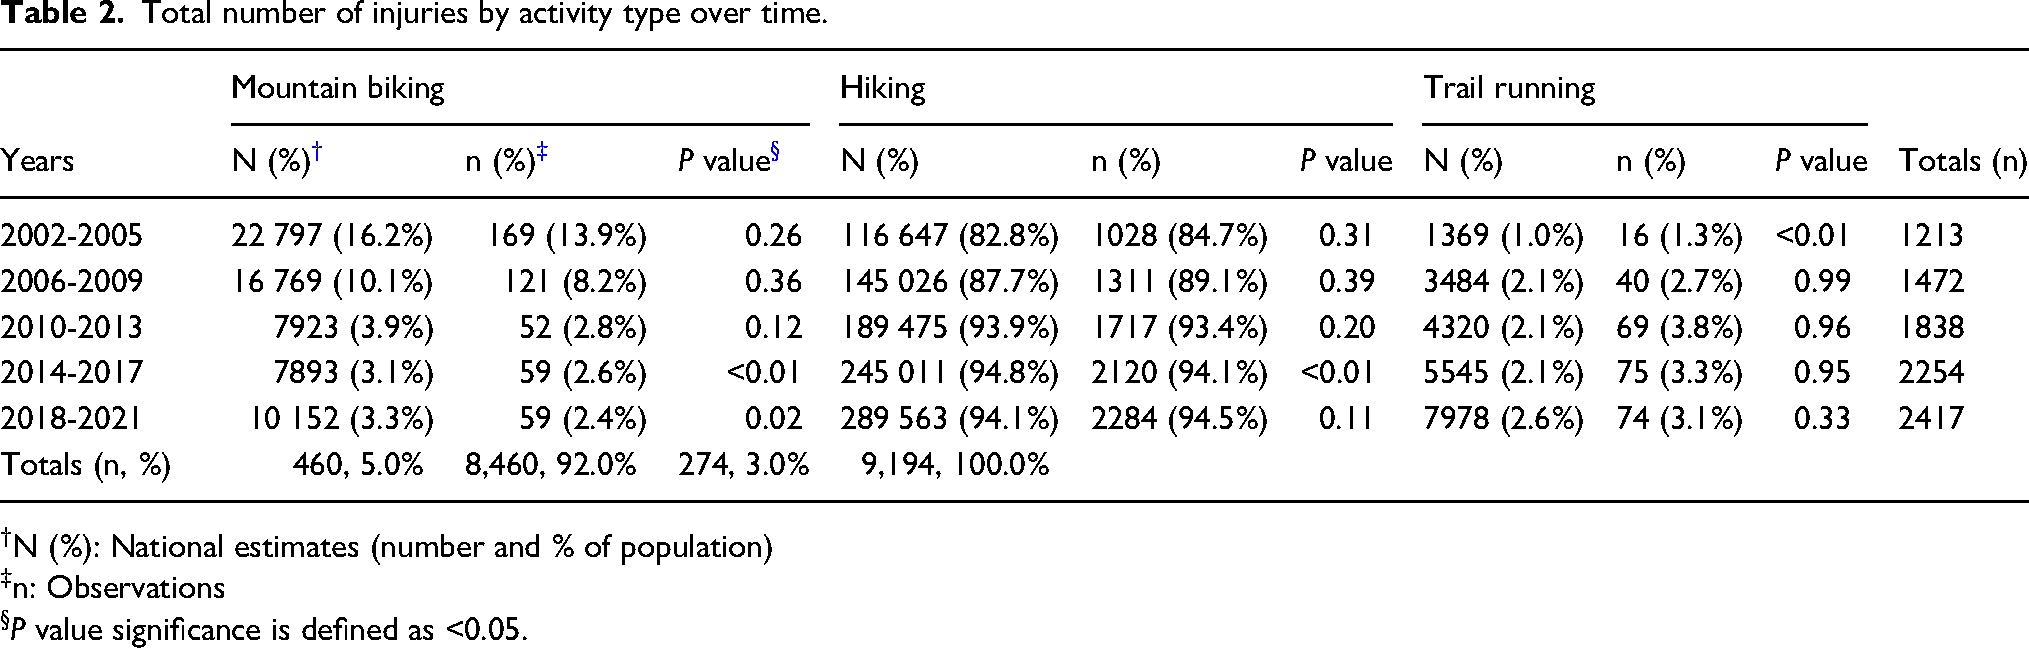
N (%): National estimates (number and % of population)
n: Observations
P value significance is defined as <0.05.
Males were more likely to endure shoulder, upper trunk, and hand injuries, whereas females were more likely to endure elbow, wrist, knee, lower leg, or ankle injuries. Females were more likely to sustain strain/sprains and fractures, whereas males were more likely to sustain lacerations. Females were also more likely than males to be treated, examined, and released versus admitted or transferred to a higher level of care (Table 3).
Injury characteristics by sex.
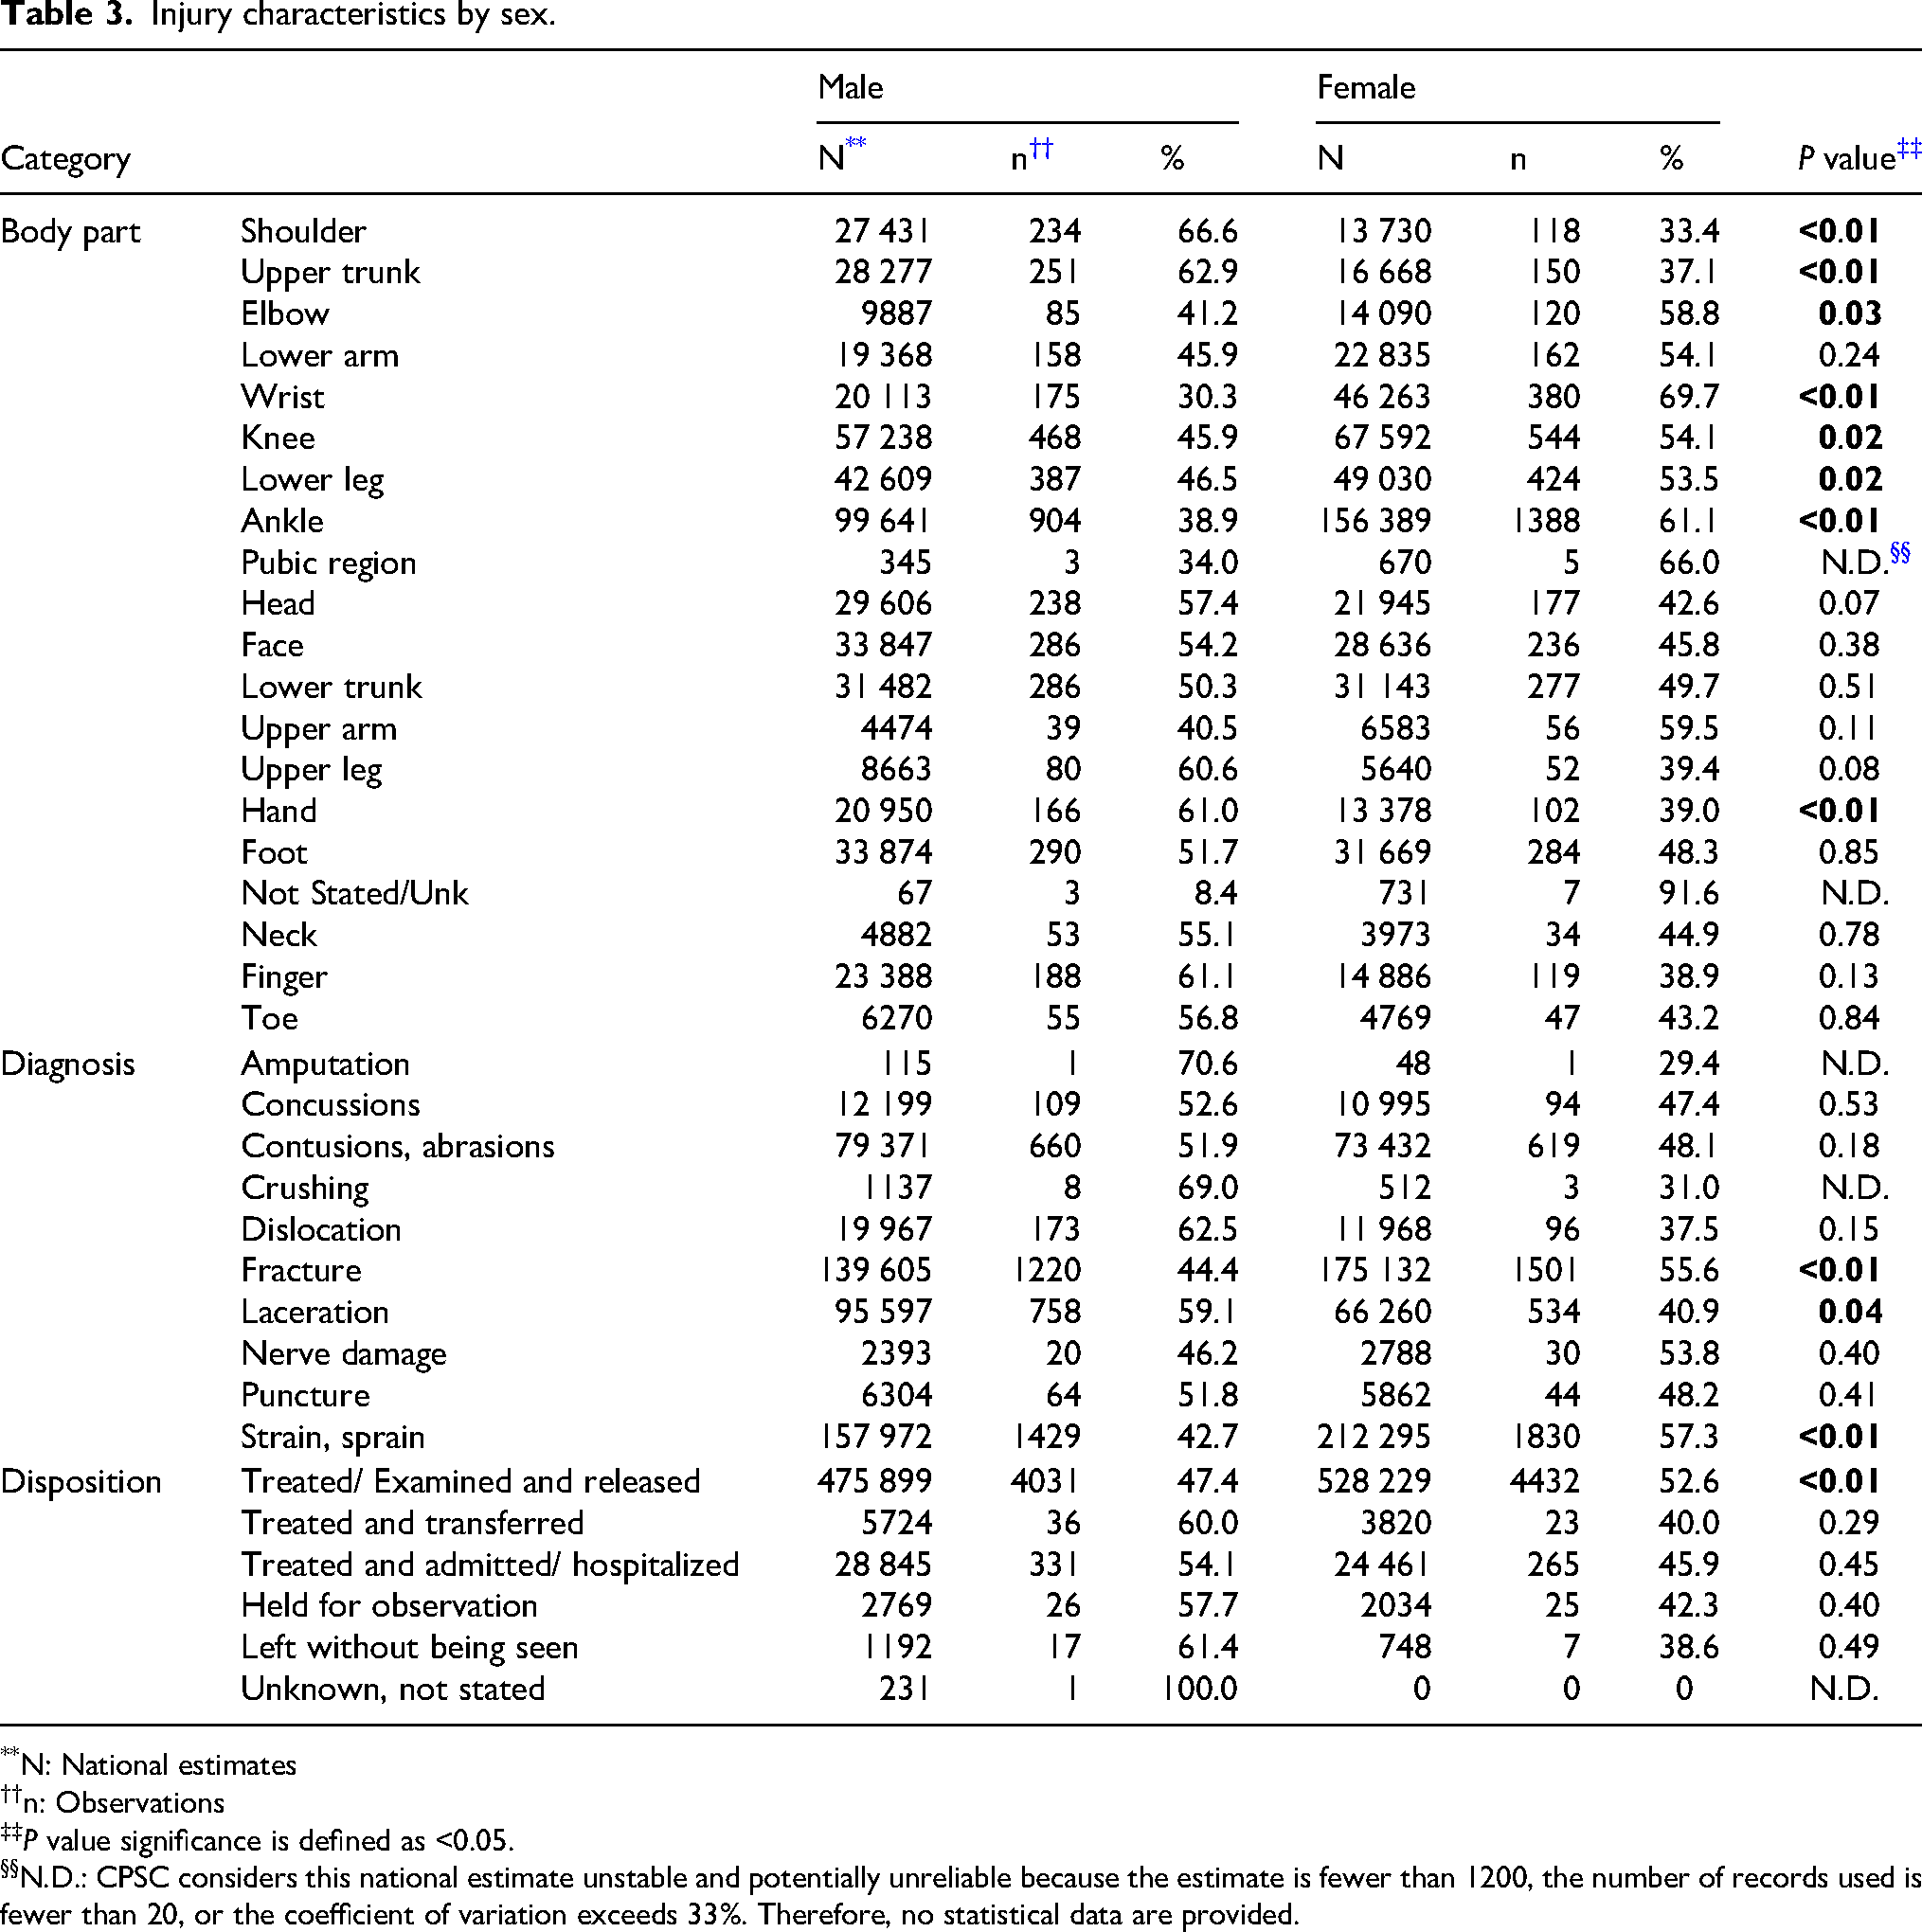
N: National estimates
n: Observations
P value significance is defined as <0.05.
N.D.: CPSC considers this national estimate unstable and potentially unreliable because the estimate is fewer than 1200, the number of records used is fewer than 20, or the coefficient of variation exceeds 33%. Therefore, no statistical data are provided.
The >65 y group comprised a lower proportion of the injured cohort than expected from 2002-2005 and 2006-2009, whereas the 18-65 y group had a higher proportion from 2006-2009. Among females, the <18 y group comprised a lower proportion of the injured cohort than expected, whereas the 18-65 y group had higher than expected rates (Table 4).
Characteristics and injury patterns by age.
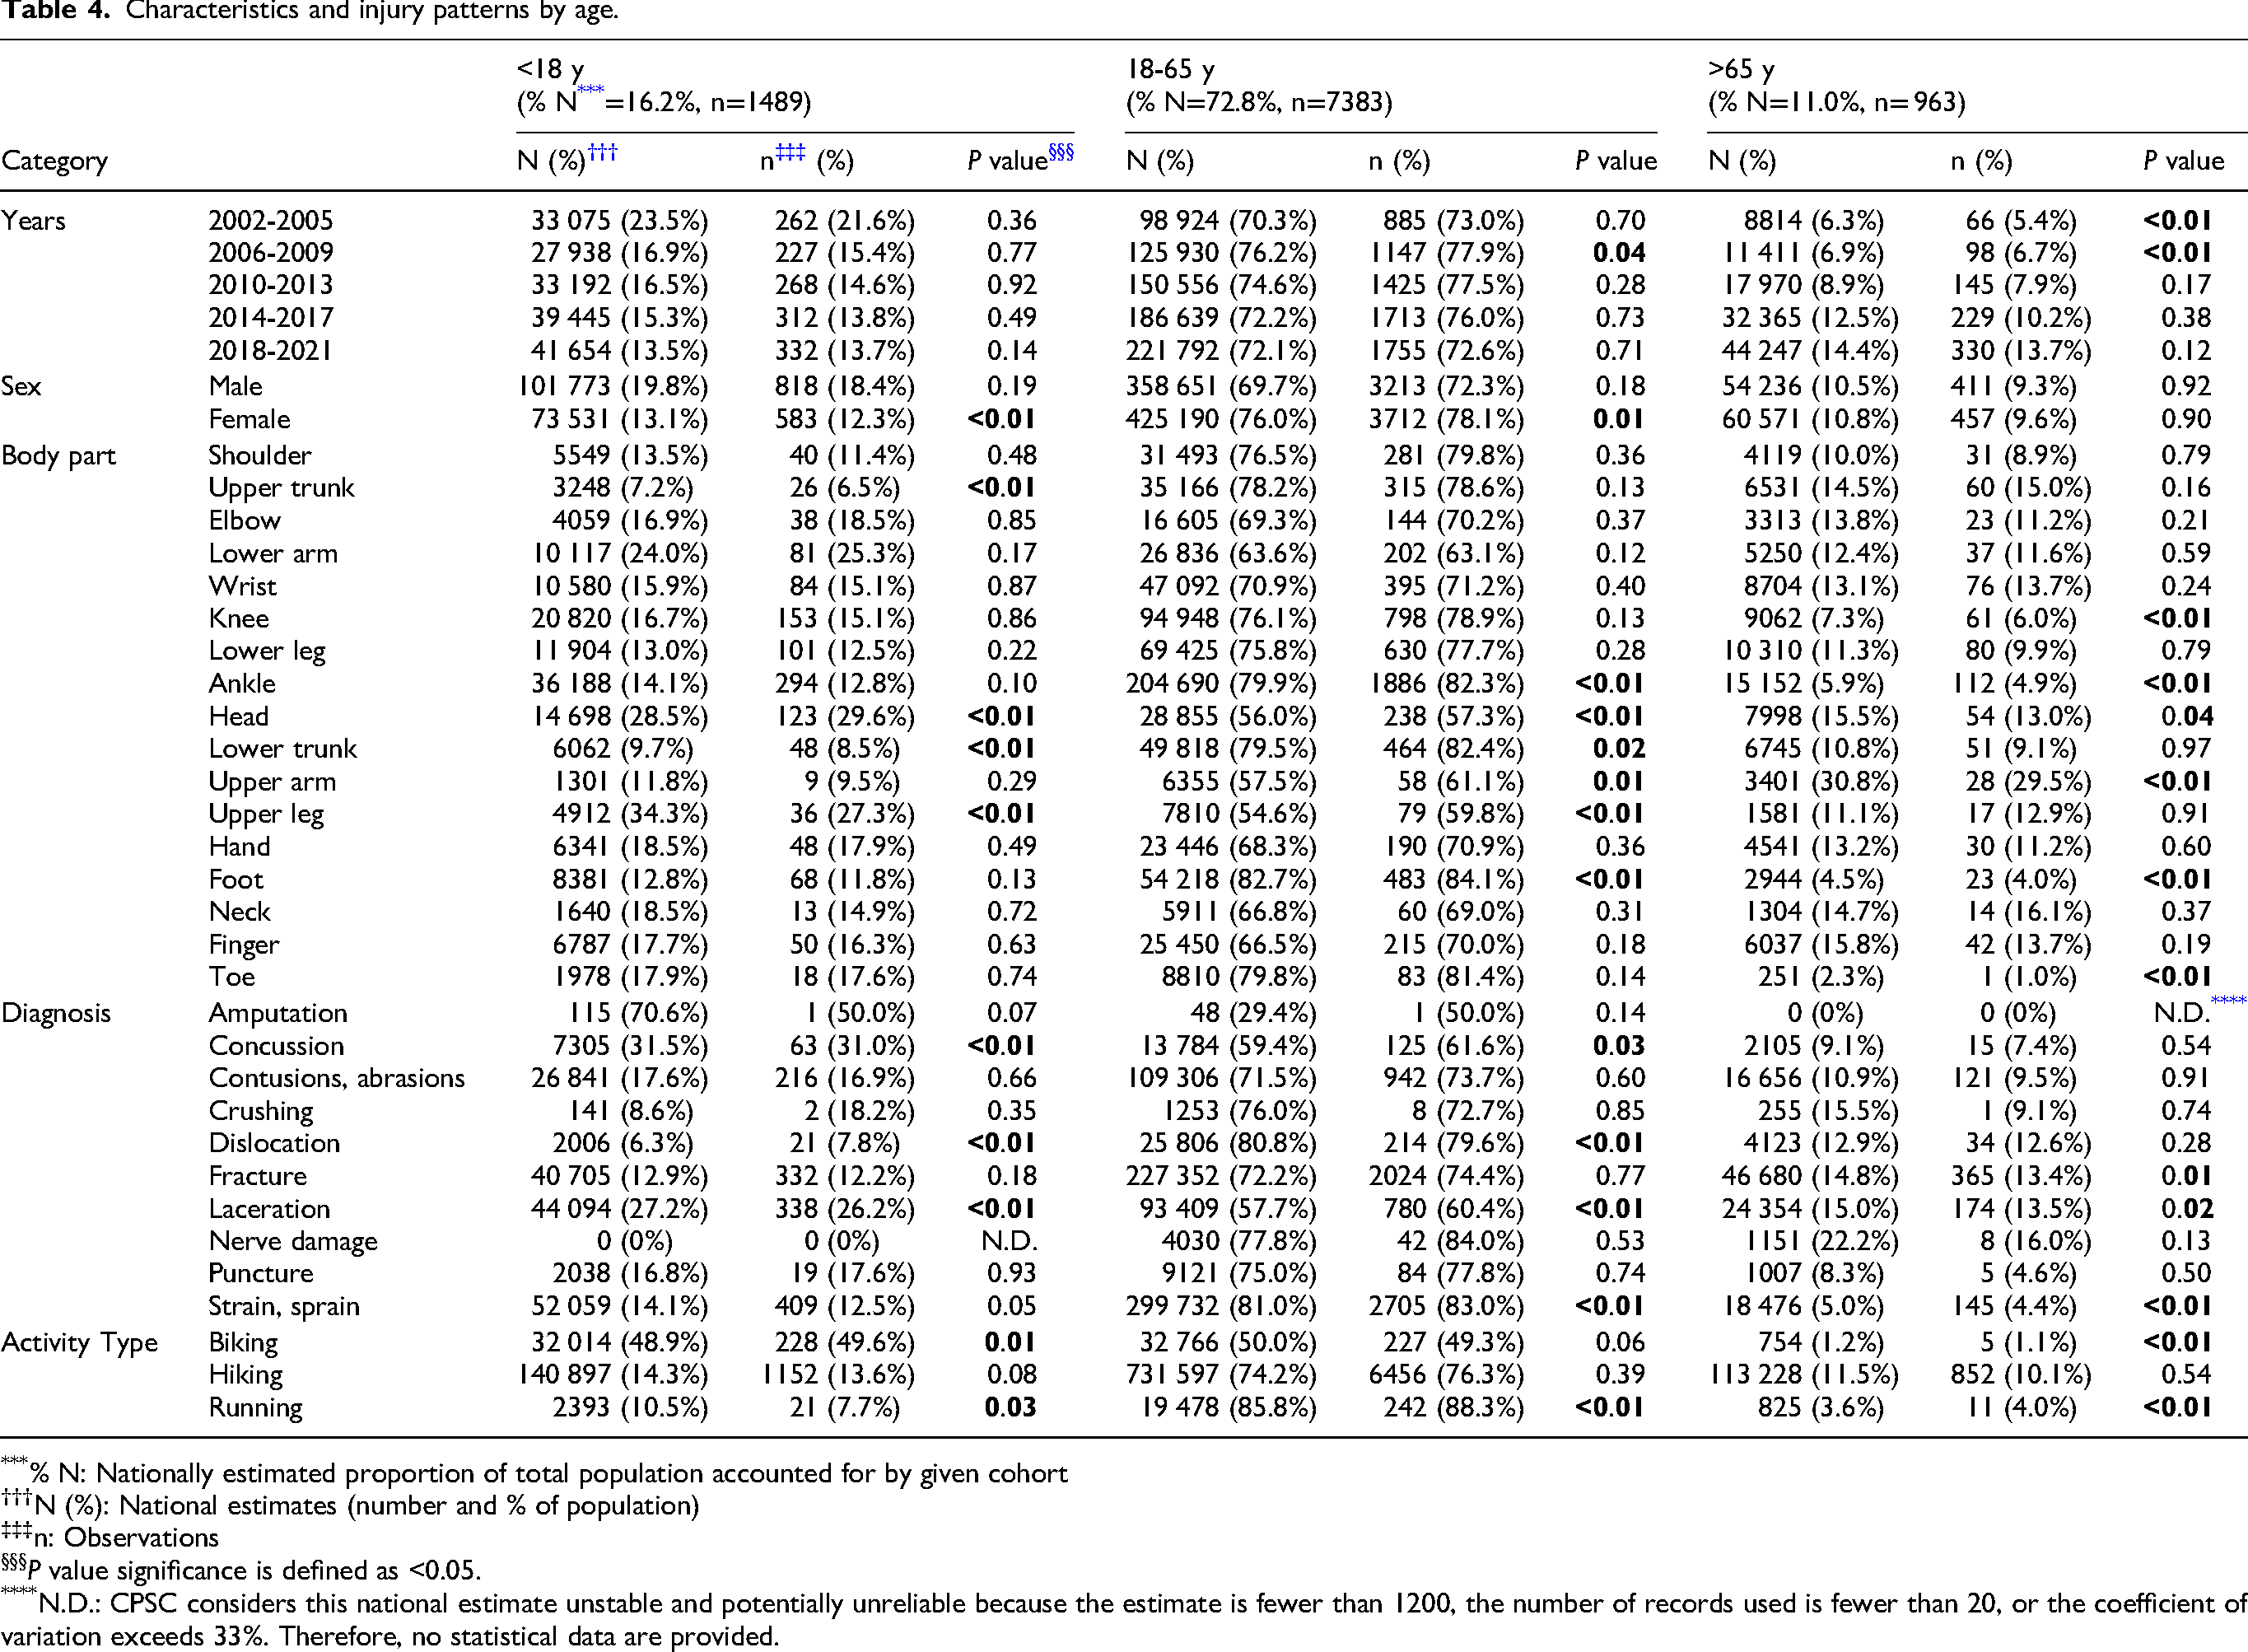
% N: Nationally estimated proportion of total population accounted for by given cohort
N (%): National estimates (number and % of population)
n: Observations
P value significance is defined as <0.05.
N.D.: CPSC considers this national estimate unstable and potentially unreliable because the estimate is fewer than 1200, the number of records used is fewer than 20, or the coefficient of variation exceeds 33%. Therefore, no statistical data are provided.
The <18 y group had low rates of upper trunk and lower trunk injuries, whereas they had high rates of head and upper leg injuries. Those 18-65 y had low head, upper arm, and upper leg injury rates, whereas they had high rates of ankle, foot, and lower trunk injuries. The >65 y group had low rates of knee, ankle, foot, and toe injuries, versus high head and upper arm injury rates (Table 4).
Those <18 y had high rates of concussions and lacerations, versus low rates of dislocations. The 18-65 y age group had a high rate of dislocations and strains/sprains, versus low rates of concussions and lacerations. The >65 y age group had high rates of fractures and lacerations, versus low rates of strains/sprains. Regarding activity type, biking participation rates among those <18 y were higher than expected, whereas running participation rates were lower than expected. For those 18-65 y, running participation rates were higher than expected. Biking and running participation rates for those >65 y were lower than expected (Table 4).
Although all injury diagnoses increased over time, the proportion of injuries accounted for by one diagnosis did not change significantly (Table 5).
Total number of injuries by diagnosis over time.
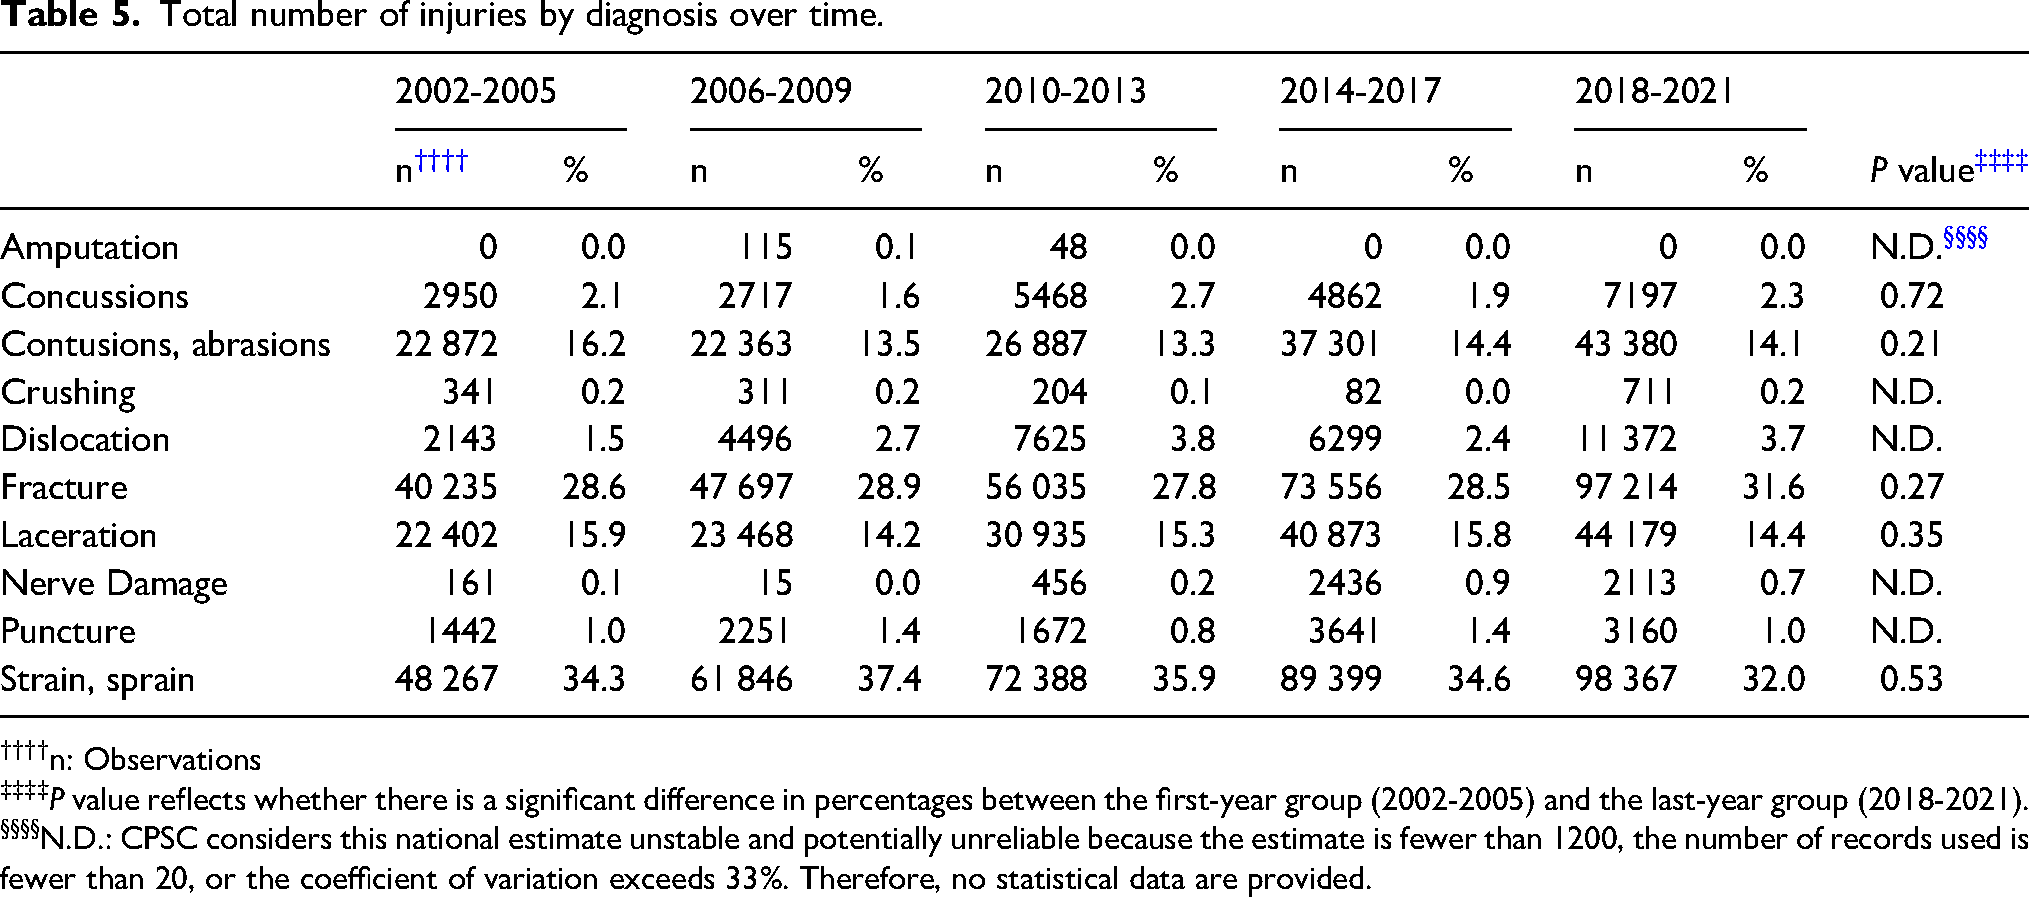
n: Observations
P value reflects whether there is a significant difference in percentages between the first-year group (2002-2005) and the last-year group (2018-2021).
N.D.: CPSC considers this national estimate unstable and potentially unreliable because the estimate is fewer than 1200, the number of records used is fewer than 20, or the coefficient of variation exceeds 33%. Therefore, no statistical data are provided.
Discussion
Total MSK injuries endured during trail sports and presented to US EDs increased from 2002-2021. “Injury rates” refers to the observed number of a given diagnosis, injured body part, patient age, or patient sex relative to the total number of injuries included from NEISS. Males made up a larger proportion of injuries from 2002-2009, then females did from 2010 onward. The increase in total injuries paralleled the rising popularity of trail activities. Among females, outdoor activity participation increased by about 20 million participants from 2015-2021, surpassing the increase among male participants by about 1 million. 23 One explanation for the rise in female injury rates from 2010 onward is that as female trail-sport participation increased, the larger sample size revealed underlying trends in female injury patterns. For instance, Zech et al found that female athletes have slightly higher injury rates compared to male athletes, possibly due to such factors as anatomical hip angle, joint laxity, or muscle mass. 21 Studies have also found that males are less likely than females to present to a doctor when they experience injury or illness.24,25 Females have also been found to be more likely to present to a doctor for injury, providing a possible explanation why the proportion of ED-presenting injuries accounted for by females grew as female trail-sport participation increased. When stratified by age, females had higher injury rates than did males among all age groups except those <18 y. Other studies noted similar findings, with the proportion of female-to-male injuries increasing as age increased. These data suggest that gender differences in injury rates may become more magnified as age increases, but why this growth occurs remains uncertain. 26
Those <18 y had higher rates of head injuries and concussions. Although the difference between observed and expected rates was only 0.5%, this number remains significant, considering the long-term impact that chronic traumatic encephalopathy and mild, especially repetitive, traumatic brain injuries can have on youth.27–30 Given the higher risk-taking propensity of younger age groups, 31 greater concussion rates among those under 18 y may be expected. An important consideration in a leisure sport, such as mountain biking, versus other common youth sports where concussions are common, such as football and hockey, is the lack of official safety regulations, such as helmet-wearing.32,33 Given that mountain-biking rates were higher than expected for those <18 y, advocating for concussion-prevention education and helmets for bikers could be an area for intervention to minimize adverse outcomes. 34
Higher fracture rates among those >65 y were expected, considering the decline in bone-mineral density and greater fracture risk with age. A potential area for intervention to mitigate injury in this population includes strength and resistance training, which bolsters bone-mineral density and skeletal health.35,36
Small but statistically significant differences in reported injury rates versus national estimates were found for mountain biking from 2014-2017 and 2018-2021 (lower than expected), hiking from 2014-2017 (lower than expected), and trail running from 2002-2005 (higher than expected). However, all differences were <1% and thus were likely not clinically significant when considering expected-versus-actual injury risk for a particular trail sport.
Although three body parts (shoulder, upper trunk, hand) were more commonly injured in males, five body parts (elbow, wrist, knee, lower leg, ankle) were more likely injured in females. Females were more likely to endure strains/sprains or fractures compared to males. A suggested explanation for higher female fracture rates is that for a given bone density, females are more likely to experience fractures. 37 Kudlacek et al found that females had a 3x greater risk of vertebral fractures compared to males with the same bone-mineral density. 37 Preventative measures, such as high-intensity resistance and strength training, could be valuable interventions, especially for female trail-sport participants.24,29,31,34
Those >65 y had low injury rates from 2002-2005 and 2006-2009. Activities with arguably higher injury potential (mountain biking, trail running) saw low participation among the >65 y group compared to other ages. However, these differences were all <1% and may be of limited clinical significance. The 18-65 y group, however, did have high injury rates from 2006-2009. Similar to other studies that found declining risk-taking behavior with increasing age, this result could suggest that those in the 18-65 y group chose riskier and more injury-prone activities, whereas the >65 y group took greater precautions when approaching trail activities. 38 Regardless, higher injury rates among those 18-65 y suggest that education and safety training may be of particular benefit for this group.
Given the increase in total trail-sport injuries over time, the question arose regarding whether the distribution of diagnoses also changed. However, when comparing 2002-2005 to 2018-2021, no differences were found in the proportion of any one diagnosis contributing to total injuries.
Although a large national database was used to examine trends across various demographics for this study, it does have limitations. NEISS provides national estimates from its sample data, but they come from EDs only, most of which are nonpediatric. Only eight children's hospitals contribute data to NEISS. 11 Although <5% of all US hospitals are children's hospitals, they see about 15% of all sick or injured children and account for about 40% of pediatric hospital admissions.39,40 Thus, conclusions for the <18 y group may lack robustness due to under-representation of pediatric data.
NEISS also represents only injuries that presented at EDs. Given that many injuries are managed outside EDs, such as self-management or urgent cares, this missing information may compromise accurate representation of all injuries endured during trail sports. Although many sports-specific studies have reported results relative to participation hours, NEISS does not record this component, and thus injury rates are not adjusted for participation hours.
To examine injuries related to trail sports, a formula was used in Excel to filter narrative sections by inclusion terms and common misspellings. It is possible that other misspellings or terms were used to reference these activities and not included in the formula. There was also conflation of “mountain biking” as using a mountain bike regardless of location, versus using one in mountain sports. The analysis here was limited to narratives that separately defined the location as mountain-related and the method of transport as a bike, although this guideline may have excluded narratives that intended to describe mountain sport biking but simply included “mountain biking,” leading to less mountain biker representation in this analysis.
Conclusion
As participation in trail sports increased from 2002-2021, US EDs also saw an increase in the number of MSK injuries sustained from these sports. Total injuries increased from 2002-2021. Males made up a greater proportion of the injured cohort from 2002-2009, versus females from 2010 onward. Injury patterns, such as more frequent head injuries and concussions among those <18 y and higher fracture rates among those >65 y, highlight potential areas for intervention and injury prevention.
Footnotes
Author Contribution(s)
Declaration of Conflicting Interests
The authors declared no potential conflicts of interest with respect to the research, authorship, and/or publication of this article.
Funding
The authors received no financial support for the research, authorship, and/or publication of this article.