
Abstract
Introduction
While the use of camping stoves in poorly ventilated areas is discouraged, the need to address dehydration challenges in harsh arctic conditions has led to their unconventional use inside snow caves for snow melting, subjecting occupants to unknown carbon monoxide (CO) levels. This study, located at sea level in northeastern Greenland, aimed to assess CO levels and dynamics during short cooking sessions in newly constructed emergency snow caves.
Methods
In 5 snow caves, constructed according to the same design principles by 4 different individuals, a single MSR Whisperlite multifuel burner, primed with ethanol and burning white gas, was used to melt snow. CO concentrations were monitored every minute until all the snow in a 5-L pot was converted to water and CO levels returned to below 10 ppm.
Results
A total of 16 experiments conducted showed that the priming phase generated the highest CO peaks, with a maximum of 120 ppm. Time-weighted averages ranged from 14 ppm to 67 ppm, with trial durations of 15 to 21 min. A single trial with a dirty burner resulted in up to a 10-fold increase in CO levels.
Conclusions
While single, short cooking sessions of less than 10 min burn time in newly constructed snow caves may be tolerated under specific conditions, the study highlighted substantial variation between caves and the importance of using clean burners, emphasizing the need for further research to gain a comprehensive understanding of CO exposure dynamics in snow caves.
Keywords
Introduction
Dehydration can be a challenge during expeditions in arctic environments. A camping stove burning liquid fuel with low freezing points is ideal for melting snow into water, but the general advice is to limit the use of these stoves to well-ventilated areas to minimize exposure to pollutants and avoid the risk of carbon monoxide (CO) poisoning. However, melting snow outside under arctic conditions can lead to frostbite, hypothermia, added metabolic demands, and increased fuel consumption. Under certain conditions, using a stove inside may be beneficial but has the risk of exposing the occupant to potentially harmful air pollutants and acute CO poisoning.
CO, which is the focus of this study, is a colorless, odorless, and toxic gas that has a high affinity to hemoglobin in the blood. This forms carboxyhemoglobin (COHb) and creates a left shift of the hemoglobin-oxygen dissociation curve, which leads to a reduction in oxygen availability to the tissues.
Exposure to 100 ppm at sea level will result in a COHb equilibrium at 15% within 3–6 h. 1 To prevent COHb concentrations above 5%, the US National Institute for Occupational Safety and Health recommends a maximum 8 h exposure of 35 ppm and a short-term exposure limit (STEL) of 200 ppm for 15 min. 2 Acute exposure guideline levels (AEGL) for the general public, including vulnerable individuals such as pregnant women, children, and people with coronary artery disease, have set the limit for acceptable COHb levels to 4%, corresponding to thresholds of 150 ppm for 30 min and 83 ppm for 60 min. 3 At sea level, symptoms of CO poisoning become detectable at COHb levels of 10–15%,4,5 with headache being a prevalent indicator. 6 With higher COHb levels, individuals may also suffer from dizziness, nausea, and vomiting. COHb levels of approximately 40% can cause coma and collapse and are most often lethal at 50–60%. 4 In healthy individuals, mild carbon monoxide poisoning that requires medical intervention is associated with COHb levels above 20%. 7 The elimination half-life of COHb while breathing normal air at sea level is around 4–5 h.
When using a well-functioning pressurized liquid fuel stove with adequate ventilation, the flame will burn with a homogeneous blue flame, producing a minimal amount of CO. 8 This blue flame characteristic is an important indicator when assessing the burner on a stove because red, yellow, and orange flames (often accompanied by sooty smoke) are indicative of lower flame temperature, incomplete combustion, and thus increased CO formation. Even with an optimal blue flame, CO production will increase 10-fold with pan contact with the flame because of flame dispersal. 9
When using an arctic tent, it is often possible to increase ventilation by opening vent flies located close to the ceiling or using the vestibule for cooking, thereby reducing the risk of exposure to pollutants. In contrast, when using a snow cave for shelter, changes in ventilation are limited to ventilation canals of varying lengths made through the cave roof or cave walls to the outside. A previous study from 1988 based on experiments conducted in two different snow caves at 5000–5300 m above sea level suggests that a ventilation canal area above 50 cm2 is sufficient to keep the time-weighted average (TWA) CO levels below 35 ppm during 1–2 h of continued stove use. 10 A more recent study that investigated CO levels in snow caves 11 employed nonstandardized measurements for both CO levels and cooking times. None of these studies performed standardized repeated CO measurements in multiple snow caves.
The present study was therefore conducted to determine CO levels during a single, short cooking process, wherein snow is melted using a burner inside newly constructed snow caves at sea level in the Arctic. The study was conducted with a standardized setup, incorporating real-time CO measurements across various cave dimensions.
Methods
The study did not contain any human or animal participants; thus, ethical approval was not sought for the study.
The experiment took place at sea level on a military base in northeastern Greenland over a period of 2 days. Wind direction, speed, and temperature were recorded at the base air traffic control center 10 m above ground every hour, with outside temperatures ranging from −28°C to −18°C and wind speed ranging from 0 to 14 knots. Five different emergency snow caves, labeled “cave A” to “cave E,” were dug in snowdrifts by 4 different military volunteers working in the Arctic. Each person dug their own cave, supervised by an Arctic survival instructor. One person dug two caves.
The caves were made to the following standard design: the highest point of the entrance had to be lower than the sleeping shelf or cave floor. The cave should be long enough to enable resting horizontally and contain one ventilation canal made by the basket of a ski pole (diameter 9 cm, cross-sectional area 63 cm2). Time to build: maximum 1 hour.
Snowdrifts were approximately 3 m high, sloping about 30 degrees toward the ground. The snowdrifts used were approximately 2 months old and were not exposed to temperatures above −10°C at any point. The snow was loose enough to excavate easily with a snow shovel. Cave dimensions were measured, and the inside volume ranged between 2 to 4 m3. The entrance had an average door area of 0.5 m2, and the tunnels were between 1 and 2.5 m long. The tunnels were not included in the volume of the cave. One ventilation canal was made at the highest point in each cave, with a length between 40 and 130 cm. The caves were oriented so that all entrances were facing away from the current and expected wind direction. All entrances were left open but were partly blocked by the observer during the experiment. Before the first trial, all caves were left unoccupied and allowed to harden for more than 3 h before the beginning of the trial. Between trials, the caves were empty and without any human presence apart from the time (approximately 35 min per trial) it took to prepare and conduct the experiments in each cave. On the second day, the insides of the caves were re-excavated because the roofs were sagging due to the snow settling overnight.
All trials were performed the following way: a single, commercially available Mountain Safety Research (MSR) Whisperlite multifuel stove was used and was configured to burn with white gas (DK: Heptan, Rensebenzin; DEU: Reinigung Benzin, Kocherbenzin; FRA: Essence “c”; ESP: Becina Blanca, Solvente). They were set up in each cave under the ventilation hole and then moved 35 cm to the side to simulate suboptimal placement. The CO monitor was placed near the ceiling (also breathing height), with a 35 cm distance between the burner and the ventilation hole. The experimental setting is shown in Figure 1. The CO monitor, a Carbon Monoxide Alarm from Ningbo Kingdun Electronic Industry Co. Ltd, type KD-218A, with an LCD display showing the CO level in ppm, had a functional range from 10 ppm to 300 ppm, accuracy of ± 15%, and a working temperature between −10°C to +45°C within a 0–93% relative humidity spectrum. To keep the monitor within functional temperature, it was stored at +20°C until 5 min before starting the trial. The monitor quality was validated after the experiment by an internationally accredited laboratory (Buhl & Bønsøe A/S, Smørum, Denmark) and was found to comply with the accuracy given by the manufacturer. The temperature inside the caves was measured with a commercially available freezer thermometer with a range of −30°C to +30°C.
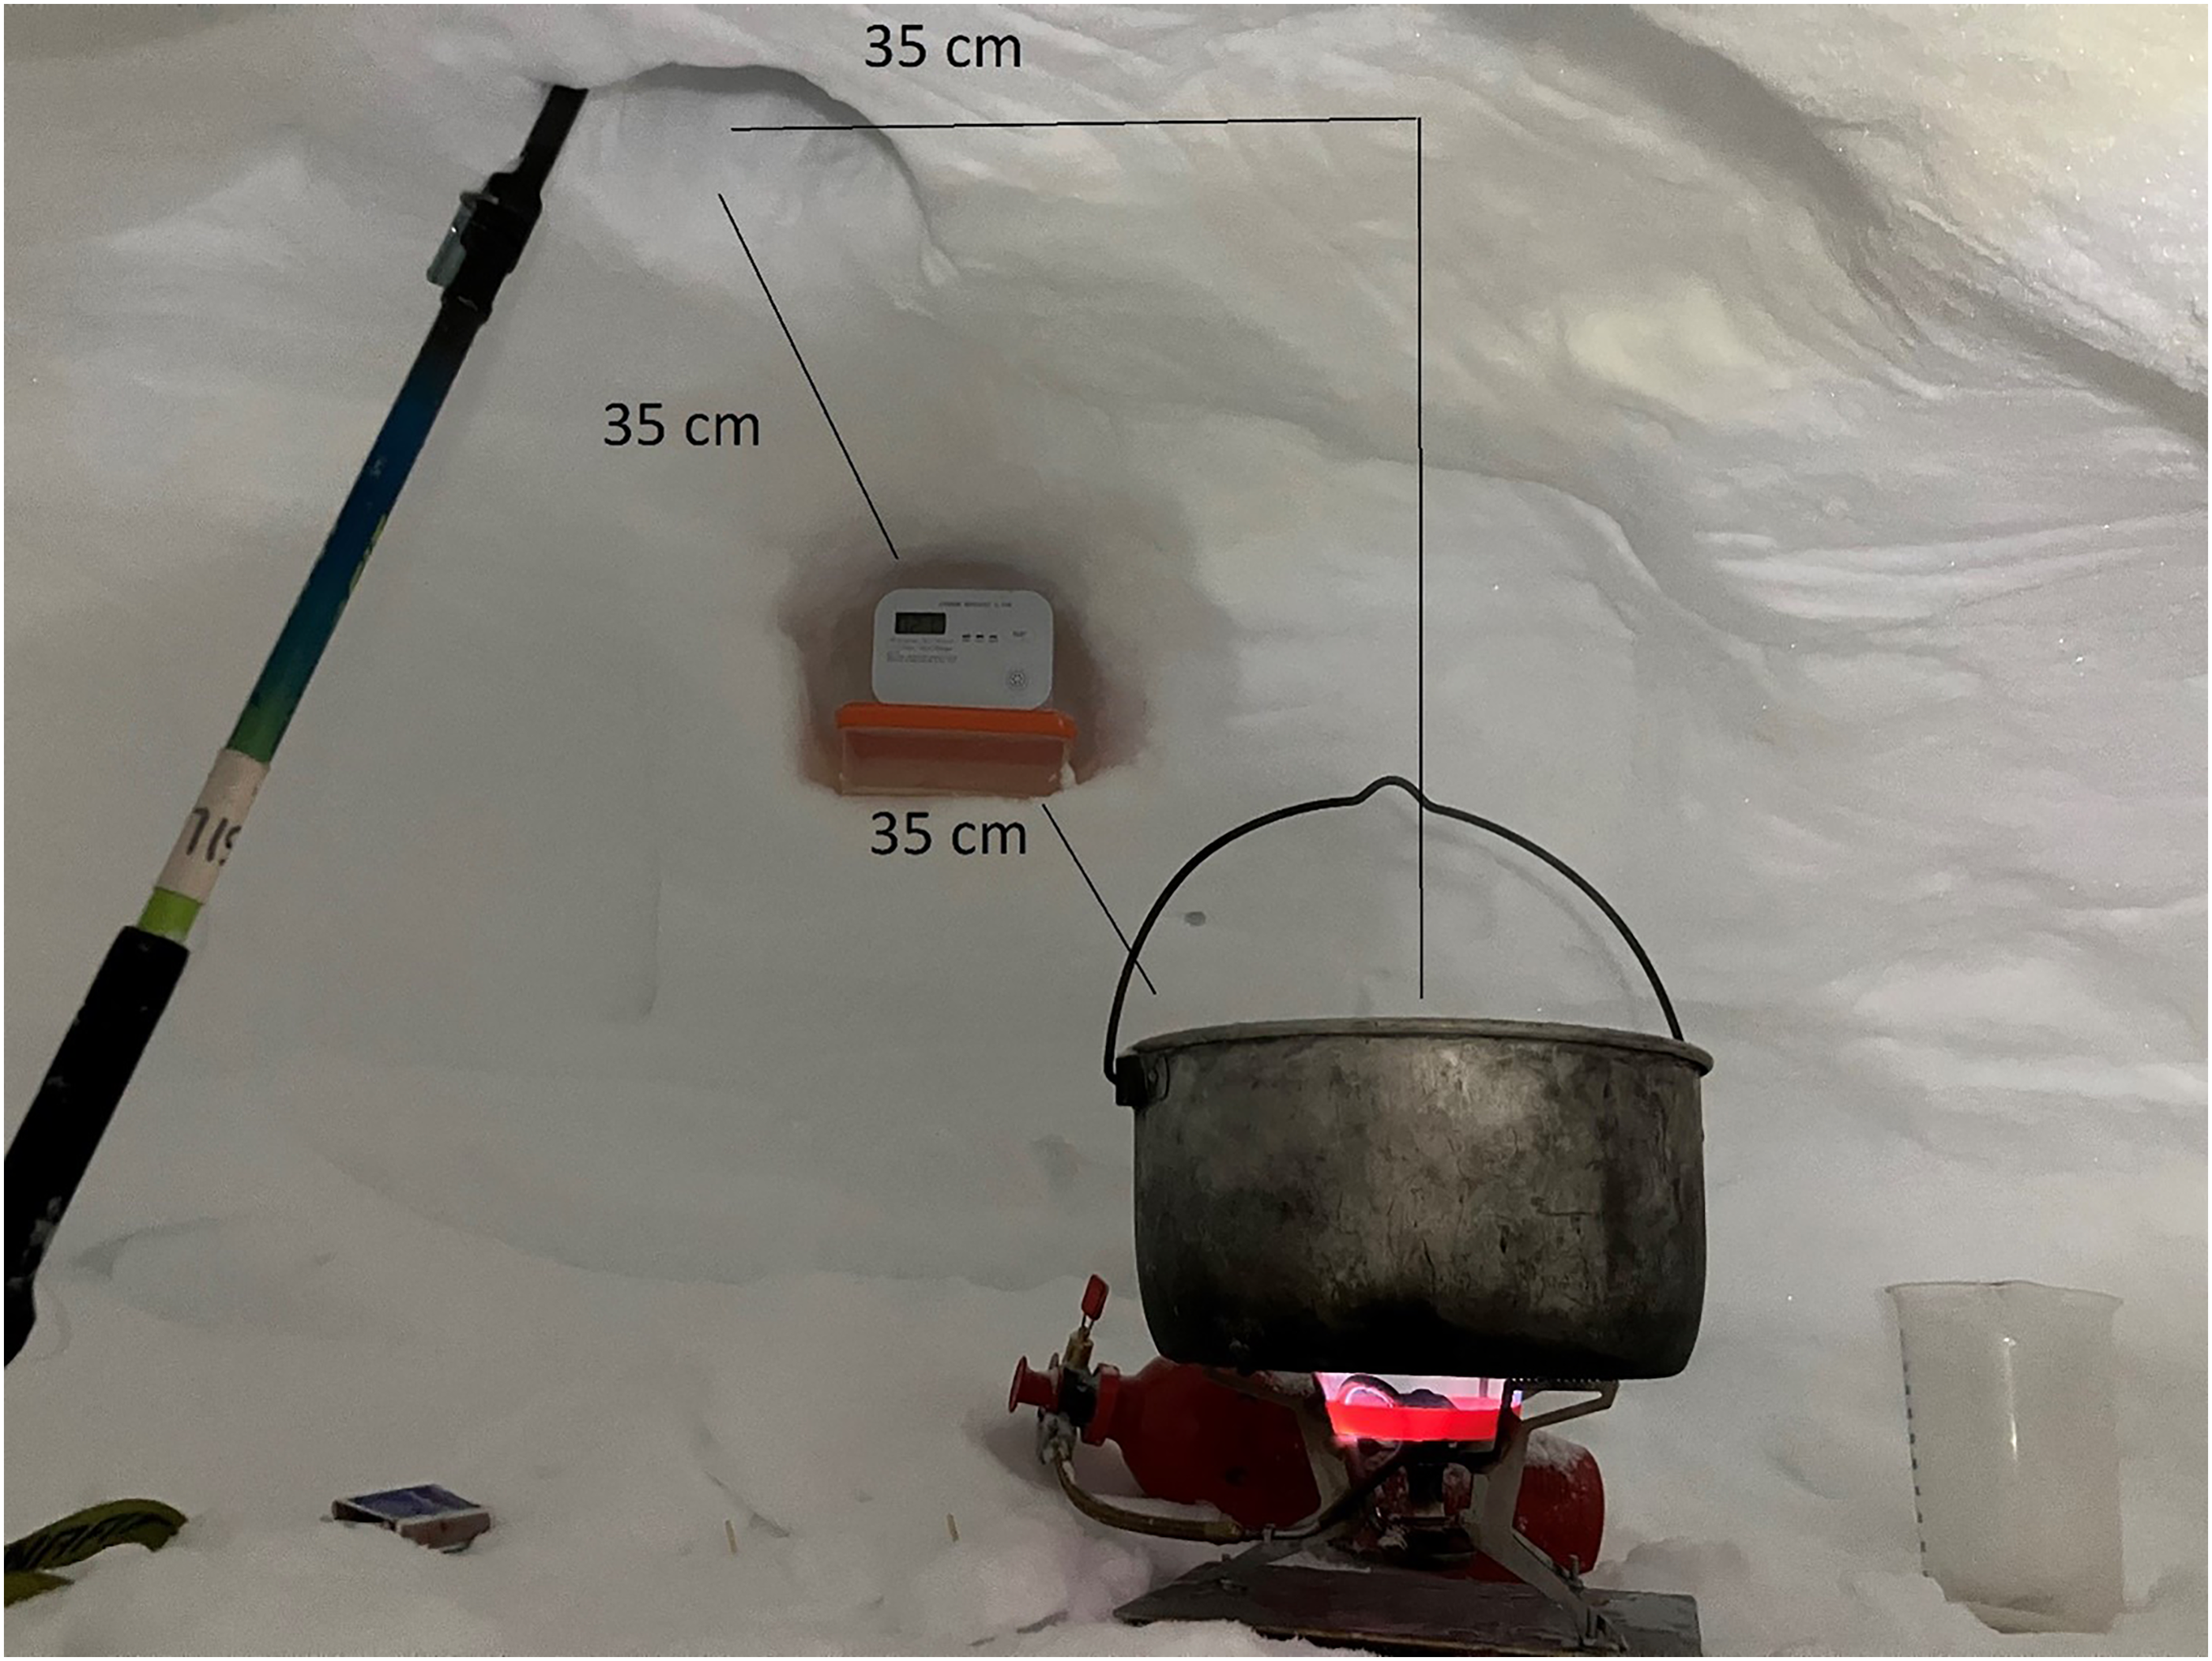
Experimental setup of the standardized snow melting trials. The MSR Whisperlite multifuel stove was set up 35 cm to the side of the ventilation hole to simulate suboptimal placement. The CO monitor was placed in the wall near the ceiling 35 cm from the ventilation hole and 35 cm from the pot.
The fuel bottle containing white gas was initially pressurized by manually pumping it 70 times after loading fuel under warm conditions (+20°C). To allow the fuel to equilibrate to the temperature inside the cave, the burner and fuel bottle were left in the cave for a minimum of 2 h. The fuel bottle was repumped 30 times just before the experiment started. Fuel quality was equivalent to that used by long-range sled patrols in the Danish military.
Each trial started with preheating (priming) the stove with burning ethanol. The priming process heats the supply hose on the burner, thus vaporizing the pressurized liquid fuel and making it burnable. As per the Danish long-range sled patrol protocol, ethanol is used for the priming process instead of white gas to reduce the buildup of soot on longer journeys. The priming cup was filled with ethanol and burned for 1.5 min before the fuel bottle with white gas (fuel) was employed. The subsequent 30 s were used to turn the fuel on, ignite it with a matchstick, and confirm that the burner burned with optimal and full effect. At this stage, a snow-filled aluminum pot without a lid was placed on the flame. The pot had a diameter of 21 cm and contained 5 L of packed snow. Ice and snow were removed from the outside of the pot with a sweep from a gloved hand, and no dripping of water onto the flame was observed. The fuel was shut off when all the snow in the pot had turned to water. After the fuel was shut off, the flame did not immediately extinguish but exhibited irregular flickering (flutter) for 1 to 2 min. The flutter was caused by the drop in pressure of the fuel that remained in the supply hose.
During the entire experiment, CO recordings were made every minute by visual inspection of the CO monitor by the observer until termination of the trial (CO below 10 ppm). Keeping the monitor display within viewing distance, the observer retreated to the entrance after starting the trial and laid flat with head and upper body inside the tunnel entrance. This was done to minimize interference with the trials and reduce the repeated CO exposure to the observer. During the last part of each trial, the observer reentered the cave to inspect the melting process and subsequently terminated the fuel supply before returning to the entrance.
All trials were performed with a clean, well-functioning burner, producing a homogeneous blue flame. In addition, to highlight the importance of using a clean burner, an additional trial was performed with a nonmaintained dirty burner known to produce inhomogeneous orange flames. To minimize the CO exposure of the observer, this trial was performed in the cave with the lowest CO levels during the standard trials.
Data Analysis
Data are shown as individual values in 1-min time resolution or individual means for the duration of each trial. TWA CO exposure was calculated as the sum of all CO recordings divided by trial duration (starting from the priming phase and until CO levels were below 10 ppm). The coefficient of variation (CV) was calculated to examine the variation in TWA for repeated trials within each cave (CV of TWA from all trials within a cave) and for the mean TWA between caves (CV of the mean TWA from each of the 5 caves). The clearance rate of CO from the caves was expressed in minutes as the half-life (T1/2) of CO levels after termination of the flame. For caves with at least 2 CO recordings ≥10 ppm after flame termination, an exponential regression line was applied to the CO recordings in Microsoft Excel, and its equation was used to calculate T1/2.
Results
A total of 16 trials were performed in random order, 3 trials in each of the 5 caves. At the end of the experiment, 1 additional trial was completed in the cave with the highest CO levels (cave D), and one additional trial with a dirty burner in the cave with the lowest CO levels (cave A).
During the trials, the wind direction changed a maximum of ± 45 degrees to the direction at the time the snow caves were built. Consequently, the orientation of the cave entrances did not face the wind in any of the trials.
The duration of each trial (CO exposure time, min) and TWA CO exposure (ppm) are shown in Table 1, and detailed CO recordings from the 16 trials are shown in Figure 2. In all trials, there was a fast and significant rise in CO levels during the priming process, followed by a brief decline corresponding to the phase where the burner produced a clean blue flame with no pot to disperse or cool the flames. Next, the pot was placed on the flame, creating flame dispersal and the formation of orange flames, resulting in an increase in CO levels. During the burn phase, some trials plateaued before flame termination; in most cases, CO levels did not exceed priming levels. The highest plateaus (trials D-4, E-3; Figure 2D–E) leveled out between 90 and 100 ppm, but some (most evident in trials D-2 and E-1; Figure 2D–E) kept rising until flame termination. After shutting off the fuel supply, the flutter created a small increase in CO levels, followed by flame termination and a steep decline in CO levels.
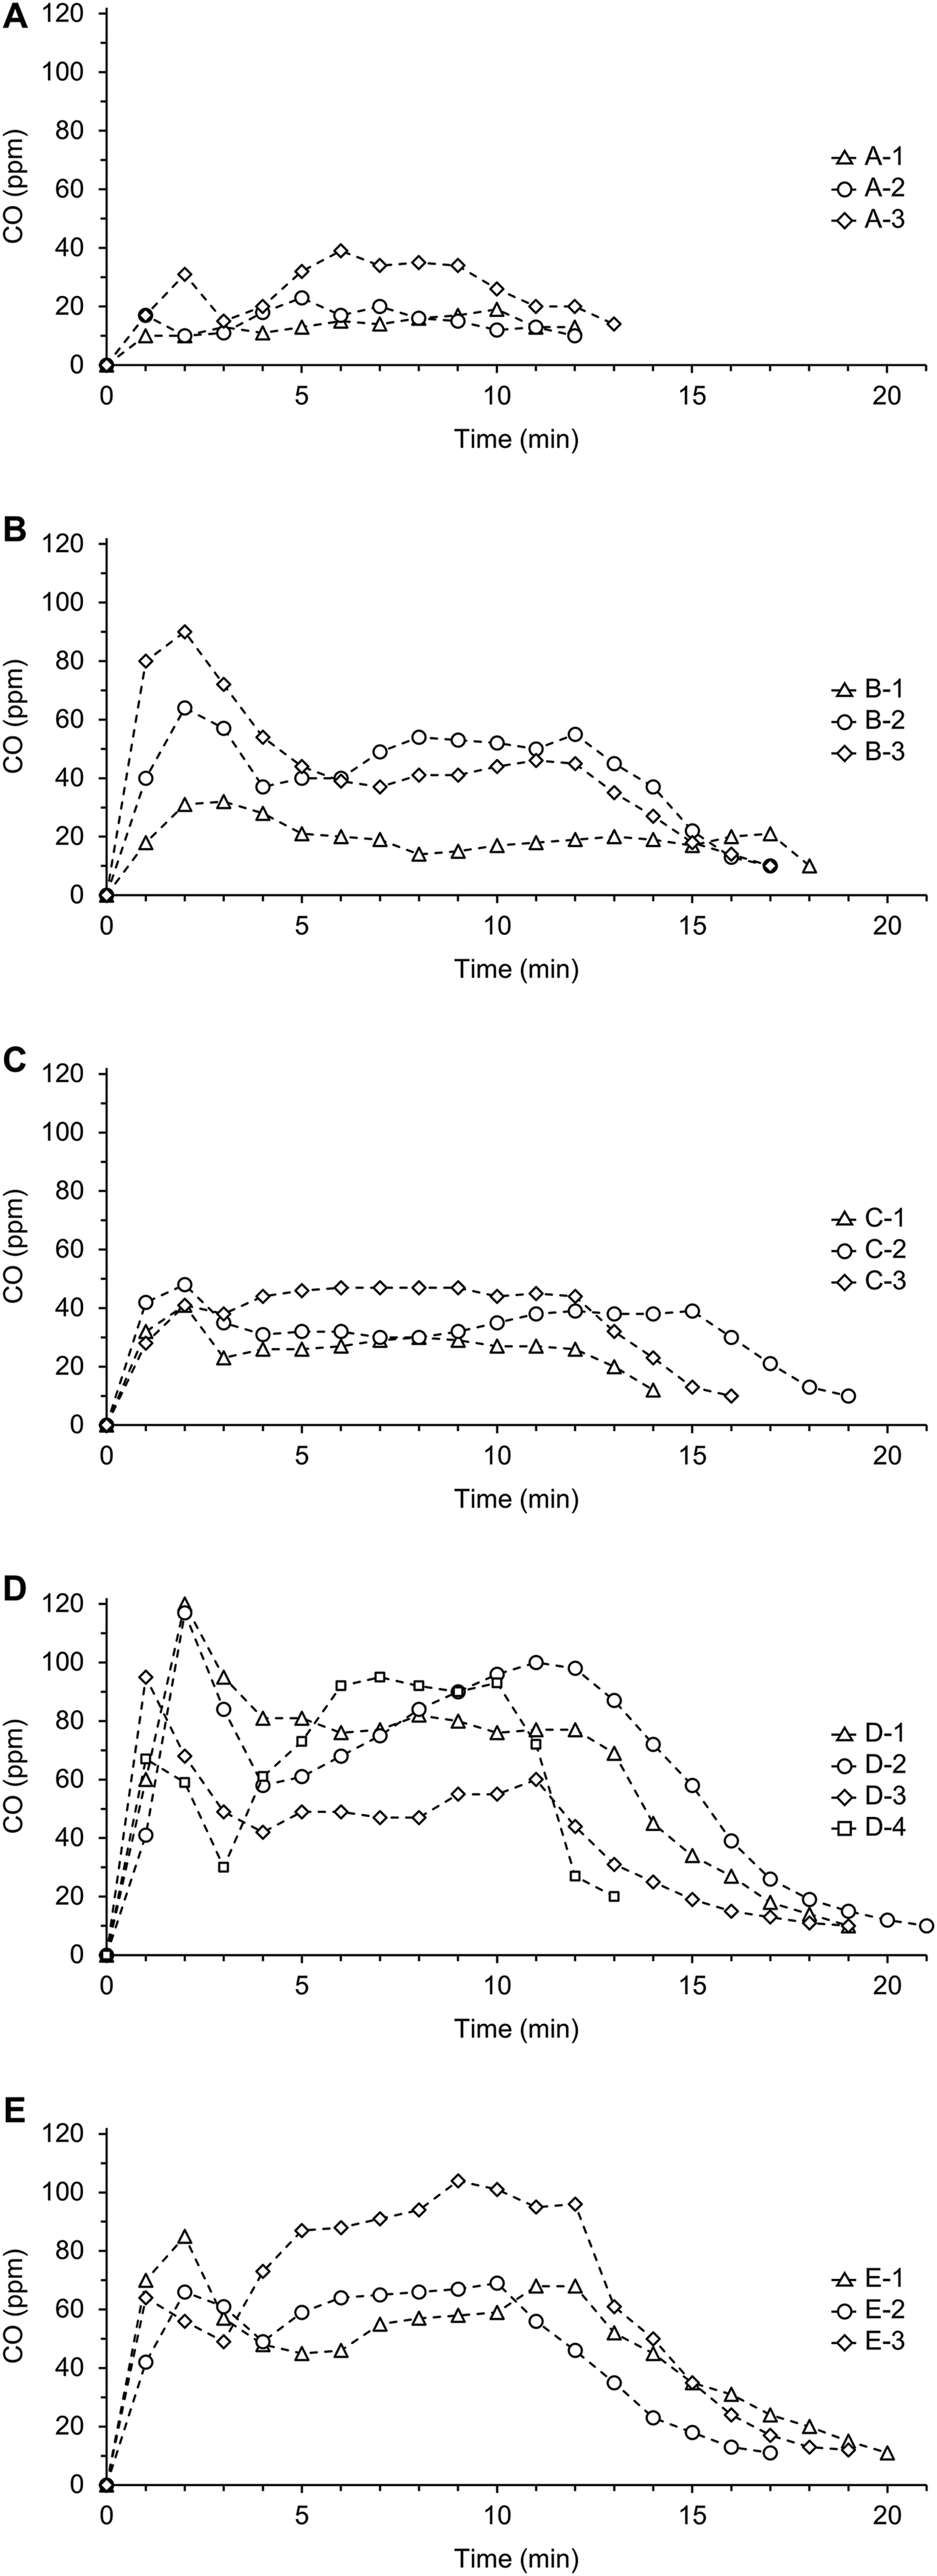
CO levels were recorded in 1-min intervals in 3–4 repeated trials in 5 different snow caves (A, B, C, D, E) while using an MSR multifuel burner primed with ethanol and burning white gas. The CO levels reflect the 3 phases of a trial, with an initial peak seen in the priming phase, followed by a brief decline corresponding to the time when there is a clear blue flame without a pot on the stove. Then CO levels increase again when the pot is placed on the flame, and finally termination of the fuel causes flutter and a small CO increase before a steep decline until CO levels were below 10 ppm.
Overview of the data collected during snow melting trials with a clean burner
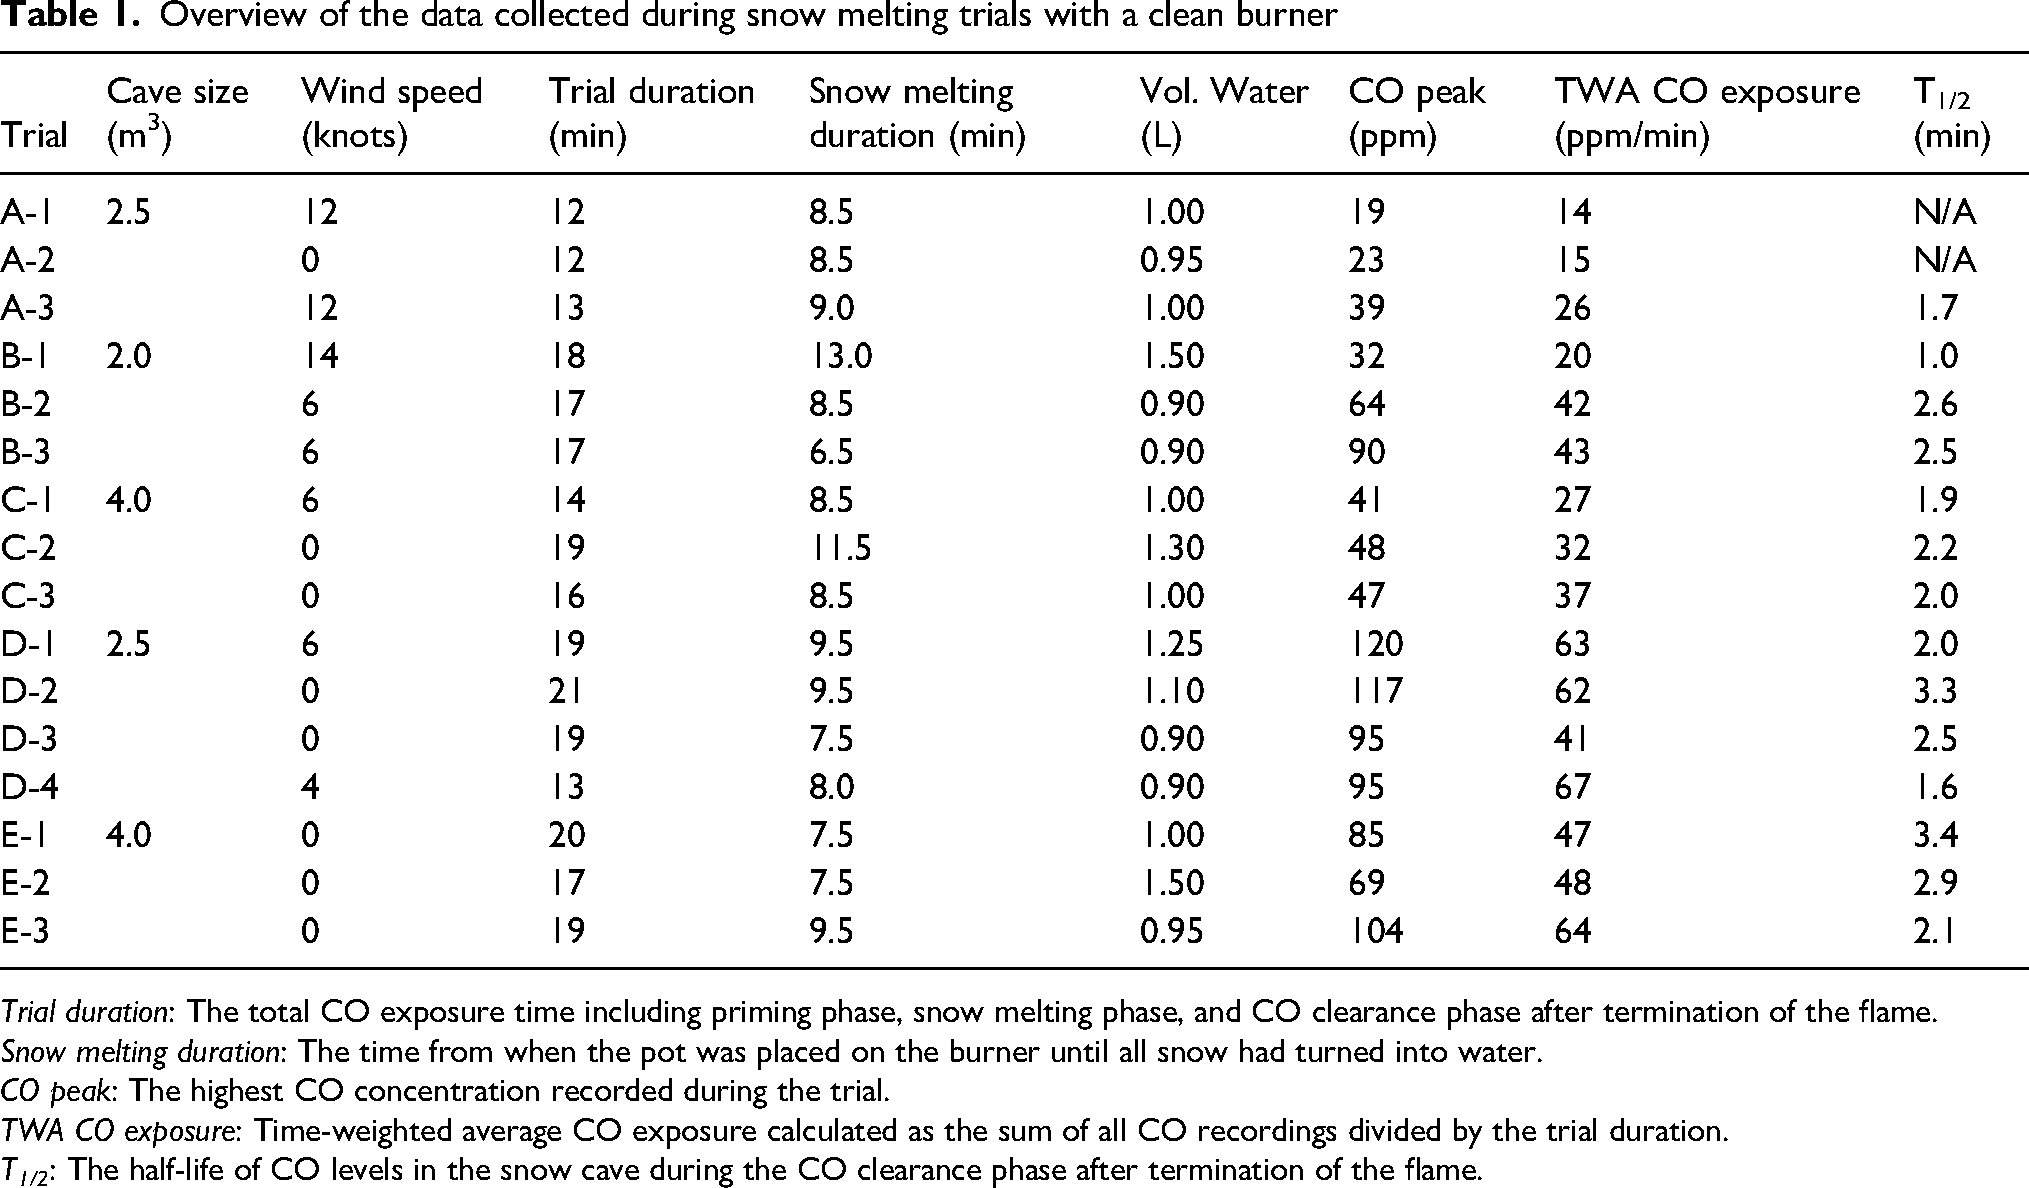
Trial duration: The total CO exposure time including priming phase, snow melting phase, and CO clearance phase after termination of the flame.
Snow melting duration: The time from when the pot was placed on the burner until all snow had turned into water.
CO peak: The highest CO concentration recorded during the trial.
TWA CO exposure: Time-weighted average CO exposure calculated as the sum of all CO recordings divided by the trial duration.
T1/2: The half-life of CO levels in the snow cave during the CO clearance phase after termination of the flame.
The trials lasted between 13 and 21 min, producing 900 to 1500 mL of water (Table 1). The highest recorded CO peak was 120 ppm (trial D-1; Figure 2D), while the lowest CO peak was 19 ppm (trial A-1; Figure 2A). Additionally, the highest and lowest TWA CO exposures were 67 ppm for 13 min (trial D-4) and 14 ppm for 12 min (trial A-1), respectively (Table 1). Trial D-2 had the highest total CO exposure at 62 ppm over a 21-min duration.
The TWA showed an overall low variation within each cave (mean CV-TWA within caves = 26%) compared to the variation in TWA between the different snow caves (CV-TWA between caves = 41%). This is illustrated in Figure 3 where the bars show the mean TWA CO exposure for each cave together with the TWA CO exposure from the individual trials.
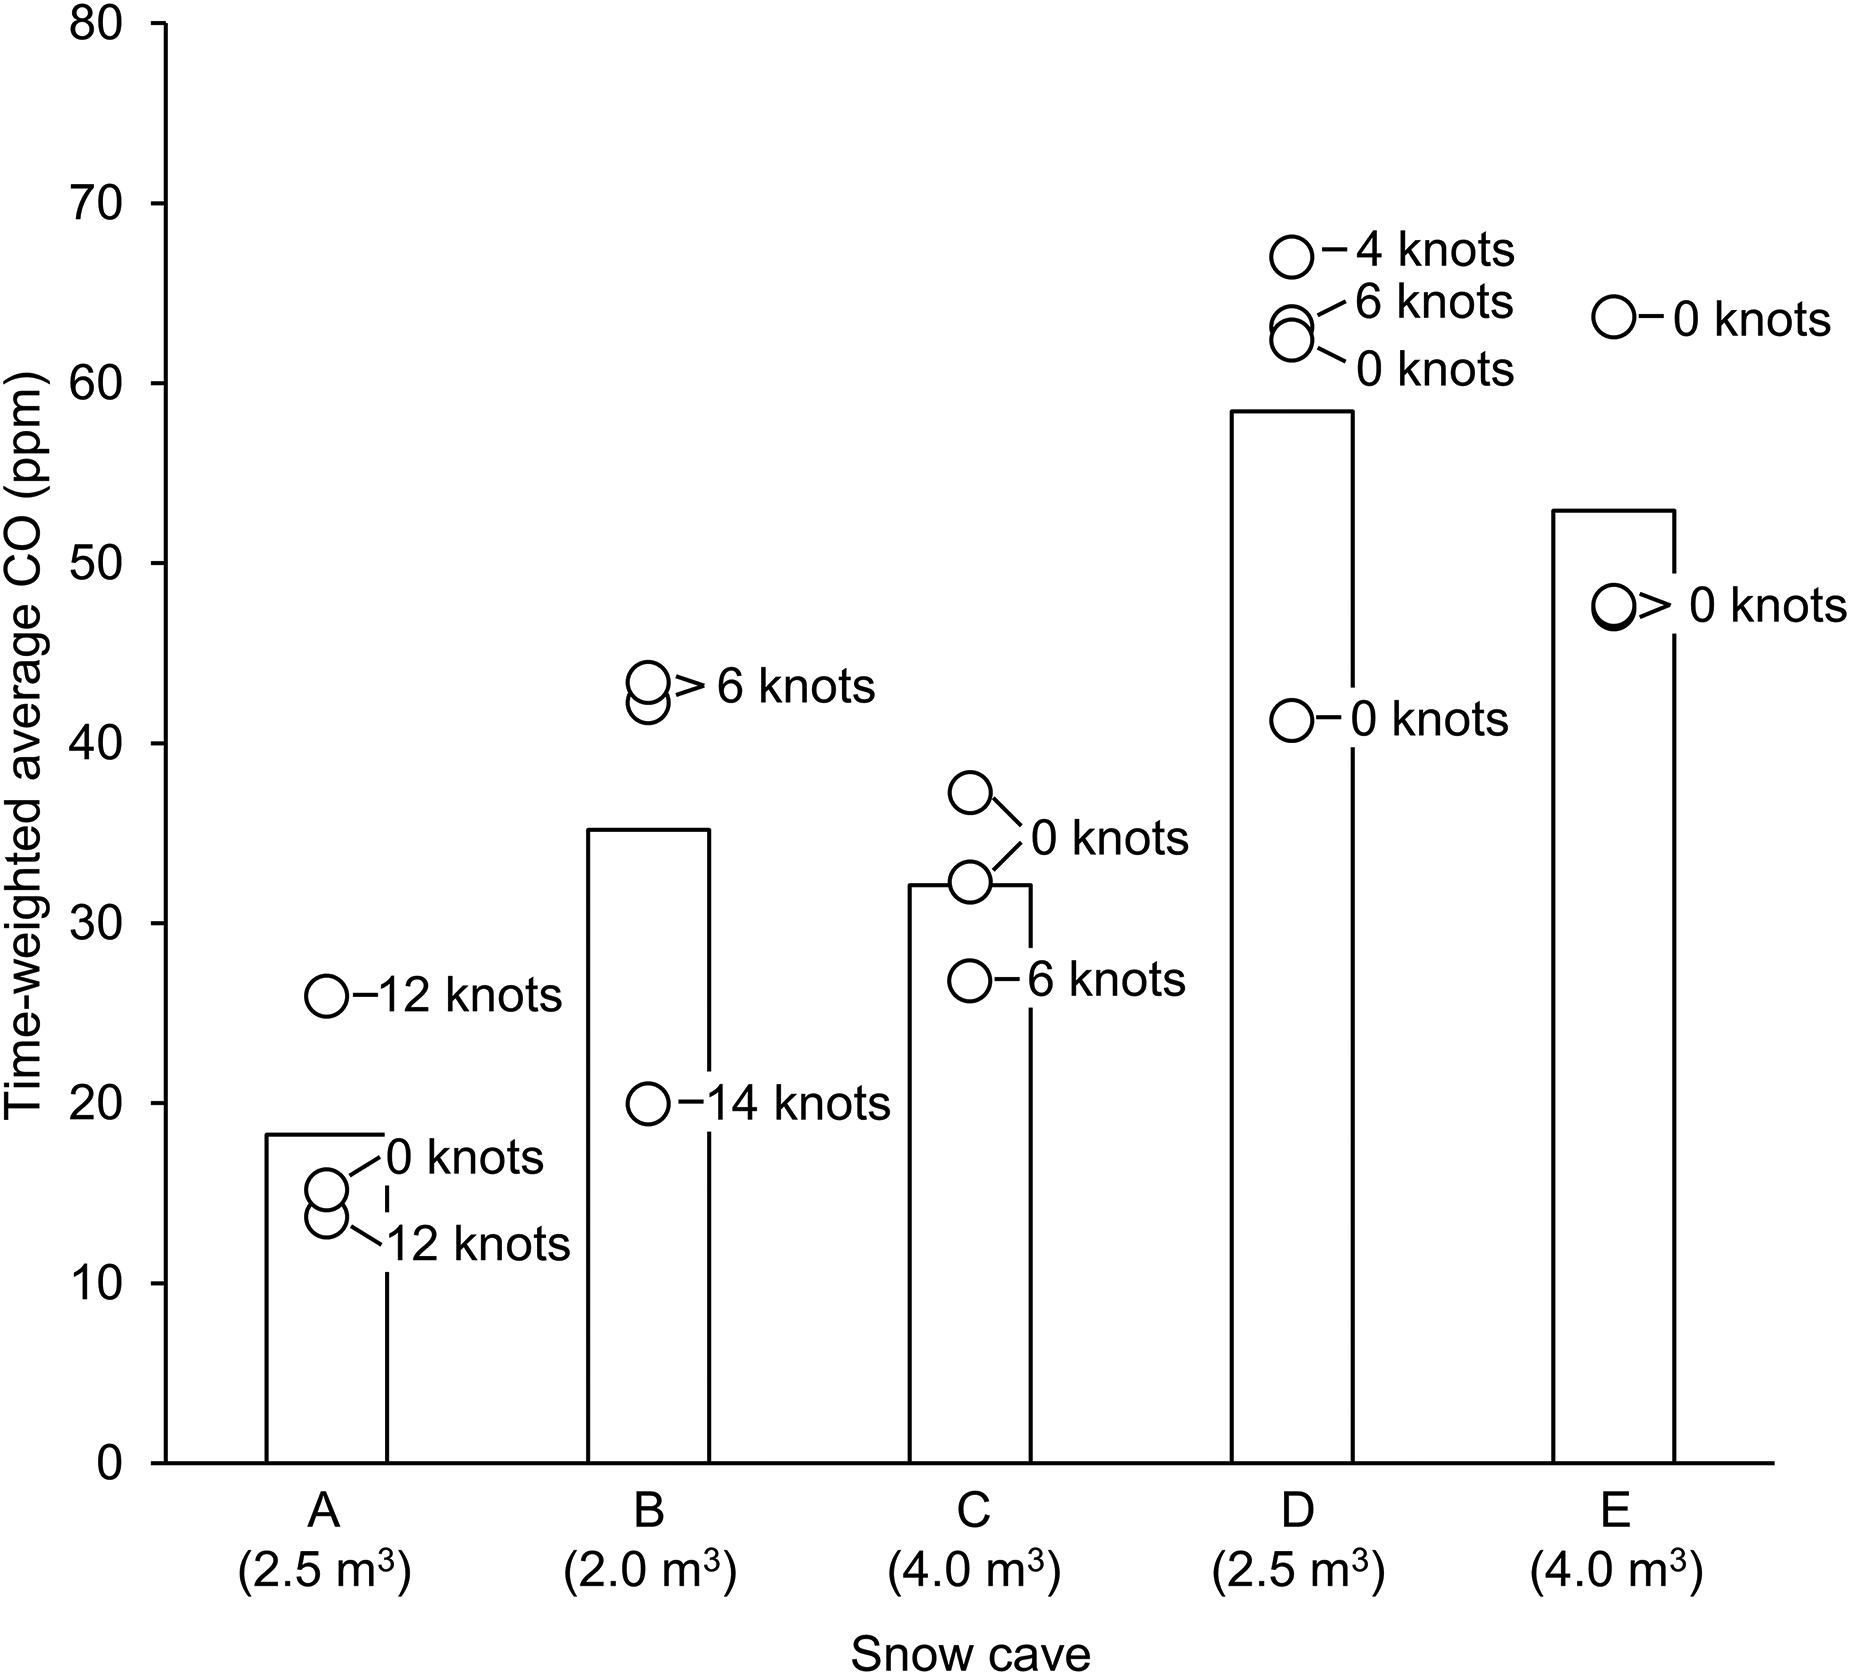
The bars show the mean time-weighted average (TWA) CO exposure in ppm for the 5 snow caves (A, B, C, D, E). The dots show the TWA CO exposure in ppm for each of the 3–4 repeated trials within each cave. The corresponding wind speed (knots) for each trial is annotated next to the individual trials, and cave sizes (m3) are shown below the x-axis.
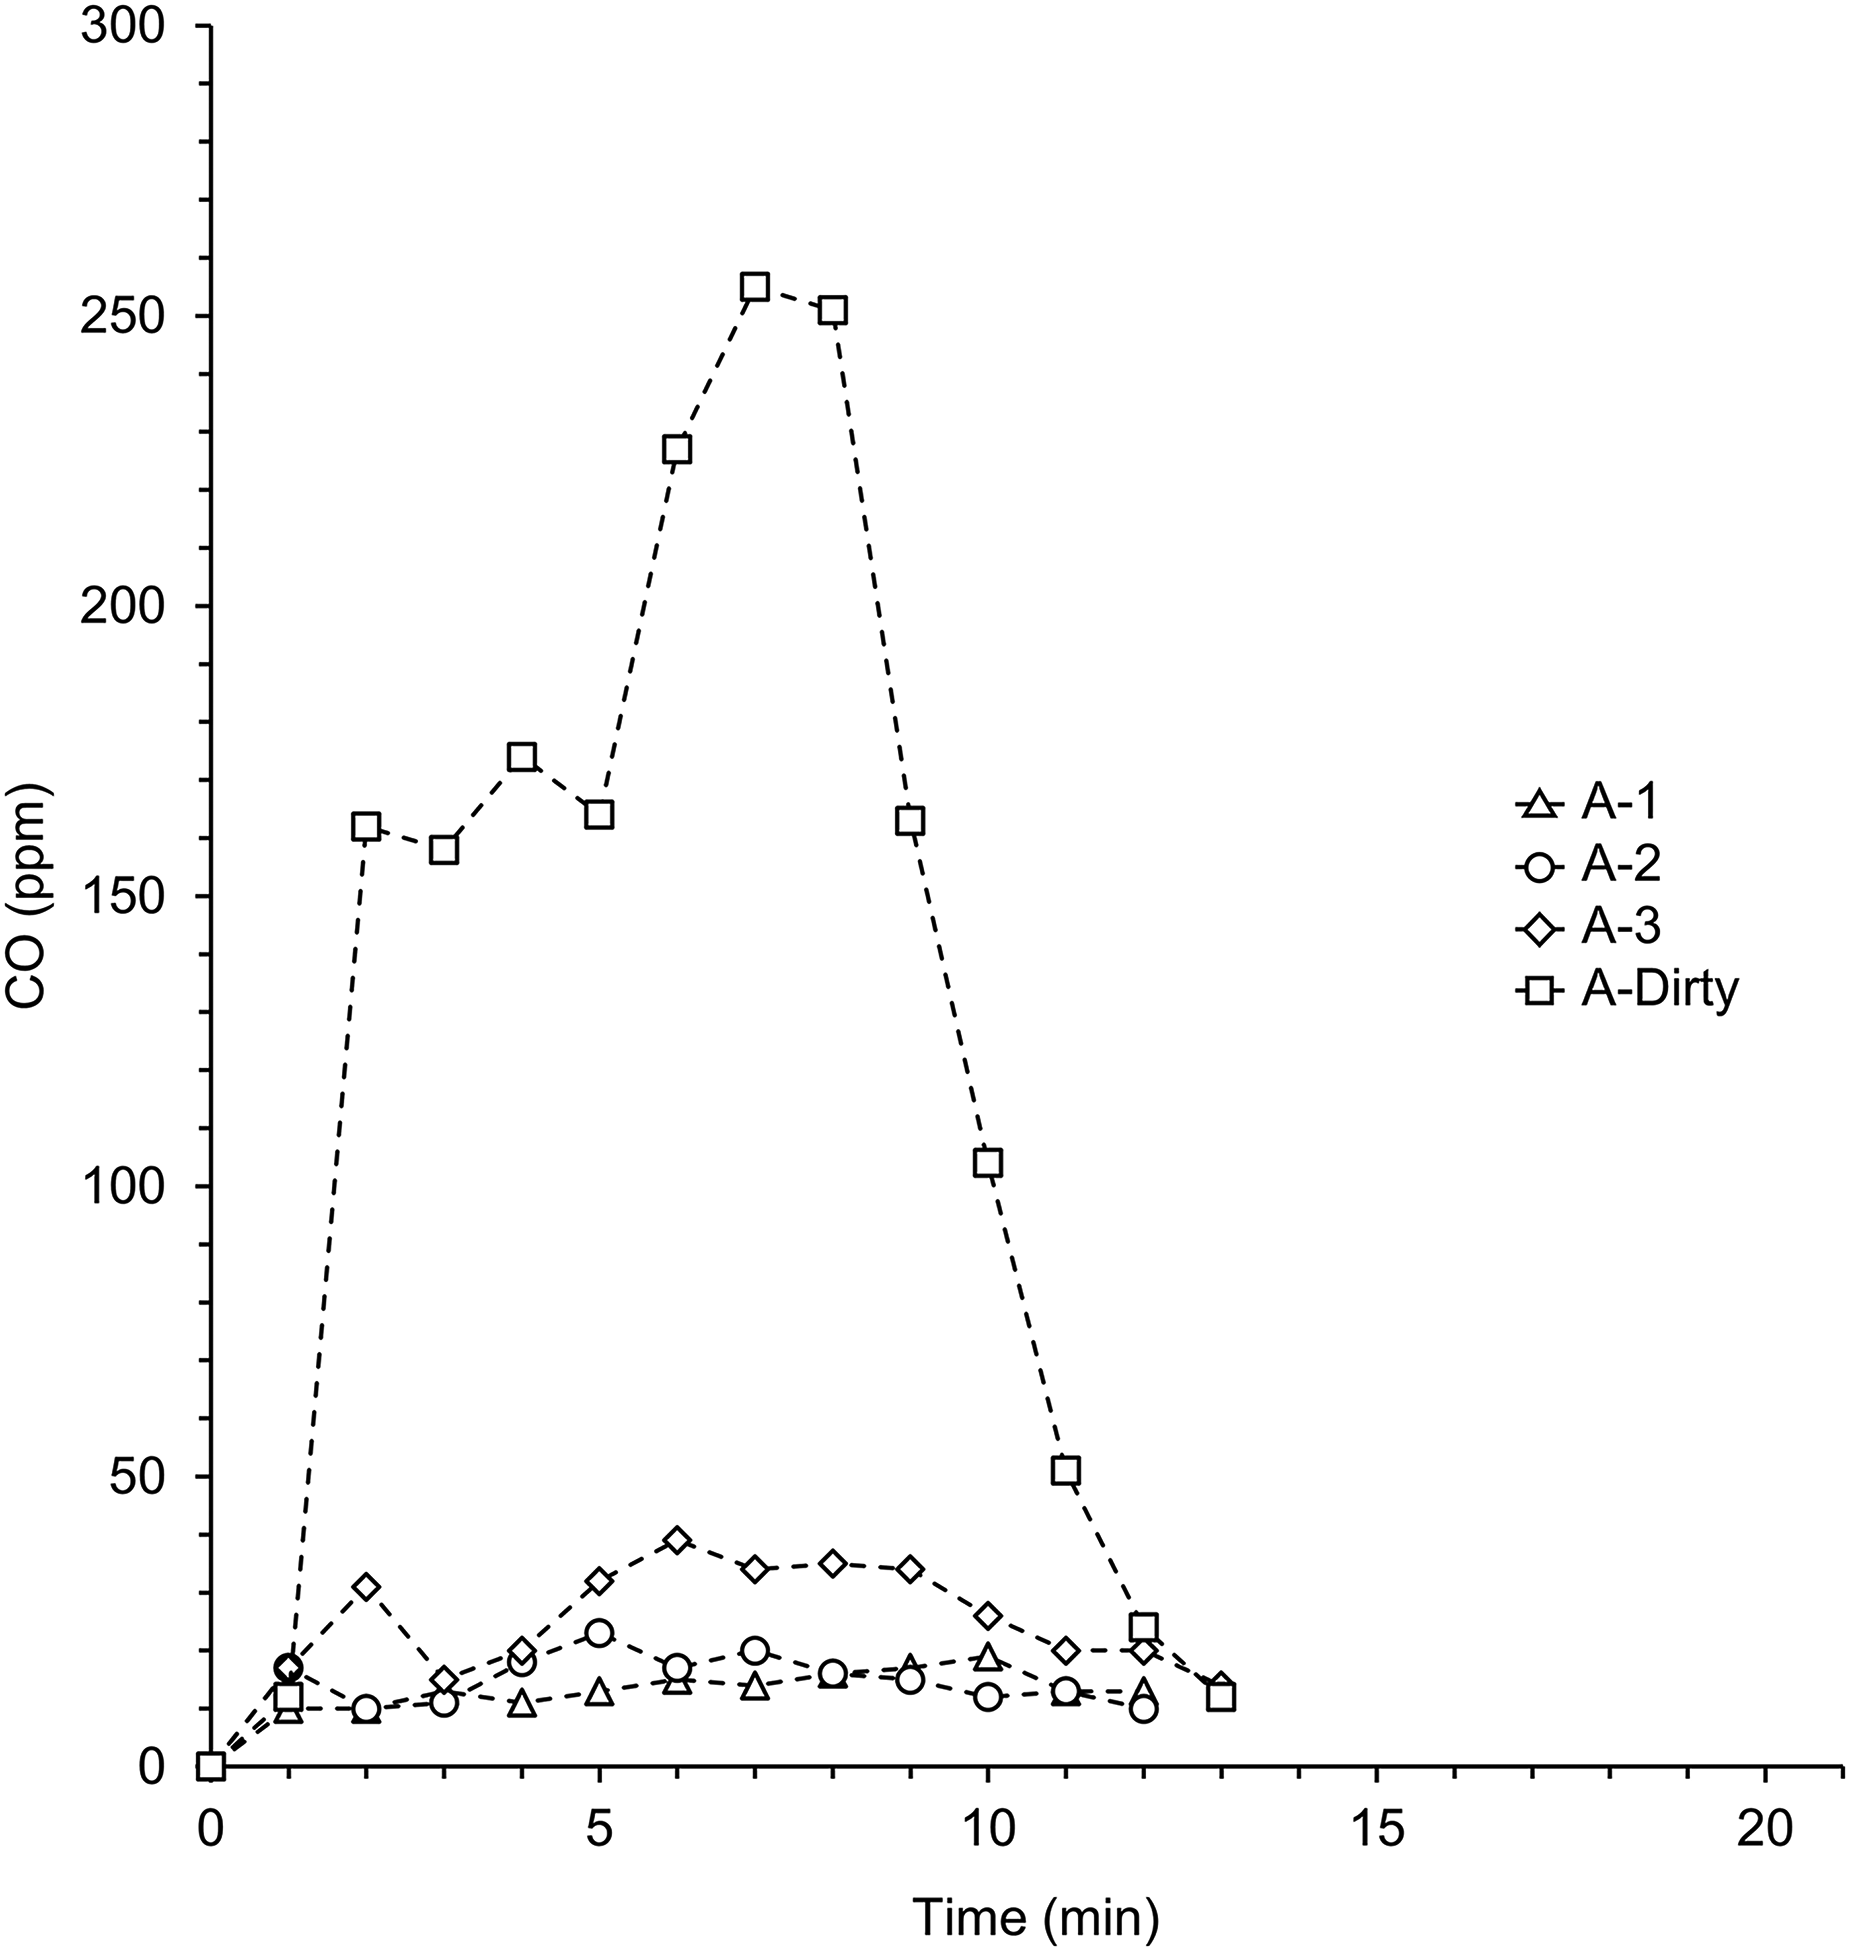
CO levels recorded in 1-min intervals in cave A in a single trial with a dirty burner (A-Dirty) are shown together with the 3 trials in cave A with a clean burner (A-1, A-2, A-3). The 3 trials with the clean burner are the same as shown in Figure 2A.
The CO half-life (T1/2) after flame termination could not be determined in two trials (A-1, A-2) because CO levels at this point were already below 10 ppm. The median T1/2 for the remaining trials was 2:03 min (range 0:56–3:14 min). Ten minutes after termination of the flame, all caves had a CO concentration below 10 ppm.
We observed lower CO levels in the trials conducted in caves B and C when outside windspeeds were above zero. However, this pattern was not consistently observed in caves A and D (as shown in Table 1 and Figure 3). The effect of wind speed could not be assessed in cave E, where all trials were conducted in zero wind.
To evaluate the effect of cave size on CO levels, the effect of wind speed was controlled by comparing trials with no wind (0 knots) in caves of the same size (A vs D and C vs E; Table 1, Figure 3). In the two 2.5 m3 caves A and D, the TWA in 0 knots was 15 ppm and 41–62 ppm, respectively. In the two 4.0 m3 caves C and E, the TWA in 0 knots was 32–37 ppm and 47–64 ppm, respectively.
The CO recordings from the trial with the dirty burner (cave A-Dirty) are shown in Figure 4, together with the 3 trials performed with the clean burner in the same cave (trials A-1, A-2, A-3). In Figure 5, the dirty burner is shown producing a large inhomogeneous orange flame (Figure 5A and 5B), with soot on the pot (Figure 5D) and burner (Figure 5C). This is indicative of incomplete combustion and, thus, increased CO formation. With the dirty burner, the CO peak was 251 ppm, and the TWA was 135 ppm for a trial duration of 13 min. This corresponded to a CO peak 13 times higher and a TWA CO exposure 10 times higher when compared to the trial with the lowest CO levels in the same cave (trial A1).
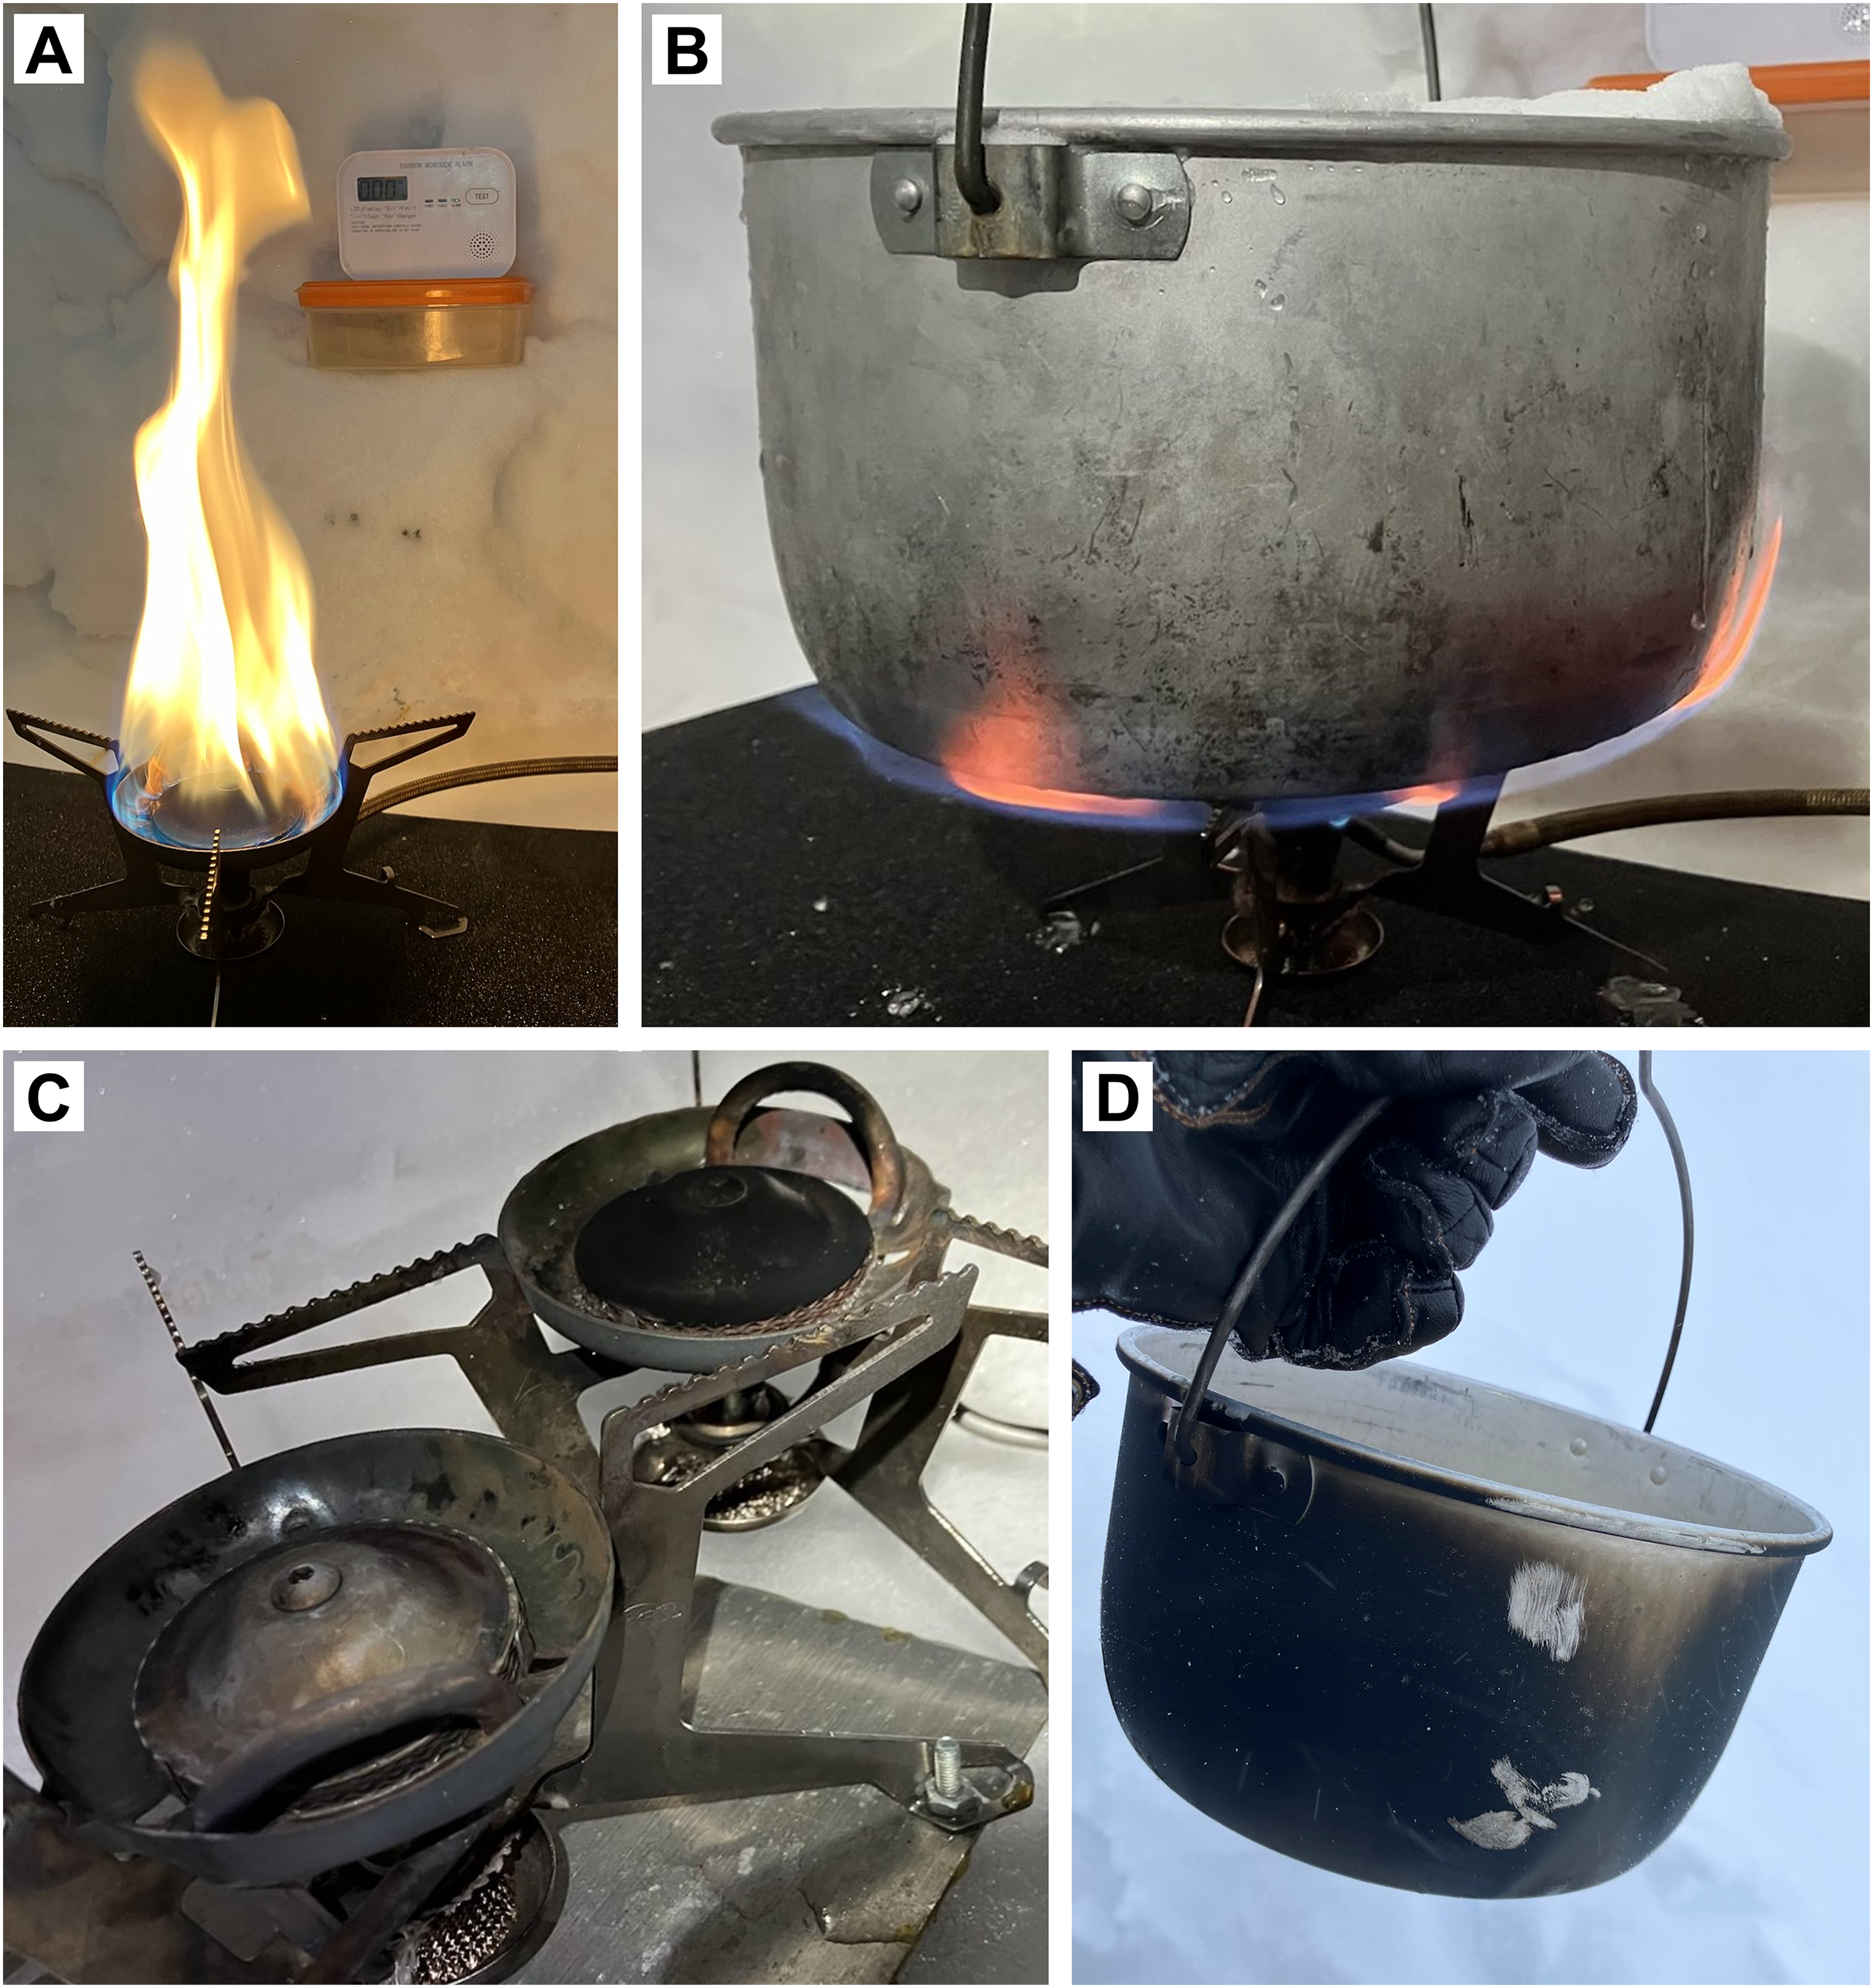
A dirty burner will produce excessive amounts of CO, and this figure shows some of the warning signs to be aware of. The large yellow/orange inhomogeneous flames in (A) are always accompanied by soot and excessive amounts of CO. When a pot is placed on a dirty burner (B), there will be orange flames engulfing the pot in contrast to the blue flame from a clean burner shown in Figure 1. Note that the dirty burner has visible soot on the burner hood (C). Visible inspection of the pot can also give an indication of the quality of the burner, where excessive amounts of soot can appear on pots used on dirty burners (D).
Discussion
The main findings of the present study were the detailed view of CO dynamics during repeated short-term cooking sessions in 5 different snow caves. With the standardized setup used in this experiment, CO levels did not exceed the recommended exposure levels. Furthermore, the 1-min time resolution of CO levels revealed that the short priming phase of 1–2 min is associated with the highest peak in CO levels, even though ethanol was used for priming instead of white gas. For safety reasons, it is important to emphasize the unexpectedly large variation in CO levels between the 5 snow caves, as well as the toxic increase in CO levels when using a poorly maintained “dirty” burner. A better understanding of the variables responsible for the variation in CO levels between snow caves is needed to reduce the risk of CO poisoning during indoor stove use in snow caves. Altogether, the results of the present study add to the sparse information in this field10,11 and improve the knowledge base for arctic personnel to evaluate the risk/reward of indoor stove use in snow caves during extreme environmental conditions.
The CO exposure guidelines referenced in this study limit CO exposures to result in COHb levels of a maximum of 5%. In our study, none of the 16 trials with the clean burner exceeded any of these limits. Six trials had a TWA below 35 ppm, 4 trials had a TWA between 35–45 ppm, 2 trials had a TWA between 45–60 ppm, and 4 trials had a TWA between 60–70 ppm. With a maximum trial duration of 21 min, these numbers appear safe considering that 83 ppm for 60 min results in COHb levels of 4%. 3 It is important to note that CO levels did not reach a plateau before flame termination in 2 trials, which underscores the importance of cautious interpretation and discourages assumptions about prolonged cooking sessions. Furthermore, periods with high CO peaks, coupled with increased respiration rates due to physical labor or altitude exposure, could push COHb levels faster toward equilibrium, resulting in higher COHb levels in shorter timeframes. The 4–5 h half-life of COHb means that cumulative CO exposure during repeated cooking sessions may be problematic. Additionally, if CO exposure is coupled with altitude exposure, the reduced oxygen saturation may intensify the adverse effects of COHb, and symptoms of CO poisoning could furthermore be mistaken for altitude sickness.
We identified 2 additional studies that have investigated CO levels in snow caves during stove use. One study used nonstandardized timepoints for CO measurements, varying cave sizes, and ventilation canal diameters, and found CO levels ranging from 7 to 95 ppm during or after stove use, which is fully comparable to our results. 11 A more systematic study examined the effect of variations in the diameter of the ventilation canals, with measurements taken at 10-min intervals. Using different tools resulting in ventilation canal areas between 11 and 82 cm2, they reported CO levels ranging from 25–190 ppm during 1–2 h of stove use. In trials with ventilation canal areas equivalent to those in our study, CO levels ranged from 25 to 35 ppm. The results lead the authors to recommend a ventilation area with a minimum of 50 cm² to keep CO levels below 35 ppm. 10 Until now, this recommendation has never been systematically tested. According to the present data, the TWA CO level was kept below 35 ppm in only 6 out of the 16 trials, even though the ventilation canal area in our study was 63 cm².
Building snow caves in a real-life setting in the field will always result in variations despite following the same standardized guidelines. We have illustrated this in the present study by having 4 individuals independently construct 5 snow caves. In the next section, we will discuss the potential variables that may have caused the unexpected large variation in CO levels, and we include additional relevant variables that hold the potential to affect CO levels in the field.
It was initially expected that the larger caves would have lower CO levels, as CO rapidly diffuses through the air, and prior research has shown no disparities in CO measurements between the cave floor and ceiling, 11 but our observations did not support this. This must indicate that the CO production quickly reaches an equilibrium with the volume of air inside the cave, from where the CO levels depend on the rate of CO clearance from the cave. The CO clearance rate is a combination of 3 variables: ventilation rates through the ventilation canal, diffusion/ventilation through the cave entrance, and diffusion through the cave walls. While the extent of CO diffusion through snow and ice remains uncertain, CO can permeate through the porous interstices of dense materials like gypsum wallboards, 12 and therefore, it is reasonable to assume that CO diffusion through the snow walls also contributes to the CO clearance rate. The CO diffusion rates may depend on the thickness of the walls and the density of the snow because air spaces between ice grains in snow are known to facilitate gas diffusion, including oxygen and carbon dioxide. 13 In addition, a phenomenon called glazing could impair CO diffusion rates due to the formation of an ice crust on the interior of a snow cave, as seen with prolonged occupation. Without knowing the total CO production from the stove and the airflow in the ventilation canal and cave entrance, it is not possible to estimate the relative contribution of CO diffusion to the clearance. It is, therefore, important to emphasize that our data were obtained in newly built unoccupied caves without glazing, and we do not know to which extent the CO clearance rate is affected by longer periods of occupation.
It was also expected that the two other variables that contribute to CO clearance, the airflow in the ventilation canal and cave entrance, would be positively affected by increasing wind speed due to the increased draft created by wind blowing past the exit holes of the cave. Although this was the case in 2 caves, the lack of consistency indicates that it is possible to construct a snow cave where the beneficial effects of windy conditions are neglected. This lack of consistency may relate to the fact that wind speed was not tracked close to the ventilation canal exits. Recordings of the actual flow rates through the canals would be a valuable improvement in future studies. Because snow caves are built on the lee side of snowdrifts, the interplay between ventilation rates and windspeed may also be affected by the size of the snowdrift and the angle/position of the ventilation canal. Insight into these parameters could further improve the guidelines for snow cave designs to optimize CO clearance in windy conditions where exposure to the environment is harsher compared to no-wind days.
Limitations
One of the strengths of this study is field testing, but it also comes with challenges and several limitations. CO measurements were taken from a single point in the cave. Additional CO monitors within the caves, preferably with automated logging, could be beneficial to clarify CO dynamics and also eliminate any potential influence of the observer's position at the cave entrance. Additionally, we recommend enhancing the time resolution of CO recordings during the priming phase, as 1 minute was suboptimal for accurately capturing the true CO peak during this brief phase. Stove-related combustion issues include only using 1 stove and 1 pot size, 9 not measuring the total CO production created by the stove, and not repeating the experiments with white gas for priming and with other types of fuel like kerosene, which may result in higher CO production. 14 Additionally, the production of soot residue on the burner and pot could affect CO production during repeated trials, as the stove was not cleaned after every trial. The fuel containers were not refueled with fresh fuel after each trial, and therefore, the fixed number of “pumps” may have resulted in a lower pressure in the fuel tank in some trials. A better understanding of the CO diffusion through the snow wall could also be achieved with recordings of the wall thickness and snow density, as well as repeating the experiments in occupied snow caves with glazing on the inside of the snow walls. Finally, the present data were obtained with what we can assume is sufficient oxygen availability for the burner (clear blue flame), which may not be the case in a poorly ventilated cave with multiple occupants, theoretically resulting in incomplete fuel combustion and excessive CO production. 5
Conclusions
Snow melting inside a snow cave due to the extremes of weather is by no means a recommended procedure, but we conducted this experiment to give arctic explorers some data to make an informed decision. Although our data indicate that a single 10 min cooking session resulted in CO levels that could be tolerated, this was achieved under strictly standardized conditions and nevertheless resulted in large variations in CO levels between the snow caves. Furthermore, we must emphasize that these data cannot be extrapolated to longer and/or repeated cooking sessions or caves occupied for longer durations due to the unknown effect of glazing. Finally, there is a risk that the CO levels will be manyfold higher if any of the standardized conditions in the present study are changed, including any changes made to the equipment and fuel, as well as changes to the design of the snow cave.
Footnotes
Acknowledgments
Instructors at the Sirius Dog Sled Patrol for technical assistance with cave design and relevant equipment. PhD Bryan Haddock for helping with iteration.
Author Contribution(s)
Declaration of Conflicting Interests
The author(s) declared no potential conflicts of interest with respect to the research, authorship, and/or publication of this article.
Funding
The author(s) received no financial support for the research, authorship and/or publication of this article.