
Abstract
Introduction
Aquatic envenomations are common injuries along the coastal United States that pose a public health risk and can cause significant morbidity. We examined aquatic envenomation exposures that were called in to poison control centers (PCC) in the United States from 2011 to 2020.
Methods
The Association of Poison Control Center's (AAPCC) National Poison Data System was queried for all aquatic envenomations reported during the 10 y period from January 1, 2011, to December 31, 2020. Data collected included date, exposure and geographic location, patient age and sex, signs and symptoms, management setting, treatments, and clinical outcome. Duplicated records, confirmed nonexposure, and reports not originating within the United States were excluded.
Results
There were 8517 human aquatic envenomations reported during the study period, 62% (5243) of whom were male; 56% (4264) of patients were 30 y or younger. There were an average of 852 calls per year, with 46% of calls occurring during June to August. California, Texas, and Florida had the highest number of envenomations during the study period. Fish (61%; 5159) and Cnidaria (30%; 2519) envenomations were the most common exposures. Overall, 37% (3151) of exposures were treated in healthcare facilities, with no deaths reported.
Conclusions
The highest proportion of aquatic envenomations occurred among younger males (≤30 y) during the summer months. While rarely leading to major adverse events, aquatic envenomations were commonly reported injuries to PCC and occurred in all 50 states. Poison control centers continue to be real-time sources of information and data regarding aquatic envenomation trends.
Introduction
Aquatic envenomations are common injuries seen along the coastal United States. While rarely fatal, they are a notable public health issue in these regions that can cause significant morbidity. In the Chesapeake Bay alone, there are an estimated 500,000 jellyfish envenomations every year. 1 Stingrays injure an estimated 2000 people each year and are the leading cause of fish envenomations in the United States. 2 Predictably, most of the human-marine contact and envenomations occur during the summer months of June, July, and August.2–4
Increases in population and coastal development coupled with rising ocean temperatures and sea level are likely to result in more human interaction with aquatic life. 5 Because of the common incidence of aquatic envenomation and a predicted increase in human-aquatic life contact in the coming decades, it is important to better understand the epidemiology behind aquatic envenomations and to assess how trends change over time. Although prior epidemiological studies have been performed in California and Texas, they are limited to selected envenomations and local data from state poison control centers.3,4,6 An additional study using a national poison control database has examined animal envenomation; however, it was limited to pregnant women. 7 There has not been a recent report dedicated to the epidemiology of aquatic envenomation in the United States as a whole. This article examines the epidemiology of aquatic envenomations that were called in as exposures to poison control centers in the United States over a recent 10 y period.
Methods
This study was deemed exempt by the institutional review board at the University of California San Diego Health. Data were obtained and analyzed for all aquatic envenomation cases reported to US Poison Control Centers over a 10 y period from January 1, 2011, to December 31, 2020. Case data reported to the American Association of Poison Control Centers (AAPCC) was uploaded automatically to the National Poison Data System (NPDS), also known as the AAPCC Toxic Exposure Surveillance System database, on a near real-time basis. AAPCC generic category codes used for data acquisition included 232000 (Fish Stings), 231000 (Jellyfish and Other Coelenterate Stings), and 164248 (Other or Unknown Marine Animal Bites and/or Envenomations). The number of centers reporting during the time period of 2011 to 2020 ranged from 57 to 55, and the US population ranged from 315.7 million to 336.4 million people.8,9
Data obtained included the date of exposure, state, patient age and gender, route of exposure, exposure geographic location, signs and symptoms, management setting, treatments, and clinical outcome. Parameter subgroups were derived from those provided in the NPDS database. Further classification of the species of fish or Cnidaria (Coelenterata) was not collected and, therefore, not examined. Duplicated records, cases with confirmed non-exposure (n = 4), and reports not originating within the United States (n = 157) were excluded. For analysis of signs and symptoms, only clinical effects recorded as related to the envenomation were included. For the analysis of treatments, only those recorded as “performed” or “recommended and performed” were included.
Medical outcomes were based on the NPDS scoring system: no effect, minor effect, moderate effect, major effect, and death. The AAPCC Annual Report of NPDS further classifies these outcomes. No effect refers to no signs or symptoms as a result of the exposure. Minor effect refers to some signs or symptoms as a result of the exposure that are minimally bothersome to patients and resolved without disability or disfigurement (skin irritation, drowsiness, self-limited GI symptoms, transient cough). Moderate effect refers to symptoms that are more pronounced and prolonged than minor symptoms in which treatment is usually indicated (corneal abrasion, fever, disorientation, hypotension responsive to treatment, brief seizures). Major effect refers to signs and symptoms that were life-threatening or resulted in disability and disfigurement (repeated seizures or status epilepticus, respiratory compromise requiring intubation, cardiac or respiratory arrest, disseminated intravascular coagulation). 9
Incidence of envenomation per state was calculated using total envenomations during the study period and state populations from the 2010 US Census, the first year of the study period. Data on location, date, and time of year was used to calculate incidence of envenomation along the Atlantic Coast states during the summer months from June to September. Three regions were identified for comparison, and only states bordering the Atlantic Ocean were included in the analysis. The three regions were defined as New England (Maine, New Hampshire, Massachusetts, Connecticut, and Rhode Island), Mid-Atlantic (New York, Delaware, New Jersey, Maryland, and Virginia), and South Atlantic (North Carolina, South Carolina, Georgia, and Florida). Incidence of envenomation occurring during the study period from June to September was calculated using total envenomations per population for each state along the Atlantic Coast. The incidence of envenomation per state was averaged over each region to identify an incidence of envenomation per 100,000 individuals per region.
Analysis of variance (ANOVA) was used to investigate the differences in medical outcomes of fish and cnidarian envenomations. Excel (Microsoft Corporation, version 16.69.1) was used to generate a state-level frequency map of reported aquatic envenomations.
Results
From 2011 to 2020, 21,780,979 human exposures within the United States were reported to the AAPCC Toxic Exposure Surveillance System database. Of these reports, 8,519 were due to aquatic envenomations. This was a mean average of 852 calls per year, with 2011 being the highest reporting year (Figure 1). Demographic data (Table 1) shows that by reported age, 56.3% were younger than 31 y, with predominant male exposure (62%). The months with the highest incidence of reported envenomations were the summer months of June (13%), July (17%), and August (16%) (Figure 2). Most of the reported encounters were caused by fish envenomations (61%) followed by Cnidaria envenomations (30%) (Table 1).
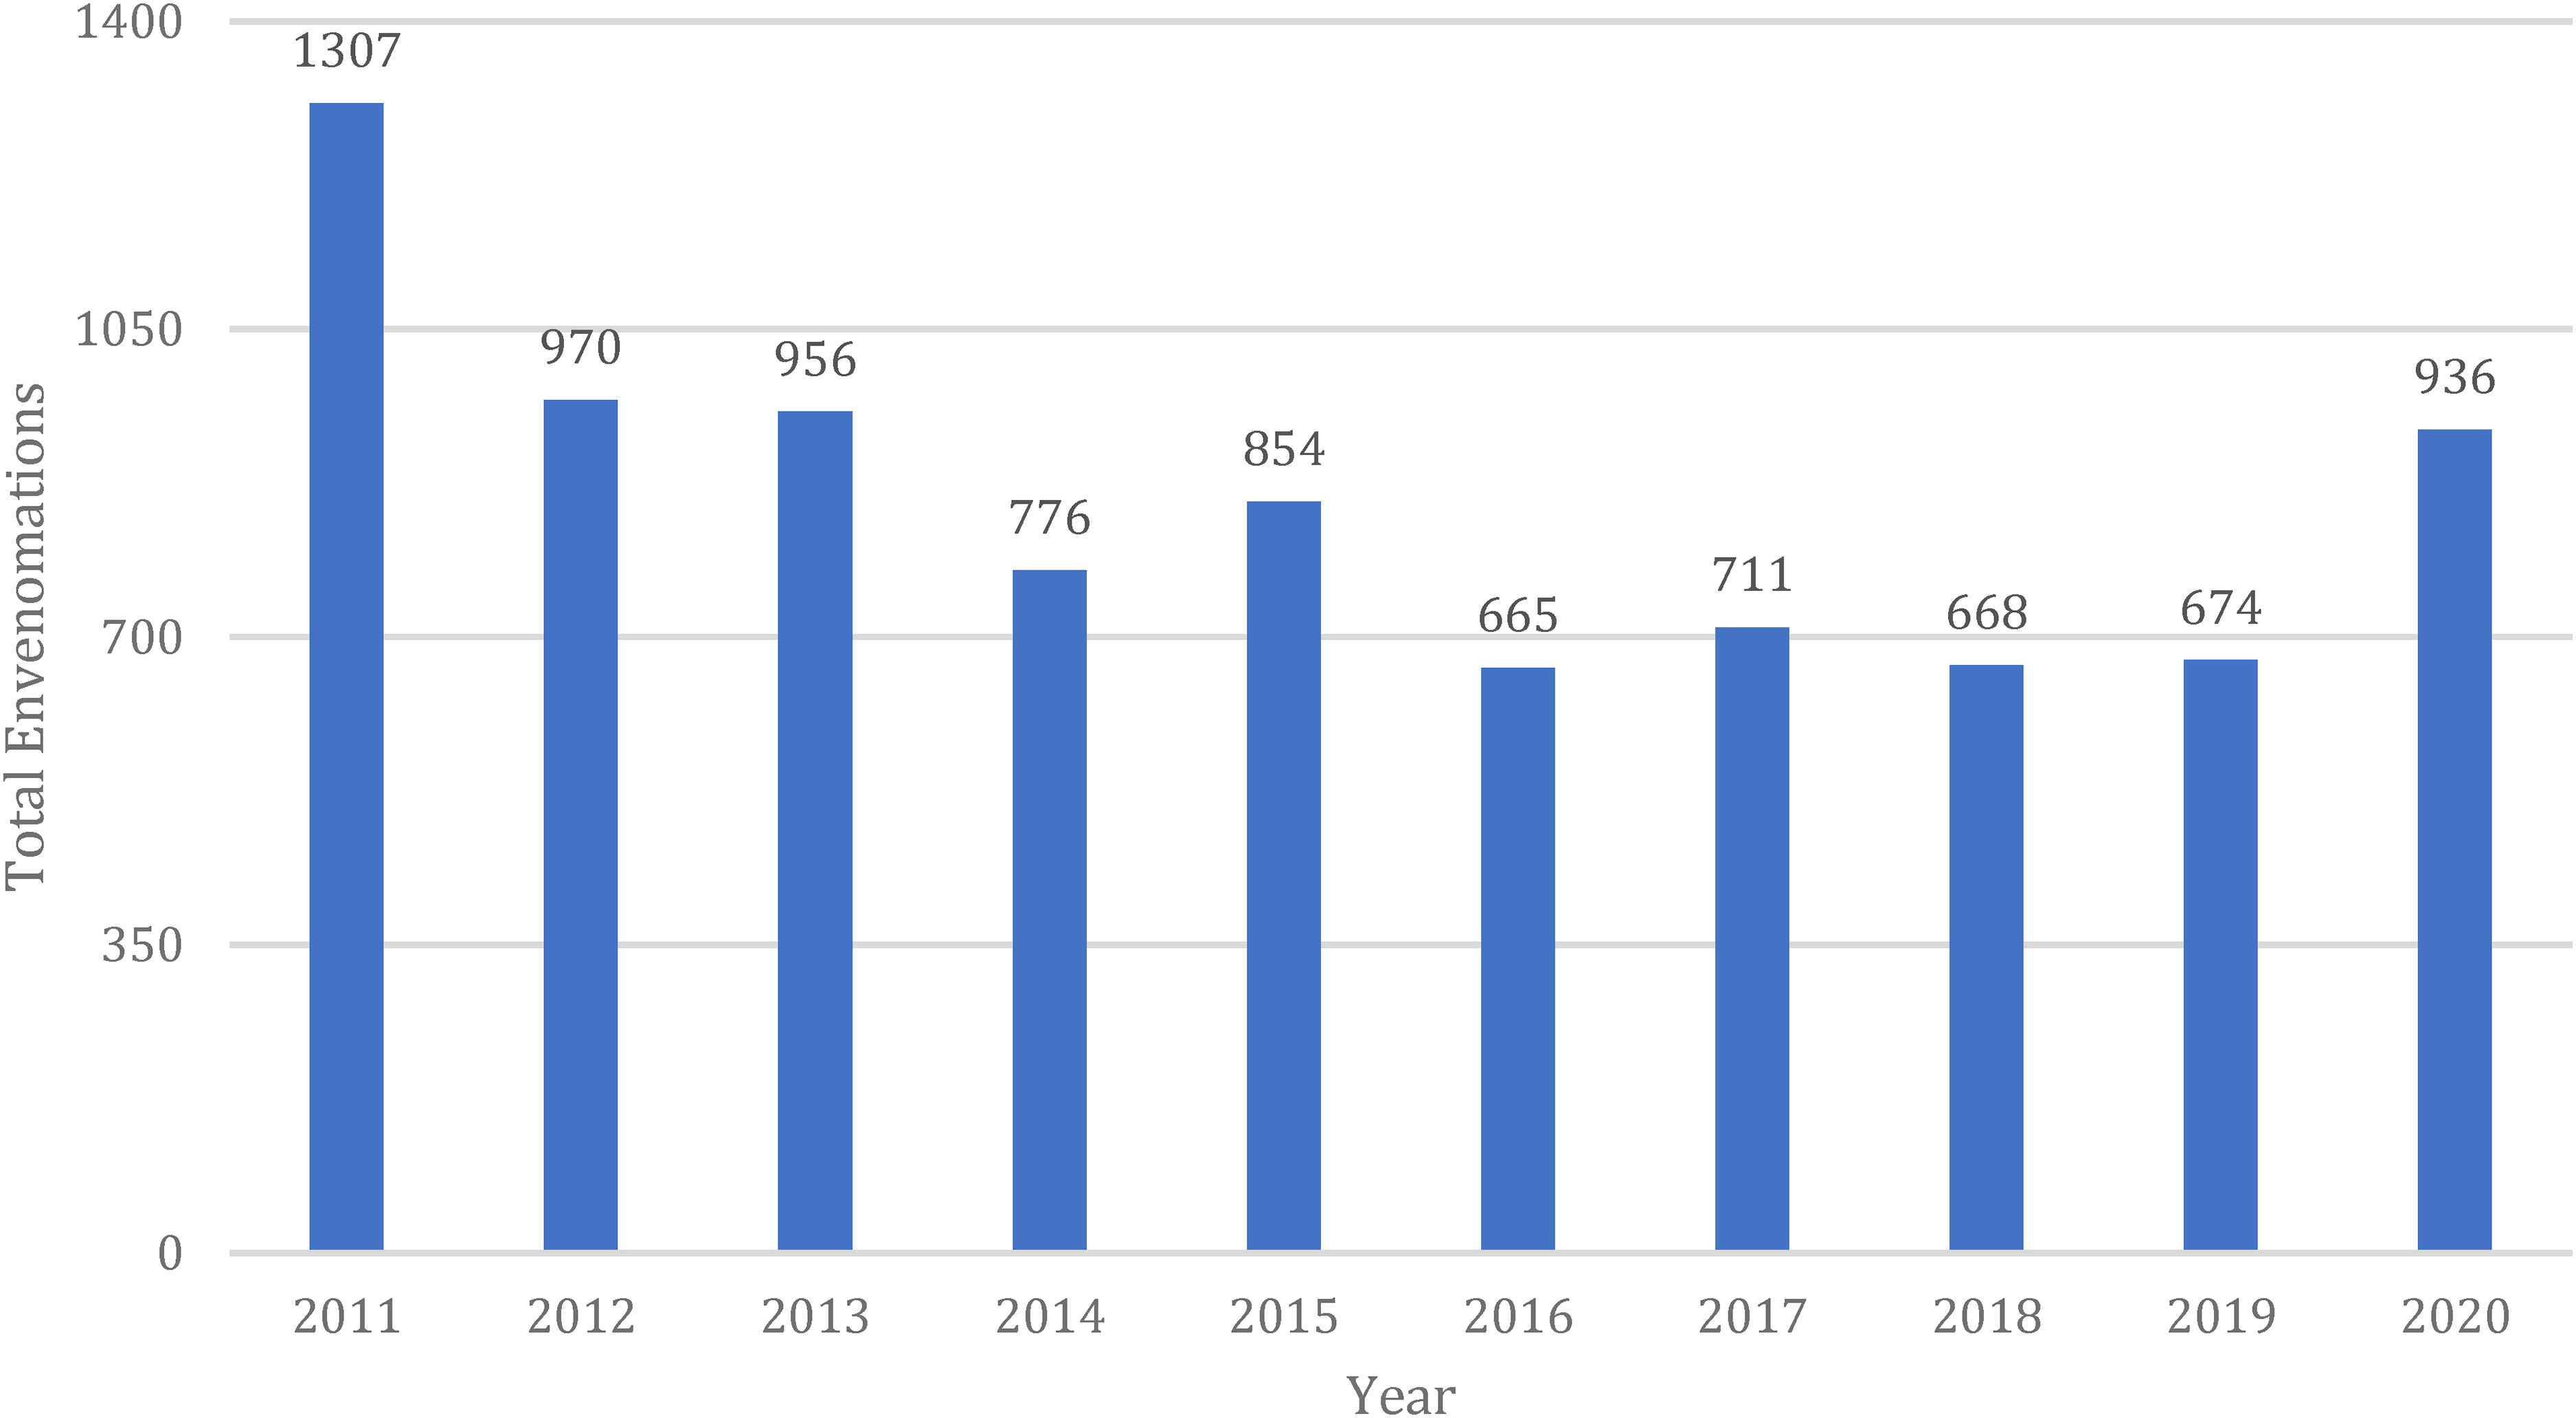
Bar graph depicting total envenomations by year during the study period.
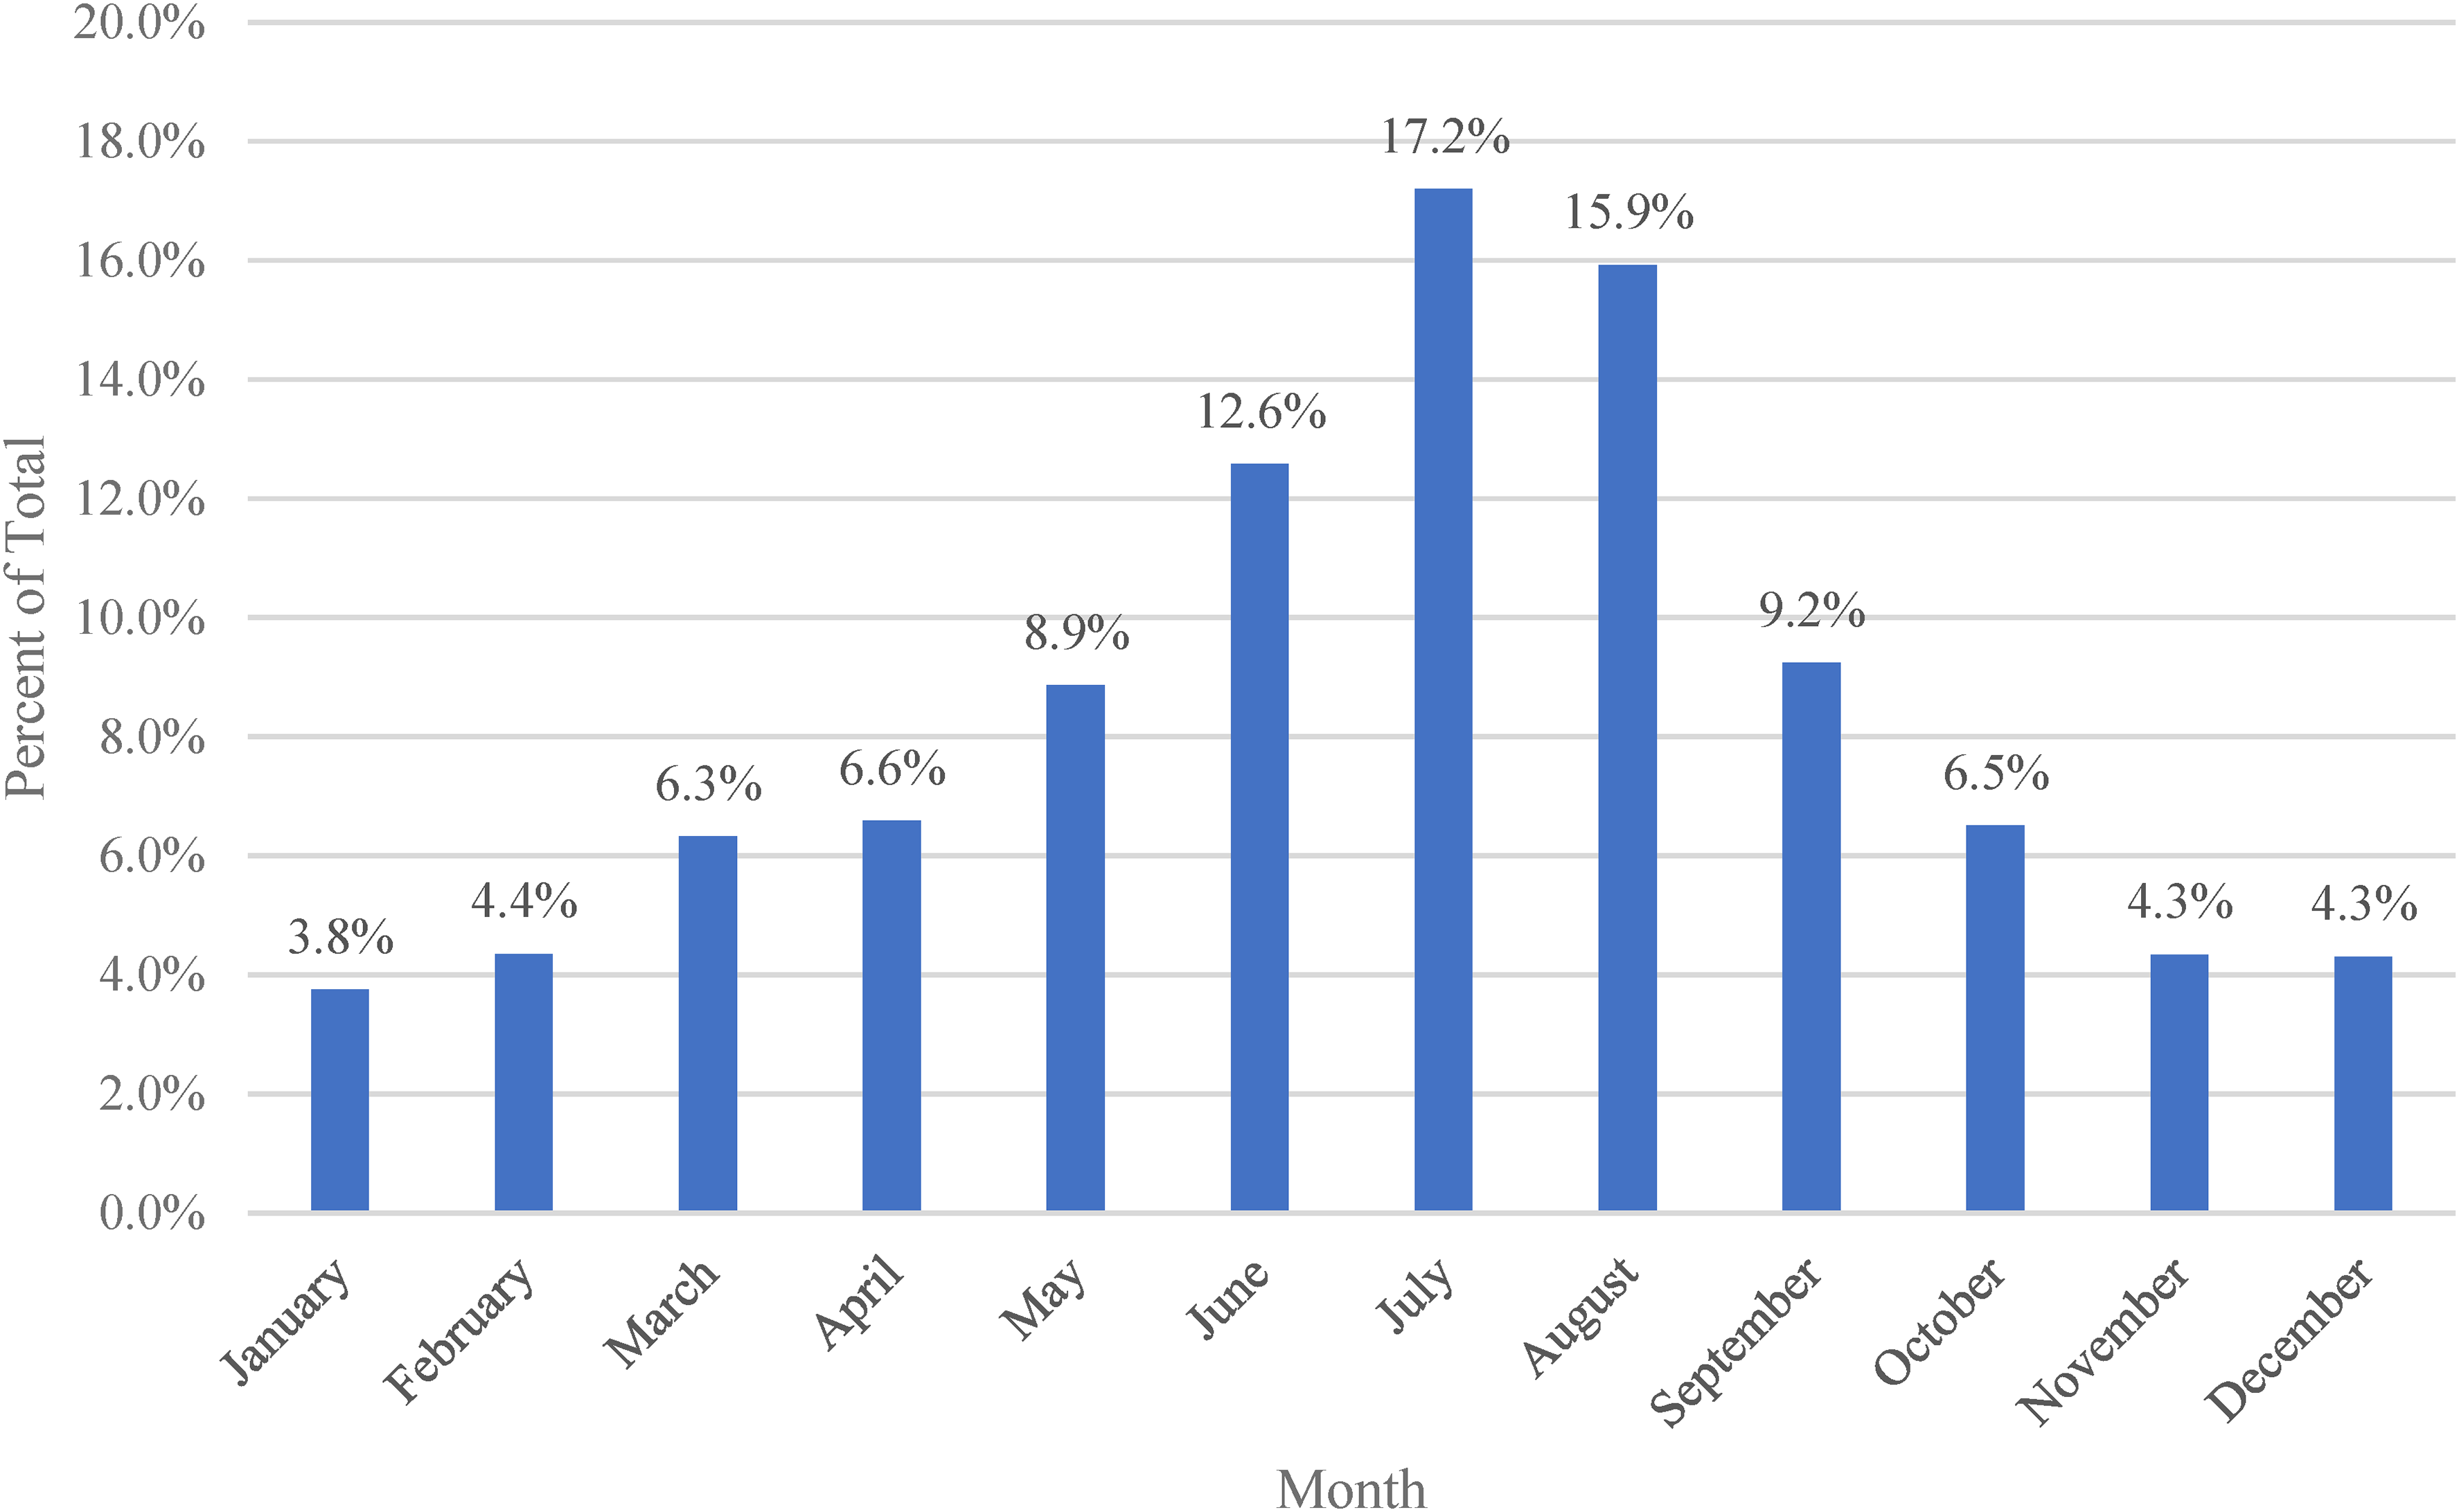
Bar graph depicting the distribution of envenomations by month, displayed as a percent of total envenomations, throughout the study period.
Demographic data on aquatic envenomations reported to AAPCC between 2011 to 2020.
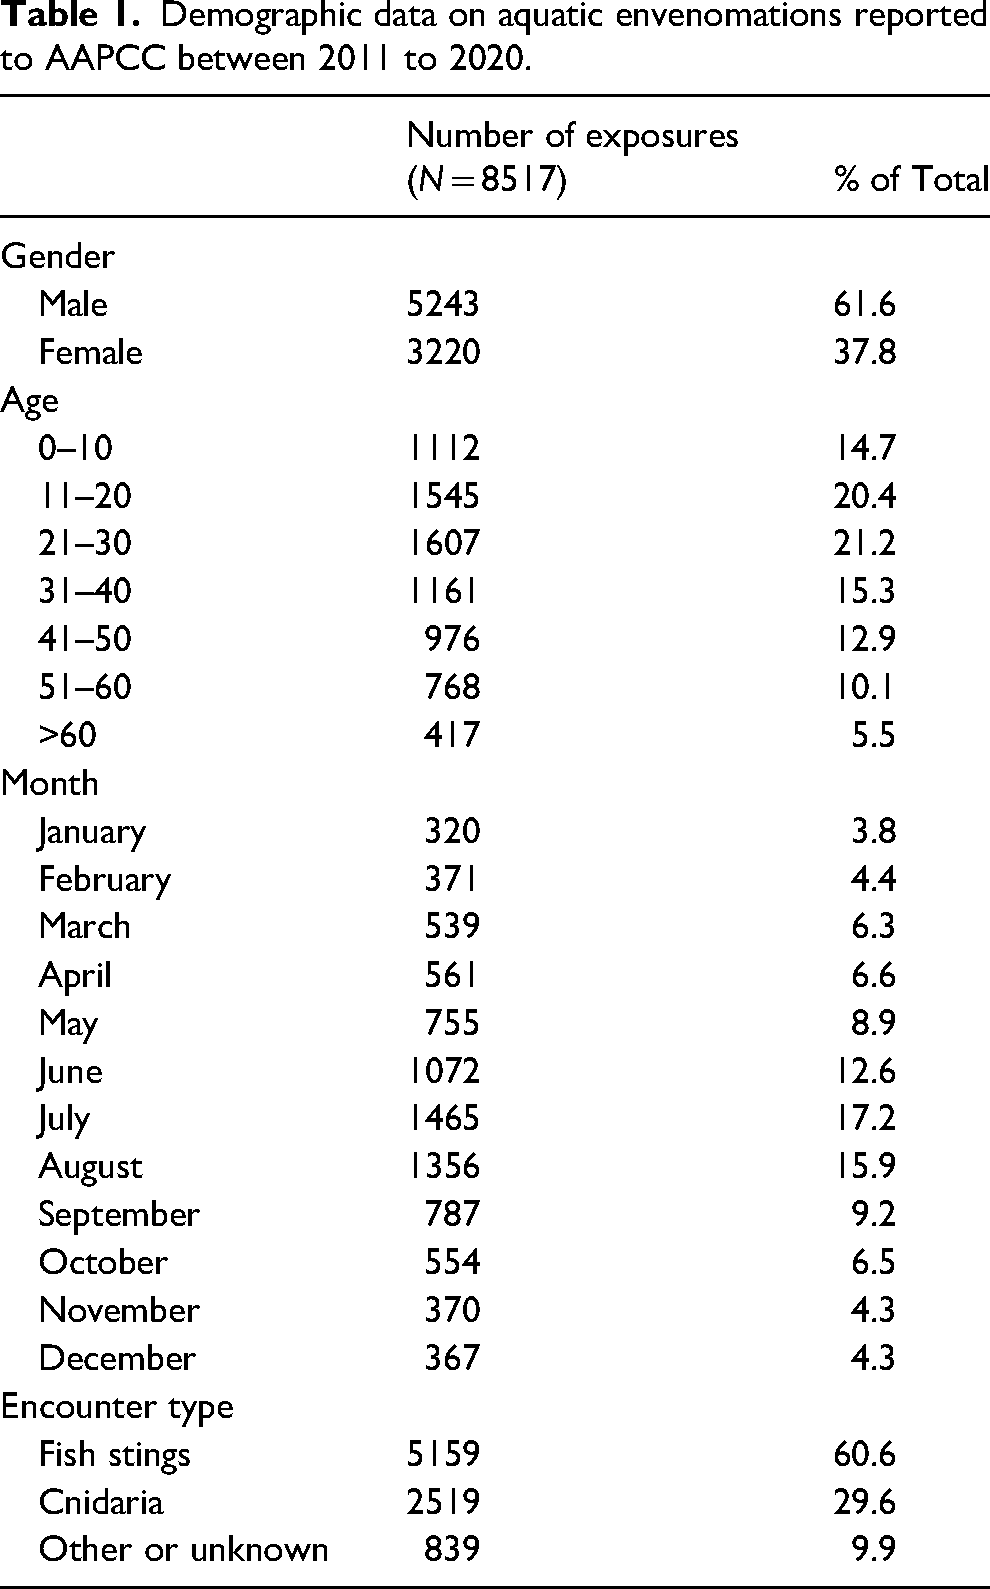
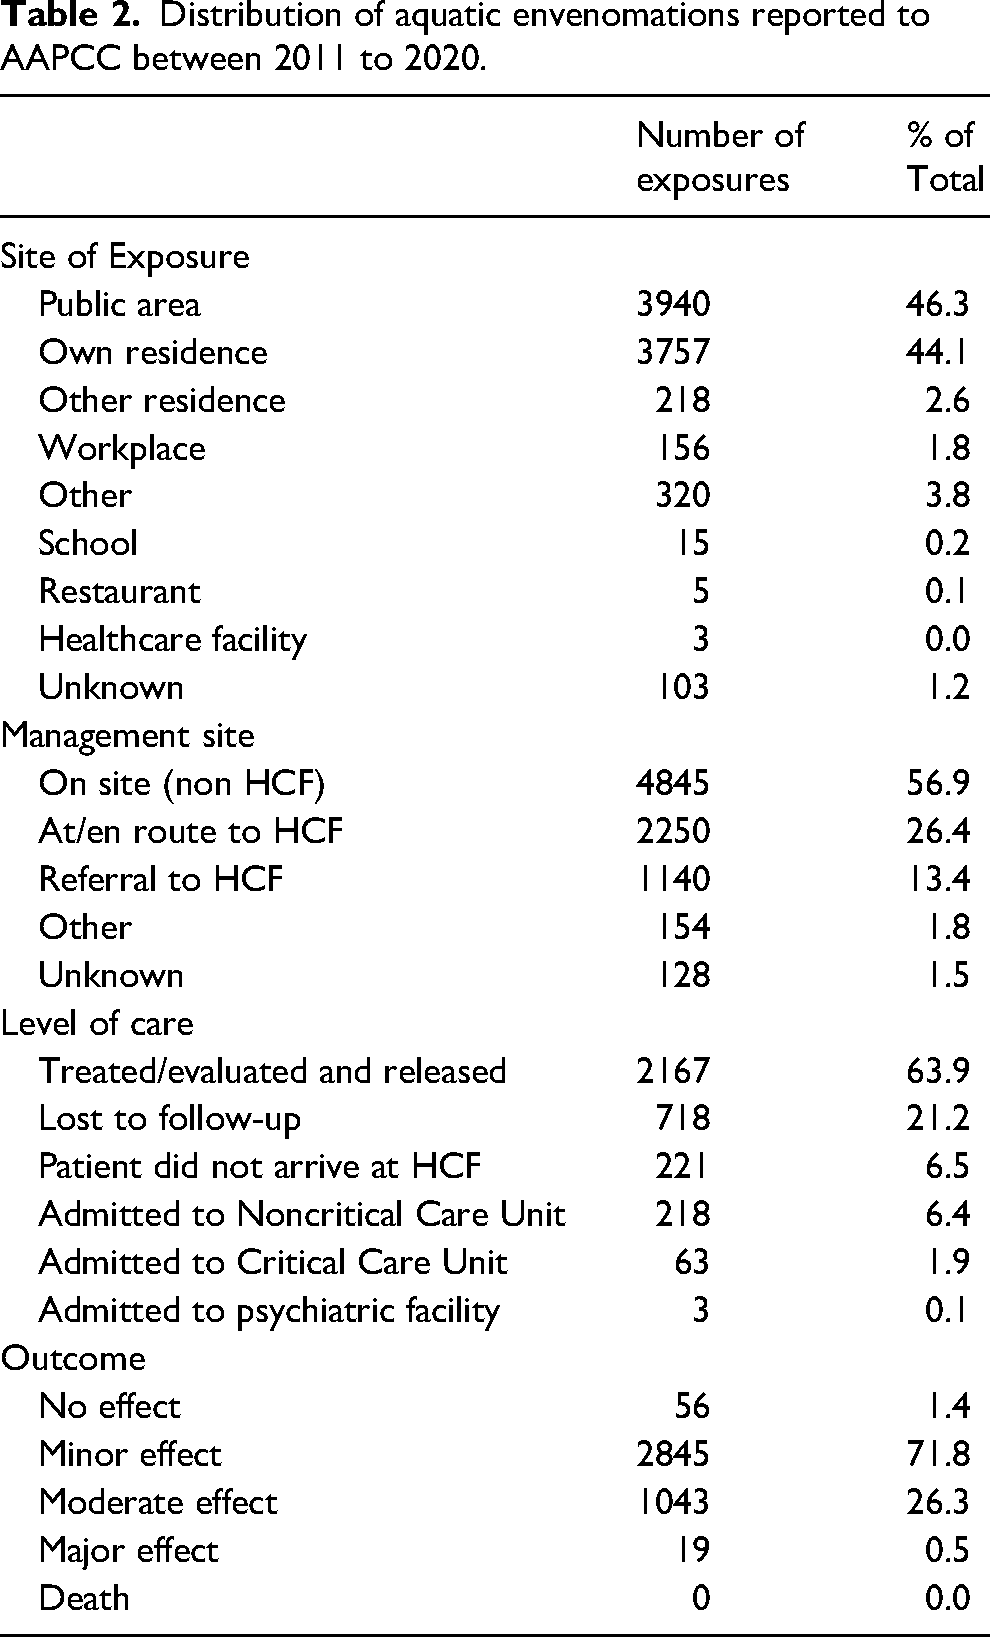
Table 2 describes the exposure geographic location, management setting, level of care required for the exposure, and medical outcome. Most exposures occurred in public areas (46%) or personal residences (44%). While most of these encounters were managed on-site, a total of 3169 patients (37%) were treated at a healthcare facility (HCF). Although a majority of patients were treated and released from the hospital 2167 (68%), 218 patients (7%) were admitted to a noncritical care unit, and 63 patients (2%) were admitted to a critical care unit. Of the 3,963 cases with a known clinical outcome, a majority had a minor effect (72%) from the encounter, whereas 26% had a moderate effect. There were 19 major effects (0.002%) noted during this 10 y period, and no deaths were reported. Further breakdown of medical outcomes based on type of exposure is listed in Table 3. There were no significant differences (P = .99) in the rate of minor, moderate, or major outcomes for envenomations from fish compared to Cnidaria.
Distribution of aquatic envenomations reported to AAPCC between 2011 to 2020.
Exposures, hospitalizations, and outcomes reported to AAPCC between 2011 to 2020.
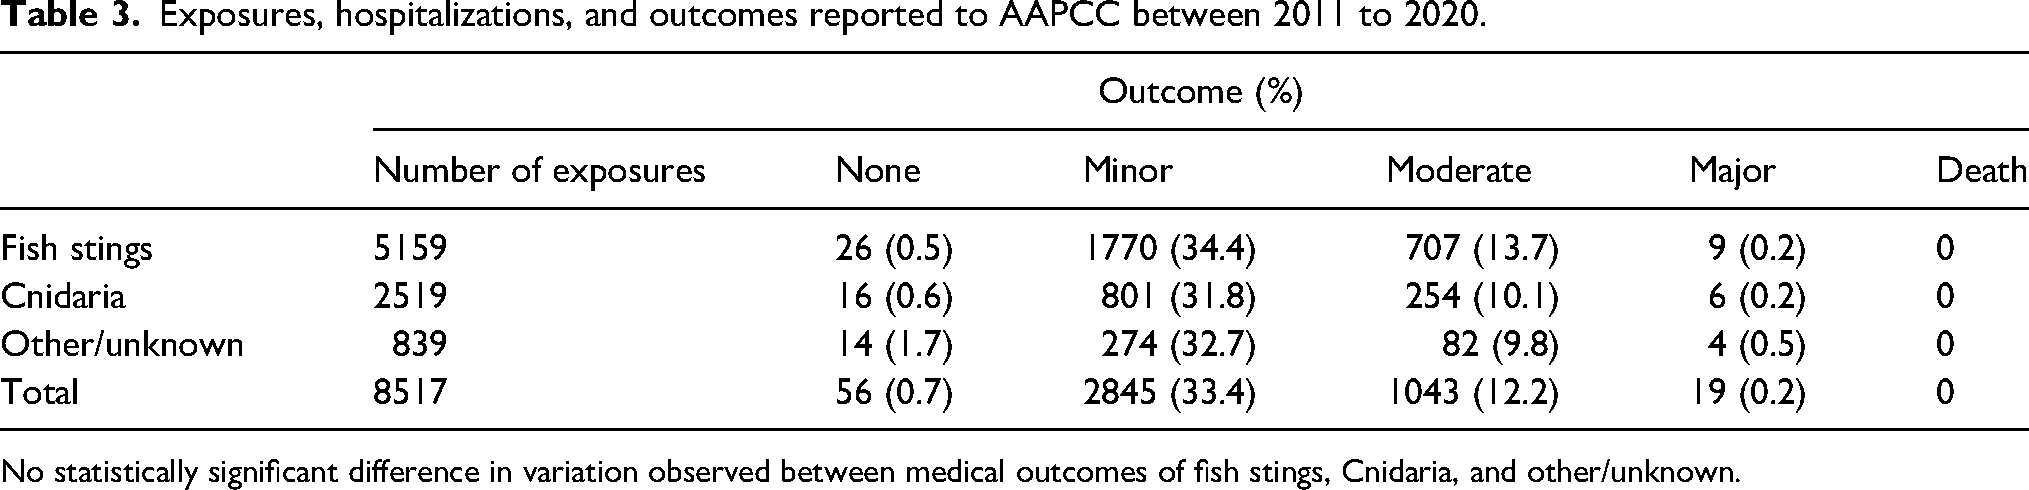
No statistically significant difference in variation observed between medical outcomes of fish stings, Cnidaria, and other/unknown.
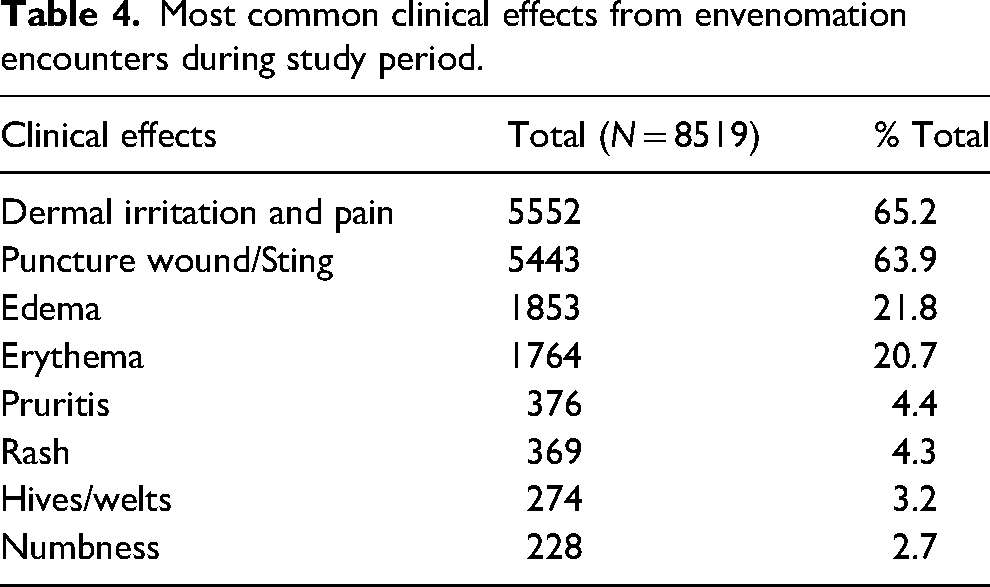
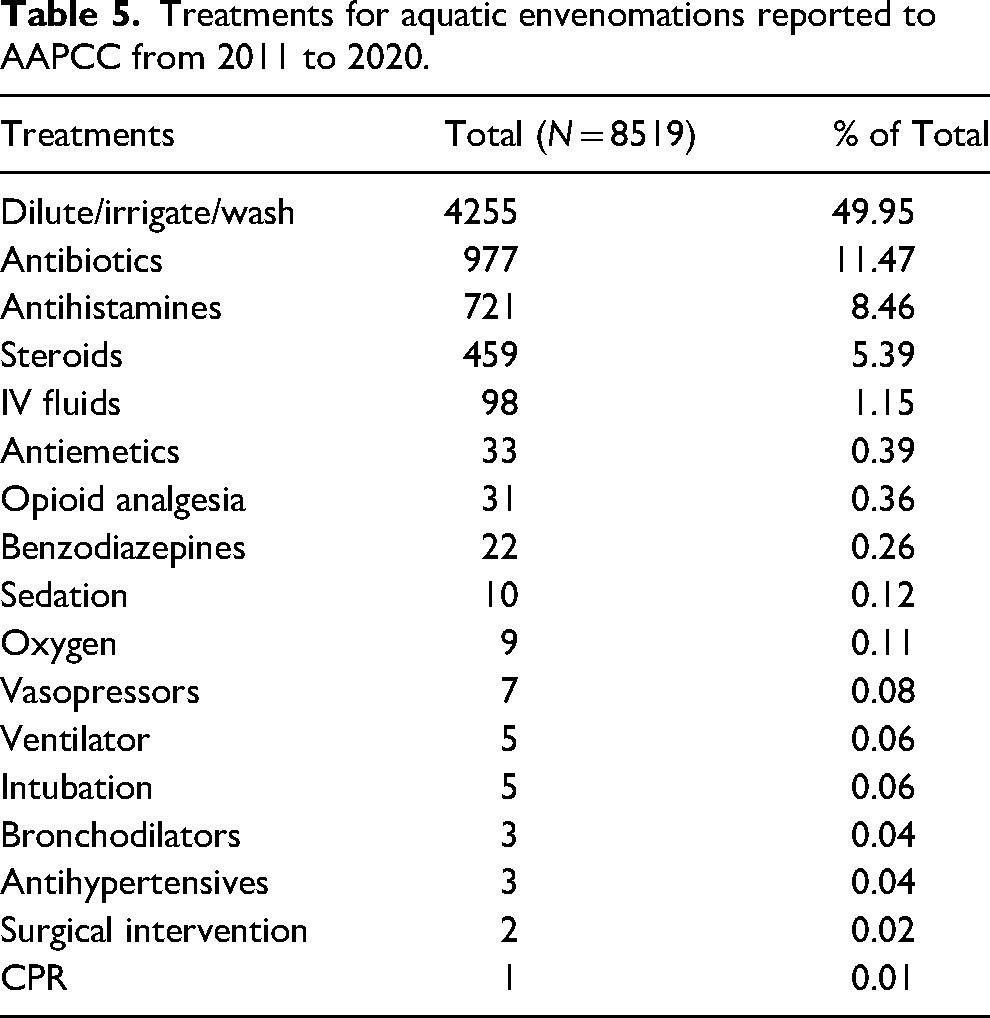
Specific exposure body location was insufficiently reported and could not be analyzed. Dermal irritation and pain (65%) and the presence of a puncture wound or sting (64%) were the two most common clinical effects of envenomation (Table 4). Edema (22%) and erythema (21%) of the area surrounding the envenomation were seen in more than 1 in 5 patients. Over half of the patients were treated with decontamination by irrigation, dilution, or washing (50%) (Table 5). The next most common therapies utilized were antibiotics (12%), antihistamines (9%), steroids (5%), and IV fluids (1%); 7 patients (<1%) required treatment with vasopressors and 5 patients (<1%) required both intubation and ventilation.
Most common clinical effects from envenomation encounters during study period.
Treatments for aquatic envenomations reported to AAPCC from 2011 to 2020.
A total of 63 patients (2%) admitted to the hospital were admitted to the critical care unit. Among these patients, only 1 (<1%) had a major effect, 18 (29%) had a moderate effect, and 24 (38%) had a minor effect. The remaining patients were not followed, or the exposure was judged to be not responsible for the effects that led to their admission to a critical care unit.
Among the 19 patients that had major effects from an aquatic envenomation encounter, 1 was admitted to the critical care unit, 4 were admitted to noncritical care units, 9 were treated and released from an HCF, and 4 did not arrive at an HCF or were lost to follow-up. The one patient admitted to the critical care unit was a 26 y old male who suffered a Cnidaria envenomation and was found to have elevated anion gap acidosis, electrolyte abnormalities, renal failure, and respiratory depression. The patient received intravenous fluids, sedation, intubation, and mechanical ventilation. Additionally, a 59 y old male suffered a fish envenomation and subsequently experienced an asystole arrest requiring cardiopulmonary resuscitation. He was successfully resuscitated, treated, and ultimately discharged from the hospital.
Geographically, most envenomations occurred along coastal states: Florida 2967 (32%), California 1307 (15%), and Texas 623 (7%) (Figure 3). The average incidence of envenomation during the study period was 2.8 per 100,000. Incidence of envenomation per 100,000 residents by state was highest in Hawaii (16.7), Florida (15.78), and South Carolina (5.19). During the study period, there were no significant annual changes in the reporting rates of the top 3 states.
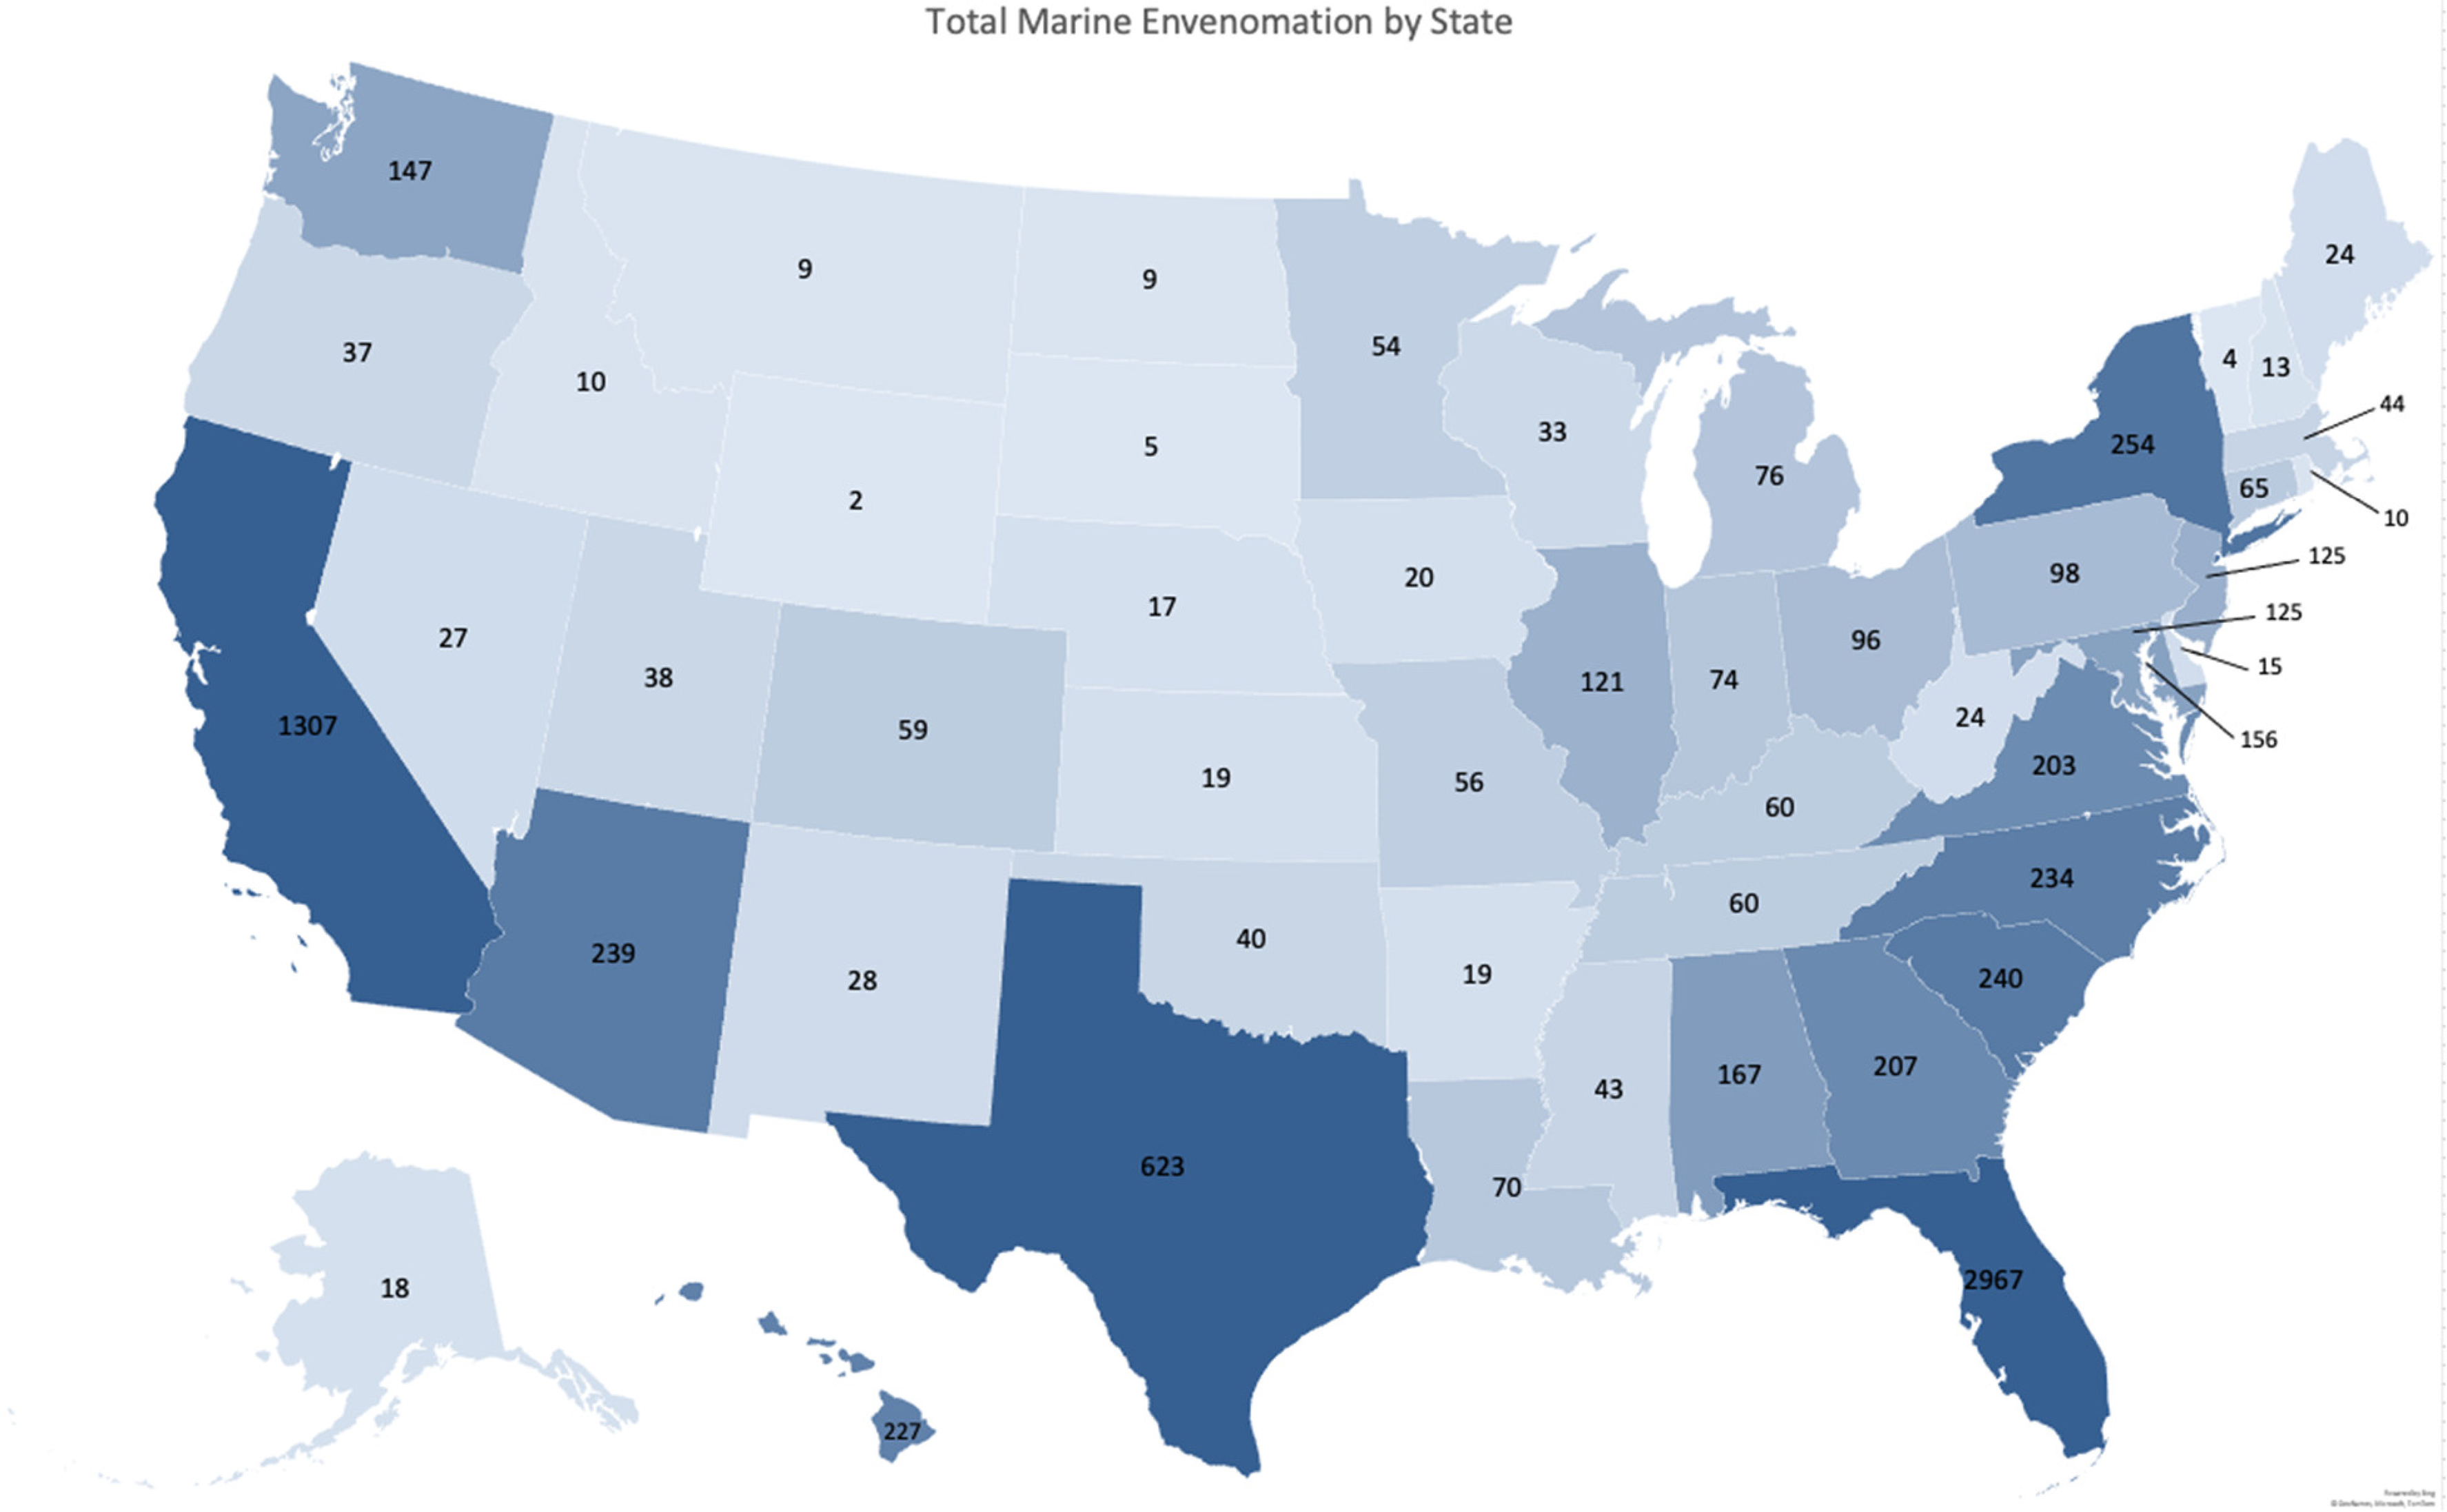
Map chart of the United States depicting the total envenomations reported to AAPCC in each state during the study period. States with darker gradients have higher total envenomations during the study period, and states with lighter gradients have fewer total envenomations during the study period.
The highest incidence of envenomation along the Atlantic Coast during the summer months from June to September occurred in the South Atlantic region (3.72). The incidence decreased geographically moving north, with the next highest incidence in the Mid-Atlantic region (1.49), followed by the New England region (0.81).
Discussion
During the study period, the majority of reported envenomations occurred in patients who were male and 30 y old or younger. This pattern is consistent with similar studies that examined envenomation epidemiology at the state level.3,4 This may be because males and younger individuals more often participate in activities that put them at higher risk of encounters with venomous aquatic life, leading to higher rates of envenomation. The number of envenomations per month followed a seasonal pattern, not surprisingly, in which the summer months of June, July, and August saw the highest total number of envenomations, consistent with previous studies.2–4 Additionally, it has been shown that seasonal changes in stingray migration and jellyfish blooms may coincide with these months. 10 Like humans, stingrays prefer warmer ocean temperatures, and one study found that along the Southern California coast, round stingray populations increased during the summer months and in proximity to warm water outfalls near electrical generators. 11 The increased populations of venomous aquatic life along shores during the summers, coupled with greater human migration toward water sources, both freshwater and saltwater, likely contributed to these increased numbers.
Most envenomations reported occurred in public areas, closely followed by personal residences. We postulate that saltwater aquatic envenomation encounters likely occurred in public areas, such as beaches or fishing areas. Aquariums present opportunities for people to interact with saltwater and freshwater aquatic life and thus were also a likely site of envenomation. The high percentage of envenomations occurring at a personal residence could have represented handling personal pets in home aquariums or cleaning or preparing fish after catching. A similar mechanism could explain the incidence of envenomations occurring at places of work and schools.
Reassuringly, the vast majority of clinical effects from envenomations were minimal to moderate. The most common clinical effects from envenomations included local irritation and pain, puncture wound/sting, edema, and erythema. Less common symptoms included pruritis, rash, hives/welts, numbness, nausea, ecchymosis, fever, cellulitis, and dizziness/vertigo. Rare symptoms included confusion, paralysis, cardiac arrest, and coma. These symptoms were consistent with the findings of multiple studies on the clinical effects of aquatic envenomation.2,12,13 In comparing fish to cnidarian envenomations, there was no significant difference in medical outcomes. There were no deaths recorded during the study period, and very few patients experienced major effects. Still, multiple patients required admission to a critical care unit and one patient suffered a cardiac arrest. Overall, this indicates that aquatic envenomations in the United States are rarely fatal; however, patients can have significant morbidity related to their exposure.
Less than half of the patients who had aquatic envenomations received treatment at an HCF. This is possibly due to the high incidence of mild-to-moderate cases and that the subsequent involvement of an HCF was not necessary. For patients seen at an HCF, the most common treatments for envenomations included irrigation and washing, antibiotics, antihistamines, and steroids. Irrigation is a common treatment recommendation for many aquatic envenomations.6,14 Additional treatments unique to aquatic envenomations, such as hot water immersion or vinegar, have been shown to be efficacious; however, NPDS data regarding whether these treatments were utilized is limited. 15
Geographically, US coastal states were the most common areas for envenomations to occur. This is consistent with other studies that reflect coastal counties having the highest rates of calls to poison control for stingray and jellyfish envenomations.3,4,6 The proximity of people to the natural habitats of aquatic life naturally increases risk of an encounter and envenomation. However, in this study, there were still many envenomations that occurred in landlocked states. These could have been due to handling saltwater marine life in aquariums, or freshwater envenomations, such as from fishing. The freshwater catfish, for example, are known to possess venomous spines whose puncture wounds are incredibly painful. One case report described an embedded catfish spine in a freshwater fisherman that caused severe pain and numbness in the affected limb. 16 The presence of envenomations in landlocked states is important to consider as healthcare providers because, while they may not be common, it is still imperative to be aware of the clinical effects and treatments for these types of injuries.
Both the states with the highest number of aquatic envenomations (Florida, California, and Texas) and states along the Atlantic Ocean displayed a trend of decreasing aquatic envenomations per year that mirrored that of a decrease in all-cause envenomations by year reported to AAPCC. During the study period, there was an overall decrease in all calls to PCCs, which may explain the trends observed. In coastal states, such as Hawaii, there may be increasing public knowledge regarding treatments for aquatic envenomations, limiting the number of calls to PCCs. One study examining jellyfish envenomations in Hawaii from 2000 to 2008 found that a majority of cases occurred in nonresidents. 17 This suggests that nonresidents who are less familiar with the risk of aquatic envenomation are more likely to be stung or to ask for a phone consultation. It is also likely that local lifeguards and healthcare professionals are well versed in treating envenomations and may not feel the need to contact their local PCC, further explaining decreasing annual call volumes.
The rate of envenomation per 100,000 residents during the study period was 2.8. This incidence varied depending on the state, with the highest rates of envenomation occurring in Hawaii (16.7), Florida (15.8), and South Carolina (5.2). Comparing the incidence of envenomation along the Atlantic Coast during the summer months of June to September revealed a higher incidence in the South Atlantic states. The incidence of envenomation decreased geographically, moving north from the South Atlantic region to the Mid-Atlantic and New England regions. Both findings suggest water temperature, migratory patterns of marine animals, and beachgoer activity may have influenced envenomation patterns.
Limitations
The NPDS data collected for this study was from the US PCCs, which rely on callers reporting exposures of aquatic envenomation to their local PCC. Therefore, the number of envenomations reported excludes cases in which people did not seek medical care and cases that were treated by local healthcare providers but not reported to PCCs. Therefore, it is likely that the study underestimated the number of envenomations, especially milder cases, throughout the United States. Fluctuations in the number of reports throughout the years likely reflect not only differences in exposure frequency but also differences in the total envenomation occurrences that are reported each year.
Encounters reported to NPDS are distinguished by broad categories, such as fish envenomations, Cnidaria envenomations, and others. The data did not distinguish between the type of fish, such as cartilaginous (stingray) or bony fish (scorpion fish, lionfish, stonefish), and the data was not coded by phyla. Further distinction of invertebrate species that caused envenomations, such as Mollusca (octopus, cone snails), Porifera (sponges), and Echinodermata (starfish, urchins), was not available. This limited our analysis of trends of envenomations during the study period but is an exciting future area of study.
The exposures reported were based on self-report, so aquatic animal sources of envenomation and timing may have been inaccurate. Additionally, some information on signs and symptoms or therapies completed by the patient may not have been provided to the PCC. Data may also have been entered inaccurately into NPDS. For subsets of exposures that occurred in public areas, the data was limited in its ability to verify whether a patient was a resident of the state in which the exposure occurred or if they were visiting from another state and called their home poison control center. This could have affected the number and incidence of envenomations per state.
Lastly, decisions to admit to an HCF and to a specific level of care, as well as clinical management of the patient, were affected by many factors and did not necessarily reflect regional differences in toxicity or severity of the envenomations themselves. Furthermore, there was some discrepancy between the level of care to which a patient was admitted and their management outcome of minor, moderate, and major effects. This is likely because poison center coding is independent from patient symptoms that dictate a medical outcome. For example, a Cnidaria sting leading to a severe allergic reaction that is ultimately stabilized and discharged from the emergency department would be coded as a major effect despite no admission to the hospital.
Conclusions
Most aquatic envenomation injuries reported to US Poison Control Centers took place in public areas or personal residences during the summer months from June to August. Most patients were male and 30 y old or younger and most commonly suffered envenomations from fish followed by Cnidaria. While clinical effects were typically minor to moderate and did not require additional care at an HCF, there were still rare but major adverse events. During the study period, 2011 to 2020, aquatic envenomations were reported in all 50 states, with a predilection for coastal states. Poison control centers continue to be timely sources of information and data regarding aquatic envenomation trends.
Footnotes
Author Contribution(s)
Performed the literature search, contributed to the study design, data collection, data analysis, and data interpretation, and led the writing and critical revisions of the manuscript (TNK). Contributed to the literature search, study design, data collection, data interpretation, writing, and critical revisions of the manuscript (FLC, CHC, and CT).
Declaration of Conflicting Interests
The author(s) declared no potential conflicts of interest with respect to the research, authorship, and/or publication of this article.
Funding
The author(s) received no financial support for the research, authorship, and/or publication of this article.