
Abstract
Which local governments are first to adopt new technology to improve public service delivery? We develop a bureaucracy-driven account, arguing that agencies are constrained by their size, resources, and employee motivations. This means that efforts to adopt new technologies are more likely to succeed in larger agencies. We assess support for this argument by examining the adoption and use of online scheduling information for public transit (the General Transit Feed Specification [GTFS]), which makes transit far easier to use. In California, we find that large agencies where internal champions faced fewer technical and resource constraints outpaced smaller ones. Interview and survey evidence provide support for the mechanisms underpinning our theory. These results underscore the importance of studying organizational drivers of technology and policy adoption more broadly. They also suggest caveats to the decentralization and federalism literatures, which emphasize the citizen oversight and influence is typically greater in smaller jurisdictions.
Technology adoption by government agencies has become fundamental to service delivery. New administrative systems can allow public-sector employees to do their jobs more efficiently, open data portals providing access to information can make government functions more transparent, and web portals and online feedback forms can make it easier to file complaints and access government services. In other words, technology adoption can both facilitate and be seen as a fundamental aspect of service delivery, particularly at the local level (for reviews, see Araral 2020; Feller and Menzel 1978; Grossman, Pierskalla, and Dean 2017; and Pyo 2022).
Which agencies are likely to adopt technologies first and which tend to wait? Given their potential to shape the experiences of public-sector employees and citizens alike, understanding variation in adoption is fundamental to explaining distributional patterns of service delivery. While a growing literature examines how the uptake of technologies like cell phones and social media affects citizen attitudes and political behavior (e.g. Grossman, Humphreys, and Sacramone-Lutz 2014; Guess et al. 2023), government technology adoption has received less attention from political scientists. The main body of political science scholarship on the topic focuses on the adoption of transparency-enhancing technologies, such as e-government initiatives involving open data portals and online complaint registries (Tolbert and Mossberger 2006). These studies highlight significant variation in the extent to which national and local governments have rolled out such technologies, and often emphasize the importance of voter pressure in driving adoption (e.g. Ahn 2011; Bearfield and Bowman 2017; Pyo 2022).
Building on theoretical logic from the decentralization and federalism literatures, there is reason to expect government size to be associated with variation in levels of technology adoption across government agencies—especially when comparing local governments within single countries. These literatures suggest that residents of smaller towns and cities will find it easier to hold local governments accountable because they can more easily access information about government activities and find it easier to pressure local officials (for a review, see Treisman 2007). Following this logic, one would expect public agencies serving smaller populations to, on average, be more susceptible to citizen pressures to adopt technologies that improve the transparency, accessibility, or quality of government services.
Yet technology adoption by local government agencies does not always follow this pattern. Consider, for example, a critical technology that quite literally puts public transit on the map: the General Transit Feed Specification (GTFS). GTFS is a standard for the electronic reporting of transit agency routes and vehicle location, and is necessary to publish schedules with Google Maps, the Transit App, and other leading trip planning software. Developed by Google, GTFS has become the gold standard for trip planning due to Google's massive user base (Barbeau and Antrim 2013). Figure 1 compares the publication of GTFS feeds by local transit agencies of different sizes in the state, operationalized here according to operating revenue. 1 It shows that larger agencies tended to publish first, with smaller agencies gradually catching up.
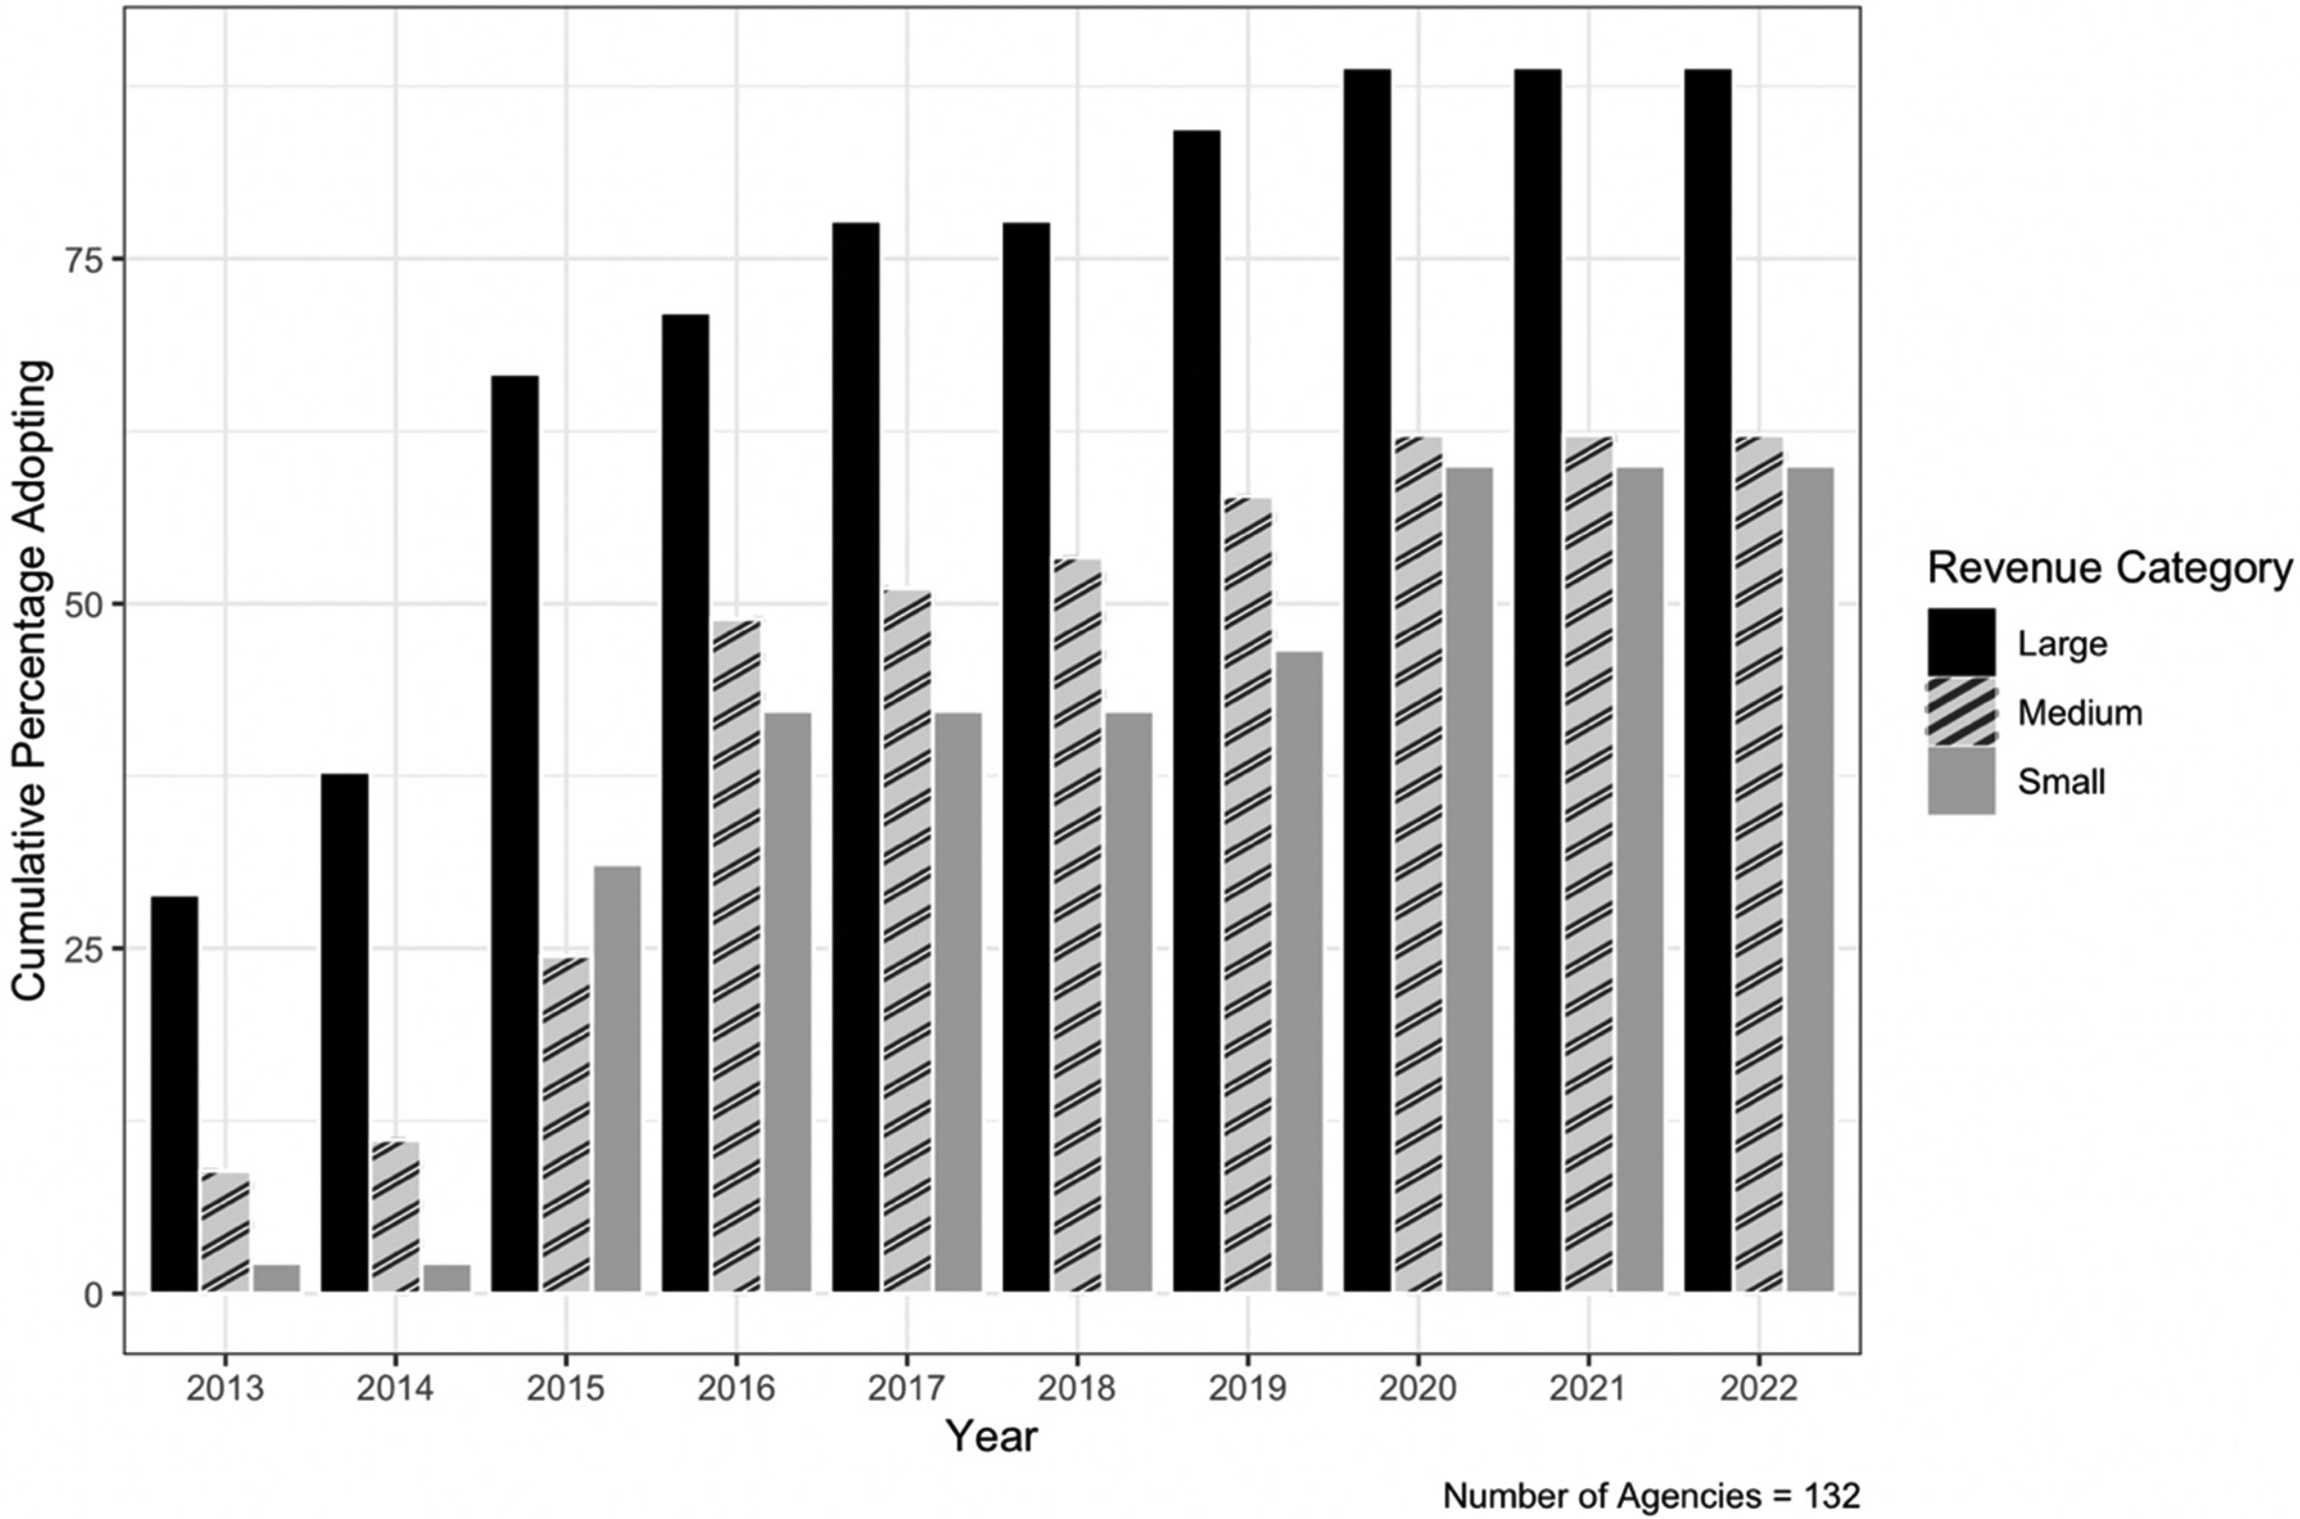
GTFS Adoption (cumulative percentage) and operating revenue (2013–2021).
This pattern is more consistent with other strands of the decentralization and fiscal federalism literatures, which emphasize that larger government units enjoy economies of scale in some policy areas. One could argue, for instance, that technology adoption is easier for larger agencies because costs can be spread over more residents.
This article examines why some agencies adopted GTFS earlier than others, relying on a mix of novel web-scraped data and original interviews. It pits traditional political science theories emphasizing greater voter influence in smaller jurisdictions against theoretical perspectives drawn from Public Administration and Technology Studies foregrounding the strength of bureaucratic drivers of adoption in larger agencies. We contribute to these second lines of theory by identifying four additional mechanisms by which size can facilitate technology adoption. Building on the policy diffusion and technological innovation literatures, we argue that the technical leadership of large agencies includes experts who are exposed to and recognize the potential benefits of these technologies for a diverse set of users even in the absence of electoral pressure. They are also likely to be intrinsically motivated to ensure their agencies perform well (Honig 2021). These actors are best placed to understand the practical benefits of new technologies to implementing agencies, such as new users and reduced complaints. They are more likely to be able to pursue such initiatives in larger cities for several reasons, including fewer resource constraints, greater economies of scale, and a greater likelihood of technology diffusion from nearby jurisdictions. In addition to these reasons developed by the existing literature on technology adoption, we offer four new explanations: the greater prevalence of subject matter experts in larger agencies; the greater service complexity in large urban areas, which means that both users and administrators have more to gain from technical solutions that manage complexity; the fact that larger agencies may face fewer barriers to adoption because new technical systems build upon existing ones; and the tendency of technology vendors to target larger, more visible agencies.
We then draw on three types of original data to evaluate the explanatory power of this supply-side argument to explain GTFS adoption in California. Through webscraping, we created a novel time-series cross-sectional dataset on the publication of GTFS feeds by local transit agencies in California, which we use to identify the main correlates of time to adoption. 2 We find that larger agencies—operationalized in terms of agency revenues—adopted GTFS earlier. Smaller agencies tended to adopt much later. This relationship is robust to the inclusion of a variety of controls, including a proxy for population density (principal city status) and the type of institution providing services. Further analysis of GTFS feed updating following adoption indicates that once GTFS is adopted, larger districts do not update or maintain the feeds more often than smaller districts. The main hurdle appears to be adopting the technology in the first place.
We also conducted both semi-structured interviews and an original survey with California transit agency employees to understand the main motivations and processes behind adoption. Our survey responses and interview testimony emphasize that while agencies adopted GTFS to improve transparency and service quality, the process was typically initiated by agency employees in the absence of public pressure. Supporting the empirical results, champions of adoption were more likely to emerge and faced fewer technical and resource hurdles in larger agencies.
Our theory and results suggest that important political outcomes of interest may not be driven by public pressure, even when policies or innovations directly benefit important voter groups. There is strong reason to believe that organizational initiative is crucial to processes of technology adoption and service delivery more broadly, a dynamic that has received much more attention in Public Administration than Political Science. 3 Moreover, our findings run counter to classic arguments in the decentralization and federalism literatures (for reviews, see Dahl and Tufte 1973; and Treisman 2007), which suggest that residents of smaller towns and cities will find it easier to hold local governments accountable because they can more easily access information about government activities and pressure local officials. Rather, organizational entrepreneurs may face fewer hurdles with adopting technologies that address the concerns and needs of residents in larger agencies.
This suggests that government size—typically operationalized in terms of the effects of changing the tier of government responsible for services, but less often explored in terms of differences at the same tier of government—deserves greater attention as a predictor of technology adoption and service delivery more generally (see Kumar and Stenberg 2022; Post and Kuipers 2023). 4 Recent research on the effects of amalgamation and splintering of local government units represents a useful first cut at these questions (Blom-Hansen, Houlberg, and Serritzlew 2014; Blom-Hansen et al. 2016); our analysis here indicates that further work is needed.
Organizational Drivers of Tech Adoption
Building on disparate literatures and our own research, we offer a theoretical account of why bureaucracies champion technologies that improve service delivery or transparency, and the circumstances under which such efforts are most likely to succeed. Our account focuses on the motivations of, and constraints faced by, individual unelected officials, or bureaucrats, with subject matter expertise and direct exposure to service delivery who are therefore likely to encounter new technologies and anticipate their potential impacts.
We stress the importance of these local-level bureaucrats as drivers of adoption. Indeed, the literature on the adoption of “smart city technologies” underscores the importance of “local champions” for reform (e.g. Araral 2020; Nam and Pardo 2011). 5 Bureaucrats are well positioned to understand how new technologies may improve the experiences of system users. They can observe, for example, that technology such as web portals and apps can help different categories of users choose between service offerings and use them. This can increase demand for the services in question (desirable when fees help finance service provision) and decrease the frequency of calls for information or complaints, thereby reducing employee workload. In addition, technologies can also be useful for internal operations, such as making existing processes more efficient or safer for employees. The realization of these potential benefits can directly influence bureaucrats’ day-to-day jobs and also accord with intrinsic motivations to serve clients and to contribute to their agency's reputation and financial health (Feller and Menzel 1978, 482), leading them to become internal champions of reform.
We contend that such bureaucratic champions are particularly important in large and prominent local public agencies for several reasons. First, following the fiscal federalism and decentralization literatures, we stress that larger governments enjoy greater economies of scale (see Oates 1972; Prud’homme 1995). This means that the costs of new technologies and IT professionals can, at least in theory, be spread over larger number of residents. 6 Consistent with this logic, the classic scholarship on technological innovation argues that size endows larger agencies with more “organizational slack” to explore and adopt new technology and other types of innovations (Rogers 2003). Larger agencies have more resources to support dedicated IT staff who can focus on evaluating, setting up, and maintaining new systems (Moon 2002, 430). A related way in which organizational slack matters—unacknowledged in the literature to-date—is that larger agencies have dedicated procurement professionals or teams who can negotiate contracts with vendors.
Second, as the policy diffusion literature emphasizes, larger government agencies—particularly if they are centrally located—tend to be more cosmopolitan. As a result, employees tend to learn about and experiment with new policies earlier by virtue of their network centrality (Skogan and Hartnett 2005; Weisburd and Lum 2005). This argument is consistent with classic scholarship on technology diffusion (for a review, see Rogers 2003, 409–13). The technical leadership of such agencies tends to be well integrated in professional networks where news of innovations disseminates. 7 Professional associations both connect technology suppliers with prospective adopters and allow adopters to share positive experiences with peer organizations (Kimberly 1978; Swan and Newell 1995). Embeddedness in professional networks and connections with academic researchers supportive of adoption may also be greatest in central urban areas (e.g. Bowers 1937; Damanpour and Schneider 2006; Weisburd and Lum 2005).
We introduce four additional reasons why technology adoption by government agencies may occur earlier with larger agencies—reasons that are not highlighted in existing literatures, and that emerged inductively through our preliminary, qualitative research on GTFS. First, employees in larger agencies are more likely to be subject matter experts; larger agencies are less likely to need to split employees between multiple roles because staff sizes are larger. For instance, a transportation planner can focus on transportation planning rather than moonlighting in customer service, and an IT systems manager can focus on the IT system. 8 This gives staff the ability to increase their exposure to new technology by reading relevant professional journals and attending conferences where technologies are discussed, and to deepen their knowledge and consider the potentially fruitful applications of new technology.
Second, greater complexity in larger urban areas increases the potential advantages of new technical solutions because there is typically a greater need for coordination between different services. For example, a transit user may take a bus and then the metro or change between different bus lines, which would make an online platform integrating schedules across routes or types of transit more useful. A transportation agency will be managing a much larger fleet than in a small city, making the use of computer-aided dispatch and automatic vehicle location systems more essential.
Third, agencies with larger systems—for example, more miles of track, more personnel, or more parks—are also more likely to already possess significant IT infrastructure to manage greater complexity. This means new technical systems represent incremental additions to existing ones, making them less costly. For example, adding an open data portal to an existing website may be more straightforward than creating one when one does not even have a website.
Finally, technology vendors tend to target larger agencies proactively in efforts to secure high-profile pilots of their products, and thereby influential testimonials. They understand that larger agencies are central in policy networks, and their actions are very likely to influence others. This leads them to incentivize large and prominent agencies to participate in pilots by offering free or reduced-price services, and/or assistance with tailoring products to their needs. For example, in California's Bay Area, technology vendors often pilot new water technologies with the East Bay Municipal Utility District (EBMUD), which is known for innovation and is influential among west coast utilities. 9
Overall, then, we expect larger agencies to adopt new technologies earlier. Moreover, the same factors that position them to roll out technologies earlier may also lead them to regularly maintain these technologies: more resources, dedicated IT staff, economies of scale, and contact with other agencies may increase the resources available for maintenance, as well as the incentives to invest in it. Smaller, agencies with less revenue, in contrast, are often late adopters (see Shipan and Volden 2012; Walker 1969).
Yet over time, we expect that smaller agencies will eventually catch up with larger peers through a process of policy diffusion (Crain 1966; Walker 1969). In the long run, large agencies can facilitate technology adoption among smaller jurisdictions (e.g. Bowers 1937; Damanpour and Schneider 2006). At first, bureaucrats at smaller agencies will learn of the efforts by larger ones through everyday coordination efforts with neighboring jurisdictions and through professional networks and conferences, with demonstrated effectiveness being important for adoption (see Gilardi, Fuglister, and Luyet 2009; Volden 2006). Over time, citizens will also begin to make comparisons, and bring new expectations to their agencies regarding technologies used elsewhere. Later in the “adoption curve,” then, demand-side pressures and public expectations begin to take on more importance.
Voter-Driven Alternative Explanations
Our bureaucracy-driven account stands in contrast to alternative explanations of technology adoption that center on pressures from citizens and voters. We consider these in our study as well. First, as noted previously, classic theory in the decentralization and federalism literatures argues that citizen oversight and influence is greater in jurisdictions with smaller populations (e.g. Oliver 2012; e.g. Treisman 2007). Following this logic, we would expect new technologies that promise to improve service delivery to be adopted earlier and more often in smaller municipalities or transit districts. Note, however, that these predictions run counter to some recent urban studies scholarship on smart city technology adoption, which finds that reform is more prevalent in larger, urban jurisdictions where there is a more active civil society (e.g. Grimmelikhuijsen and Welch 2012; Yavuz and Welch 2014) and greater demand for reform among wealthier and more educated populations.
Meanwhile, scholarship on e-governance suggests that voter pressure could lead to higher rates of adoption of technologies that improve service quality or transparency where local political environments are particularly competitive (e.g. Harder and Jordan 2013; Pina, Torres, and Royo 2007). In line with studies of transparency reforms at the national level (e.g. Berliner 2014; Harrison and Sayogo 2014; Hollyer, Rosendorff, and Vreeland 2011; Khagram, Fung, and de Renzio 2013), recent research on local e-government reforms finds higher rates of adoption in more competitive municipalities where citizens exert more leverage with public officials (e.g. Ahn 2011; Bearfield and Bowman 2017), though some studies suggest this may not always be the case. 10
Exposure to public pressure, furthermore, should vary with institutional design. In sectors like water and transportation, services are often offered by special district governments that are legally independent from cities and counties (Bollens 1957; Burns 1994; Goodman, Leland, and Smirnova 2021). These special districts typically have administrative and fiscal independence from general purpose governments (Foster 1997). 11 They are often formed to perform or provide a single function or service, such as fire protection or mosquito abatement.
Influential scholarship suggests special districts are less responsive to the general public than general purpose agencies like municipalities or counties. 12 This is because they tend to be less visible than general purpose agencies, with citizens often unaware of district boundaries or the service they provide (Bollens 1957; Burns 1994; Heikkila and Isett 2007). In many cases, special districts are governed by appointed boards. In cases where board members are elected rather than appointed, elections are often nonconcurrent (Anzia 2013; Berry 2009). As a result, there tends to be far lower turnout in special district elections (where they are held) than in municipal ones, with turnout rates typically less than 2%–5% (Burns 1994, 12; Perrenod 1984, 47), 13 and board candidates often run unopposed (Bollens 1957, 30). Where board members are unelected, it stands to reason that public deliberation is even less visible. Scholars have long noted that attendance at special district public meetings is low among members of the press and the public (Bollens 1957, 40). 14 Following this logic, a theoretical focus on public attention and scrutiny would lead one to expect that general purpose agencies such as cities and counties are far more likely to adopt new technologies and do so earlier than their special district peers because they are more concerned about voter perceptions of service quality. 15 They would also be subject to more pressures to ensure that information provided through new channels is up-to-date and accurate. Overall, this body of scholarship emphasizing demand-side factors suggests that adoption may occur earlier in smaller municipalities, and under general-purpose governments (rather than special districts).
A final set of studies on government digitization efforts have found that mayoral characteristics are associated with municipal technology adoption. Scholars have examined the role of gender, incumbency, and the extent of mayoral power (mayoral council versus council-manager form of government) in digitization efforts (see Araral 2020; Tavares and da Cruz 2020). Due to data constraints, we set these arguments focusing on municipal characteristics aside and focus on the more significant institutional difference between special districts and general purpose governments.
Research Design
We assess these explanations of government technology adoption by focusing on the GTFS, a standardized template to publish bus routes, timetables, and schedule changes. 16 When transit agencies publish these feeds, navigation applications such as Google Maps and the Transit app can integrate them into their services, enabling riders to plan their transit journeys more easily and minimize wait times. When transit agencies adjust their schedules, such as during the pandemic, the release of updated scheduling information allows riders to learn quickly of these changes. GTFS feed publication also represents a more convenient way of accessing schedule information for members of the public relative to paper or website postings of schedules. Yet unlike other transit related technologies, such as computer-aided dispatch or automated vehicle location (Ripplinger and Brand-Sargent 2010), GTFS does not require the procurement of additional physical infrastructure and is relatively low-cost to implement (Barbeau and Antrim 2013; Hillsman and Barbeau 2011). As such, resource constraints alone cannot explain variation in adoption.
We focus our study on patterns of adoption and maintenance in the state of California. With many transit providers and higher rates of GTFS adoption than many states, it provides a particularly informative setting in which to examine the drivers of the adoption and maintenance of new technologies. The demographic and socio-economic diversity of the state also allows us to assess the extent to which adoption is associated with other service area characteristics. We first study predictors of early (rather than later) adoption of GTFS. We also study patterns of GTFS schedule updating immediately before and during the pandemic, the latter being a period during which existing schedule information became out-of-date for virtually all transit agencies.
We analyze three main types of data to understand drivers of GTFS adoption. First, we study GTFS feeds issued by California transit agencies. Our dataset covers the 172 out of 227 transit agencies in California that report to the National Transit Database (NTD). 17 Data on agency characteristics come from the National Transit Database (National Transit Database 2013, 2016) and are summarized in Table A1 in the Appendix.
GTFS adoption information was web scraped from Open Mobility Data (OMD), the most comprehensive repository for longitudinal GTFS feed publication, in December 2021. 18 OMD provides the date of publication and content for each feed update. GTFS became standardized in the early 2010s. 19 OMD first began aggregating GTFS feeds in 2013, and we use this date as a starting point, attributing all adoptions prior to 2013 to that year.
GTFS feeds are published in two formats: static scheduling information (GTFS-s) and real-time information reflecting the actual location of vehicles and predicted arrival times (GTFS-r). Our analysis focuses primarily on the historical adoption and maintenance of GTFS-s. We measure maintenance as the number of GTFS updates in a given month, because GTFS updates vary from month to month for each agency from 2013 onward. Recently released data allows us to assess whether patterns are similar for GTFS-r, which requires an upgrade of existing GTFS-static systems. We obtained cross-sectional data on GTFS-r adoption from The Mobility Database, which replaced OMD in Fall 2022. This data does not allow us to observe the timing of GTFS-r adoption; we instead measure adoption as whether an agency published GTFS-r as of November 2022.
Second, we fielded an original survey with California transit agencies in partnership with the California Department of Transportation (Caltrans) in April 2022. Caltrans distributed this online survey to a nearly comprehensive set of 226 fixed-route transit agencies in the state, including members of the main statewide transit associations (the California Transit Association (CTA) and the California Association for Coordinated Transportation (CALACT)), National Transit Database (NTD) Reporters, and Metropolitan Planning Associations in the state. Introductory emails with links to the online survey were sent to Caltrans’ main contacts at these agencies by Caltrans research department staff. We received a 25.2% response rate. While the survey was distributed to a comprehensive set of agencies, responses were skewed somewhat toward larger agencies, in terms of revenue, service area, and population. Descriptive information about survey respondents is located in Appendix Table A3.
Third, we draw on interviews with 15 individuals who were involved with GTFS adoption from a range of different transit agencies in the state. Interviewees were selected from our sampling frame of surveyed agencies and were conducted during November and December 2022. We contacted 20 agencies which varied along our dimensions of interest, approaching equal numbers of large and small agencies, and independent agencies and local governments. A researcher also attended the CALACT 2022 Fall Expo and Conference as an additional means of contacting small and rural agencies. We reviewed interviews for common themes regarding drivers of adoption across agencies. This interview data were particularly helpful for understanding the mechanisms outlined in our theory and arbitrating between our bureaucracy-driven account of technology adoption and one emphasizing pressures by constituents who are also service users.
GTFS Adoption and Maintenance Across California Transit Agencies
There is substantial variation in GTFS adoption and updating by California transit agencies. Despite the fact that publishing such information makes services easier for the public to use and that GTFS adoption does not require significant capital expenditures, roughly 31% of 172 agencies in California did not publish or update GTFS information regularly as of December 2021. Some agencies that now use GTFS waited almost a decade to begin publishing feeds even after the technology was widely available and understood (see Figure 1). 20 And 10% of the agencies that had adopted GTFS by December 2018 did not update their schedules at all between 2019 and 2021, despite the fact that this period encompassed the Covid-19 pandemic, a period with massive decreases in ridership and consequently major scheduling adjustments. 21 Figure 2, below, provides an example of a GTFS route, indicated by the dark lines. The lighter polygons indicate municipal boundaries.
Our analysis of GTFS uptake by California public transit agencies identifies predictors of our two main outcomes of interest: time to adoption and rates of maintenance. We first report our analyses of adoption patterns and then turn to our analysis of GTFS maintenance. In line with our supply side argument, we find that larger agencies adopter GTFS-s earlier than smaller agencies. Following adoption, however, agency size is not correlated with patterns of schedule updating; the main hurdle for small agencies appears to be adoption.
GTFS Adoption
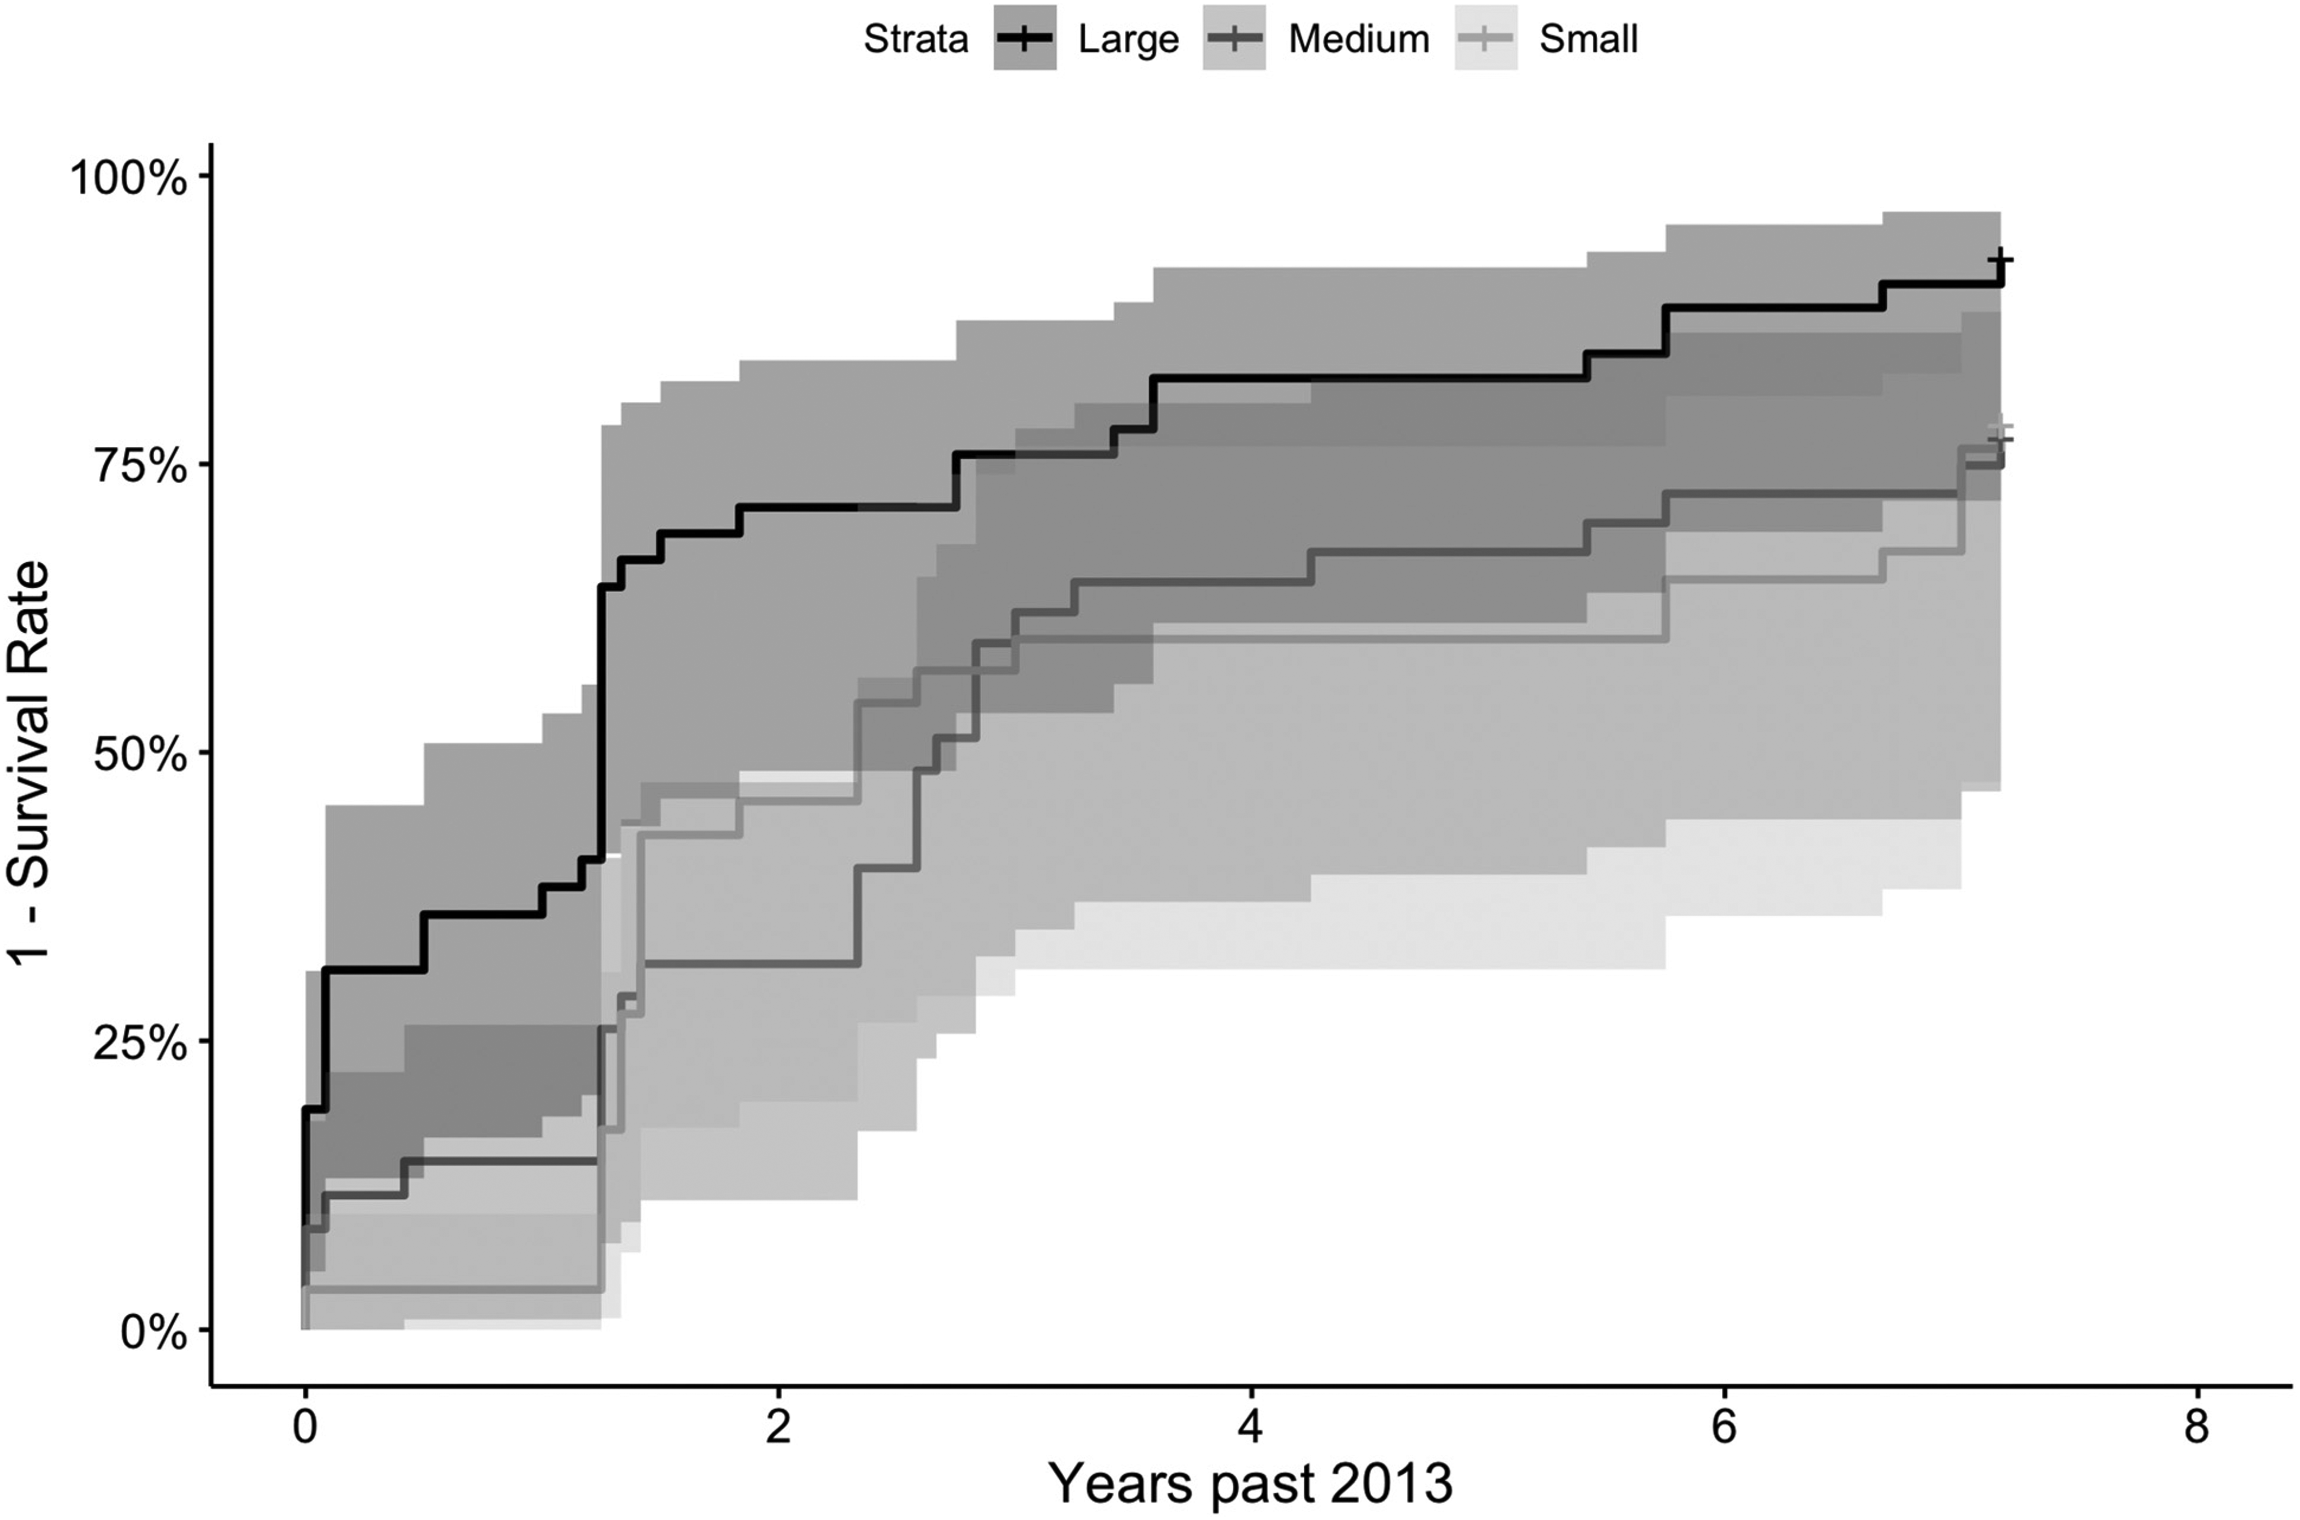
We model time-to-adoption using Cox proportional hazard models to capture the characteristics of early versus late adopters. Time-to-adoption is the most informative measure of which agencies lead with technology adoption because GTFS is a mature technology, that was eventually adopted by most agencies in California over the last fifteen years. As a result, a simple cross-sectional analysis does not reveal information about which agencies lead on technology adoption. Moreover, our principal interest is in which types of agencies move to adopt earlier than others; survival models like the Cox proportional hazard model do just this.
Our models operationalize agency size using alternative measures: annual revenues, service area population, and service area (all as continuous variables). These different types of size are highly correlated with each other, particularly population and revenue, so we include them at first in our models independently. 22 To address alternative explanations emphasizing political competition and agency type, we control for transit agency institutional type. Here, 23 We also control for population density using the best available proxy, the United States Census Bureau's distinction between principal cities in metropolitan statistical areas and jurisdictions that are not principal cities (see Table A1 in the Appendix and Table SI.8 in the supplementary materials). Agencies are categorized as operating in principal cities if the jurisdiction in which they are headquartered has been designated as a principal city.
Figure 3 displays the raw data, showing the cumulative percentage, over time, of agencies that adopted GTFS by year and size measured in terms of agency revenues, breaking up our continuous measure into terciles. This raw data shows that transit agencies with greater revenues adopted much more frequently than other types of agencies by 2013, the first year for which data are available, and kept the lead for the rest of the decade. Medium-size and smaller agencies began to adopt GTFS at a more significant rate by the end of the decade.
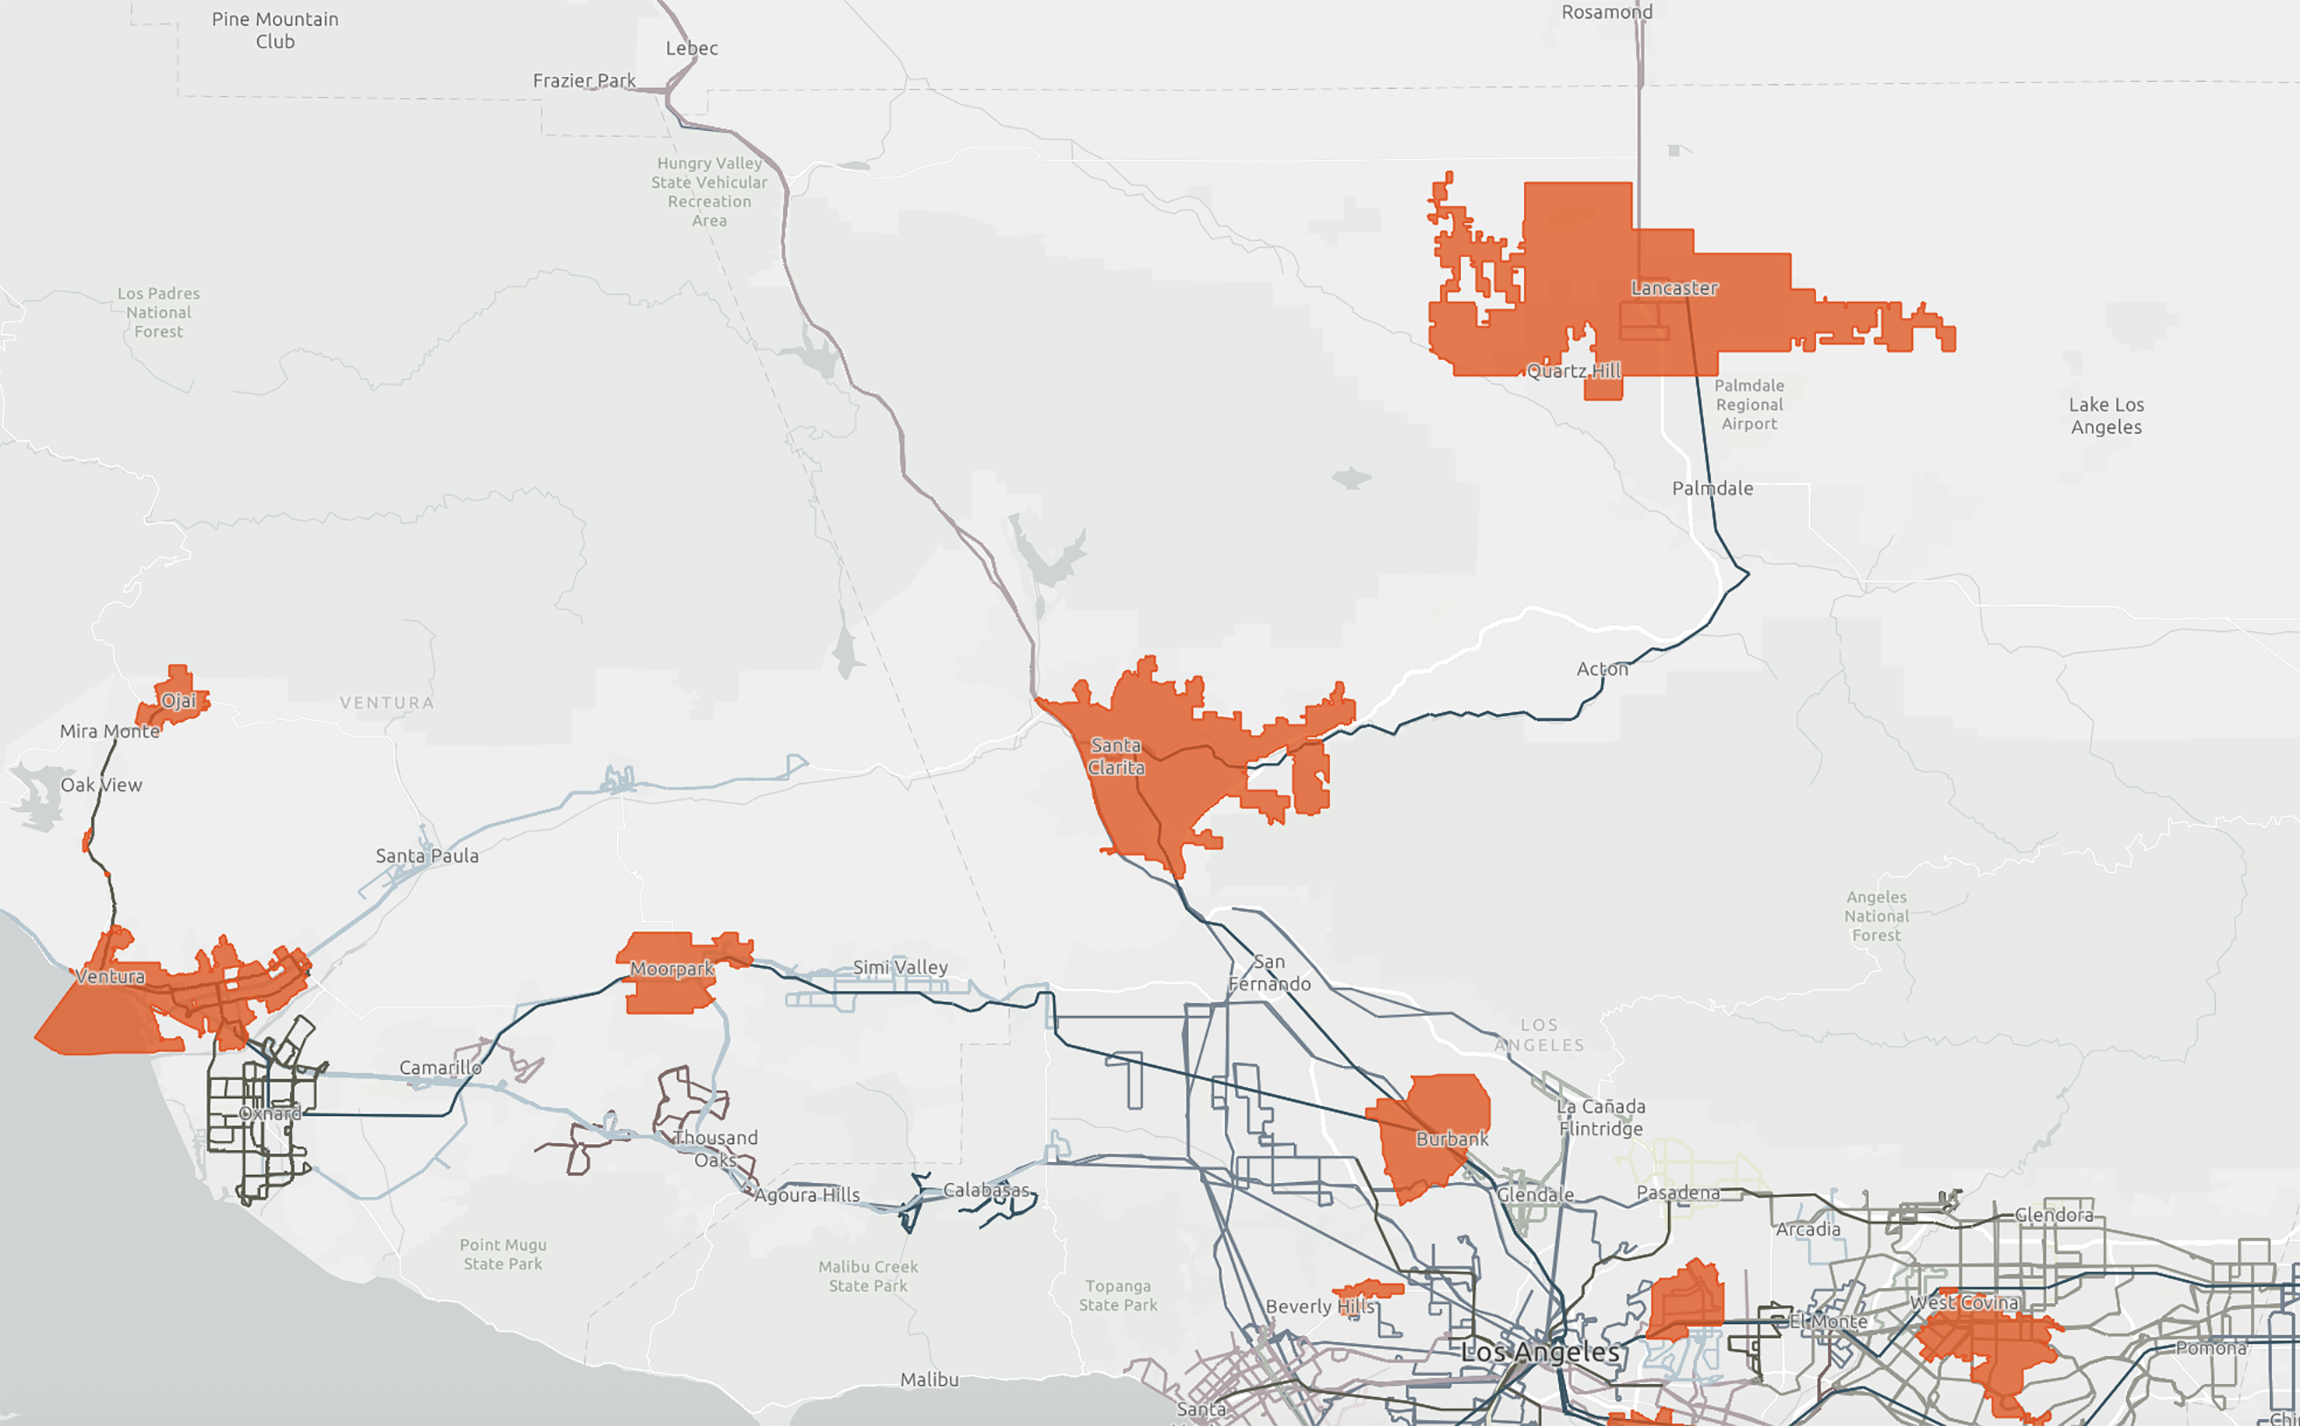
GTFS feed adoption in Northern Los Angeles (December 2021).
GTFS Adoption and operating revenue (2013–2021).
Figure 3 and Table A4 in the Appendix show that agencies with the greatest operating revenue were the first to adopt GTFS, but by 2020, smaller agencies had begun to catch up. 24 Agency size, operationalized in terms of revenues, is the most robust predictor of adoption, particularly at earlier stages of adoption. These results are consistent with our theoretical argument emphasizing organizational drivers of reform, and their greater prevalence and success in larger agencies. Among the different measures of agency size, agency revenues (logged) are the most consistent predictor as the only one that remains statistically significant when all of the size variables are included in the model. Meanwhile, transit agency institutional type is not a consistent predictor of earlier rather than later adoption. We do note, however, that independent agencies (i.e. special districts) tend to possess higher revenues in our sample; if our sample were expanded to include data from multiple states, for instance, it could be that institutional type emerges as an additional predictor of earlier adoption. 25
GTFS Maintenance, Implications for Equity, and GTFS-r
If GTFS is adopted through the initiative of bureaucrats responding to intrinsic motivations and agency interests, and bureaucrats are more likely to champion (and succeed in adopting) GTFS in larger agencies, rates of GTFS maintenance may be higher in larger agencies as well. We therefore complement our analysis GTFS-s uptake with an analysis of which types of agencies frequently update the schedules, thereby ensuring that feeds continue to be accurate. These modifications ultimately make GTFS-s more useful to members of the public (Frick et al. 2021). We focus our analysis on patterns immediately preceding and during the COVID-19 pandemic (January 2019 to December 2021), as this was a time when almost all agencies adjusted their schedules due to dramatic decreases in ridership and staff shortages. For example, a failure to update one's schedule during the pandemic can reasonably be interpreted as a failure to maintain GTFS after adoption. 26 Maintenance is a continuous process and can be affected by time varying factors like agency revenues, whereas adoption happens once. As a result, we use a regression model that accommodates time-varying covariates.
Contrary to what we observe with GTFS-s adoption, agency size does not appear to be consistently associated with GTFS updating (Table A5 in the Appendix), regardless of whether size is operationalized in terms of population served, agency revenues, or service area. Special districts updated their feeds somewhat more frequently than other types of agencies, though this relationship between special district status and maintenance is statistically significant at conventional levels in some, but not all, specifications. 27
Finally, to understand the distributional implications of uneven GTFS-s maintenance we assess whether certain communities are more likely to experience up-to-date feeds than others. This is important, given that low-income communities are less likely to own cars and depend on public transportation for everyday trips like employment and healthcare access (Brown 2017). Conducting this analysis required identifying the racial, economic, and age characteristics of likely riders for each California transit agency, which we summarize in Appendix Table A2. To do so, we overlaid transit routes extracted from the GTFS feed on census block and census tract maps from the census and 2019 American Communities Survey. We then calculated the characteristics of the communities with easy access to transit, summing over each tract falling within one-half mile of a station (see the supplementary materials for more details). We include the percentage of the population with internet access as a control variable, as agencies might face more pressures to adopt GTFS in areas where more residents use the internet. We also control for the unemployment rate, as we expect transit use will increase as unemployment decreases. Overall, we find that agencies offering services in tracts with older populations updated their schedules less frequently (Figure 4 and Table A6 in the Appendix). 28 We did not observe significant difference in levels of updating by agencies servicing different economic or racial groups; agencies with more low-income or minority within route catchment areas updated their schedules at similar rates as other agencies (Table A5 and Table A6 in the Appendix and SI.2-SI.4 in the supplementary materials). 29
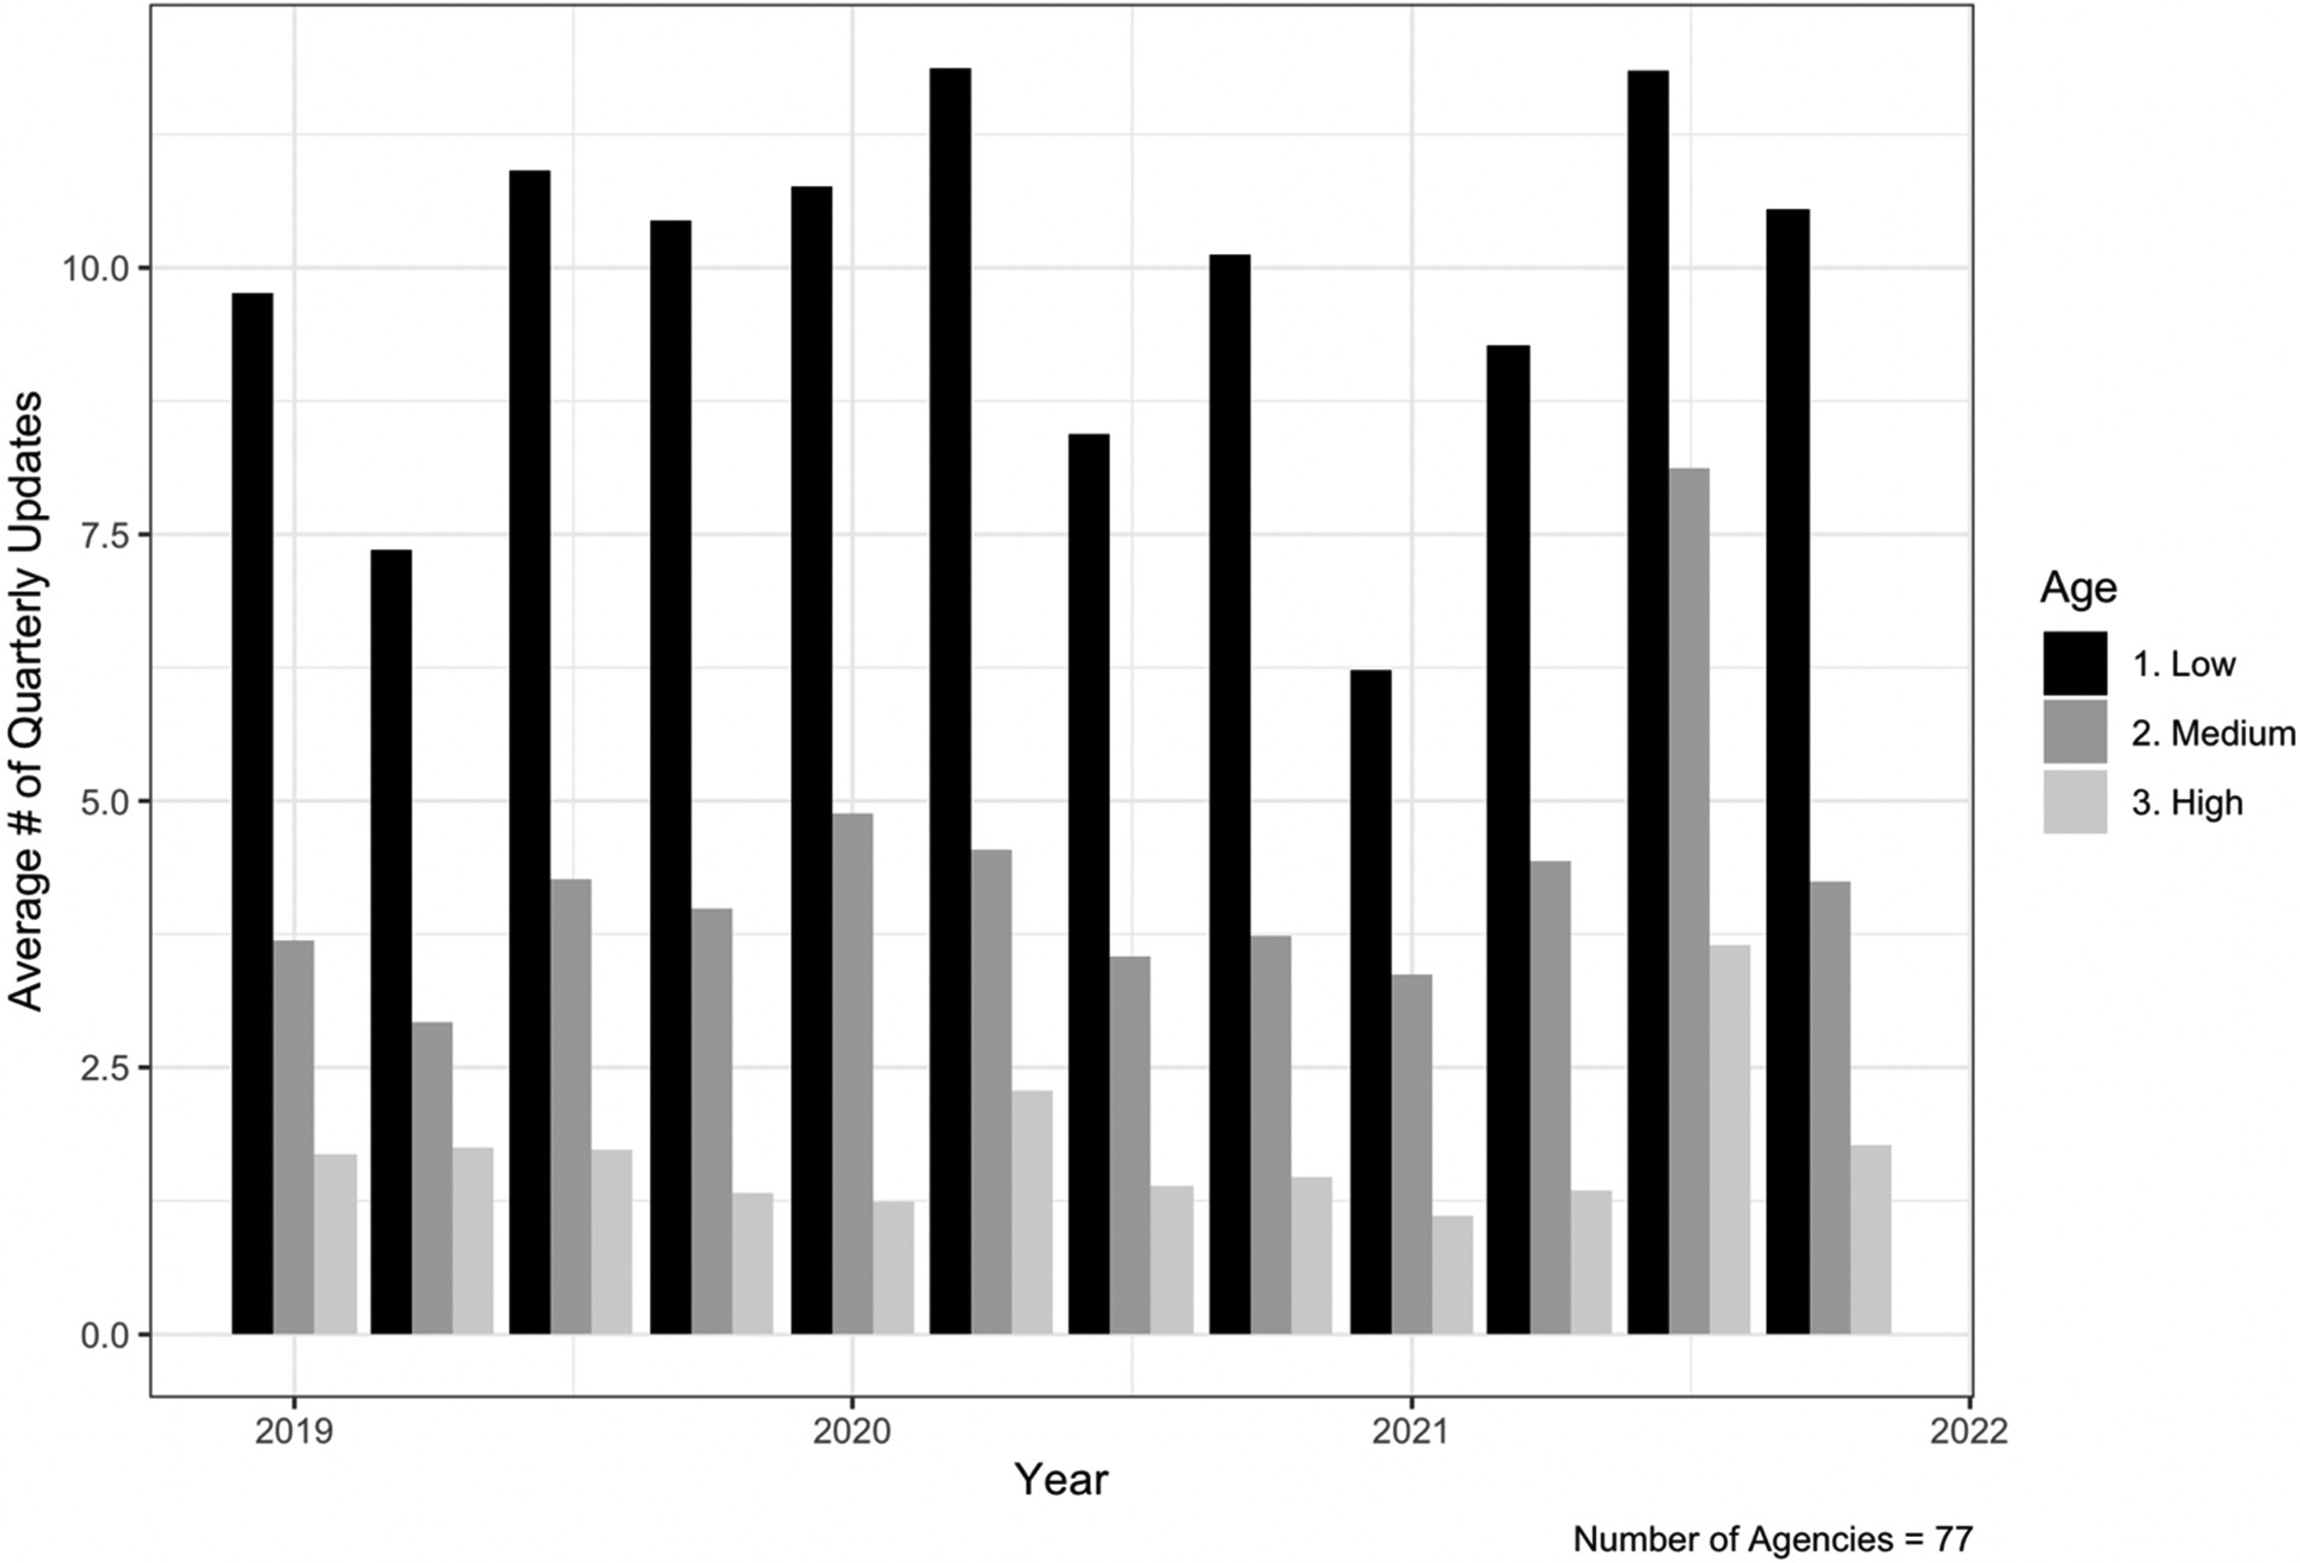
GTFS Maintenance and population age (2019–2021).
Similarly, the recent publication of GTFS-r data for a comprehensive set of CA providers by the Mobility Database allows us to assess patterns for the publication of GTFS-r, which provides real-time information on the location of transit vehicles, rather than just schedules. GTFS-r can be considered an upgrade of existing GTFS technology. Analyzing a cross-section of data from 2022 (see SI Table SI.7 in the supplementary materials), we no longer see a relationship between size and adoption. This suggests that the barriers to adopting a technology that simply represents an extension of an existing one may be lower than those for the adoption of an entirely new technology.
Overall, these results suggest some important differences between the adoption and maintenance or upgrading of GTFS systems. While larger agencies may be quicker to adopt GTFS in the first place, agency size appears to be less important for maintenance and upgrading. The main hurdle, it seems, is encouraging smaller agencies to adopt the technology and publication practice in the first place. Meanwhile, the fact that agencies where likely riders are older on average are less likely to update their feeds deserves further investigation to see if this situation seriously restricts the movement of older transit users, who may be likely to rely on the technology where it is available.
Employee Testimony Regarding Mechanisms
The analysis presented above indicates that larger agencies started publishing GTFS feeds earlier than their smaller peers. The patterns provide correlational evidence consistent with our bureaucracy-driven account of technology adoption. Nevertheless, it is possible that these agencies are responding to well-organized citizens who find transit and scheduling issues to be particularly salient in larger cities (Mullin 2008).
We therefore turn to our survey and interview evidence regarding the gradual uptake of GTFS in California to more convincingly arbitrate between these two perspectives. We draw principally on two types of data: our original, 2022 statewide survey of transit agencies and interviews with 15 officials from transit agencies that range in size, location, and institution type (special district versus general purpose government) and from the state agency that has been assisting agencies with GTFS adoption since 2021. We cite individual interviews in this section; the quotes and notes used to substantiate particular points in the paper are provided in the Supplemental Information.
Motivated Bureaucrats
Our survey respondents and interviewees indicate that agencies themselves possess strong internal incentives to adopt GTFS, and these are often more important than public pressure. Among our survey respondents that indicated their agencies had adopted real-time public transit information, agency representatives chose “transparency and public relations” most frequently as the rationale for adoption (78.4% ranked this as moderately, very, or extremely important), followed by user experience and safety (75.7%). These response options were chosen with similar frequency by respondents from special districts and agencies operated by cities or counties, suggesting that general public pressure is not driving this result. Response options were chosen with similar frequency for large and small agencies as well, indicating that organizational motivations apply across agencies of all sizes, at least for those in our sample. 30 Note, however, that our sample was skewed somewhat toward larger agencies. “Public pressure,” meanwhile, was rated as moderately, very, or extremely important for 56.8% of the responding agencies, tying for the fourth important rationale with cost reductions and worker expectations.
Our interviews also indicated that GTFS adoption efforts typically originated with motivated technocrats who became convinced of the potential benefits for their agencies, particularly given the scheduling changes triggered by the pandemic. A representative from AC Transit, one of the earliest adopters in the state, emphasized that GTFS represented a straightforward way to improve the user experience, and one that the agency pursued before the public was generally aware of the technology. 31 An interviewee from a mid-sized, urban agency described GTFS as “a cheap way to give to the public.” GTFS adoption can also reduce the workload for bureaucrats. For example, employees at two smaller, more remote agencies that only recently adopted the technology portrayed GTFS as a means of reducing the number of customer calls about scheduling and delays. 32 No interviewees mentioned improvements in efficiency or ease of internal operations as a motivation for adoption.
In contrast, the only interviewees who mentioned public pressure worked at small, remote agencies, and described public demand for GTFS as coming from recent transplants from major metropolitan areas who had become accustomed to the service. 33 Only in these cases—cases at the end of the adoption curve—did our interviewees suggest that transit system users actively lobbied for adoption, indicating that transit users may be a less influential lobby with special districts than interest groups like employee unions, examined by other scholars. Taken together, this material suggests that organizational motivations have been most consequential in the adoption process, with public pressure only emerging once GTFS had become widely adopted.
The Role of Agency Size
Our interviews also suggested that technology firms initially targeted larger agencies for GTFS pilots in order to earn credibility and recognition. We interviewed IT leads from one of the earliest adopters: the Alameda-Contra Costa Transit District (AC Transit), the special district government operating bus and paratransit services in Berkeley, Oakland, and the surrounding Bay Area. Google reached out AC Transit as part of its original GTFS pilot, and worked directly with the agency's Chief Technology Officer and IT department to roll out the system. 34 Interviewees reported that the AC Transit leadership has traditionally supported innovative projects, and agency representatives are often asked to speak at major industry conferences regarding the agency's innovations and sit on national standard-setting bodies in the sector. 35 Google therefore rightly understood that an agency like AC Transit would be more likely than smaller, less visible, agencies to take on such a pilot.
Staff at larger agencies also perceived more benefits for their transit users. Staff from the state government program currently assisting laggard agencies with GTFS adoption emphasized that larger agencies have more varied transit users, including many who are either unfamiliar with the system (e.g. tourists, commuters from the suburbs), or are making one-off trips for specific purposes. GTFS is particularly useful for such riders with less familiarity with schedules. Larger agencies also tend to operate more routes and more modes of transit. This, our interviewees stressed, makes GTFS much more useful for transit users in larger districts—a fact that transit planners can readily anticipate, even in the absence of complaints at public meetings. 36 Publishing GTFS feeds (especially GTFS-r) also allows agency routes and buses to be included on popular third party trip planning applications like the Transit App that utilize such data. 37
Not only did interviewees from larger agencies perceive the benefits of GTFS for transit users, but the costs are lower for larger agencies too. First, larger agencies can spread the costs of a designated IT staff over a larger revenue base; they are therefore more likely to have employees with the expertise and time to manage GTFS adoption. Interviewees from AC Transit, for example, emphasized that adopting GTFS was not a costly undertaking for their IT Department because they had in-house expertise and staff. 38 Board meeting minutes from another early adopter, the San Diego Metropolitan Transit System, show that this large agency had the staff resources to experiment with GTFS-based technologies like UrbiPlan trip planning alerts (San Diego Metropolitan Transit System, 2021, 104), smart e-signage and announcements at bus stops and integrated transportation payment (San Diego Metropolitan Transit System, 2017). In addition, the scheduling and dispatch software that large agencies purchase to manage their fleets can create GTFS feeds as an output; this makes the marginal effort required to produce feeds much smaller than that faced by smaller agencies. 39
Interviewees from smaller agencies, in contrast, uniformly stressed that they simply did not have staff with the time or expertise to manage adoption, as employees often split their time between transit planning and day-to-day operations. 40 One interviewee, the only transit planner at their agency, emphasized that their time was spent coordinating crisis responses to routine emergencies like bus breakdowns, bus driver staffing, and other technical disruptions. 41 A state-level transit official also stressed that smaller agencies did not have the staff or expertise to engage in technology procurement, a situation that recently prompted Caltrans to offer template contracts and other assistance for small agencies. 42 In some cases, small agencies even contracted out bus services to independent operators, typically with insufficient technical expertise to manage technology adoption. 43
In line with these statements, the California Department of Transportation recently testified to the state legislature that “publishing real time data to standards requires a level of sophistication that is beyond the many rural, small and even medium-sized operators in California who cannot afford the domain expertise to properly procure or implement these solutions.” (California State Assembly Budget Subcommittee No. 3, 2021, 66). A few recent adopters from small agencies stressed the crucial importance of technical assistance from CalITP, a program which has provided support with GTFS adoption since 2021. 44
Technology Diffusion to Smaller Agencies Over Time
Given these costs faced by smaller agencies, why do we see them eventually adopt new technology? Once larger agencies had adopted GTFS in California, other agencies faced stronger incentives and fewer barriers to adoption. Mid-sized and small agencies reportedly learned about GTFS when their neighbors adopted it. 45 One interviewee emphasized that his executive director would “be hanging his head” if a peer agency had adopted and they had not. 46 Employees of mid-sized and small agencies stressed that adopting GTFS allowed agencies to ensure that services interfaced well with those of neighboring agencies. 47 Similarly, the City of Pasadena reportedly adopted static and real-time GTFS feeds to integrate trip data with schedules of its larger neighbors Los Angeles MTA and Foothill Transit Agency, which already had adopted GTFS (Connexionz News, May 2018).
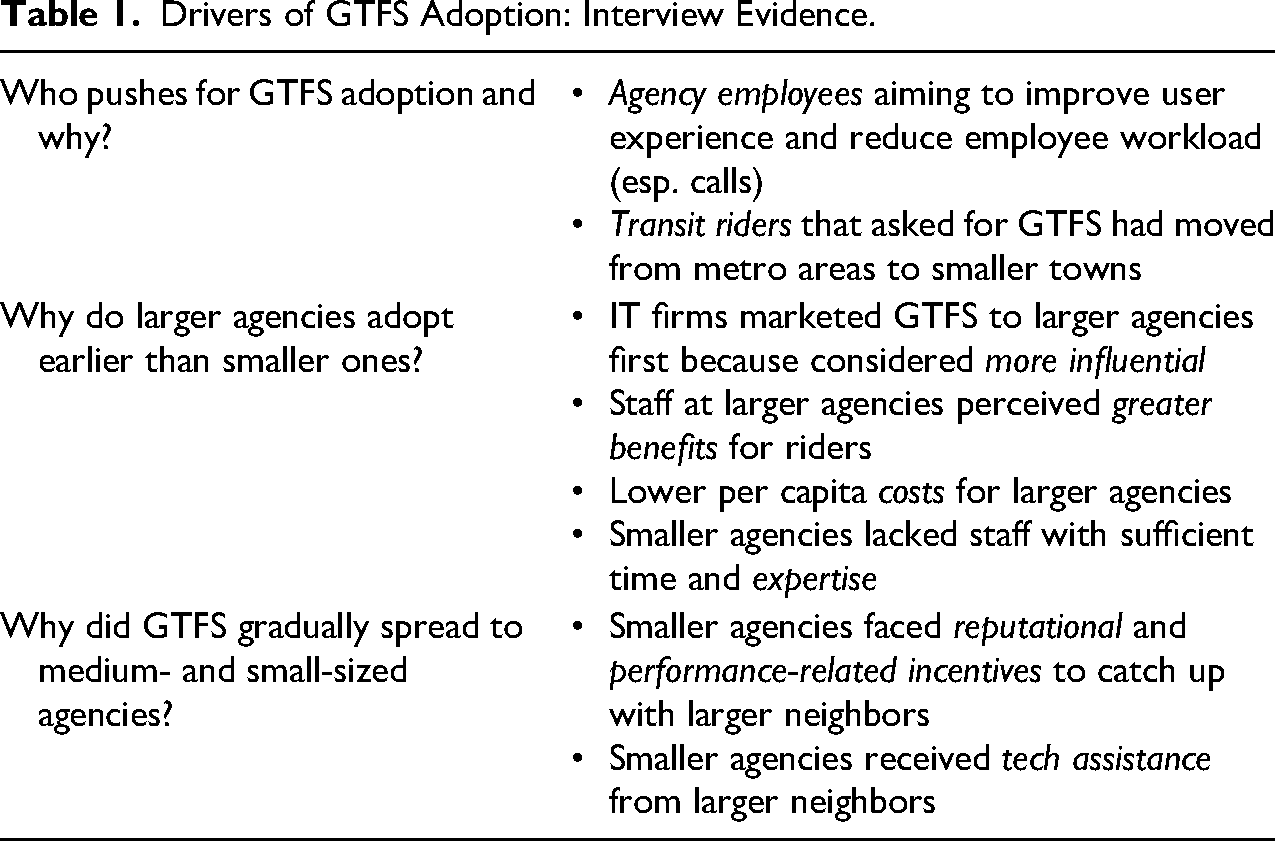
Sometimes larger agencies offered technical assistance to their neighbors to facilitate such integration. One of our AC Transit interviewees explained that the agency had originally published GTFS feeds for a small, neighboring agency, the Dumbarton Express, but that now this agency managed its own system. 48 Similarly, Sacramento Regional Transit District assisted smaller Yolo County Regional Transportation District (YCTD) with GTFS feed adoption by hosting the YCTD feed on its website, and later assisted YCTD with implementing a GTFS-based e-ticketing system (Yolo County Transportation District, 2021, 2022). Meanwhile, vendors such as NextBus and Trillium began to support the publication of feeds. And as mentioned previously, migrants from metro areas to smaller towns—a trend that increased during the pandemic—were surprised to find GTFS unavailable in smaller towns, and began to demand it. These findings from our interviews are summarized in Table 1.
Drivers of GTFS Adoption: Interview Evidence.
Existing research within the transportation policy field—largely case study-based in nature, suggests similar dynamics have emerged outside California. Case studies of GTFS adoption in New York, Oregon, and of American Public Transportation Association members identify agency size and technological capacity as determinants of both GTFS adoption and maintenance (Carleton et al. 2019, 175; Catalá 2011, 17–19; Grisby 2013, 8). Large agencies are most likely to publicly publish GTFS arrival times and develop advanced in-house automated publication and dissemination systems (Catalá 2011). Meanwhile, in their large-N study, Voulgaris and Begwani (2023) find a correlation between ridership and GTFS adoption. Overall, agencies identify technical constraints and insufficient funding as key barriers to adoption (Grisby 2013).
Conclusions and Contributions
Our analysis of California GTFS data sheds new light on the process through which technologies improving the transparency, reach and quality of public services are adopted at the local level. While much of the literature on e-government, decentralization, and federalism has focused on officials’ responses to pressure from voters and civil society, our analyses highlight the crucial role of organizational incentives for, as well as constraints upon, reform. Our findings that city and county-government controlled agencies adopted GTFS no earlier than special district governments—generally regarded as much more insulated from public scrutiny—indicates that internal motivations and processes dominate the decision-making process, particularly at early stages in the policy diffusion process.
More broadly, our results contribute to recent discussions highlighting the important influence of bureaucratic or organizational processes on political outcomes (Bertelli et al. 2020; Pepinsky, Pierskalla and Sacks 2017; Potter 2019). Our supply-side account of technology adoption adds to this research agenda by highlighting four specific mechanisms that have received next to no treatment in the literatures on e-government, policy diffusion, and innovation: the greater likelihood that employees at larger agencies are subject matter experts and do not need to divide time between roles; that the greater complexity of large urban areas increases the potential payoffs from technologies that facilitate coordination and transparency; the greater likelihood that foundational IT infrastructure already exists; and the proclivity of vendors to proactively target larger agencies because of their visibility and influence. Our qualitative analysis finds substantial support for this supply-side perspective and the specific mechanisms we highlight. Additional research is also necessary to understand why the demand-side pressures for reform and technology adoption appear to be so weak. Recent research on transit, for example, suggests that voters may find it difficult to attribute services to the correct government entity (Benedictis-Kessner 2018).
Our analysis also shows that larger agencies adopted GTFS earlier in California, and were later followed by medium-sized and smaller agencies as the technology became more familiar, costs decreased, and transit users began to demand adoption. These results run counter to what we might expect from the federalism and decentralization literatures. This work emphasizes that residents can often exert greater pressure upon and oversight of small-scale governments (for reviews, see Dahl and Tufte 1973; Treisman 2007), presuming local elites do not capture the policy-making process (Bardhan and Mookherjee 2006). Meanwhile, political science scholarship on municipal amalgamations has shown that individuals perceive themselves to be more politically efficacious (Lassen and Serritzlew 2011) and participate more (Oliver 2000; Rodrigues and Tavares 2020) when they live in smaller jurisdictions. Our results suggest that technology adoption may not follow the same logic, and may instead mirror climate and labor policy, where scholars of public administration and public policy have observed that larger agencies often adopt innovations earlier.
These results also have important policy implications. Agencies serving rural and small suburban locales may require more encouragement and assistance to adopt new technology. The frequent reference to the utility of the state of California's assistance program (CalITP) efforts in 2021 by our interviewees highlighted the important potential effects of such programming. Similar programs providing smaller agencies with assistance with vetting vendors and managing procurement processes could be pursued in other states, and for other technologies. Because GTFS feed maintenance appears to be unrelated to size, our results indicate that the main hurdle is assisting laggard agencies in adopting in the first place.
Finally, our project suggests that the local public goods and decentralization literatures should pay more serious attention to technology adoption, especially given the increasing importance of technology to service-delivery. Some of these technologies, like GTFS, unambiguously lead to improvements in service delivery. In other cases, there are significant policy debates about whether or not adoption is even advisable. These political science literatures have largely operated in isolation from the literatures in public administration and the multi-disciplinary literature on policy diffusion that have actually tackled this topic. Our work shows how fruitful it can be to bring them in dialogue with one another.
Supplemental Material
sj-pdf-1-uar-10.1177_10780874251357506 - Supplemental material for Which Local Governments Adopt New Technology First? Agency Size and Organizational Champions for Open Transit Data
Supplemental material, sj-pdf-1-uar-10.1177_10780874251357506 for Which Local Governments Adopt New Technology First? Agency Size and Organizational Champions for Open Transit Data by Ishana Ratan, Alison E. Post, Tanu Kumar and Mridang Sheth in Urban Affairs Review
Footnotes
Acknowledgments
The authors thank Sarah Anzia, Alexandre Bayen, Karen Trapenberg Frick, John Gerring, David Harding, Mary Hill, Amy Huang, Vlad Kogan, Alexandra Pan, Julia Payson, Alexander Sahn, Kenichi Soga, Dimitrios Zekkos, and Bingyu Zhao for assistance, comments, and advice.
Declaration of Conflicting Interests
The authors declared no potential conflicts of interest with respect to the research, authorship, and/or publication of this article.
Funding
The authors disclosed receipt of the following financial support for the research, authorship, and/or publication of this article: This research was funded by the University of California Institute of Transportation Studies from the State of California via the Public Transportation Account and the Road Repair and Accountability Act of 2017 (Senate Bill 1, Grant No. UC-ITS-2021-24), and the Global Metropolitan Studies program at U.C. Berkeley.
Supplemental Material
Supplemental material for this article is available online.
Notes
Authors’ Biographies
Appendix
Dataset Characteristics
The table below displays descriptive statistics for agency-level characteristics from the National Transit Database (2013) used in the Cox Proportional Hazards survival analysis. In the analysis, we measure time to adoption as a function of time-invariant covariates (Table A4).
The table below displays descriptive statistics for agency-level characteristics from the National Transit Database used in the longitudinal analysis of GTFS maintenance (2019–2021) (Tables A5 and A6).
The table below shows agency characteristics for the 37 agencies in our survey, which indicated some adoption of real time public transportation data. Agency covariates are drawn from the 2021 National Transit Database.
Regression Results
The following table presents results analyzing agency-level characteristics associated with earlier GTFS adoption. We use a Cox proportional hazards model to investigate whether organization type, principal city status, and agency size, as measured in 2013 metrics, predict GTFS-s adoption. A positive coefficient means the independent variable is positively associated with earlier adoption, whereas a negative coefficient indicates that the independent variable is associated with later adoption.
We include the model with covariates measured in 2016 as a robustness check in Supplementary information Table SI.9, because in 2016 the National Transit Database began including covariates for reduced reporters. This expanded the sampling frame by over 30 agencies. Prior to 2016, these reporters do not report square miles, population, or revenue measures, even though they were operating, and several published GTFS. Results hold with this updated set of covariates for a larger sample of agencies.
Tables A5 and A6 examine correlates of GTFS maintenance based on agency and demographic characteristics of transportation agencies. Because we are modeling monthly rates of maintenance, rather than time-to-adoption, we use OLS models. Table A5 focuses on agency characteristics, and Table A6 includes demographics characteristics. All models use OLS with month-level fixed effects to account for time-variant characteristics.
References
Supplementary Material
Please find the following supplemental material available below.
For Open Access articles published under a Creative Commons License, all supplemental material carries the same license as the article it is associated with.
For non-Open Access articles published, all supplemental material carries a non-exclusive license, and permission requests for re-use of supplemental material or any part of supplemental material shall be sent directly to the copyright owner as specified in the copyright notice associated with the article.