
Abstract
This paper investigates urban governance empirically by applying social network analysis methods to data gathered through structured interviews in London and New York. We explore how decisions are made in complex institutional environments inhabited by various types of actors. Owing to the time-consuming data collection and treatment processes, the research zooms in on transport. The comparative approach enabled the detection of different structural features in the governance networks shaping transport strategies in both cities. The perceived relative power, influence, dependence and/or affinity between the actors involved is discussed based on network attributes. The evidence suggests that transport governance in London is more centralised (and, arguably, more technocratic and integrated), in the sense that a few prestigious entities are clearly more prominent. In New York the institutional environment is typified by many checks and balances (and, arguably, more democratic and fragmented), where central actors are less obvious.
Introduction
Cities are becoming increasingly central to our understanding of society. Institutional shifts towards the enabling state alongside welfare state retrenchment often have the unintended consequence of making cities more important – as platforms for collective decision-making, social service and infrastructure provision, economic development, emergency response and more ambitious environmental policies. At the same time, nation-states are institutional forms that are not particularly responsive to the challenges and opportunities that emerge from cities (Frug and Barron 2008). Cities are often left to confront these dynamics on their own, making the emergent practices and priorities of governing them a key contemporary field of inquiry (da Cruz, Rode and McQuarrie 2019). As a result, these practices have become a central focus of a new generation of scholarly work, cutting across diverse disciplines including urban studies, public administration and political sociology (e.g., Brenner 1999; Harvey 1989; Nelles, Gross and Kennedy 2018; Pierre 2014).
Some offer positive and celebratory accounts. “If Mayors ruled the world,” it is argued, many of the basic dilemmas of the nation-state could be overcome and solutions to pressing problems like climate change and inequalities would emerge (Barber 2013). Others argue more critically and suggest that governance at the urban scale may provide opportunities, but faces obvious legal, institutional, and political constraints that limit its actual possibilities (Béal, Epstein and Pinson 2018; Schragger 2016). Still others use the governance framework to show the importance of shifting practices of governing, such as an increased reliance on participatory forums, non-government organisations (NGOs), and philanthropic initiatives rather than public agencies and their hierarchies (McQuarrie 2013). Urban governance is very much on the agenda of both theorists and practitioners.
There is a growing body of empirical research on urban governance but the broad scope of the concept, theoretical disagreements, and the scarcity of systematically collected, comparable data, have been impeding progress in the field (Zhang 2020). Private-sector participation in all arenas of public decision-making, the existence of multilevel relationships and transactions (between tiers of government, through global networks of cities, etc.), the emergence of new non-governmental actors claiming power in the “governance network,” are all palpable and constantly (re)shaping urban policies and strategies (Pierre 2011). But the scale, scope and relevance of these exchanges and connections are difficult to formalise and map out through comparative empirical research.
Governance frameworks are forged by many forces beyond the formal or informal relationships between actors, for example, legal frameworks, institutions, and availability and access to resources (Nelles 2013). All these remain critical research arenas. But because the “soft power” arising from the connections between the various actors is harder to grasp, comparative empirical research into this dimension is sparser – in particular, comparative research that attempts to identify and quantify patterns in these connections. To contribute to this strand of empirical literature on urban governance, this exploratory paper delivers an investigation of the relationships shaping strategic decisions in cities using techniques of social network analysis (SNA). In testing an interview-based, snowball sampling, SNA approach to generate empirical insights, it also juxtaposes current assumptions in the literature with new data. The key research questions are: “What are the social institutions/actors that form urban governance networks?,” “Who are the most important or influential actors within those?,” and “What are the structural features of the networks?”
SNA is a particularly relevant empirical approach in this regard because it enables systematic comparisons between cities or between policy sectors (Klijn and Koppenjan 2016). We apply this method to formalise and compare the transport governance networks of Greater London and New York City (NYC). The similarities (e.g., in demographic and economic terms) and dissimilarities (e.g., in political terms, most notably the unitary and federal systems) between these two global cities make the comparison particularly relevant (Fainstein 2010; Kantor et al. 2012). Because the focus here is on comparing and contrasting the underlying network governance patterns, the paper does not delve into the particular dynamics of each city even though these in-depth analyses of governance would certainly be of interest. Due to space constraints, we emphasise the findings that could only be attained through a SNA approach. 1 Therefore, we selected a few parameters to describe and analyse the structural features of the governance networks in these two cities.
The focus on one policy sector is mainly due to feasibility concerns. The data collection method tested in this research and subsequent coding for SNA is extremely time-consuming (see Section 4), especially when carried out in major cities. The selection of the urban transport sector is linked to its public interest and close relationship with urban development. By mediating citizens’ access to opportunity, transport services have a significant impact on productivity but also on liveability and social equity. The long-term effects that these policy decisions have on strategic planning and spatial development and on the environmental and economic performance of cities make urban transport one of the key policy sectors of the 21st century (Rode 2019). Lastly, the level of complexity and major prominence that transport infrastructure development has on public sector budgets are similar for London and NYC.
This paper is structured as follows. Section 2 briefly reviews the literature on urban and metropolitan governance, emphasising the rationale for viewing the concept through a network perspective and using SNA for comparative research. Section 3 describes the institutional settings and political frameworks of the urban transport sectors in London and NYC. Section 4 describes our methodological approach and presents the data. The fifth section comprises the analysis and discussion and section 6 concludes the paper.
Urban Governance and Networks: Brief Review of the Literature
The literature on both urban policy and service networks is vast. But urban governance studies that use a broad lens to understand a whole policy domain viewed as a network are less prominent (Ramia et al. 2018; Siciliano, Wang and Medina 2021a). The network lens has been widely applied to issues concerning ‘how cities are managed’ (e.g., focusing on administrative efficiency and network effectiveness) but less so to issues concerning “how cities are governed” (e.g., with a focus on network composition and deliberative democracy, da Cruz, Rode and McQuarrie 2019; Neal, Derudder and Liu 2021). This paper addresses this gap. Given the broad scope, the aim of this exploratory study is testing a network analysis approach and its potential as a theory-development tool rather than testing of hypotheses.
In this section we briefly review the literature that conceptualises and investigates urban governance through a network lens, as well as some of the research on theoretical mechanisms in networks with more relevance to our study. Based on this review, we argue that our research contributes to the field in that it (1) tests an interview-based, snowball sampling SNA approach to carry out comparative empirical analysis beyond the mere scrutiny of institutional arrangements, (2) respects the main analytical properties of “governance” by not imposing assumptions on who the key actors are, (3) allows us to check how some of the intuitions about governance in London and NYC fare against our (exploratory) evidence, and (4) opens a new avenue into empirically-driven, theory-building efforts around the notion of governance networks and, for example, how extensive the influence of actors beyond government really is.
The Concept of Governance and the Rationale for the Network Lens
Despite the pervasiveness of “governance” in academic research and political discourse during the last couple of decades, the concept has no clear or single meaning. Definitions in the literature range from the very broad – encompassing many “stakeholders,” how they interact to shape policies, and the rules and traditions that underpin those interactions – to the ones more focused on the behaviour of public agents – namely, the manner in which executive power is exercised. The perspective of theorists such as Rod Rhodes (1997) who posited that “governance refers to self-organising, inter-organisational networks characterised by interdependence, resource-exchange, rules of the game, and significant autonomy from the state” (p.15) led many scholars to speculate about “network governance.” It also paved the way for proclamations of a shift “from government to governance” or, in other words, a gradual transfer of control and influence over how policies are designed and implemented from governmental authorities to new actors or “stakeholders” (Pierre 2011; Pollitt and Bouckaert 2011).
Equating governance to networks so closely has been deterring operationalisation and comparative analyses (Kjær 2011; Neal, Derudder and Liu 2021). Furthermore, this conceptualisation is not without its critics – who claim that the “ideology of network governance” diverts attention from hegemony and the hierarchies shaping policy (Davies 2011). Still, governance differs from government and it is a useful theoretical lens because public bureaucracies and their political masters do not operate in a vacuum. Ideas, manifestos or agendas become strategies, which become policies, which guide or inform decisions, which, when implemented, have real impacts on the ground. At the local level, city governments navigate through this process while submitting to the authority of other spheres of government, coordinating with other agencies, negotiating with funders, dealing with lobbying pressures, and worrying about popularity and citizen satisfaction (Brenner 1999; Cars et al. 2017; Stoker 2011). Governance is also useful as a analytical lens because, contrary to traditional public administration and management approaches, it is agnostic with regard to the presumed roles of the various actors (Pierre 2014). In fact, the focus is precisely on the relationships and interactions between these actors and on what they produce.
Accordingly, it makes sense to conceptualise these multilevel interactions as a complex network of different types of actors with a plurality of interests that are interconnected in formal and informal ways (Collinge and Hall 2018). Klijn and Koppenjan (2016), for example, define governance as network governance (or governance networks 2 ) and this is in turn defined as “more or less stable patterns of social relations between mutually dependent actors, which cluster around a policy problem, a policy programme, and/or a set of resources and which emerge, are sustained, and are changed through a series of interactions” (p.11). This definition seems to preserve the useful features of the governance lens. Hence, if we define governance in a city as a complex network, the case for developing an empirical understanding of how cities are governed through SNA gains strength.
Governance is also often construed as something that happened to local administrations. For example, they might not hold the regulatory, administrative or financial capacity to perform certain tasks and therefore have to rely on other actors to engage/invest in various policy areas (e.g., housing provision or transport investments). But it is possible that local administrations might have simply responded to changing conditions and/or perceptions. Instead of (or in addition to) further executive power or administrative capacity, in becoming more networked, local authorities may be actively seeking added legitimacy, trust, support or public acceptance – all critical resources for governing.
The use of Network Analysis in Empirical Research on Urban Governance
SNA has been used in several fields for many years now (mainly since the 1970s) and comparative analyses of interorganisational networks, or systems, of public service delivery date back to the now classic work conducted by Provan and Milward (1995). However, its widespread application in investigations of urban governance is still in its early stages. The Institutional Collective Action (ICA) framework (Kim et al. 2022; Tavares and Feiock 2018) has been a particularly useful theoretical scaffolding in this endeavour. Indeed, over the last 10 years, scholars have sought to use SNA to model the relationships between context 3 and interorganisational collaboration in policy and planning networks at the (inter)municipal level (Jung, Song and Feiock 2019; Leroux and Carr 2010; Shrestha and Feiock 2018). Studies based on this framework investigate the transaction costs, benefits and risks involved with collaboration as well as the features or drivers that bring actors together (Gerber, Henry and Lubell 2013; Song, Park and Jung 2018). Other SNA empirical studies have been focusing on interlocal service delivery networks (Hugg 2020), networks of municipal staff (e.g., civil servants’ contacts both within and outside their municipality, Lewis et al. 2014), or knowledge networks (e.g., exploring the relationships between research institutions and urban policy organisations, Robin and Acuto 2018).
These recent empirical studies have made important contributions to the field of urban governance. Uncovering the mechanics of collaboration and integration of conflicting goals and diverse skills can help devise better institutional environments. However, research that adopts a broader urban governance focus (as opposed to narrower processes related to governing or that might impact on governance, such as the examples cited above) is still scarce. As is network research that makes no a priori assumptions about who the “governors” are. While Ramia et al. (2018) discuss some of the disciplinary issues behind this gap, it is often also connected to the data sources employed by network studies – usually archives of formal agreements (e.g., see Siciliano, Carr and Hugg 2021b) or surveys sent out to representatives of the relevant stakeholders (e.g., public officials, Feiock, Lee and Park 2012).
Certainly, network analyses based on this type of data – typically quite comprehensive and reliable – should continue to be explored. But formal agreements and other administrative records only provide data about documented communications or transactions. Other types of “soft” or informal relations that may also have a bearing on how influence or power flows from actor to actor are typically not captured by these (Ramia et al. 2018). Surveys can circumvent the over-reliance on formal connections, but the questions posed to respondents are rarely open-ended. Both the set of respondents and the actors they can nominate are typically limited to one or a few different types of stakeholders (the network boundary, e.g., civil servants, project partners, cities…) or to a list of named individuals and/or organisations. Using a pre-determined list of organisations or type of “stakeholders” imposes hard restrictions on the cast of characters that respondents can nominate. But not imposing these restrictions would affect response rate and likely require a snowball sampling approach (to include ‘unexpected’ actors named by respondents).
The use of interviews is less common although there are notable exceptions such as the studies developed by Weir, Rongerude and Ansell (2009) and Toikka (2011). However, even in these cases, researchers used a roster of organisations from which respondents (representing those organisations) could choose from and, sometimes, describe the communication they had with each selected entry (reasons, frequency, means, etc.).
A focus on who is actually involved in governing, and how, can contribute to debates about legitimacy, inclusivity, transparency, and accountability of evolving governance structures. In this study, we employ this focus without assumptions or expectations about who governors are, and how and with whom they work. Learning about the composition and structure of networks is also important because it may shed important light on outcomes beyond what we can gain from institutional analysis alone. Of course, this interest is hardly new. Our research questions (see Introduction) mirror the ones posed in 1985 by Joseph Galaskiewicz in his study of philanthropy in the Twin Cities region of St. Paul and Minneapolis where he attempted to uncover “what are the social institutions that support an economy of donative transfers, and how do these institutions influence who gives, who gets, and who gives to whom?” (Galaskiewicz 1985). This is also very much in line with the fundamental questions of urban governance and urban regime theories that focus on “who controls the resources that are critical to governing and to what extent they can sustain collective action” (Pierre 2014: 867).
Methodological Approaches, Theoretical Mechanisms, and Network Features
Networks consist of actors (e.g., organisations, individuals) and ties (different types of interactions between actors). Because it allows us to formalise the structural features of governance networks without requiring hypotheses or strong assumptions about the role of particular actors or the types of interactions that matter, network analysis can be used as an exploratory research tool and for theory building. 4
This pursuit, however, carries the risk of reification. Whatever the data sources and the (quantitative) social network analytics being sought, governance networks should be regarded as models of reality, not reality itself (Neal, Derudder and Liu 2021). Still, taken together with other research methods, SNA can help us develop a better understanding of the structures and cultures of urban governance networks (Lewis 2011). And although “the accumulation of evidence has not yet been apparent” (Provan and Kenis 2008, p. 249) – most likely due to the complexity of crafting such a research agenda – the last decade has seen increasing calls for the use of SNA to examine how cities are governed.
As discussed above, another risk with SNA is adopting a data collection method (typically survey or archival, Siciliano, Wang and Medina 2021a) that imposes hard restrictions on who the key stakeholders are and/or what types of interaction matter. Open-ended surveys distributed through snowball sampling could mitigate this risk (though we have not found examples of this sort of approach in quantitative urban governance studies). However, surveys do not allow the researcher to adapt to the respondents’ personality, alter the order or even skip some of the questions depending on how they are reacting, use follow-up and closely related questions whenever necessary, clarify any queries or misinterpretations, and focus their attention and the discussion on the relevant theme(s). If a reliance on empirically observed connections rather than formal or theoretical expectations is central to the research, privileging an approach based on structured qualitative interviews may be well-advised.
This sort of approach also responds to recent calls for reconciling quantitative analytics with more qualitative methods to examine networks (Neal, Derudder and Liu 2021; Provan and Kenis 2008; Ramia et al. 2018). Depending on which questions are posed, interview-based SNA does not require emphasising formal relationships (e.g., membership on a Board of Directors) over informal ones. Interview scripts can target ties representing different exchanges (e.g., authority, resources, information, advice, reputation, role model, etc.).
By asserting that governments and public agencies cannot do everything alone and other stakeholders might hold some key resources for governing, the network governance lens places the emphasis on the “structural properties of social networks, including constructs like trust, reciprocity, status, prestige, and broader cultural values” (Whetsell et al. 2020, p. 451). With the intention of enabling an exploration of the links between these structural properties and governance “effectiveness,” Provan and Kenis (2008) conceptualised three basic models of network governance: (1) the participant-governed (a decentralised or shared-governance model with no clear lead organisation), (2) the lead organisation-governed (a centralised network model with a dominant organisation), and (3) the network administrative organisation (NAO – an in-between model where an organisation, a “broker” external to the “industry,” is established to govern the network of relationships). Naturally, each model has its strengths and limitations, and the definition of ‘effectiveness’ when it comes to urban governance is contested (Siciliano, Carr and Hugg 2021b). Still, and important to our aims, there is the theoretical expectation that “[i]n shared-governance networks, the tension will favour inclusion; in lead organisation-governed networks, the tension will favour efficiency; and in NAO-governed networks, the tension will be more balanced but favour efficiency” (Provan and Kenis 2008, p. 235).
The literature on theoretical mechanisms of network formation is expanding. Recent studies in the public administration and policy literature are particularly relevant so that exploratory studies such as ours do not have to search in the dark. Siciliano, Wang and Medina (2021a) identified 15 theoretical mechanisms separated into two categories: (1) “general” or “exogenous” that identify actor incentives and behaviour leading to tie formation, and (2) “network-specific” or “endogenous” that concern the self-organising properties of networks. All these mechanisms are important for urban governance research. But given our network governance lens and related emphasis on the structural features of the social networks in the two case cities, it is worth highlighting the second category (see Table 1) and within it, the “preferential attachment” mechanism. Preferential attachment refers to the tendency for network actors to seek out connection with already well-connected (or “popular”) actors (Whetsell et al. 2020). This process can enhance political power but also pose challenges when actors are removed from centralised networks (e.g., in terms of pluralism and inclusivity but also in terms of network stability and effectiveness).
Network-Specific/Endogenous Theoretical Mechanisms (Source: Adapted from Siciliano, Wang and Medina 2021a).
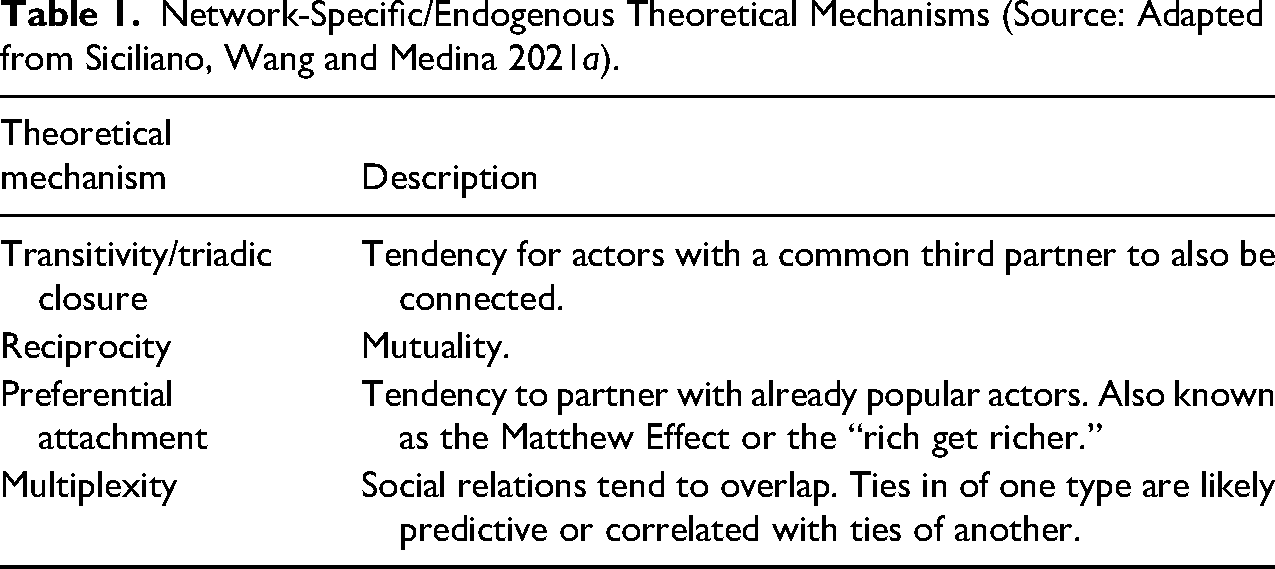
Improving our understanding of these theoretical mechanisms is instrumental to design “network interventions.” For example, governments “adding or deleting nodes, adding or deleting links, and rewiring existing links” with the public interest in mind (Whetsell et al. 2020, p. 451). However, this understanding is still in its early stages, especially when it comes to urban and metropolitan governance networks. Among the various structural features, the ones relating to network centralisation and cohesion seem to be key – as are measures of network composition (relating to the diversity of actors). 5 Taking these insights into account, the present study is not aimed at hypotheses testing and developing robust policy implications. Our research simply borrows some basic tools from the SNA extensive toolkit to test a new empirical approach and analyse some key structural features of the governance networks made up by the actors shaping transport strategies in London and NYC.
Institutional Background of Transport in London and NYC
London has a city-wide government with a directly elected Mayor, a city council (the London Assembly), and a city administration (the Greater London Authority) since 2000. London’s government was re-established by national legislation – the Greater London Act of 1999 – following a referendum that gained overwhelming support in favour of a directly elected Mayor and separately selected city council with a scrutiny function (Travers 2003). As part of the new city government, three functional bodies were set up for transport, policing, and fire and emergency services. Accordingly, the Mayor of London has significant powers over transport, land use development and planning, policing and fire and rescue. His/her greatest powers are over transport. Over two thirds of the Mayor’s annual budget is spent on transport via the city’s integrated transport authority Transport for London (TfL) (GLA 2017).
A key mechanism for the Mayor of London to exert his/her power over transport matters in the capital is his/her ability to appoint both the TfL board and its chief executive, called the Transport Commissioner. As well as the Board members, the Mayor appoints the chair of the Board. He/She can choose to appoint him/herself, which all three Mayors to this date have chosen to do. London’s second Mayor, Boris Johnson, introduced the position of an appointed, non-political, transport advisor, the Deputy Mayor for Transport. The Deputy Mayor for Transport and his/her team at the city’s administration work with TfL on realising the Mayor’s Transport Strategy and other policy priorities during his/her term.
The London Assembly scrutinises the Mayor, its advisors and the city’s authorities, including TfL. Whilst it can reject some of the Mayor’s strategies and must approve the Mayor’s budget, its formal role is to investigate and recommend policy direction for the city. Transport issues are mainly investigated by the London Assembly’s Transport Committee but also by others on intersection policy areas such as the Budget and Performance Committee.
TfL has a remit over the London Underground, bus routes, cycle hire, taxi regulation, the coach station and the operations of light rail and trams (Rode 2019). Since 2007, TfL has been taking over management some of the commuter rail lines from national government (Lawrence 2015). TfL’s management delivered more punctual and frequent service as well as cleaner, refurbished and staffed stations, and new trains. This attracted many new passengers (TfL 2015).
Many of TfL branded services are operated by private companies, not the authority itself. All bus routes, the Docklands Light Railway, the tram, and the London Overground service are contracted out to the private sector via the concession model (Amaral, Saussier and Yvrande-Billon 2009). Fares account for more than 40% of TfL’s funding, followed by government grants (mostly central government, usually comprising at least 25% of the budget), borrowing (e.g., bonds, loans from the European Investment Bank – around 20%), and other sources of income (e.g., congestion charging, advertising, property development).
While TfL has authority over surface transport, including street design, it controls only a few arterials with designated strategic importance which, for this reason, were devolved from national government to London. Approximately 95% of the roads and streets fall under the jurisdiction of 33 London local authorities – the 32 boroughs and the City of London Corporation (Travers 2015). TfL must therefore work collaboratively with each of the local authorities to plan and implement projects.
In NYC, key institutions involved in the provision of transport are: the NY State-controlled Metropolitan Transportation Authority (MTA) established in its current form in the 1960s to provide public transport for the city, the bi-state Port Authority of NY and New Jersey (PANYNJ) established in 1921 to manage regional transport infrastructure such as river crossings, ports and airports, the city-controlled NYC Department of Transportation (DoT) responsible for the city’s streets, bridges and Staten Island Ferry, and the federally-mandated metropolitan planning organisation, the NY Metropolitan Transportation Council (NYMTC) which coordinates the use of federal transportation funds across the metropolitan region. These institutions were set up to be relatively independent public authorities (Derrick, Paaswell and Petretta 2012).
The Chief Executive and board members of the MTA – which runs nearly all of NYC’s public transport services (the subway, buses as well as some commuter rail) – are appointed by the Governor of NY. The Governor must also approve the MTA budget and its five-year capital programs (NY State 2016). The state legislature has a small role in developing the state budget and approving the distribution of MTA capital funds. But state legislators have the powers to override the Governor’s budget veto as well as veto the MTA board decisions (Derrick, Paaswell and Petretta 2012). The Governor of NY State also appoints half of the board members and the executive director of PANYNJ, which runs the regions’ airports, ports, bus terminal in Manhattan, the Trans-Hudson railway between New Jersey and Manhattan, as well as six bridges connecting the two states. The Governor of New Jersey appoints the other half of the board.
The Governor of NY also decides the structure of NYMTC. This organisation brings together all the heads of transport agencies in the NYC metropolitan area to agree on a long-term vision for transport in the region and a short-term action plan of project implementation and funding (NYMTC 2016). Currently, all twelve of NY State’s Metropolitan Planning Organisations are chaired by the Commissioner of the NY State DoT, who is appointed by the Governor (Derrick, Paaswell and Petretta 2012).
The Mayor appoints the Commissioner of NYC DoT, which is in charge of local streets, arterials, and traffic signalling systems. He/She also puts forward suggestions for city representatives on the MTA board and for budget items and projects for the city’s public transport network. But because the MTA is a state agency, the Mayor has no official levers to pull to see these suggestions implemented on the ground (Derrick, Paaswell and Petretta 2012). With more governor appointees than city representatives, the organisational structure contrasts to the city-centric use of the system. The majority of MTA’s employees work for NYC Transit Authority (NYCT, part of the MTA) and the majority of MTA’s riders use the NYCT network, which is responsible for the majority of the maintenance and upgrade expenditure (Golden 2014).
Federal government’s intervention mostly concerns funding large infrastructure projects such as the East Side Access (a new rail tunnel) and the Second Avenue Subway (a new subway line) via the Federal Transit Administration (FTA). The MTA and PANYNJ are the two largest grantees in the states of NY and New Jersey (FTA 2016).
MTA operates the largest transport network in North America. In addition to fares, the MTA cross-subsidises public transport operations with a portion of the bridge and tunnels tolls which, combined, only cover about half of the operating costs (Golden 2014). Petroleum and transportation industries tax as well as a sales tax, corporate surcharge and payroll tax also subsidises the MTA’s operations. Finally, the MTA relies on NY State monies or, more recently, debt, to pay for capital and state of good repair projects. Despite this, the MTA has consistently run a substantial budget deficit over the years.
Methods and Data
Interviewing Process and Coding of Network Data
To identify key actors and the network boundary we employed a snowball sampling approach. Our data was collected via structured interviews with key individuals from different types of organisations relevant to the urban governance networks. Most interviews were “on-site” although a handful were conducted via phone (a voice recorder was used to capture the conversations and all recordings were transcribed). For ethical and operational reasons, anonymity was guaranteed to all interviewees. However, we use the real names of their parent organisations.
The approach was first tested in London. The initial group of respondents, singled out through desk research, nominated other individuals (and organisations and looser groups of individuals) in their replies to the questions of the interview script (see the Appendix). There was an attempt to select a heterogeneous first group of respondents to use different “entry points” into the networks (Laumann and Knoke 1987). The aim was to draw a network as comprehensive as possible given the time and resources available. 6 For both cities, the criteria for selecting participants for the second phase of interviews did not simply consist of prioritising the most “highly cited” names, although this was a key concern. As an attempt to include some (potentially) critical voices and to make sure the networks were comprehensive, the second phase of the snowball sampling process also targeted some seemingly “side-lined” or “peripheral” actors. We conducted a total of 55 interviews in London and 40 for the case of NYC (some interviews were held in Washington DC to capture the input of actors acting at the Federal level).
Figure 1 illustrates how the dataset of different individuals, organisations and other social groups (e.g., “cycling community,” “tube users,” etc.) evolved during the course of the interviews in London and NYC. It is noticeable that after around 15 interviews the addition of new actors (or nodes) to the dataset begins to plateau. Although subsequent respondents may name dozens of relevant individuals or organisations, many of them have already been mentioned in previous interviews. Nevertheless, a few new nodes continue to be added on the right end side of the graph of Figure 1. This may be explained by the inclusion of more peripheral actors who might have referred to other peripheral or less engrained players.
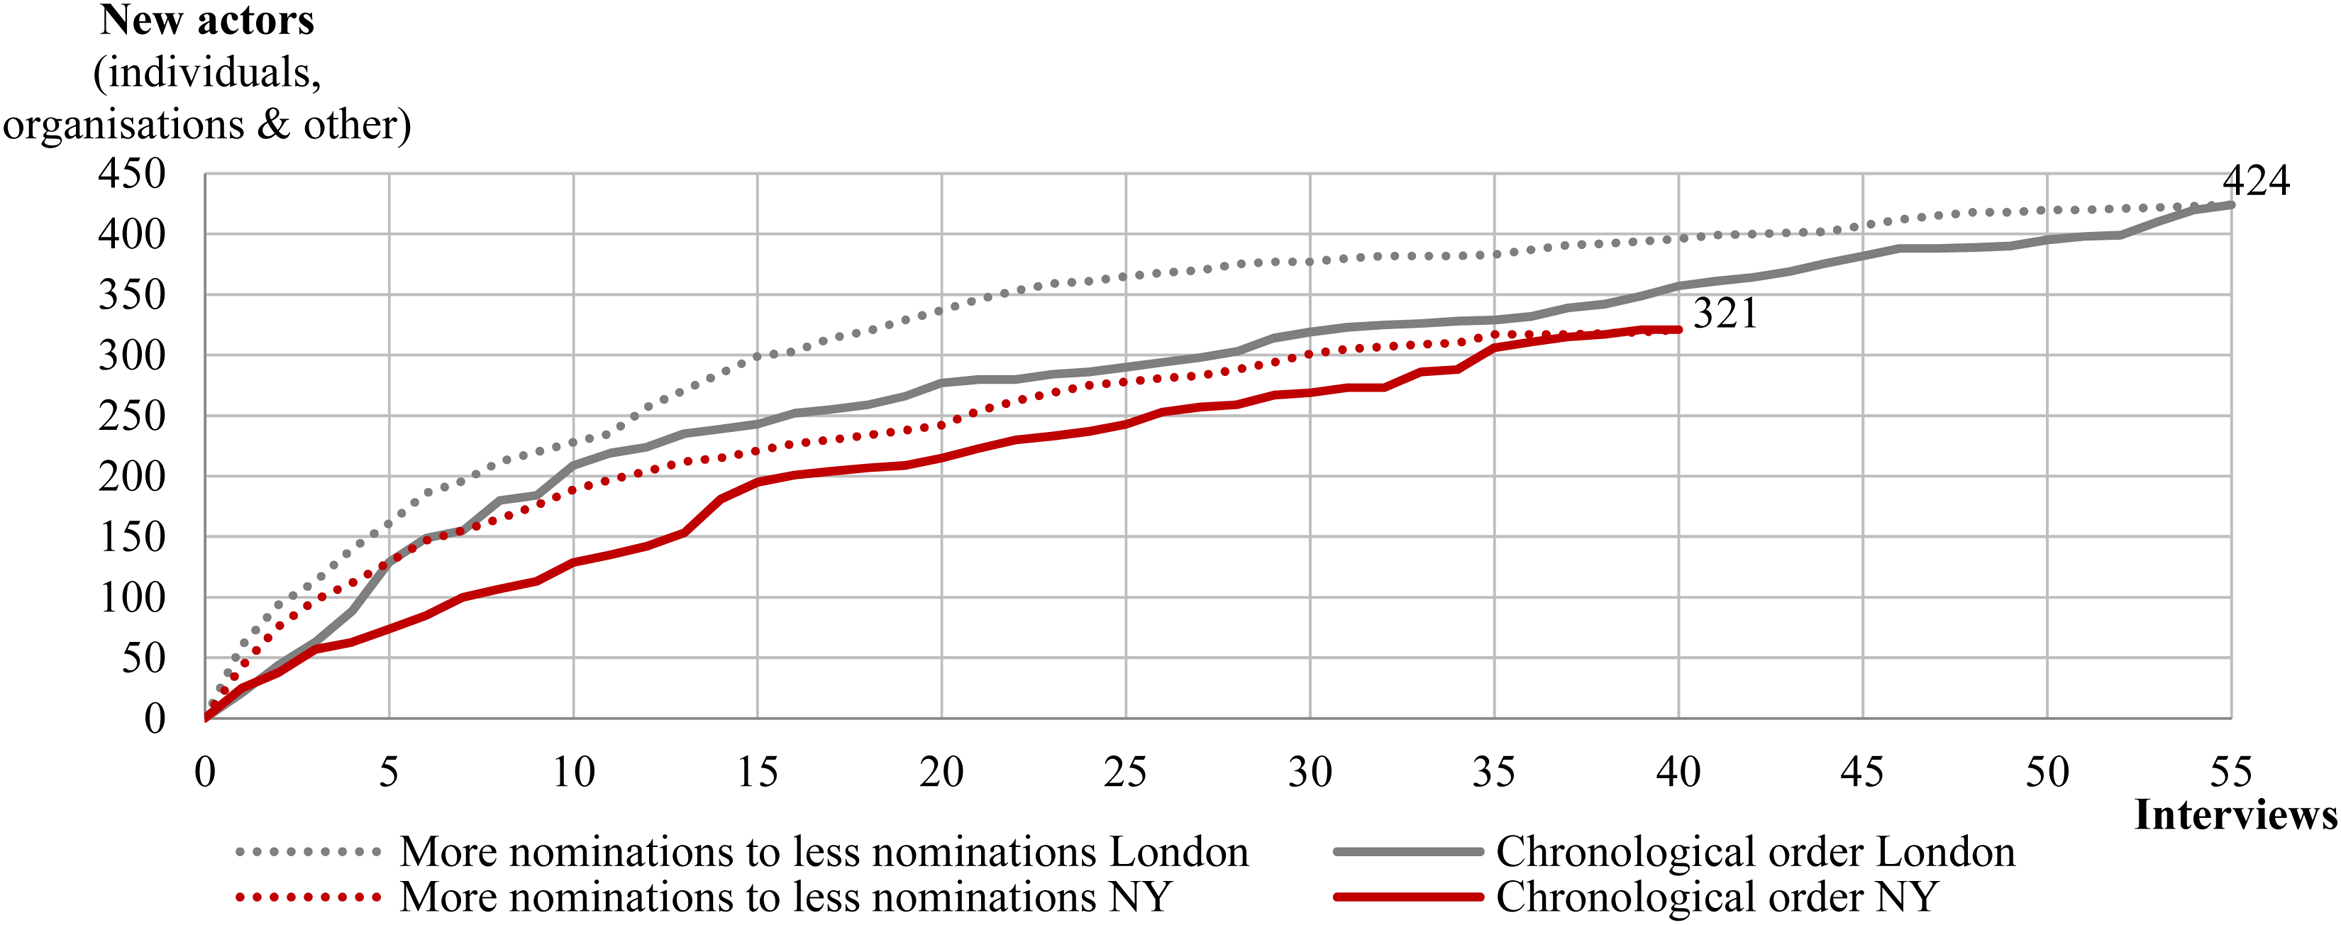
New nodes during the interview processes in London and NYC (all data).
The interview transcripts were used to produce the network data. A case-by-case matrix (Prell 2012) was created for each question of the script. That is, for each question, we produced a table that identifies which names (of individuals, organisations and other social groups) were mentioned in the responses to that question, and by whom. All the data generated from questions “Q1” to “Q15” and “Q17” to “Q20” was used to conduct the analysis presented in this paper (see Appendix). 7 More precisely, the analysis refers to a case-by-case matrix that aggregates the network information extracted from the answers of all the participants to those questions, in each city. So the ties represent different kinds of exchanges, such as information, authority, advice or other governance resources of various types. 8 All quantitative parameters of the networks were calculated through the UCINET software package (Borgatti, Everett and Freeman 2002).
Data
After coding answers to the relevant questions, the size of the transport governance networks of both cities were as follows: London included 424 unique nodes whereas in the case of NYC the total size was 321. In terms of individuals, according to our data, there are 265 people with particular stakes or capacity to influence transport strategies in London. In NYC this number is lower: 217 individuals were named in the course of the interviews. Looking at organisational data, there are 190 entities in London and 163 in NYC that are particularly relevant for the governance of this policy sector. 9 Table 2 summarises these figures.
Number of Nodes in the Transport Governance Network of London and NYC.
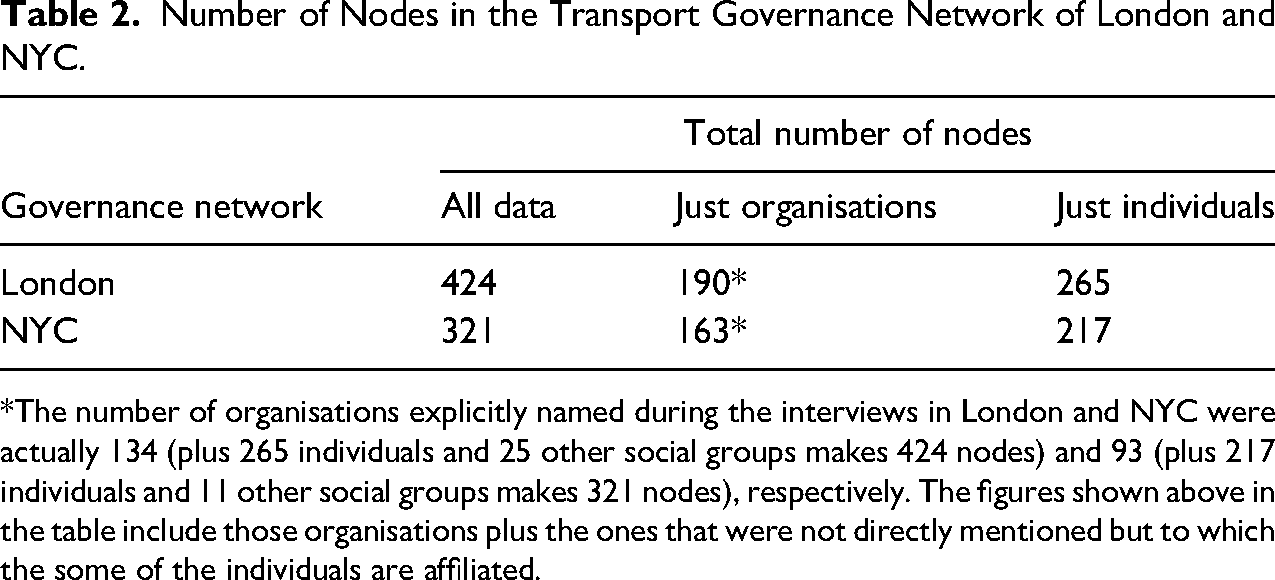
*The number of organisations explicitly named during the interviews in London and NYC were actually 134 (plus 265 individuals and 25 other social groups makes 424 nodes) and 93 (plus 217 individuals and 11 other social groups makes 321 nodes), respectively. The figures shown above in the table include those organisations plus the ones that were not directly mentioned but to which the some of the individuals are affiliated.
In terms of stakeholder groups, the composition of the two sets of interviewees ended up being close to the mix of the final datasets for both cities (see Figure 2). It is, therefore, reasonable to argue that the respondents are representative of the overall governance networks.
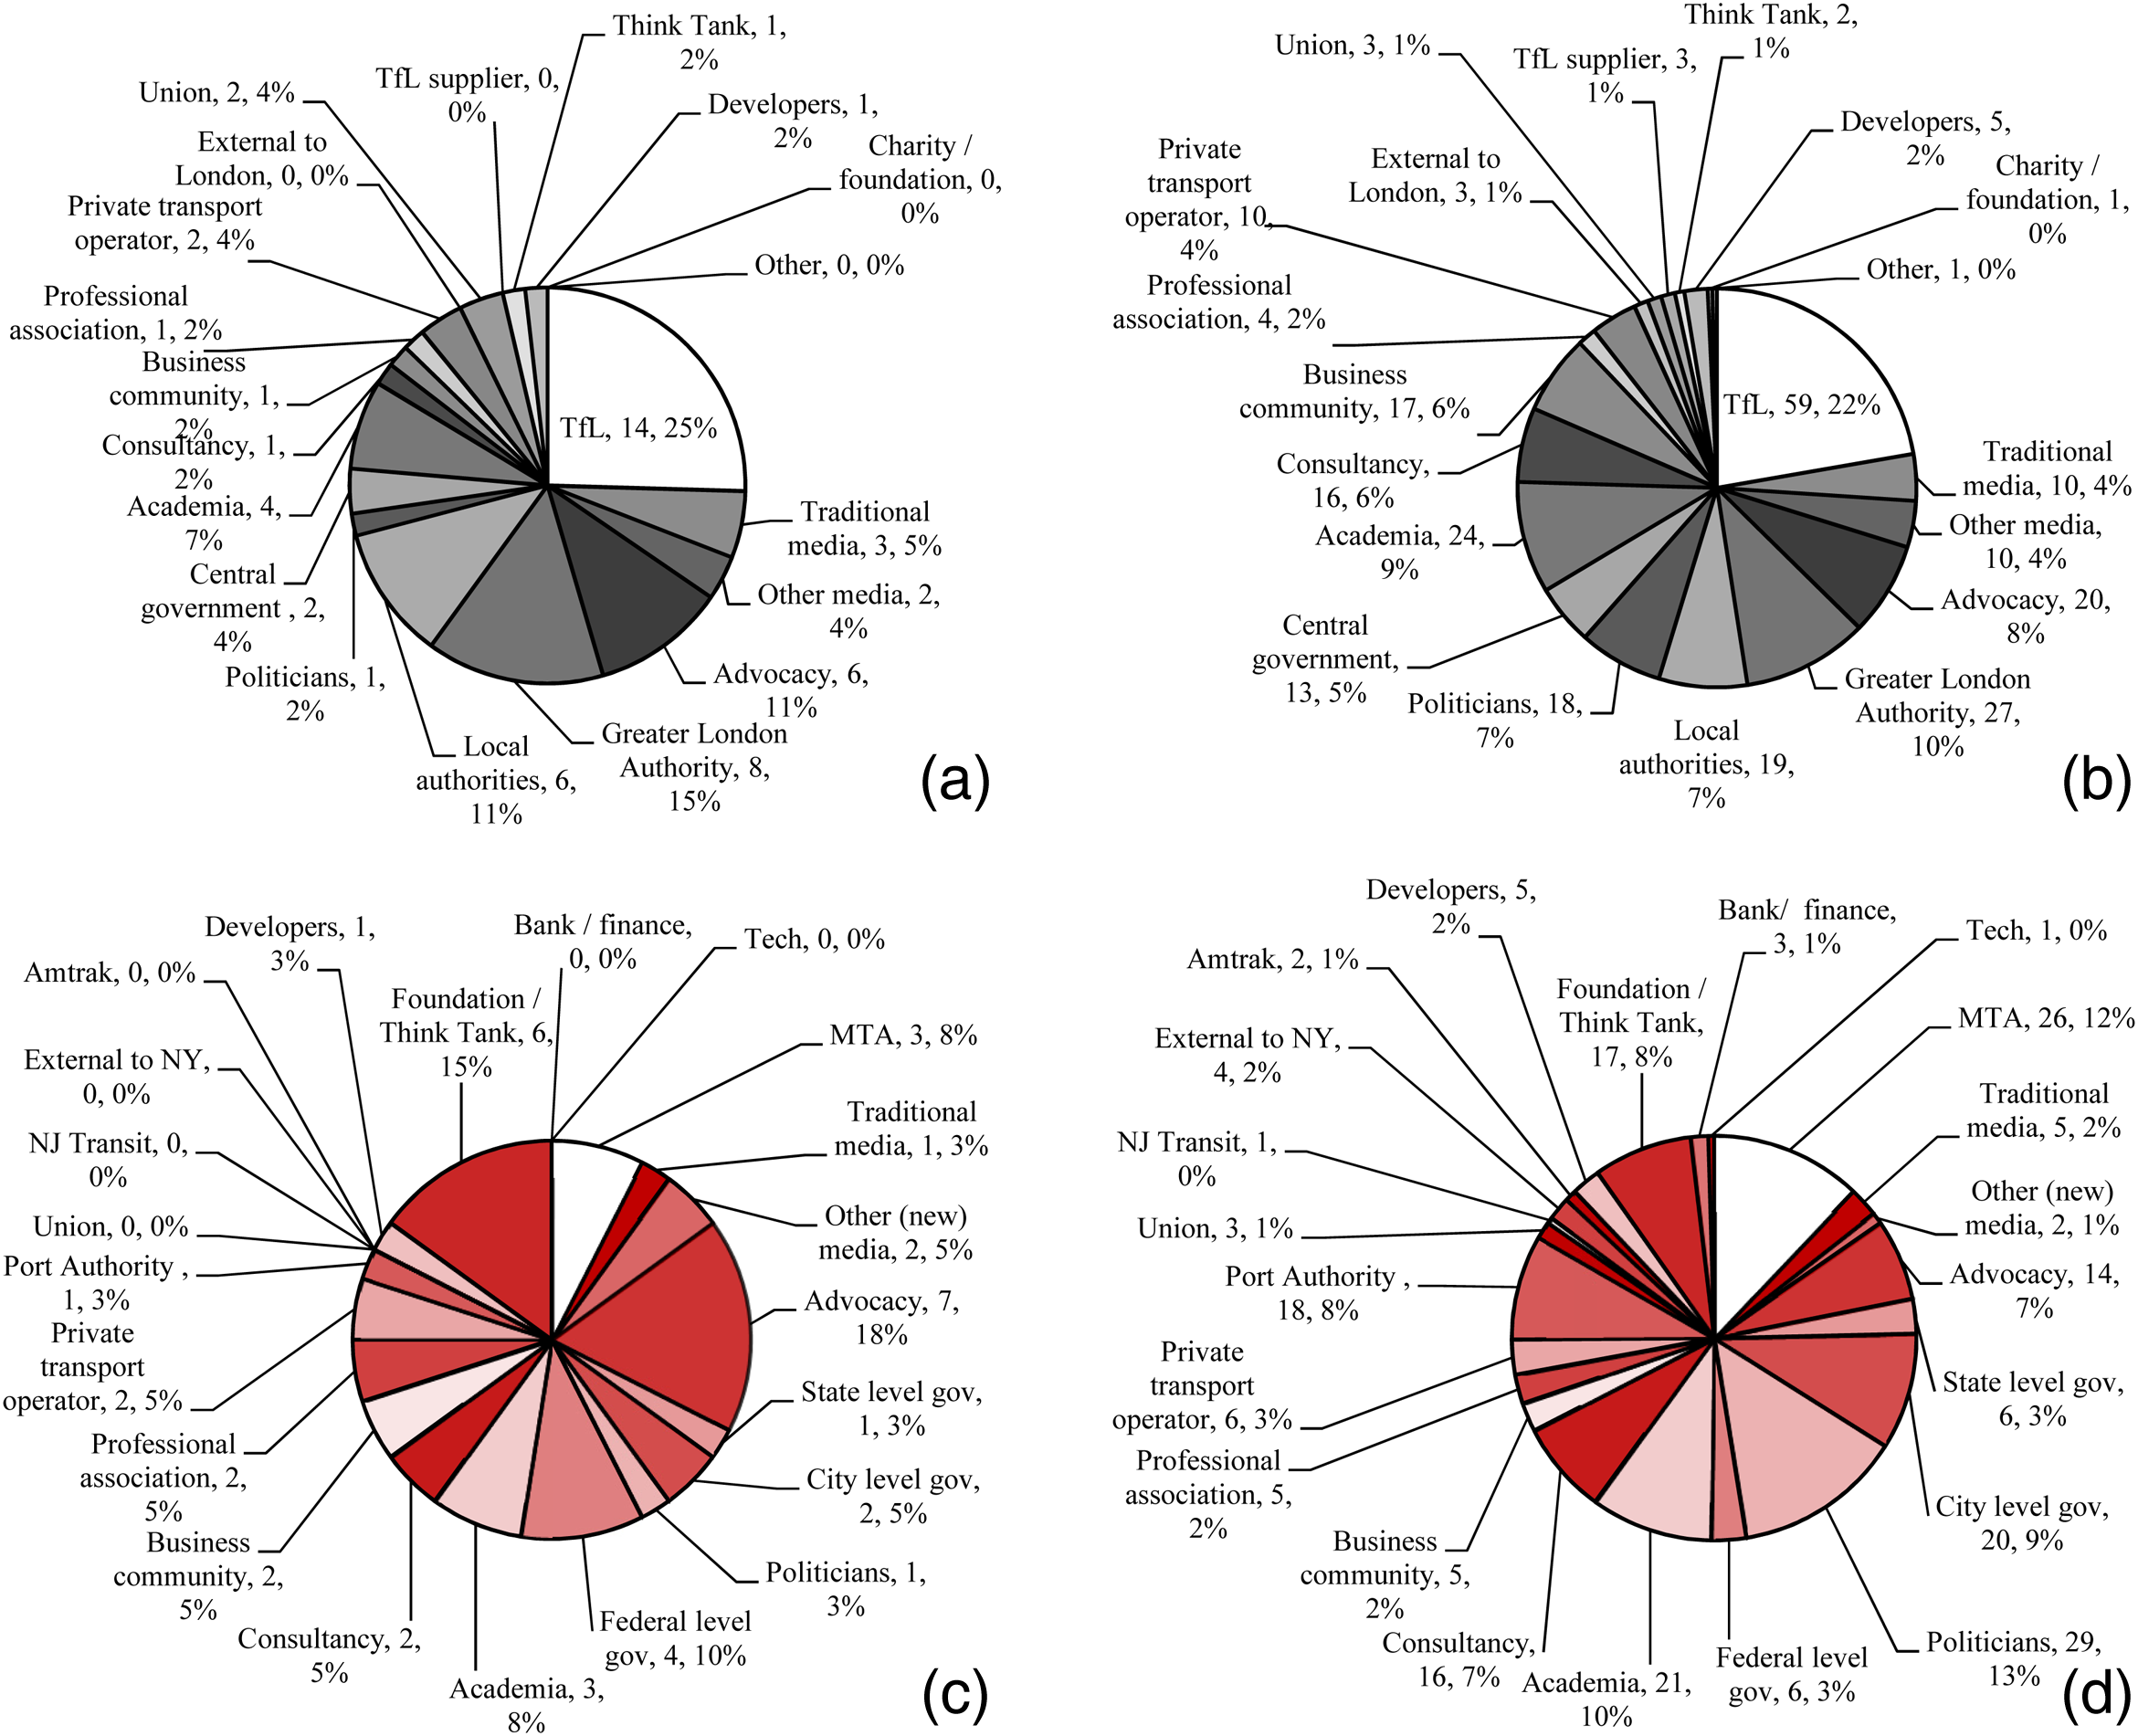
The prevalence of stakeholder groups in the governance networks. (a) Set of interviewees for London. (b) Complete network of individuals in London. (c) Set of interviewees for NY. (d) Complete network of individuals in NY.
When analysing SNA data one can consider the direction of the ties (directed data) or assume that they are reciprocal (undirected data). One can also consider the strength of the ties (valued data), or simply consider the existence/inexistence of a tie (binary data). Directed data can be transformed into undirected data and valued data can be transformed into binary data, but not vice-versa. Our data is directed (though only flowing outwards from the respondents, and only inwards to them if other respondents named them as well) and valued (we assume that if an individual/organisation is named in several of the script’s questions, then the relationship is stronger than if the individual/organisation is named in only one question). 10 However, to calculate some of the network parameters, we use undirected and/or binary data. That is, we assume the ties between interviewees and the nominated nodes are reciprocal and/or ignore whether each node was nominated in more than one of the script’s questions. This allows us to employ some network analytics that require this type of data (see following section) – but imposing these assumptions will naturally impact the robustness of the related findings.
Finally, the data can be analysed by considering the social networks of individuals or the social networks of organisations (or individuals and organisations together, although this makes interpretation difficult). To maintain the anonymity of interviewees, and because the positioning and interlinkages of the various organisations and institutions involved in the governance networks of both cities are more relevant to our research questions, our analysis focuses on organisational-level data. 11
Network Analytics
As discussed in the theoretical section, our objectives point us to analytics that illustrate the composition and structure of the networks. And among the structural features, cohesion and centralisation are particularly relevant (Siciliano, Carr and Hugg 2021b). In this respect, Ramia et al. (2018, p. 335) usefully refers to the “organisational SNA tradition [that] allows for a more holistic focus on network structures, rather than just the individuals who make up networks.” These authors further direct our attention to “acts of brokerage (…) that facilitate cooperation and information exchange in organisations” – gauged through measures of network structure such as “betweenness,” “short path-lengths” and “degrees of separation” – and to “the degree of clustering of particular intra-network cliques” (Ramia et al. 2018, p. 335). Accordingly, and considering the limitations of our data emanating from the interview-based approach outlined above, our analysis employs a few analytics organised under three themes.
First, we briefly describe some basic characteristics of both networks and draw initial insights based on their “density,” “centralisation,” “diameter” and “average path length.” Network density refers to the proportion of network ties that are present versus the maximum number of ties that could be present, i.e., where any given actor is connected to all other actors. It measures how far individuals or organisations in a network are linked together and, crudely, how cohesive the network is. The problem of this measure of connectedness is that smaller networks tend to have higher density scores (Prell 2012). Therefore, comparing networks of different sizes is problematic and interpretations should be taken with care. Furthermore, establishing a link between density and cohesiveness is hindered by issues of centralisation (Network A can be more interconnected than Network B and have the same density score if a small number of actors in Network B are hyper-connected).
“Degree centralisation” measures the extent to which ties hover around a single or very few actors; it is therefore useful to investigate issues related to hegemonic actors within governance networks, or to identify more distributed or horizontal urban governance structures in a given policy area (Rode 2019). Degree centralisation is based on “degree centrality” (see below); it corresponds to the variation in the degree centrality of the actors divided by the maximum possible degree centrality variation, considering the network size. If a network has a high centralisation score, it has a strong demarcation between core and periphery (i.e., it is higher when it contains very central and very peripheral actors). In other words, if there is more variation in centrality among actors, the centralisation score will be higher. The diameter (i.e., the longest “geodesic” 12 ) and average path length (average of all the network’s geodesics) of the networks provide further indications of their cohesiveness/fragmentation (if the values for the diameter and average path length are small, then all nodes are close to each other).
Second, we analyse the centrality of actors. “Degree centrality” is a basic measure of centrality and represents involvement or activity in the network (Neal 2011). It corresponds to the number of ties an actor has. However, given the limitations arising from our snowball sampling approach, not all actors present in the networks were interviewed. Therefore, not all actors had the chance to reciprocate the ties, nominate other actors in the network or even nominate new actors. This means that the 55 interviewees in London and the 40 interviewees for the case of NYC will tend to appear to be more highly connected than other actors that were not interviewed, especially if the direction of the ties is ignored (i.e., if undirected data is used). Since “indegree centrality” only corresponds to the number of ties received by an actor, this limitation is less relevant for these scores. Furthermore, indegree centrality can be taken as a measure of prestige or popularity, which is likely more relevant for our analysis of the cast of characters at the whole network level (Siciliano, Wang and Medina 2021a). These centrality measures can be normalised to compare networks of different sizes and should be calculated using binary data (and undirected for the case of degree centrality). 13
To further investigate the structural features of both networks and the positioning of key actors, we explore three other classic measures of centrality: “eigenvector” (undirected, valued data), “betweenness” (directed, binary data), and “closeness” (undirected, binary data) centrality. In simple terms, eigenvector centrality gauges the connection to important actors (more than just highly connected, it is advantageous to be connected to high status actors – in line with the notion of preferential attachment). Betweenness centrality is a proxy of potential control and is related to placement in the network and the capacity for each actor to play a brokerage role – that is, bridging the gap between different types of actors and/or facilitating actors’ coalitions. Closeness centrality is an indication of each actor’s independence, information level, and/or capacity to mobilise a network. Analysing centrality is important because the positioning of actors in the network may allow them to access/harness key governance resources (Siciliano, Wang and Medina 2021a). Centrality, however, does not necessarily equate to power. Resource control may confer considerable power to a particular actor even if it is not very central, especially if there are few or no alternative “suppliers” (Neal 2011).
And third, to gain additional insight into the diversity of actors and the cohesiveness of the governance networks, we analyse the ‘clique’ membership and the “ego networks” for some of the key actors in both cities. Actors that belong to multiple cliques 14 are expected to play a bridging role, linking different actors together, inserting redundancies and building cohesion. Ego networks are based off a central node (the ego) and all the nodes it is directly connected to (the alters). In addition to the ties between the ego and the alters, they include any ties that may exist among the alters. While all the analytics mentioned so far consider the whole network, zooming in on the ego networks of key actors can shed more light on the role they play and the diversity/homogeneity of their contacts. In these local networks, the ego plays the role of broker whenever it lies on the shortest path between two alters and “ego betweenness” is the sum of the ego’s proportion of times it lies on the shortest path between each pair of alters normalised by a function of the number of nodes in the ego network.
Results and Discussion
Networks’ Basic Features: Centralised London and Interconnected NYC?
As shown in Table 3, the densities of both networks are quite similar, even though NYC’s network is smaller. The fact that these densities are similar may be explained by centralisation. London’s transport governance network seems to have fewer “highly powerful” actors than NYC’s. In other words, fewer actors are controlling transport governance in the British capital, whilst a broader range of actors are shaping transport strategies in NYC (this insight is taken forward in the next subsection). The values of the diameter and the average path length of the networks also support this assertion. Although London’s organisational network is larger than NYC’s, the diameter and average path length are smaller for the former city.
Network Density, Centralisation, Diameter and Average Path Length in London and NYC (Networks of Organisations).
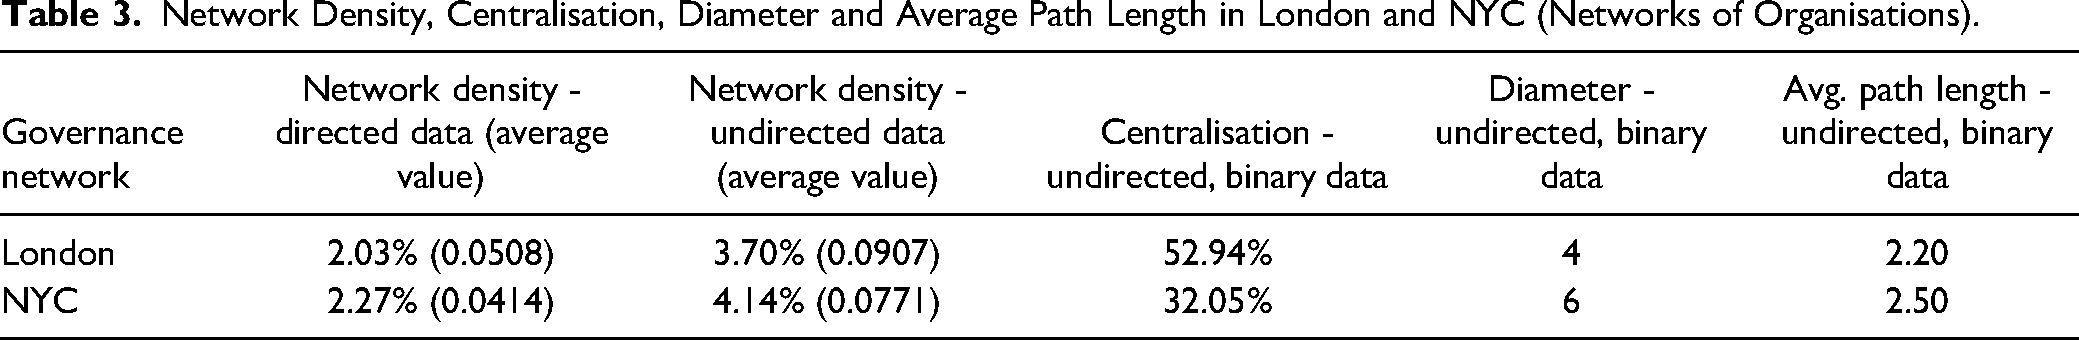
London appears to be more cohesive likely due to the hyper centrality and relationality of one or a few actors. NYC may be less cohesive but more interconnected, perhaps due to the presence of more cohesive subgroups with less connections between them (a point that is further explored below). However, the different size of the networks precludes strong claims about these general parameters and requires us to look at some actor level parameters to shed more light on the structural features of these governance networks.
The Centrality of Actors: Local London and Multilevel NYC
Table 4 shows the top 10 ranking nodes in terms of indegree centrality for the networks of organisations in both cities. An analysis of these centrality scores confirms the conjecture about the presence of a few actors with a clear preponderance in London. TfL and the Mayor of London have similar centrality scores and then there is a gap between these two and the remaining actors of the transport governance network. The top centrality scores for NYC are closer together, meaning that there are more influential actors or, perhaps more accurately, more actors sharing the power/struggling to influence.
Top 10 Nodes in Terms of Normalised Indegree Centrality (Directed, Binary Data, Networks of Organisations).
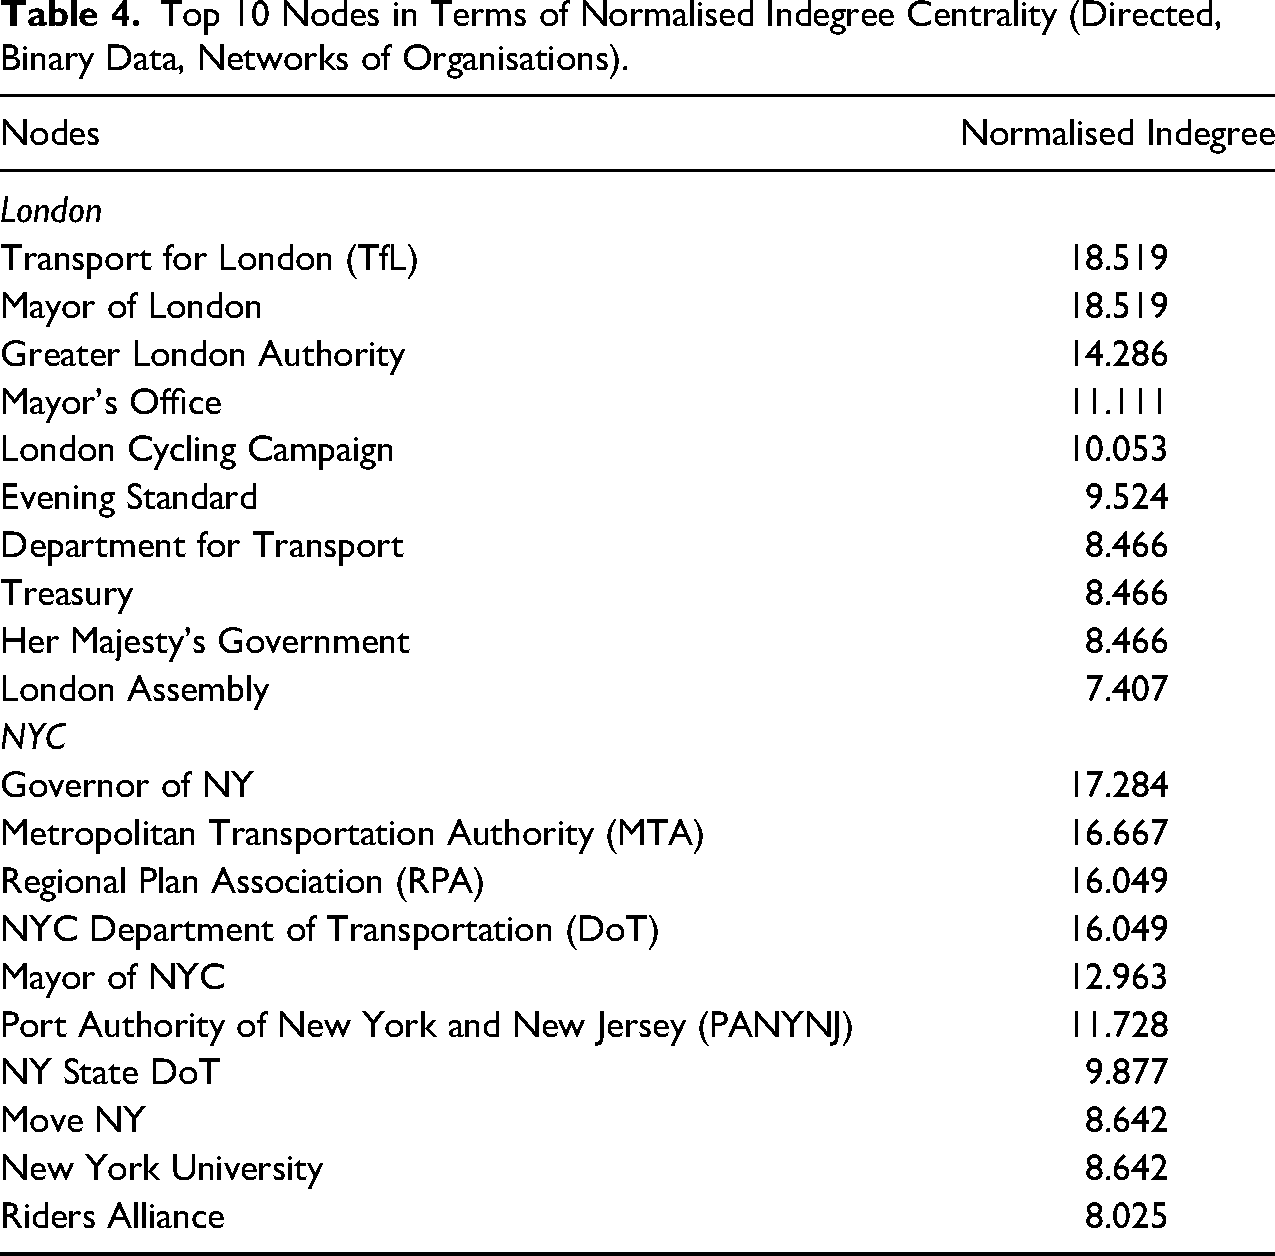
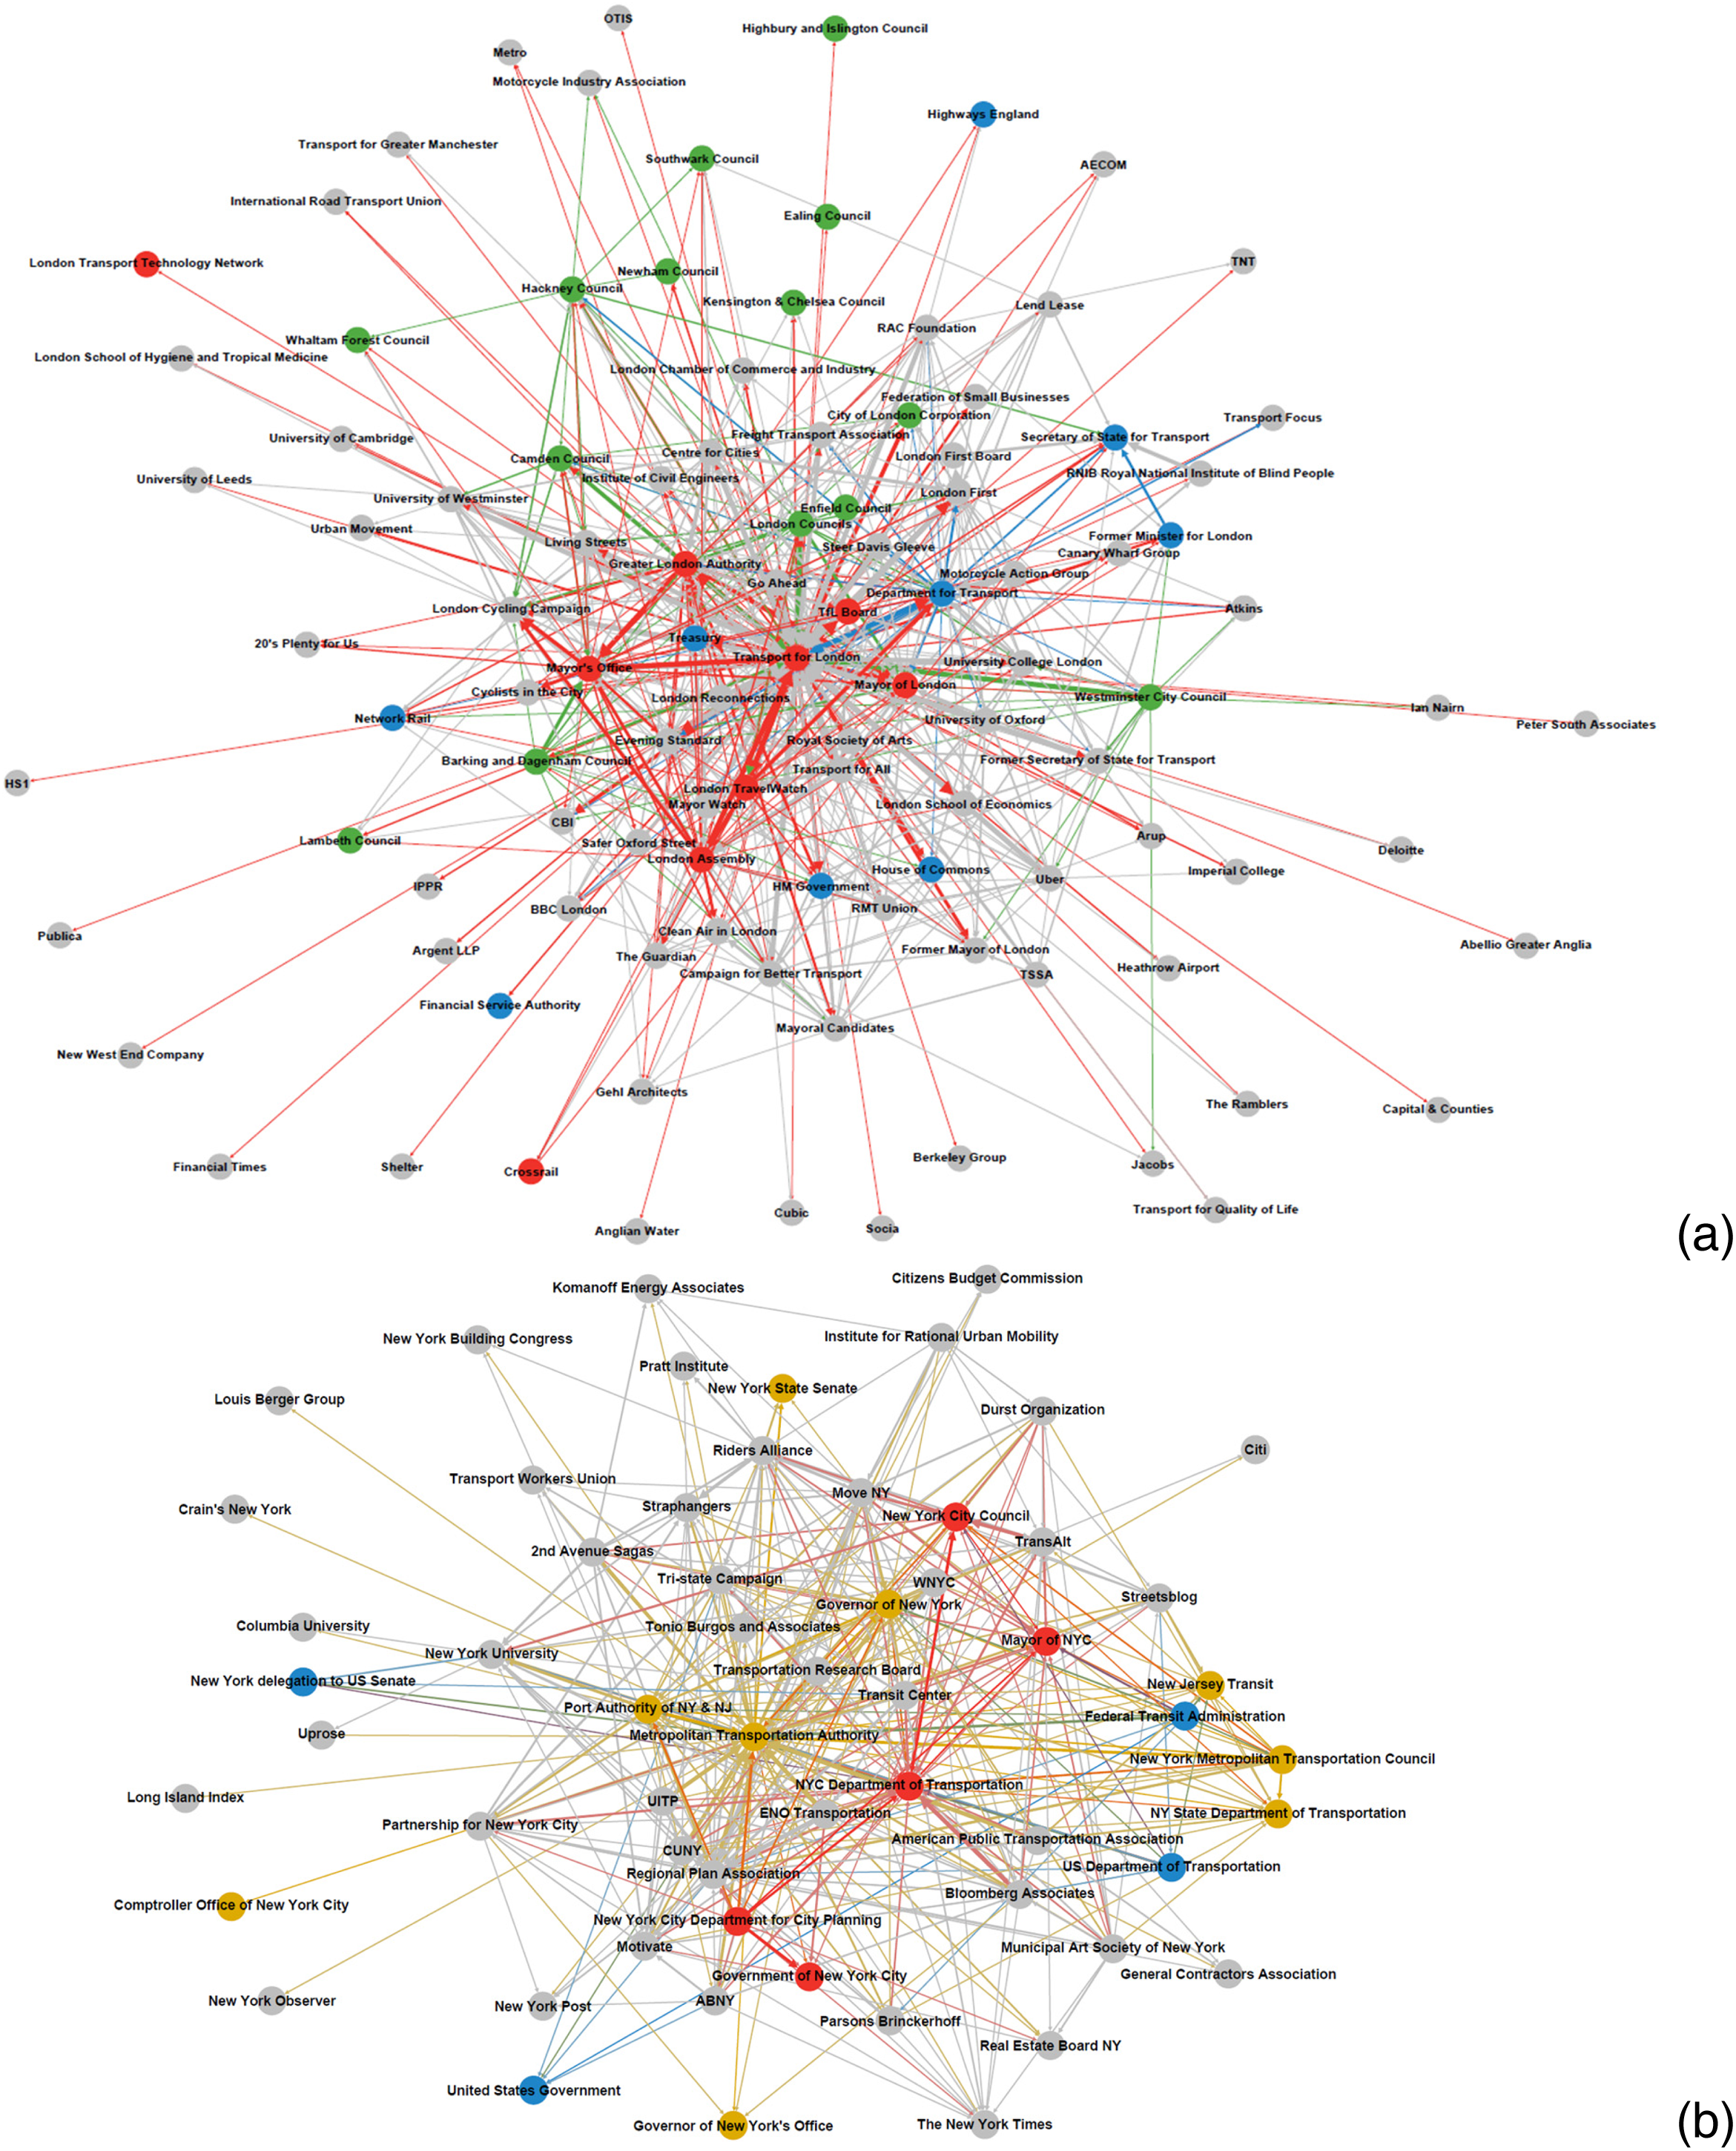
Another interesting finding is the nature of the most central actors in both cities. For example, in London, the four most central actors are all local government entities. The first national government entity appears in the seventh position of the ranking of indegree centrality for this city. By contrast, for NYC, the first local government entity appears in fourth (NYC DoT). In fact, the Governor of NY State is clearly the most central actor in NYC’s transport governance network followed by MTA which, as discussed above, is under significant influence of the State (note as well the absence of federal entities in the top 10 of the ranking of indegree centrality). This sheds some empirical light on differing devolution arrangements, multi-scalar configurations and organisations shaping how transport is governed in both cities. Figure 3 illustrates these differences and the complexity of transport governance networks.
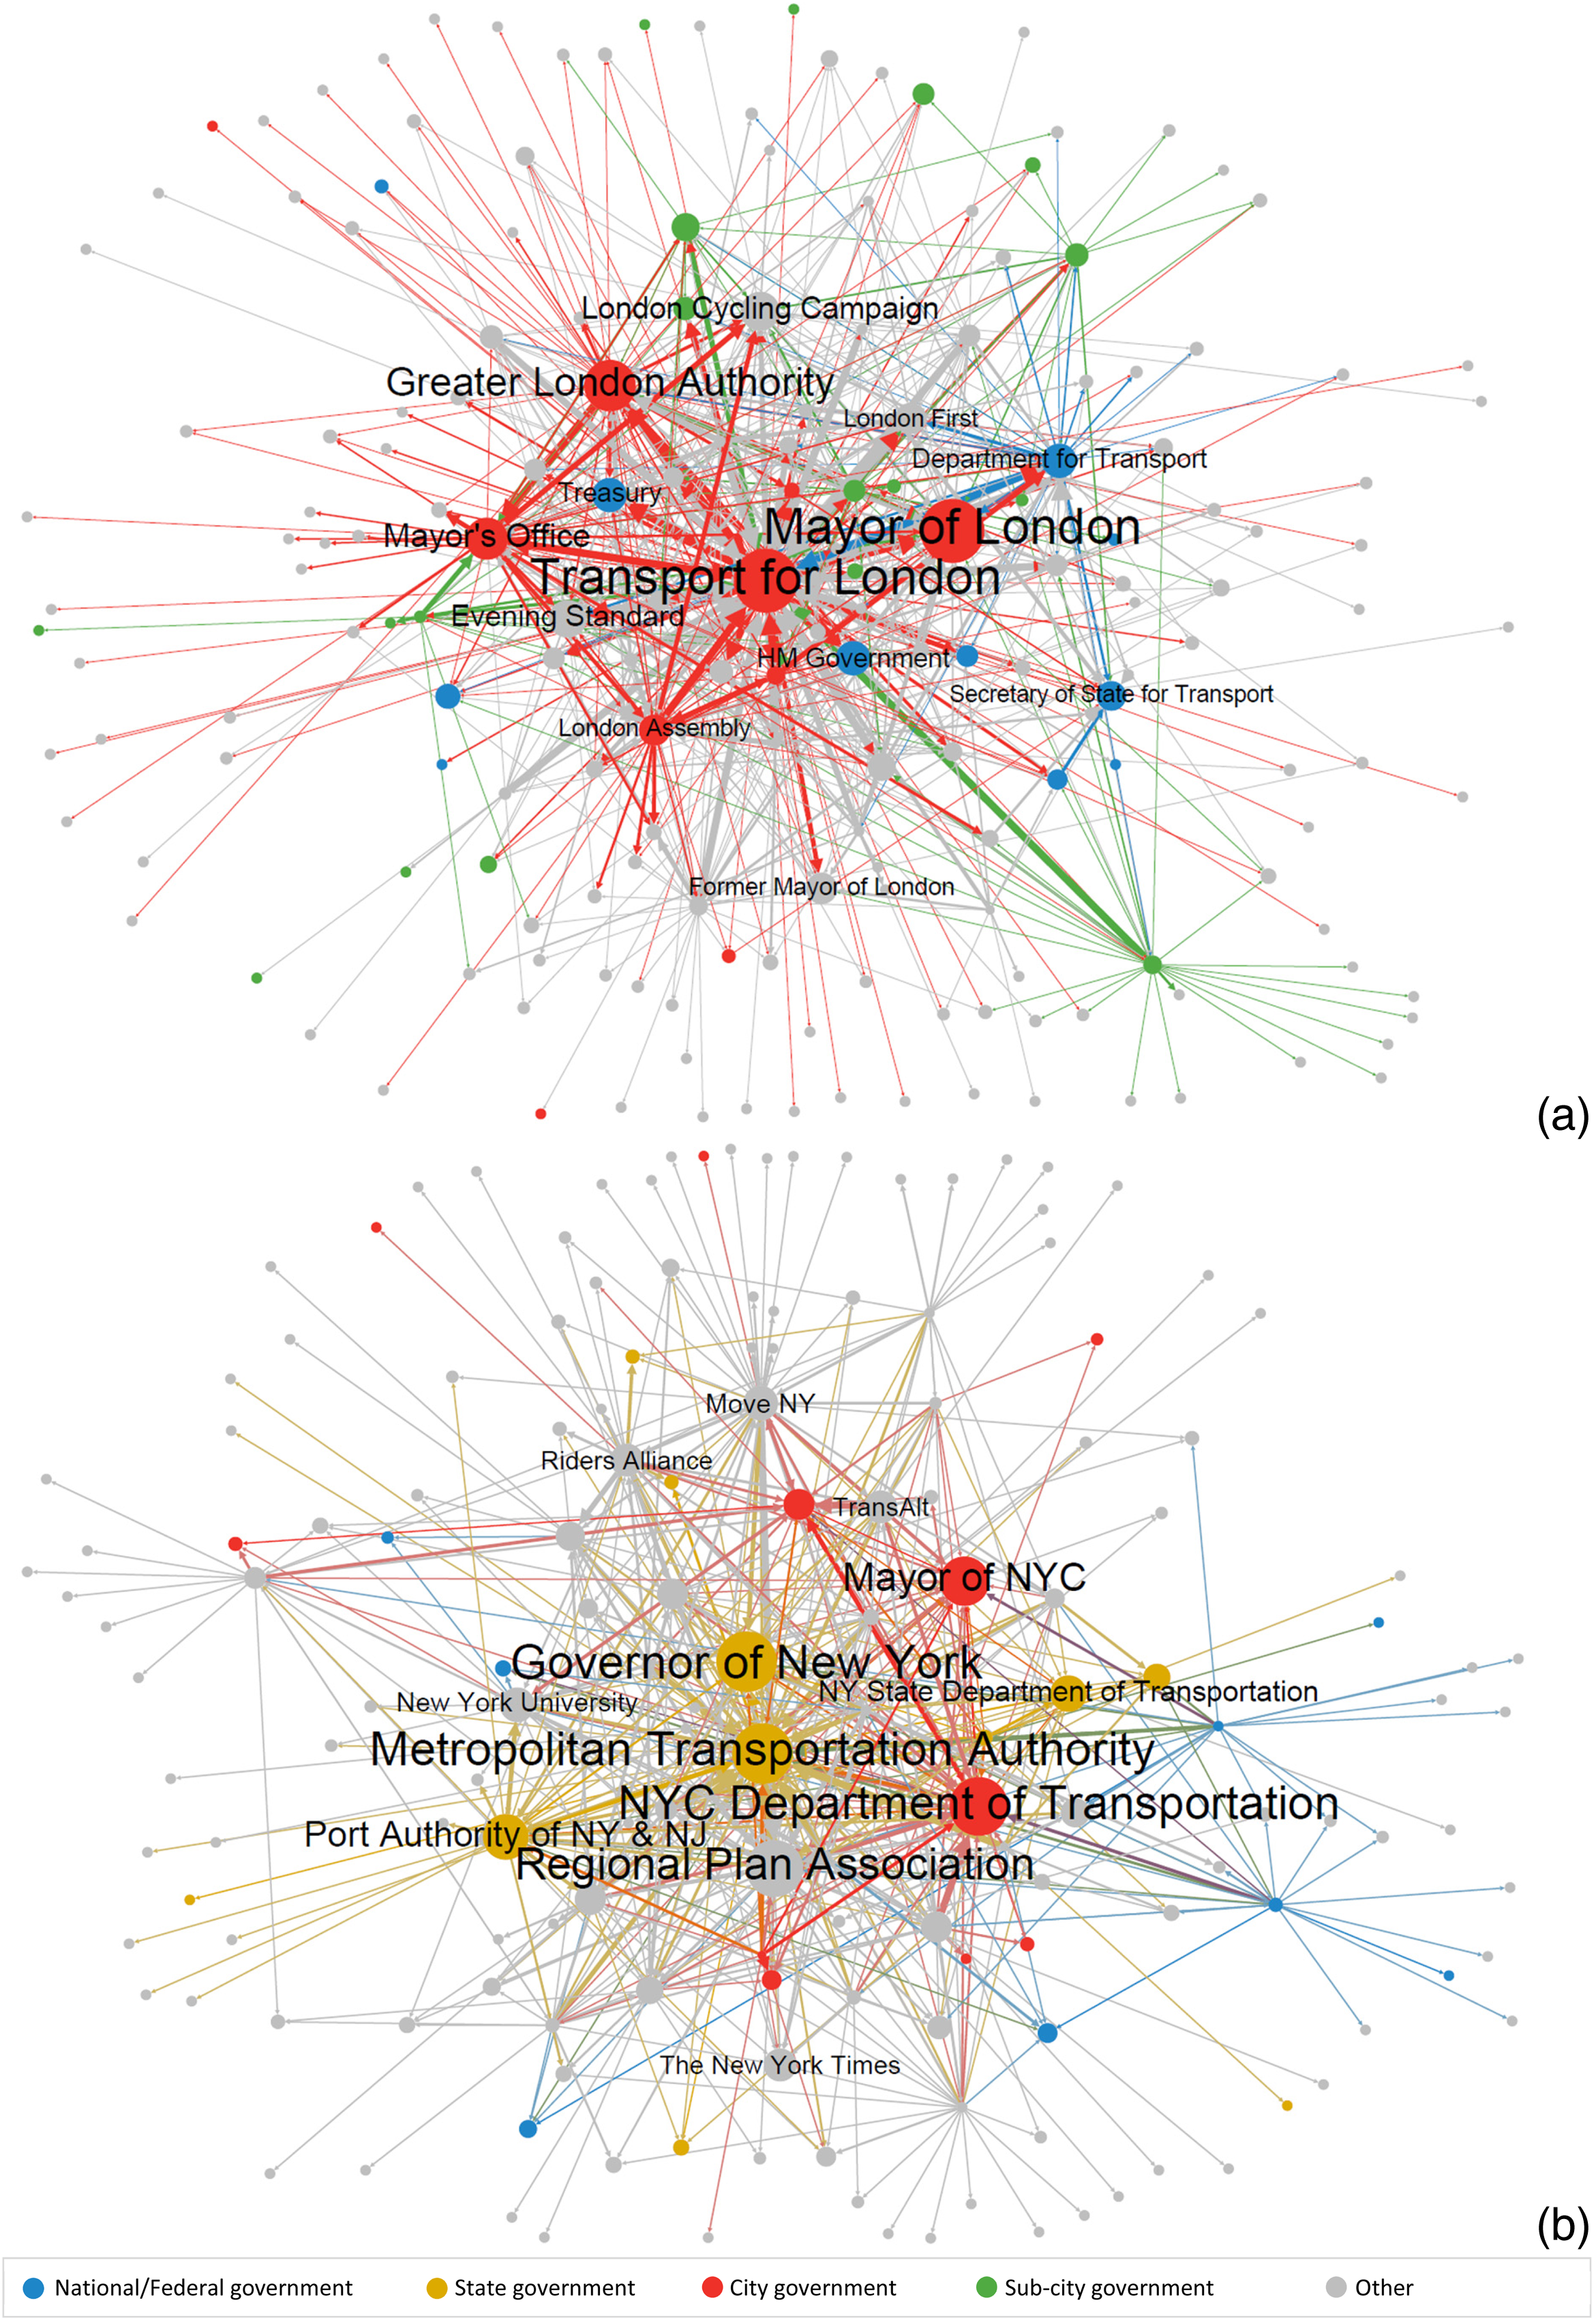
Transport governance network for London (a) and NYC (b). (Networks of organisations – node size reflects indegree centrality.).
Other influential actors in London include an advocacy group – the London Cycling Campaign which has been successful in establishing relevant connections and instrumental in helping to move cycling higher up in the political agenda – and a newspaper (many interviewees stressed the significance of avoiding negative transport-related news making the front page of the Evening Standard). In terms of national government entities, the preponderance of the Treasury in London’s transport governance network is noteworthy, seemingly more relevant than the Department for Transport itself.
In NYC, the centrality of a non-government organisation, the Regional Plan Association (RPA), is remarkable. This region-wide research and advocacy organisation was founded in 1922 by prominent NY business and professional leaders still funding its activities (Fricke and Gualini 2018). It manages to top important governmental bodies at the city, state and federal levels. In addition, and in contrast with London, NYC’s transport governance network also includes other influential non-government organisations, namely, Move NY (a region-wide grassroots campaign developed by “Gridlock” Sam Schwartz, a well-known transportation engineer that previously worked at NYC DoT) and Riders Alliance (a grassroots movement organising subway and bus riders to lobby for reliable, affordable, and quality public transport).
Some interesting shifts in the rankings occur when we instead consider eigenvector, betweenness, and closeness centrality (see Table 5). For example, in London, the institutional figure of the Mayor drops from the top, particularly for betweenness and closeness centrality, whereas the Greater London Authority depicts higher relevance. These results also provide stronger evidence regarding TfL’s dominance. The transport authority is the key network broker, acting as a conduit between disconnected actors in the city (note the difference in magnitude for the betweenness centrality score in relation to other actors). Much more than a mere transport regulator and provider, TfL positions itself as a “political entity” that places particular emphasis on “relationship management” and sees benefit in “fixing problems” of the city that go far beyond the transport sector (quotes from an interview with a TfL Director). TfL reaches out to a broad network of experts, activists, governors and policy-makers.
Top 10 Nodes in Terms of Eigenvector (Undirected, Valued Data), Betweenness (Directed, Binary Data) and Closeness (Undirected, Binary Data) Centrality (Normalised Values, Networks of Organisations).
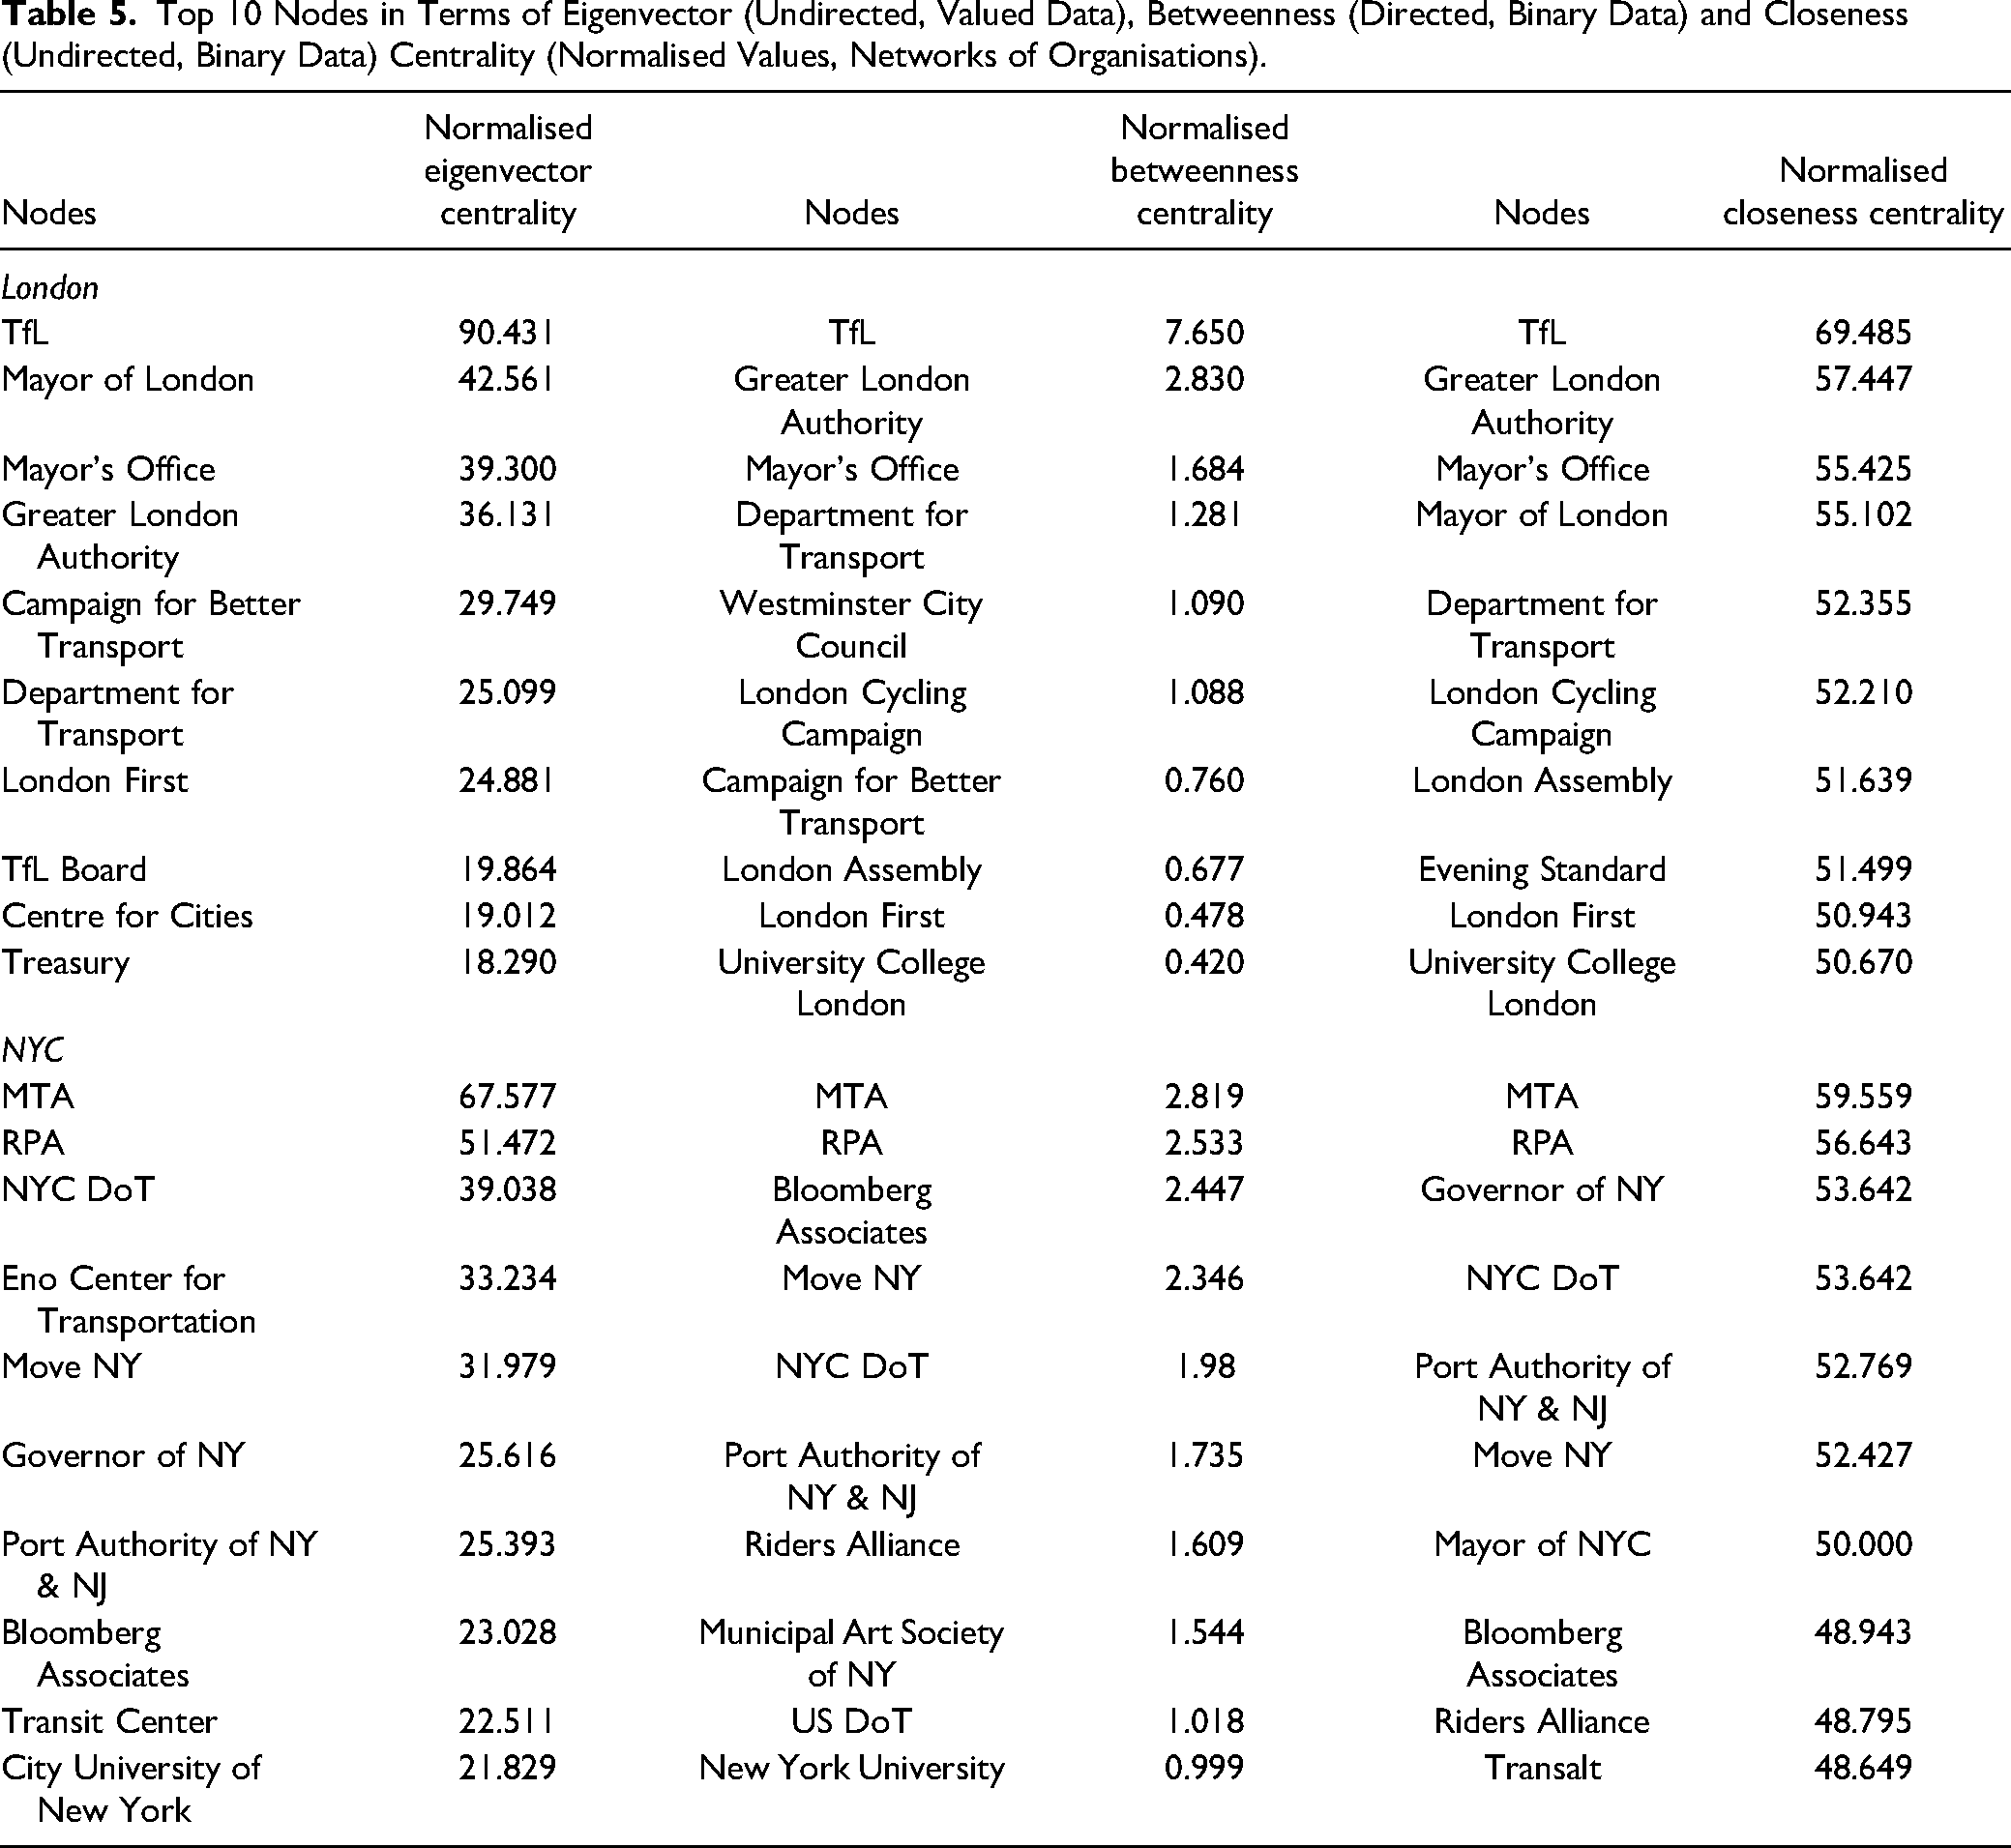
In NYC, the Governor also appears less central according to these parameters, while other entities suddenly show at the top: the RPA, more visibly, but also NYC DoT, Bloomberg Associates and Move NY. The fact that different types of actors – MTA (public authority), RPA (privately funded), Bloomberg Associates (private consultancy founded by Michael Bloomberg, a former Mayor of NYC) and Move NY (grassroots) – have similar betweenness centrality supports the notion that NYC’s network may have more cohesive subgroups with less connections across them. More actors need to play the role of brokers to reach decision-making centres.
In line with our previous discussion of the relation between centrality and power (see also Neal 2011), the lower prominence of the Mayor of London and the Governor of NY according to these centrality scores, particularly for betweenness centrality, is not wholly unexpected. There are two main ways for an actor to acquire power or capacity to influence. One is through legal mandate and/or control of funding. Actors with strong legal mandates and enforcement capacity do not necessarily need to invest in their social networks to harness that power (although doing so might help them achieve smoother processes and better/more stable outcomes). Another way is through an actor’s own social network. Hence, scrutinising the ego networks of key actors can also render important findings.
Cliques and Ego Networks: Cohesive London and Plural NYC
There are 247 cliques in London’s transport governance network and TfL is a member in 214 (87%) of those. The transport authority is followed by the GLA (121, 49%), the Mayor’s Office and the Mayor of London (both members in 75 cliques, 30%), and the London Assembly (55, 22%). In NYC, there are 217 cliques and the MTA is a member in 168 (77%) of those. The transport authority is followed by the RPA (120, 55%), the NYC DoT (106, 49%), the Governor of NY (56, 26%), and Move NY (51, 24%). Once again, London appears to have a much more centralised transport governance system where TfL holds the network together. Governance seems more fragmented in NYC. Not only are more actors playing critical roles, but the nature of these actors differs more widely. This could also mean that transport governance is more plural in this city.
Analysing the ego networks of the transport authorities and main advocacy groups in both cities provides further evidence of this (see Figures 4 and 5). TfL’s ego network has 106 nodes and 461 ties, which means the network density is 4.14%. The London transport authority plays the role of broker 96% of the times and it displays an “ego betweenness” of 19.58. MTA’s ego network only has 58 nodes but it is displays 347 ties, attaining a network density of 10.50%. Again, it is clear that MTA is comparably less connected but other actors are more connected among themselves, potentially able to bypass the agency (for example, in gaining institutional support for a project or building coalitions to influence public opinion). Still, NYC’s transport authority plays the role of broker 90% of the times and it displays an ego betweenness of 16.55. In the London case, the lower density and higher betweenness centrality indicates the presence of many “structural holes,” which allow actors to play brokerage roles to attain status. Bruggeman (2008) shows that higher status actors benefit more from bridging structural roles than lower-status actors which rely more on dense network structures for meeting their needs.
Ego networks of the transport authorities in both cities: London (a) and NYC (b). (Networks of organisations.).
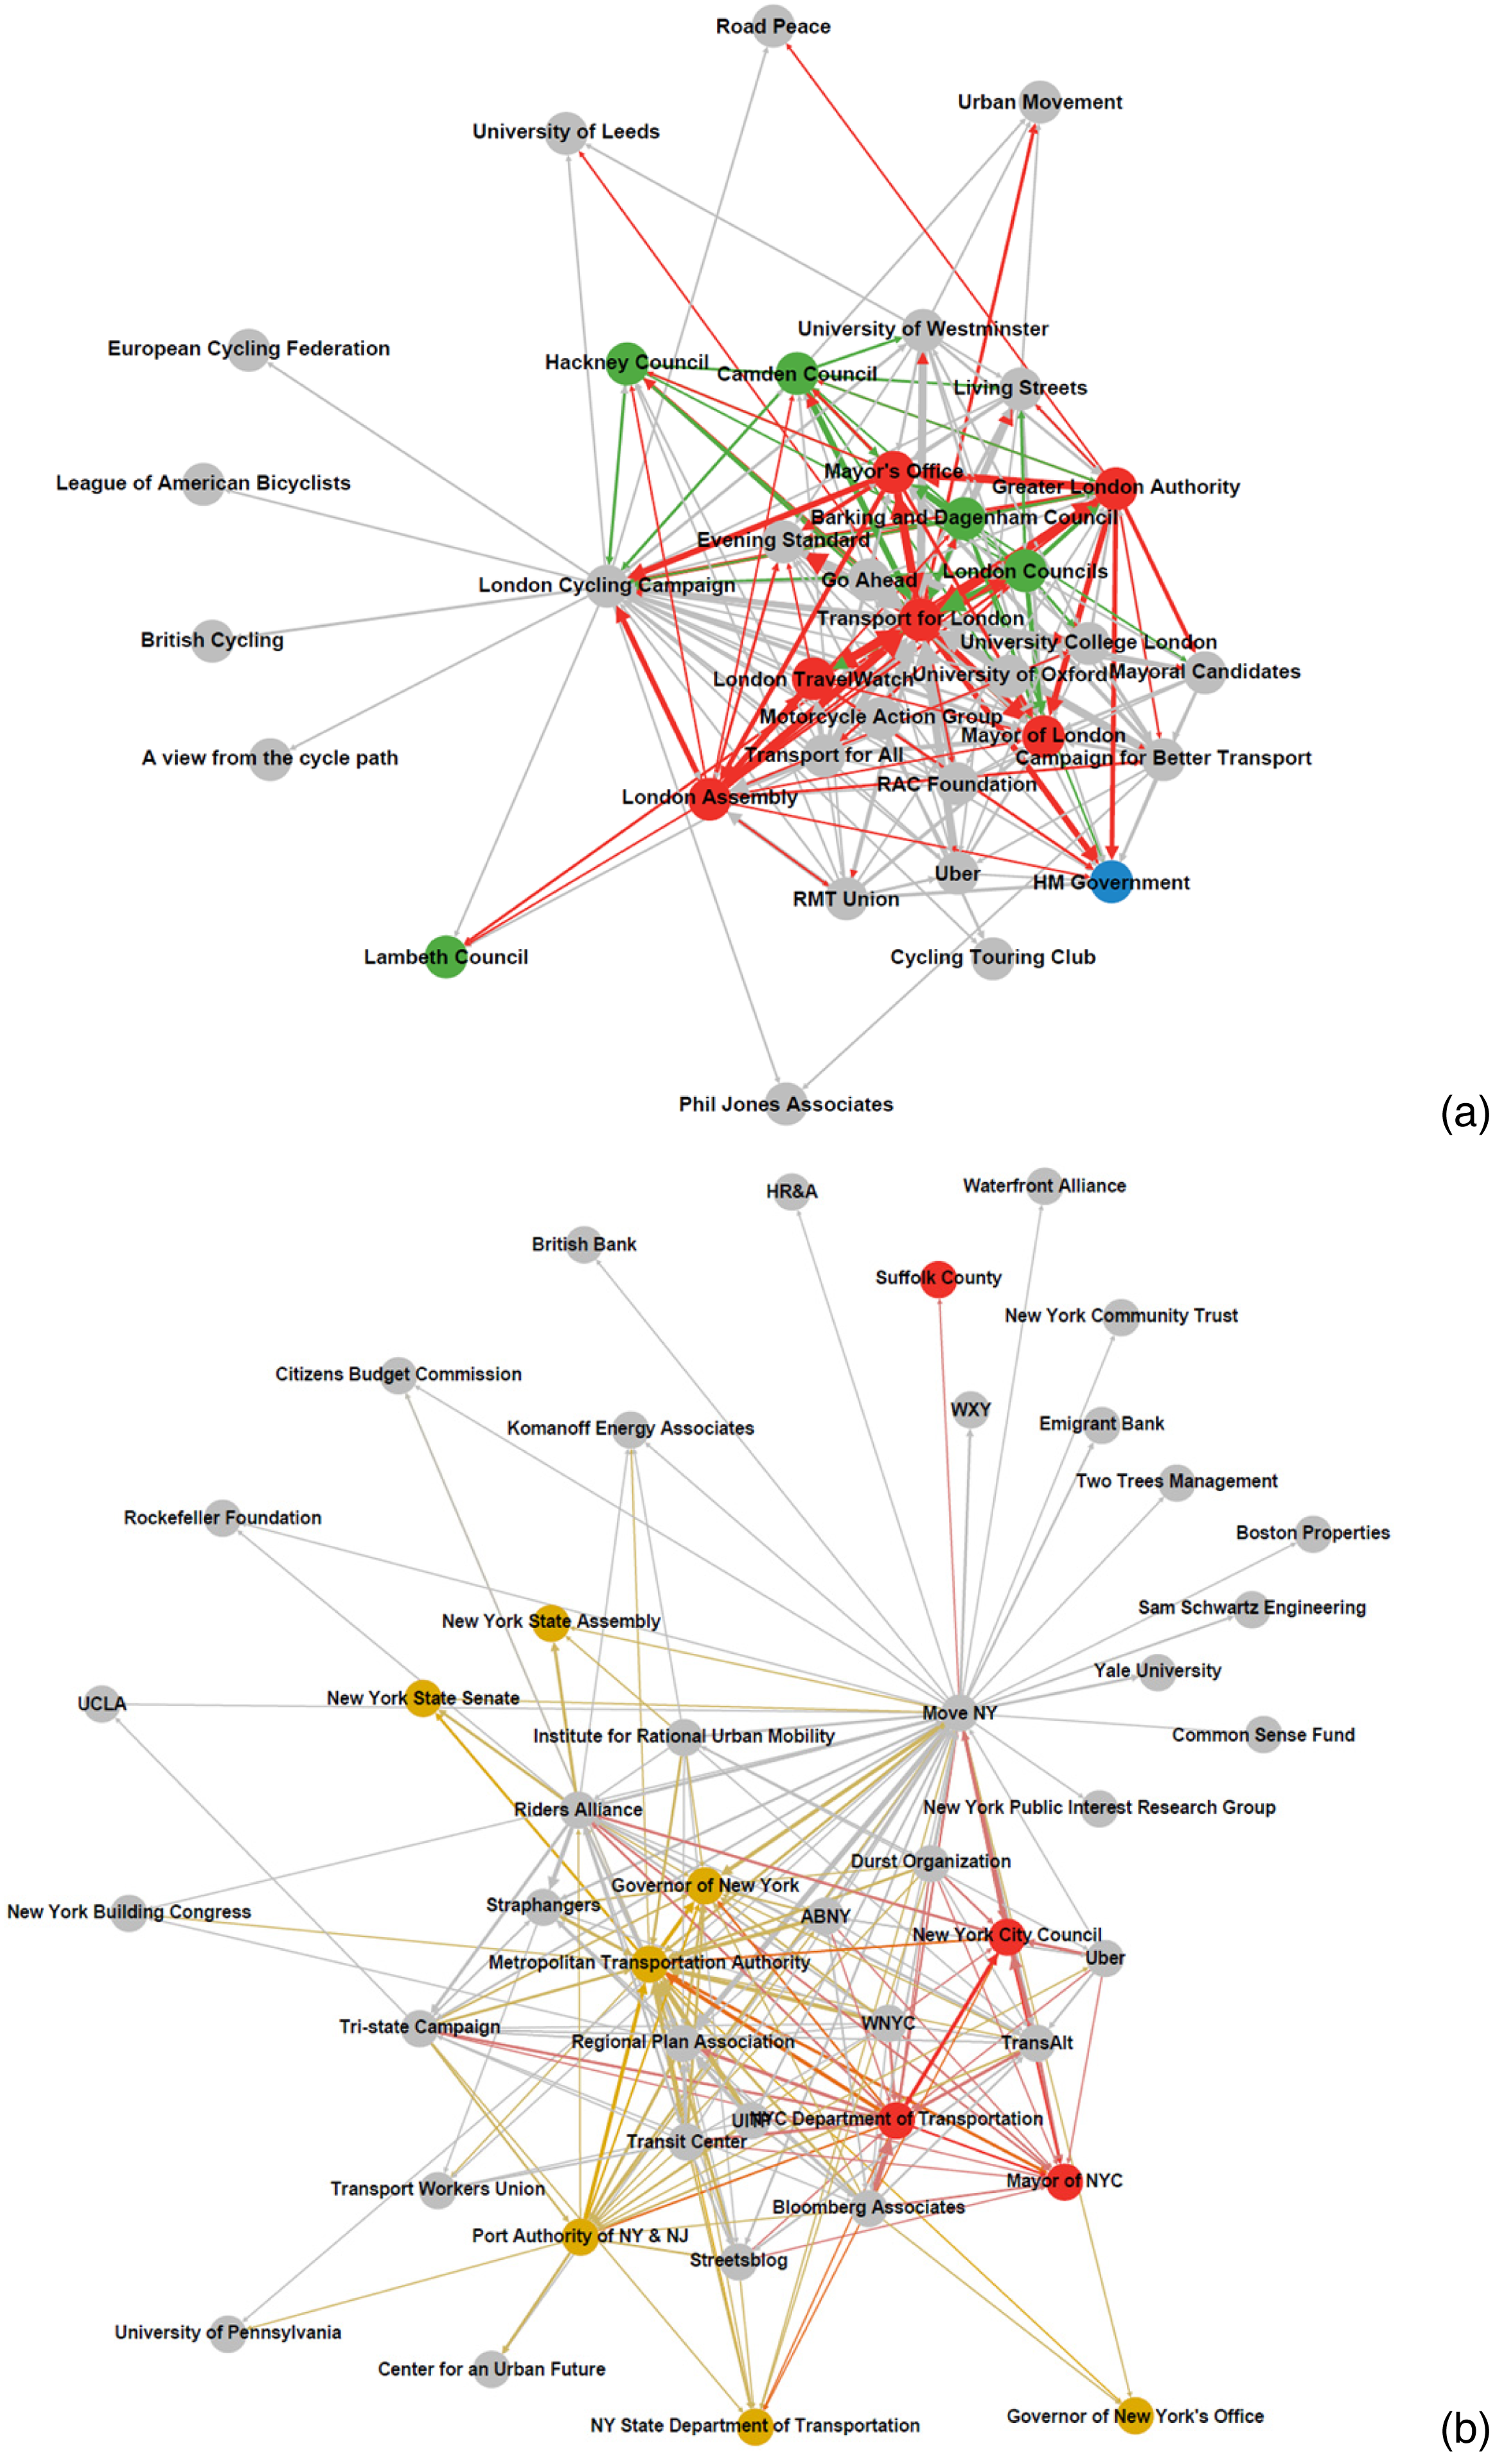
Ego networks of the main advocacy groups in both cities: London (a) and NYC (b). (Networks of organisations).
This picture is practically reversed when we look at the main advocacy groups. The ego network of the London Cycling Campaign (34 nodes) is smaller than Move NY’s (45 nodes). However, boasting 190 ties, the London advocacy group’s network is denser (16.93% vs. 8.54% for Move NY). Move NY brokers the connection between alters 91% of the times and has an ego betweenness of 17.44 whereas the London Cycling Campaign only takes on the brokerage role in its ego network 83% of the times even though it has an ego betweenness of 18.97.
Taken together, these findings suggest that though there is more diversity amongst the important stakeholders in NYC, the actors in this city appear to be more interconnected within their type (e.g., advocacy) but less so across stakeholder groups (e.g., advocacy and state government). In London they seem less interconnected but TfL acts as mediator even within the same stakeholder group.
Points for Theory-Development and Policy-Making
“[U]rban governance refers to the process through which a city is governed without making any prejudgments about the locus of power or the relative significance of political and societal actors in that process” (Pierre 2014, p. 867)
The nature and “informality” of urban governance implies that the relevant actors can hardly be identified merely through desktop research and requires engaging directly with key stakeholders and practitioners (Lewis 2011). Our empirical approach allows us to embrace the theoretical properties of the of the governance concept and let the data “speak for itself” regarding who can influence the process of governing. In fact, the pie charts in Figure 2 (B and D) present our first findings, providing a snapshot of the types and proportion of actors with stakes over the governance of transport in the two cities. To learn more about their relative abilities to harness governance resources, however, we needed to dig deeper into the structural features of the networks (see, e.g., Tables 3 to 5).
Given the limitations of our network data, attempting to test hypotheses or make strong claims would stretch the approach beyond its analytical capabilities. Still, while largely descriptive, the results yield interesting insights that may differ from or complement purely institutional analyses. Referring back to Provan and Kenis’ (2008) three models of network governance, our evidence suggests that London aligns with the “lead organisation-governed” model. Indeed, many of our interviewees emphasised “efficiency” and “economic development” as the key principles of transport governance in the capital. 15 Though none is a perfect match for NYC (which in itself may help explain why transport governance and policy in this city is often considered dysfunctional, Derrick, Paaswell and Petretta 2012), the network in this case resembles the participant-governed model. Faced with the NYMTC’s inability to effectively coordinate transport at the metropolitan level, the RPA emerged to try to fill this gap. However, this organisation lacks the mandate to act as a fully functioning NAO. Nevertheless, in line with Provan and Kenis’ (2008) theorisation, the governance network in NYC is more institutionally diverse and inclusive.
Network centralisation has also been associated to improved efficiency in other empirical studies (e.g., Siciliano, Carr and Hugg 2021b). But this sort of structure is much more in line with traditional hierarchies than with the assumed ideals of diversity and horizontal decision-making typically associated with networks (Klijn and Koppenjan 2016). The “hyper-relationality” of TfL in London seems more geared towards maintaining legitimacy and insulating itself from political manoeuvring than developing genuine heterarchies based on trust (Davies 2011). Thus, we conceptualise “hyper-relationality” as the ability to access governance resources from various channels, negotiate with relevant actors when needed (e.g., the support of the business sector for public infrastructure investments), and mitigate opposition to specific projects.
The greater diversity in the top central actors of NYC’s governance network does not seem to be enabling greater innovation and economic development (Siciliano, Carr and Hugg 2021b). As an exploratory analysis, this study is not suited to establish clear explanations for this nor draw robust propositions about the tensions between centralised/technocratic and fragmented/democratic governance. More targeted investigations into these issues could shed some light on the relationship between network composition/structure and governance outcomes. A deeper understanding of these dynamics would be welcomed by governments seeking to craft network interventions to achieve public ends (Whetsell et al. 2020). Still, even in the possession of this understanding, ultimately there is no optimal “solution” to the problem of metropolitan governance (Storper 2014). Some trade-offs will always have to be negotiated within the politico-institutional constraints of place.
It is also difficult to determine how far the differences in network composition and structure are due to the differences in the cities’ politico-institutional contexts (briefly surveyed in the third section of the paper). Though the nature of the interactions between government and non-government actors are regulated by legal frameworks, their agendas, ideologies, resources, skills and behaviours cannot be fully controlled that way. In London, we find some empirical support for the presence of the ‘preferential attachment’ mechanism (see Table 1 and, for example, eigenvector centrality scores in Table 5). Once TfL managed to position itself as the key ‘political entity’ in the transport sector, the effects of this self-organising property of networks may be contributing to cementing this role and thus the overall centralised structure of governance in the city. Conversely, in NYC, our evidence suggests that a key mechanism shaping the structure of the network may be “multiplexity.” Actors seem to be highly connected within their stakeholder type (e.g., advocacy groups) but less so across cliques, which can influence patterns of collaboration (Siciliano, Wang and Medina 2021a). Once again, these findings should be stress-tested through further research. And, even if confirmed, the issue of causality remains, e.g.,: is TfL central because it is popular or because of its attributes? Are activists in NYC highly connected because they are similar ideologically or because they cannot access other interlocutors?
Actors such as the Mayor of London and the Governor of NY do not need to be highly engrained (in the sense of being able to reach or being reached by many actors) in the networks to be highly influential. In fact, if there are no alternative sources for the governance resources they control, they may increase their power by limiting their connections (Neal 2011). Networked governance does not necessarily open the door to the meaningful engagement or influence of new kinds of actors. It can, however, confer prestige and political capital to actors lacking strong legal mandates – e.g., the case of TfL in London but also the RPA in NYC. Finally, it is also worth noting that the network positions of actors are expected to shift if we zoom in at the level of particular projects (for which both the objectives of the relevant stakeholders and the specific legal requirements shaping interactions tend to change more abruptly than at the strategic level).
Using questions focused on transport strategies that target different types of exchanges (see the Appendix) helps us to hold an open-minded stance towards who the governors are and what resources are important for governing. This exploratory study responds to recent calls for more “hybrid” approaches to governance research, bridging disciplines and admitting both comparison and narrative (Richardson, Durose and Perry 2019). Our interview-based approach allows us to be conscious of local context as well as to investigate network governance arrangements systematically across cities or sectors. This work can help develop new research questions or hypotheses based on revealed instead of purely institutional power structures.
Conclusion
This paper contributes to the empirical urban governance research agenda. It tests the usefulness of interview-based, snowball sampling SNA as a tool for comparative analysis while also presenting findings that advance current discussions about how governance works in cities. Mapping out governance structures, especially with regards to complex and cross-cutting issues such as transport, has always been a challenge for researchers. Despite some obvious limitations, the approach has the advantage of not presupposing the membership and/or centrality of particular actors (whether public, private or civic) in the urban governance network and of allowing for empirically driven theorisation efforts – which are welcome in the field (da Cruz, Rode and McQuarrie 2019; Pierre 2014). We argue that an interview-based SNA approach is an effective way to empirically validate certain conjectures (e.g., the intuitions of practitioners) and/or challenge preconceptions about who the powerful actors are.
For example, during our interviews in London, many respondents asserted that the Mayor of London is relatively weak and referred to NYC as a model of a powerful Mayor. Our results challenge this view. While, institutionally, the Mayor of NYC has more taxation powers and oversight over more policy sectors, he/she is under significant influence from the state Governor. The Mayor of London has considerably more autonomy over transport strategies, policy and investments (and, possibly, over the other devolved sectors as well). The findings also challenge the general view that the importance of governmental actors in urban governance is diminishing (Klijn and Koppenjan 2016). This does not mean the “network lens” is unwarranted. Formal institutional analysis may not capture informal dynamics that are crucial to explain why, in a particular city, certain kinds of political interests and choices are easier to adopt than others (Pierre 2011).
The analysis revealed that both cities exhibit very different transport governance networks: in NYC, it is more fragmented and different levels of government – federal, state and city – and different types of stakeholders shape a multi-layered, complex and sometimes dysfunctional institutional landscape. In London, the metropolitan transport authority, TfL, emerges as a hyper-relational, technocratic bureaucracy, able to forge relationships with various constituencies – from cycling advocacy groups to business organisations. The dominant position of this actor may allow for a more efficient and effective management of various aspects of transport policy in London. But its irreproachable status may also be an indication of technocratic management having the edge over democratic deliberation (Davies 2011).
Our findings also show that some actors can indeed achieve high centrality due to their strong mandates without having to rely on vast ego networks or assume brokerage roles (e.g., the Mayor of London and the Governor of NY). The same would be expected for actors controlling funding for capital investments. However, the influence of the Treasury in London and of FTA in NYC seems to be less widespread. In London, the track record of TfL and the ability that this agency has to develop strong business cases with the backing of important lobbies makes it politically difficult for the Treasury to counter its initiatives. In NYC, the FTA struggles to find a clear interlocutor.
This exploratory study shows that – alongside legal frameworks, access to resources and representative politics – the composition and structure of urban governance networks may help explain differences in policy priorities and even outcomes in cities. Although we are not able to make causal claims between these variables based on the interview data, the resulting descriptive statistics on the two city networks add an important layer to the academic discussion of the complexity of studying metropolitan governance. Our network approach does not negate the effects of hierarchies and market forces (Davies 2011), nor does it allow us to quantify how far exactly the network features are responsible for determining policy decisions – but it formalises and brings to the fore yet another system through which urban policy processes may be shaped. In answering questions around who the influential actors are and how they achieve this status, this research points to important follow-up questions about soft power, actors’ strategies, and possible network interventions. Experimenting with the use of qualitative interviews and no pre-defined network boundary in SNA studies allows to embrace nuance and complexity of policy domains like transport in a way that other frameworks, though more comprehensive and/or analytically more powerful, can fall short (Jones 2018).
With regards to the limitations of our study, it is worth highlighting that the related data collection and coding are extremely resource-intensive tasks. This limits the possibilities of the approach for comparative urban research, especially multi-city or multi-sector analyses. Given the resource limitations, we had to focus on one policy-sector and were not able to interview all actors present in the networks (derived through snowball sampling). In fact, it would be virtually impossible to meet with all individuals and representatives of organisations named during the interviews. To conduct more robust (and data demanding) quantitative analyses, the approach reported here would ideally be followed by a more targeted exercise that makes use of a roster and interviews or surveys all people/organisations on that roster (e.g., similar to what Galaskiewicz did in the Twin Cities, Galaskiewicz 1985). SNA approaches based on qualitative interviews and snowball sampling are not, therefore, better than others relying on archival data or surveys. In fact, this type of mixed-method approach to studies of networks is likely more suitable for exploratory research (Noack and Schmidt 2013). However, when complemented with other types of data and methods, they can contribute to a fuller picture of how governance works in particular cities.
Finally, our analysis does not account for changes in network structure over time. This represents an interesting avenue for future research, for instance highlighting how institutional reforms or external shocks (such as a pandemic) impact on the relationships and positions of different actors – in particular the most central ones – within urban governance networks. Still, many aspects of the cross-sectional data collected can also be explored in the future, for example: mining the qualitative statements made by the respondents and adopting different network boundaries (e.g., different clusters of questions).
More than purely academic, inquiries into urban governance patterns have real-world stakes. Given the ever-increasing importance of cities and metropolitan areas across the globe, we ought to devise a clear understanding of how they work. How should we regard the renewed calls for devolution? Are metropolitan institutions equipped to deal with the global challenges that lie ahead? These questions are not only relevant to the cities of the Global North. In fact, they may even be more crucial to the fastest-growing urban areas of the South.
Footnotes
Acknowledgements
The authors acknowledge the support of the New Urban Governance project by LSE Cities at the London School of Economics and the John D. and Catherine T. MacArthur Foundation. We would also like to thank all the individuals that accepted to be interviewed for this research. Lastly, we are indebted to the anonymous reviewers and the Editor. Their detailed comments were invaluable to us and helped us to improve the contributions this work makes to the literature on urban governance. Any findings, interpretations and conclusions presented in this article are entirely those of the authors.
Declaration of Conflicting Interests
The author(s) declared no potential conflicts of interest with respect to the research, authorship, and/or publication of this article.
Funding
The author(s) disclosed receipt of the following financial support for the research, authorship, and/or publication of this article: This work was supported by the John D. and Catherine T. MacArthur Foundation, (grant number 105746).