
Abstract
Preventable hospitalizations are common and costly events that burden patients and our health care system. While research suggests that these events are strongly linked to ambulatory care access, emerging evidence suggests they may also be sensitive to a patient’s social, environmental, and economic conditions. This study examines the association between variations in social vulnerability and preventable hospitalization rates. We conducted a cross-sectional analysis of county-level preventable hospitalization rates for 33 states linked with data from the 2020 Social Vulnerability Index (SVI). Preventable hospitalizations were 40% higher in the most vulnerable counties compared with the least vulnerable. Adjusted regression results confirm the strong relationship between social vulnerability and preventable hospitalizations. Our results suggest wide variation in community-level preventable hospitalization rates, with robust evidence that variation is strongly related to a community’s social vulnerability. The human toll, societal cost, and preventability of these hospitalizations make understanding and mitigating these inequities a national priority.
Introduction
Preventable hospitalizations in the United States are costly and common events that place a substantial burden on both the patients that experience hospitalization and the health care system (Weiss & Jiang, 2006). Preventable hospitalizations have been defined as hospital admissions for acute or chronic illnesses that may not have required hospitalization had these conditions been managed successfully by primary care providers in outpatient settings (Moy et al., 2013). A recent Agency for Healthcare Research and Quality publication identified approximately 3.6 million preventable hospitalizations, accounting for more than $34 billion in aggregate costs (McDermott & Jiang, 2020). The most common categories of preventable hospitalizations in adults were heart failure, chronic obstructive pulmonary disease, diabetes, and community-acquired pneumonia; asthma was the most common category of pediatric preventable hospitalization (McDermott & Jiang, 2020).
At an individual level, it may not be possible to avoid all preventable hospitalizations. However, at the population level, admission rates for visits categorized as preventable have been clearly linked to access to care (Bindman et al., 1995), including specialist physicians and state-level Medicaid Expansion under the Afordable Care Act (Johnston et al., 2019; Wen et al., 2019). Emerging research (Hale et al., 2016) suggests that rates of preventable hospitalizations may also be sensitive to a patient’s social, environmental, and economic conditions, including community-level socioeconomic conditions (Falster et al., 2015; Hale et al., 2016; Moy et al., 2013). A recent study by Weeks et al. (2018) found higher rates of preventable hospitalizations among Medicare patients in economically distressed communities (Weeks et al., 2018). Preventable pediatric hospitalizations have also been linked to income inequality and growing community-level deprivation in a geographic area (Bettenhausen et al., 2017; Hale et al., 2016). Variations in community socioeconomic and demographic characteristics may exacerbate geographic inequities in preventable hospitalization rates.
The conceptual linkage between an individual’s socioeconomic characteristics and their risk for a preventable hospitalization is somewhat straightforward. Individuals living in socially vulnerable communities are more likely to face geographic barriers in accessing care and have lower quality of care, in addition to the risks associated with poor social, environmental, and economic conditions (Falster et al., 2015; Hale et al., 2016; Zhang et al., 2022). For example, an individual who lacks economic resources may face difficulty or delay in receiving effective clinical care that can result in otherwise avoidable hospitalizations for both chronic and acute health care needs (Billings et al., 1996). Extending that relationship across a population, a low-income community may face area-level shortages of providers that could have separate impacts on the likelihood of preventable hospitalizations for individuals in that community. Indeed, community income level has been shown to correlate with preventable hospitalization rates (Jiang et al., 2011). Relationships between the area-level factors, such as health care access or income, have been explored, but there is less evidence available surrounding an area’s broader social needs and its preventable hospitalization rates.
Evolving evidence on the significant impact of the social determinants of health on population health outcomes (Braveman & Gottlieb, 2014; Marmot & Wilkinson, 2005) has increased health care sector awareness of the critical importance of addressing social determinants in their patient populations. Yet the literature surrounding preventable hospitalizations has largely focused on simple relationships and single indicators—whether individual or community level. Current research suggests that an index (Grabovschi et al., 2013) may better capture the intersection of factors that can weaken the ability of a community to respond to adverse conditions, compared with measuring each factor alone. For example, community-level social vulnerability has previously been linked to frailty and obesity (An & Xiang, 2015; Gay et al., 2016) for individual patients and higher rates of unplanned surgical procedures (Zhang et al., 2022).
New Contribution
Increasing levels of social vulnerability may place communities at higher risk for a range of adverse health events. This study examines the association between variation in social vulnerability and preventable hospitalization rates at a county level, using the Social Vulnerability Index (SVI) to combine multiple community-level indicators of socioeconomic, demographic, and infrastructure characteristics to provide a summary of community risk for poor outcomes Understanding population-level risk for preventable hospitalizations can help providers and policymakers identify high-risk geographic areas where additional health and social resources may have an outsized impact on outcomes. Based on previous studies (An & Xiang, 2015; Zhang et al., 2022), we hypothesize that communities with greater social vulnerability will experience more preventable hospitalizations than their counterparts with lower rankings.
Methods
Design and Data Source
Our cross-sectional study uses county-level data from the 2020 Healthcare Cost and Utilization Project (HCUPnet) online query system [“HCUP State Inpatient Databases (SID). Healthcare Cost and Utilization Project (HCUP) 2005–2009,” 2021] linked with 2020 county-level social vulnerability rankings from the Centers for Disease Control and Prevention (CDC) and the Agency for Toxic Substances and Disease Registry Social Vulnerability Index (“Social Determinants of Health Database,” 2022). HCUP offers the largest collection of longitudinal hospital service delivery data in the United States and contains comprehensive information on hospital discharges for all payers [“HCUP State Inpatient Databases (SID). Healthcare Cost and Utilization Project (HCUP) 2005–2009,” 2021]. We included data on all adult preventable hospitalizations in 33 states (AK, AR, AZ, CA, CO, DE, FL, GA, HI, IA, KY, LA, MA, MD, MI, MN, MS, NC, NE, NJ, NM, NV, OR, PA, RI, SC, SD, TX, UT, VT, WA, WI, WV, and WY). These states were selected based on their availability in the HCUPnet system.
Measures
Preventable Hospitalizations
Our primary outcome measures were county-level preventable hospitalization rates per 100,000 population for ages 18 years and older in the county for the year 2020. Preventable hospitalizations are inpatient stays that, in theory, could have been avoided, through better access to and use of quality outpatient care earlier in the disease course (Bindman et al., 1995; McDermott & Jiang, 2020; Torio & Andrews, 2014). Initially identified through a consensus panel process including both clinician and health services researcher input, preventable hospitalizations have been used to identify community-level issues related to access to care, quality of services, and unmet needs (Agency for Healthcare Research and Quality, 2006). We extracted four preventable hospitalization rates for each county from HCUPnet: an overall composite rate for all preventable hospitalizations and three separate rates specific to preventable acute, chronic, and diabetes-related hospitalizations. We limited our sample to those counties with complete data across all four preventable hospitalization measures. Our final study sample included counties in the 33 states for a total of 1,772 counties. Table 1 shows the conditions included in each preventable hospitalization measure.
Hospitalizations Included in Preventable Hospitalization Measures.
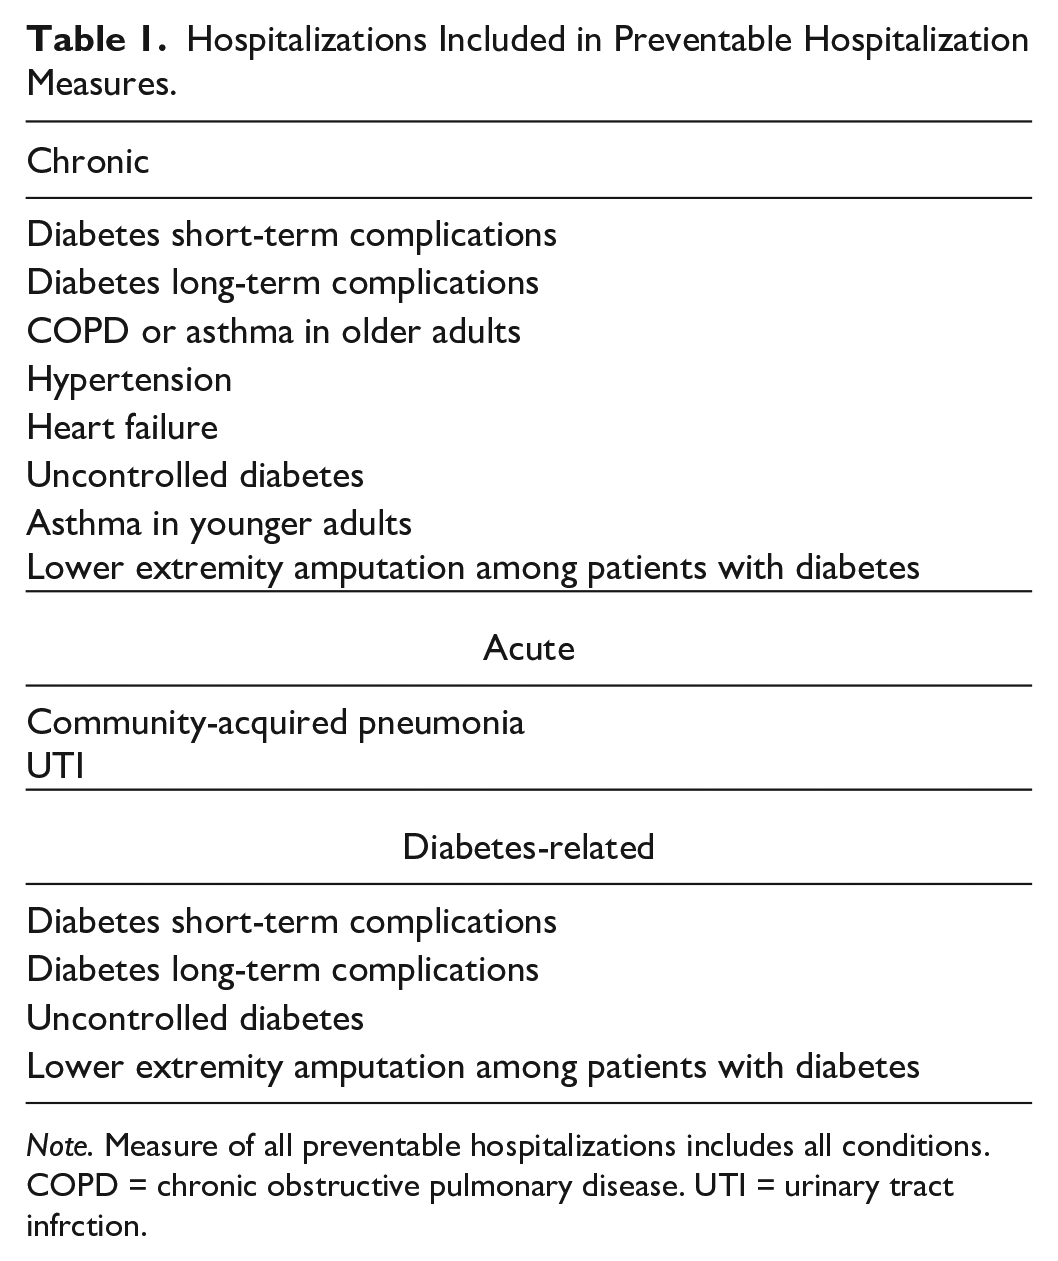
Note. Measure of all preventable hospitalizations includes all conditions. COPD = chronic obstructive pulmonary disease. UTI = urinary tract infrction.
Social Vulnerability Index
Our primary predictor measure was a county’s SVI. The SVI was created by the Geospatial Research, Analysis, and Services Program at the CDC and the Agency for Toxic Substances and Disease Registry in response to the Pandemic and All-Hazards Preparedness Act of 2006 (Agency for Toxic Substances and Disease Registry, 2022) in part to identify communities that may need relatively more support before, during, or after a public health emergency response (Hallisey et al., n.d.). The index includes 16 factors derived from the American Community Survey grouped into 4 themes: socioeconomic status, household composition and disability, minority status and language, and housing types and transportation (Figure 1) (Bakkensen et al., 2017). We hypothesized that the SVI could serve as an important measure of an area’s overall capacity for providing the non-clinical supports that can help determine whether an individual and their primary care provider are able to successfully manage a health care need in an outpatient setting. For example, a patient in an area with poor housing and transportation resources (one of four SVI theme areas) may face more barriers to managing health care needs in outpatient settings, even with insurance or sufficient physician supply.
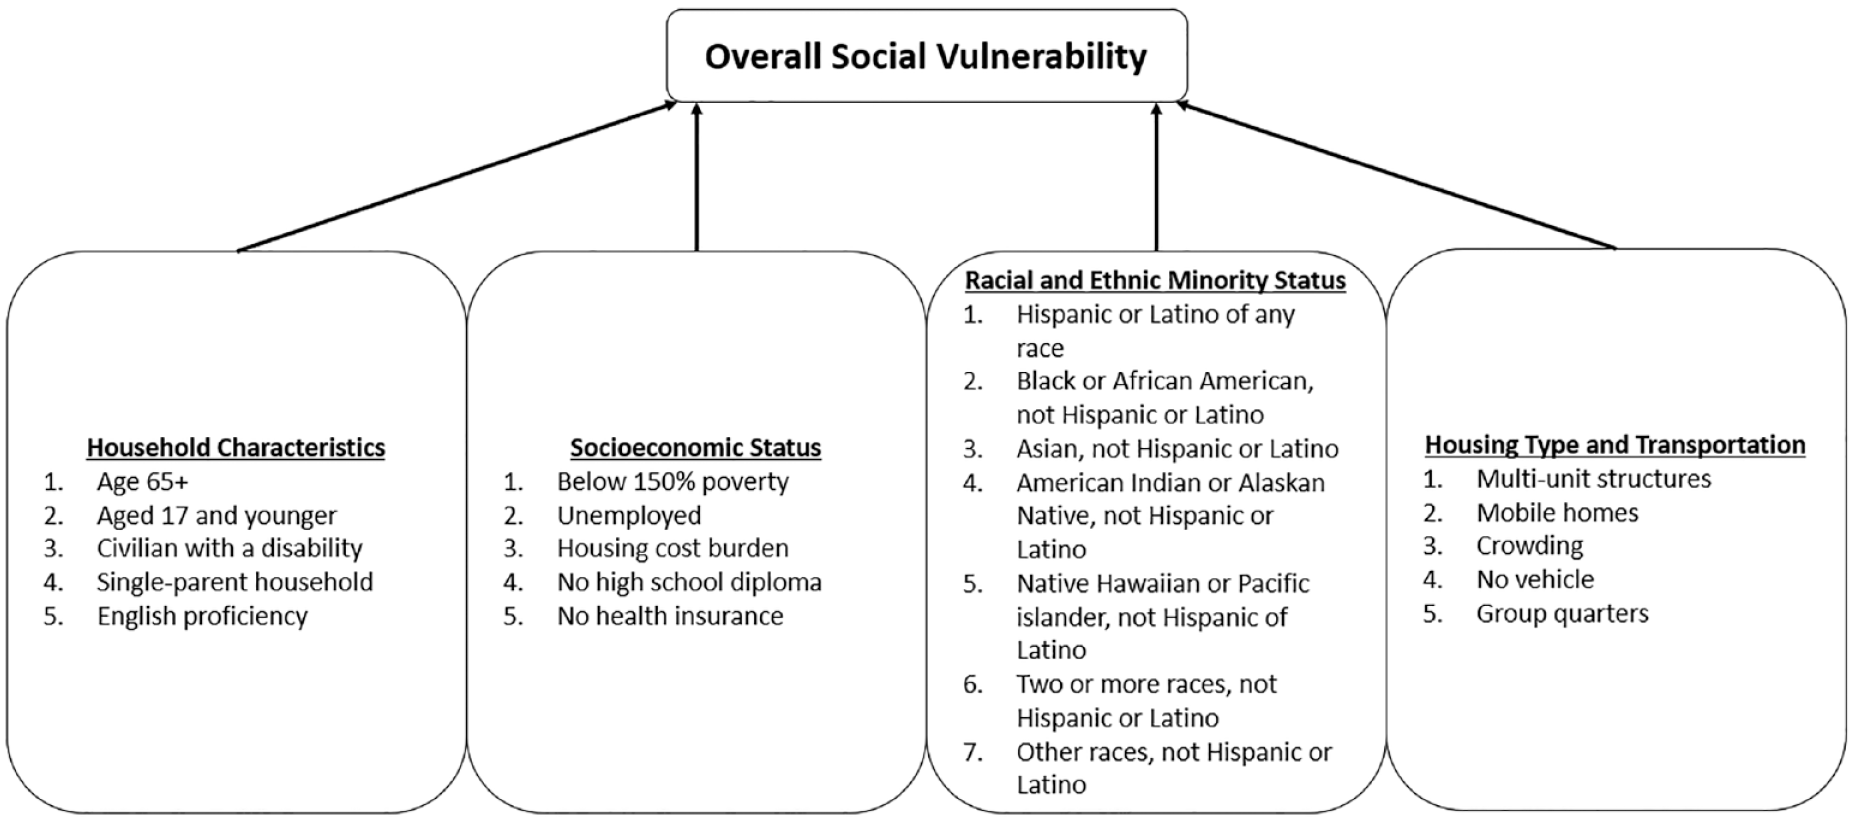
Measures Included in the SVI.
The index is measured at both the census tract and the county level. Communities are assigned an overall SVI ranking using the summed ranking of the individual variables to generate community-level percentile rankings. We use the 2020 national SVI data, which were estimated using the 2016 to 2020 American Community Survey data. Rankings are assigned relative to other counties across the United States in the national estimates. For this analysis, we used the county data to facilitate a one-to-one linkage to preventable hospitalization rates. Following the methodology used by An and Xiang, we categorized counties in our sample into quartiles based on their overall SVI index ranking among all U.S. counties (An & Xiang, 2015).
Statistical Methods
We used multivariable linear regression models to examine the relationship between preventable hospitalizations and county-level vulnerability as measured by the SVI quartile. We include state-level fixed effects to adjust for differences in levels of preventable hospitalizations across states. These differences could be due to observable and unobservable factors affecting level differences across states. For example, states with more generous Medicaid policies are likely to have lower uninsured rates, thereby increasing access to care and financial stability. Furthermore, including the state effects allows us to focus on our key source of variation—county-level differences in adverse social conditions and their relationship with preventable hospitalizations. In all our regression models, we include the following additional controls for health care supply: the total number of primary care physicians per 100,000 population and the total number of hospital beds per 100,000 population. Areas with limited health care supply have been found to be at higher risk of both preventable hospitalizations and preventable mortality from heart disease and pulmonary conditions (i.e., COPD, asthma) (Johnston et al., 2019). We also controlled for population density to account for any differences in preventable hospitalization rates based on population size. All descriptive statistics and regression models were weighted using the county’s population size.
We ran a set of additional models to determine if our results were influenced by counties with small population sizes. Preventable hospitalization rates in small counties could be less precise because of the population size (Malec, 2005). While previous analyses of county-level preventable hospitalization rates excluded counties with populations less than 1,000, we excluded counties of 2,000 or less to be conservative (Epstein, 2001; Laditka et al., 2009; Probst et al., 2009). In light of the potential endogeneity of health care supply, we also compared results with and without supply variables.
Results
We found substantial variation in county-level SVI across the study sample (Figure 2). States in the Southeast and Southwest included more socially vulnerable counties than those in the Midwest, Northeast, and Northwest. Preventable hospitalization rates were lowest in the least vulnerable counties and highest in the most vulnerable (Table 2). The average rate of all preventable hospitalizations was 40% higher in the most vulnerable counties (1,136.4 per 100,000) compared with the least vulnerable (756.5 per 100,000) (p<.05). Preventable chronic hospitalizations and diabetes-related hospitalizations followed a similar pattern with the lowest rates observed in the least vulnerable counties and highest rates in the most vulnerable counties. Preventable hospitalizations for chronic conditions were 46% higher in the most vulnerable counties, while diabetes-related preventable hospitalizations were 60% higher.
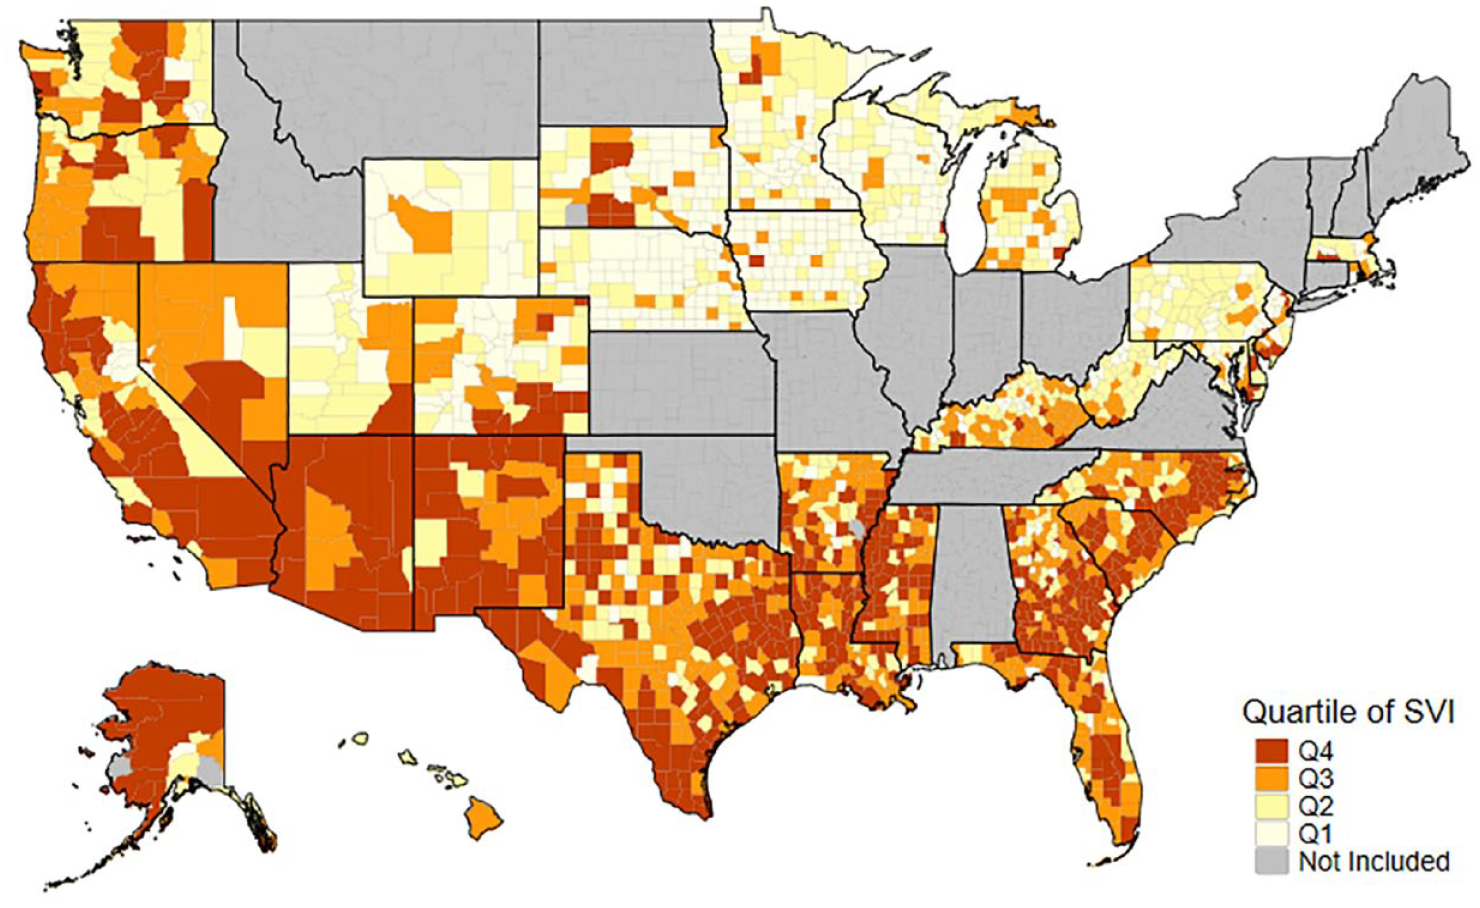
Between State Variation in County-Level SVI.
Preventable Hospitalization Rates by Community-Level Social Vulnerability Distribution Per 100,000.
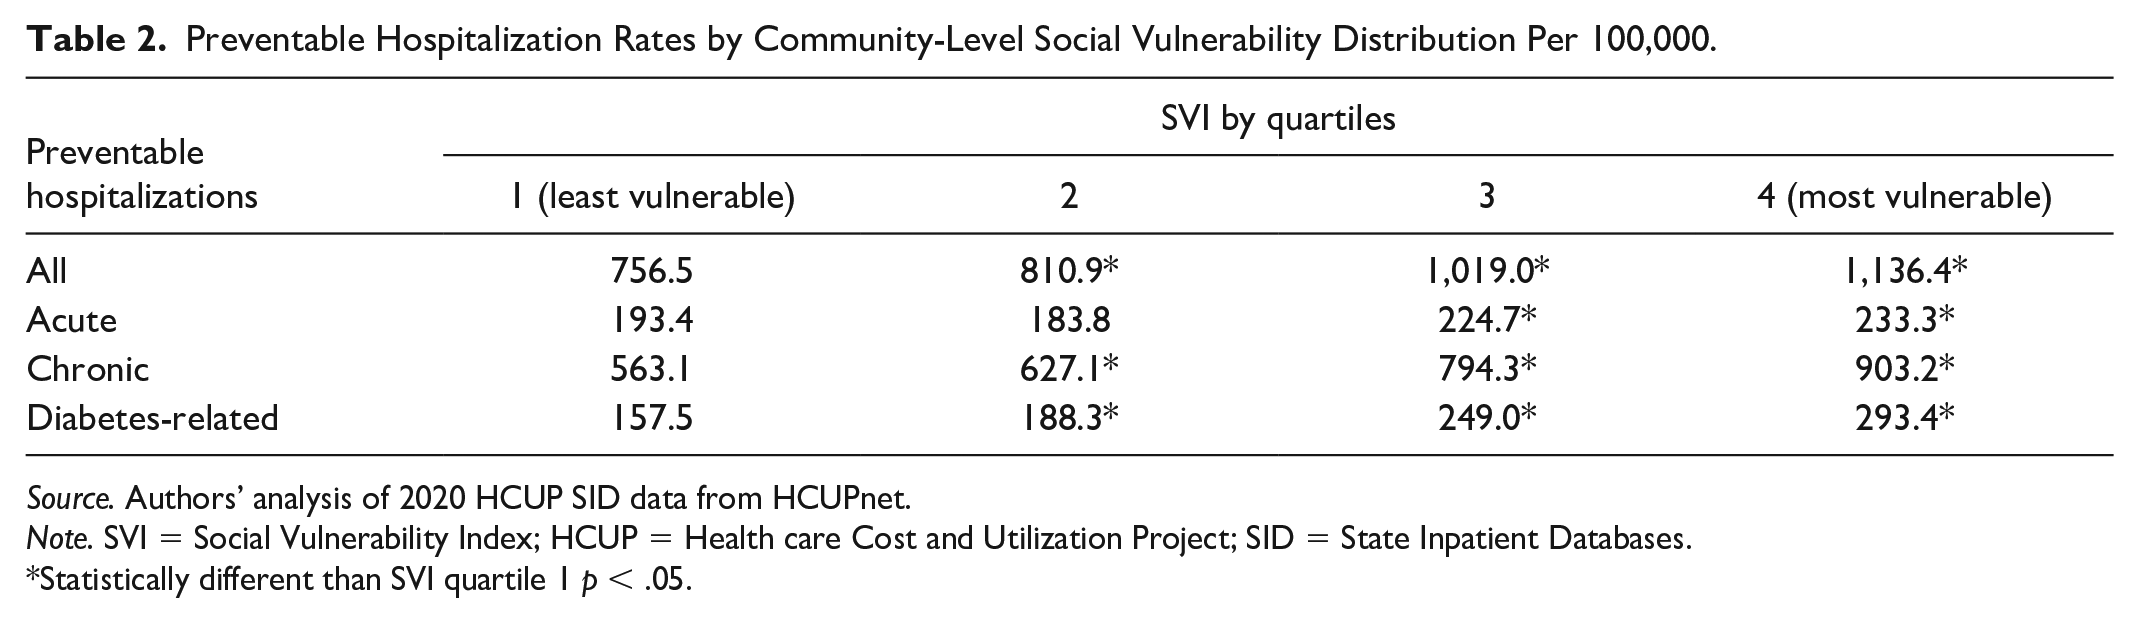
Source. Authors’ analysis of 2020 HCUP SID data from HCUPnet.
Note. SVI = Social Vulnerability Index; HCUP = Health care Cost and Utilization Project; SID = State Inpatient Databases.
Statistically different than SVI quartile 1 p < .05.
Adjusted regression results confirm that the strong relationship between increased SVI quartile and county-level preventable hospitalization rates persisted after accounting for a county’s health care supply, population, and state-level effects (Table 3). The most vulnerable counties (SVI quartile 4) experienced 375.4 more preventable hospitalizations per 100,000 compared with counties with the lowest level of vulnerability (SVI quartile 1; 756.5 per 100,000). We found a similar pattern across SVI quartiles in models examining chronic and diabetes-related preventable hospitalizations. Compared with counties with the lowest level of vulnerability counties (SVI quartile 1), counties with the highest level of social vulnerability experienced an additional 345.2 and 127.2 preventable chronic and diabetes-related hospitalizations, respectively, per 100,000.
Association Between County-Level Social Vulnerability and Preventable Hospitalizations Rates per 100,000, 2020.
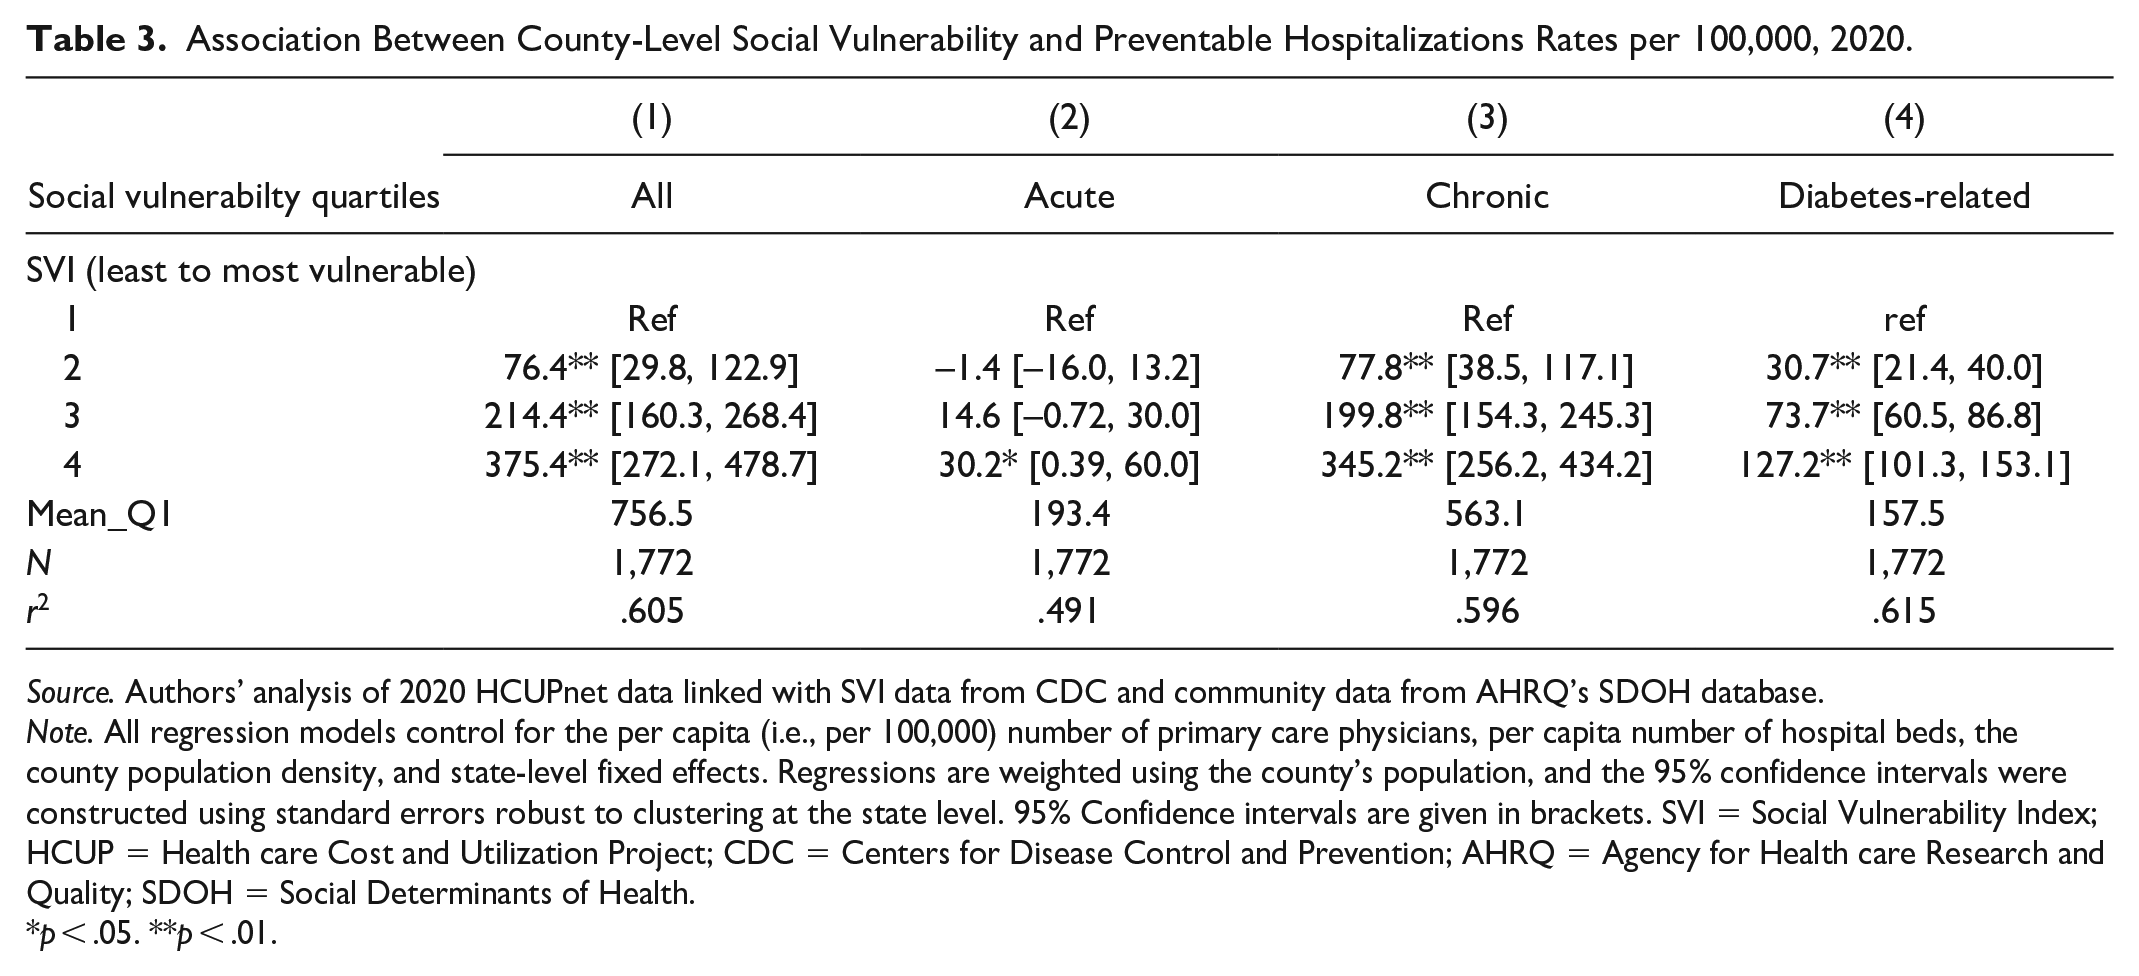
Source. Authors’ analysis of 2020 HCUPnet data linked with SVI data from CDC and community data from AHRQ’s SDOH database.
Note. All regression models control for the per capita (i.e., per 100,000) number of primary care physicians, per capita number of hospital beds, the county population density, and state-level fixed effects. Regressions are weighted using the county’s population, and the 95% confidence intervals were constructed using standard errors robust to clustering at the state level. 95% Confidence intervals are given in brackets. SVI = Social Vulnerability Index; HCUP = Health care Cost and Utilization Project; CDC = Centers for Disease Control and Prevention; AHRQ = Agency for Health care Research and Quality; SDOH = Social Determinants of Health.
p < .05. **p < .01.
Results from our sensitivity analyses suggest our findings are robust to the inclusion of small communities in our sample. Results did not change substantially when we excluded counties with populations less than 1,000 (n = 8) or 2,000 (n = 36) (see Supplemental Tables S1–S4). In fact, we found that small counties made up a very small portion of our sample. This underrepresentation is likely due to data suppression that occurs in HCUPnet. Results from our analysis including and excluding health care supply variables showed that, while the size of coefficients increased slightly, the significance level and direction of the relationship between SVI quartiles and preventable hospitalization rates did not (see Supplemental Table S5).
Discussion
Our cross-sectional analysis highlights the wide variation in county-level rates of preventable hospitalizations based on community social vulnerability. The human and societal cost of this extraordinary gap between the most healthy (lowest preventable hospitalization rate) and least healthy (highest preventable hospitalization rate) counties is staggering. The most vulnerable counties saw roughly 1,100 preventable hospitalizations per 100,000 population per year versus just under 750 preventable hospitalizations in the least vulnerable counties. An additional 350 hospitalizations that would have been potentially prevented suggests a meaningful disparity that carries commensurate societal costs. These additional hospitalizations carry a financial cost as well. McDermott and Jiang estimate potentially preventable hospitalizations have a mean cost per stay of $9,500 (McDermott & Jiang, 2020), suggesting an added financial burden for preventable hospitalizations of roughly $3.5 million per 100,000 population in the most vulnerable counties compared with the least vulnerable. Understanding and mitigating these stark gaps must be a national priority.
Previous literature has emphasized the link between preventable hospitalizations and access to ambulatory care, suggesting that the solution to suboptimal health care use is more health care providers. The findings of this study align with similar studies linking community socioeconomic status and deprivation to higher preventable hospitalization rates (Falster et al., 2015; Hale et al., 2016; Weeks et al., 2018). Taken together, these results suggest that solutions are far more complex and include addressing the broader determinants of health. This finding aligns with recent work by McCullough and Curwick (2020) that linked lower preventable hospitalization rates to higher social services and public health spending (McCullough & Curwick, 2020). Two important implications of our findings may warrant follow-on attention. First, given that social vulnerability is a complex construct incorporating multiple area-level characteristics, variance decomposition work to identify drivers of the observed association between SVI and preventable health care utilization may be warranted. Second, more directly for practitioners and policymakers, is the implication that, since area-level vulnerability is so strongly linked with preventable acute and chronic health care utilization, SVI or other measures must be more directly and centrally considered. If simply living in a community with higher social vulnerability might place patients at higher risk of health care utilization due to both acute and chronic conditions, additional strategies should be deployed to better care for these populations.
Our results are consistent with previous literature highlighting dramatic geographic disparities between life expectancy at birth (Venkataramani et al., 2021) and infant mortality (Wise, 2003). More recently, researchers have focused significant attention on the critical role of community factors in driving COVID-19 outcomes (Tan et al., 2020). Our results add to the growing body of research that suggests our nation’s underinvestment in social services is a critical factor driving disparities in health and health care. Strategies to address social determinants of health may be especially effective in reducing the health care disparities we highlight in this paper. While enthusiasm for “hot-spotting” as a strategy for primary health care is cooling (Finkelstein et al., 2020; Marcotte et al., 2019), that same strategy may prove more effective with broader interventions that address social vulnerability. Marcotte, Reddy, and Liao describe hot-spotting as having a “narrow scope” on smaller groups of specific patients (often high cost) (Marcotte et al., 2019). Our findings align with the evolving theory that addressing only individual social needs of patients may not be sufficient and that attention to broader, population-based social factors such as those measured by the SVI in our study may be essential (Castrucci & Auerbach, 2019). Our findings reiterate the impacts that upstream factors such as community-level social vulnerability can have on preventable health care utilization above and beyond the impacts of mid-stream factors such as individual-level social needs. Paying for and integrating upstream approaches into health care delivery is challenging but not impossible (McCullough, 2019; Nichols & Taylor, 2018).
Limitations
Several limitations should be taken into consideration with our study results. First, our analysis is cross-sectional, measuring the association between SVI and preventable hospitalization rates. There are likely additional unmeasured variables that impact both the number of preventable hospitalizations and social vulnerability of a county. For example, strong networks between health care and social services providers, for instance, may develop in some counties and not in others which may lead to improved social conditions and fewer preventable hospitalizations. Similarly, quality of primary care in a community is also likely to influence preventable hospitalization rates. Our analysis is exploratory, and the likelihood of endogeneity will require future exploration using additional methods to examine the relationship between social vulnerability and preventable hospitalizations.
Second, our analysis is limited to only those states with hospital discharge data available from HCUPnet. Although a subset of states, the 33 include representing geographically diverse regions across the United States. Our sample also included very few small communities (population less than 1,000). Last, our analysis does not explore the intersection between social vulnerability and other characteristics associated with health inequities. Future studies may wish to include additional data that examines additional variables related to both social vulnerability and preventable hospitalizations.
Conclusions
Preventable hospitalizations represent hospitalizations that should be relatively rare if our health care system, broadly defined, is functioning optimally. Preventable hospitalizations are also, by definition, partially amenable to intervention. The astounding variation in preventable hospitalizations, combined with their strong relationship to social vulnerability, suggests that our system is far from optimal. The prohibitive cost of preventable hospitalizations and the significant human toll they represent demand innovative approaches that better address social needs.
Supplemental Material
sj-docx-1-mcr-10.1177_10775587231197248 – Supplemental material for Association Between Community Social Vulnerability and Preventable Hospitalizations
Supplemental material, sj-docx-1-mcr-10.1177_10775587231197248 for Association Between Community Social Vulnerability and Preventable Hospitalizations by Rachel Hogg-Graham, Joseph A. Benitez, Mary E. Lacy, Joshua Bush, Juan Lang, Haritomane Nikolaou, Emily R. Clear, J. M. McCullough and Teresa M. Waters in Medical Care Research and Review
Footnotes
Declaration of Conflicting Interests
The author(s) declared no potential conflicts of interest with respect to the research, authorship, and/or publication of this article.
Funding
The author(s) disclosed receipt of the following financial support for the research, authorship, and/or publication of this article: This project was supported by grant number K01HS025494 from the Agency for Healthcare Research and Quality. The content is solely the responsibility of the authors and does not necessarily represent the official views of the Agency for Healthcare Research and Quality.
Supplemental Material
Supplemental material for this article is available online.
References
Supplementary Material
Please find the following supplemental material available below.
For Open Access articles published under a Creative Commons License, all supplemental material carries the same license as the article it is associated with.
For non-Open Access articles published, all supplemental material carries a non-exclusive license, and permission requests for re-use of supplemental material or any part of supplemental material shall be sent directly to the copyright owner as specified in the copyright notice associated with the article.