
Abstract
Multiple studies claim that public place smoking bans are associated with reductions in smoking-related hospitalization rates. No national study using complete hospitalization counts by area that accounts for contemporaneous controls including state cigarette taxes has been conducted. We examine the association between county-level smoking-related hospitalization rates and comprehensive smoking bans in 28 states from 2001 to 2008. Differences-in-differences analysis measures changes in hospitalization rates before versus after introducing bans in bars, restaurants, and workplaces, controlling for cigarette taxes, adjusting for local health and provider characteristics. Smoking bans were not associated with acute myocardial infarction or heart failure hospitalizations, but lowered pneumonia hospitalization rates for persons ages 60 to 74 years. Higher cigarette taxes were associated with lower heart failure hospitalizations for all ages and fewer pneumonia hospitalizations for adults aged 60 to 74. Previous studies may have overestimated the relation between smoking bans and hospitalizations and underestimated the effects of cigarette taxes.
Introduction
In the United States, 46,000 cardiovascular deaths per annum have been attributed to the adverse effects of secondhand smoke (U.S. Department of Health and Human Services, 2006). Given the known risks of smoking and the purported risks of secondhand smoke exposure to nonsmokers, policy makers have enacted legislation aimed at making smoking less convenient and reducing secondhand smoke exposure in public places, commonly through workplace and restaurant smoking bans. As of January 2014, comprehensive public place smoking bans covered 22,487 municipalities, with jurisdictions ranging from municipalities to states (American Nonsmokers Rights Foundation, 2014).
Studies of smoking bans have reported that they reduce smoking and secondhand smoke exposure (Akhtar, Currie, Currie, & Haw, 2007; Bauer et al., 2007; Haw & Gruer, 2007) and improved health outcomes. An Institute of Medicine study on secondhand smoke exposure reviewed studies that identified short-term reductions in heart attacks after the introduction of public place smoking bans. The report concluded that these studies “support an association between smoking bans and a decrease in the incidence of heart attacks” despite noting that the observed risk decreases ranged widely (from 6% to 47%) depending on the study and form of analysis (Institute of Medicine, 2010a).
Each of the studies the Institute of Medicine reviewed had at least one important limitation, such as a small study population, lack of a contemporaneous control population, or failure to account for the full range of factors that could influence hospitalizations for smoking-related conditions, such as increased cigarette taxes and local patient and health care market characteristics.
Two more recent studies have addressed many of the shortcomings of the earlier studies. Shetty, DeLeire, White, and Bhattacharya (2010) analyzed the Multiple Cause of Death database, Medicare data, and the Nationwide Inpatient Sample that included adults of all age groups from 1989 to 2004. The authors found that neither workplace smoking bans nor bans of any type produced short-term declines in hospital admissions or mortality for acute myocardial infarction (AMI) or chronic obstructive pulmonary disease (COPD). Their study compared trends in hospital admissions for areas with and without smoking bans across multiple regions of the country. But because their study included only a small subset of total hospitals from 12 years of a database that samples 20% of U.S. community hospitals each year, one cannot be certain whether their null findings were attributable to incomplete counts of hospitalizations in each area.
Another study by Vander Weg and colleagues analyzed Medicare claims data for persons ages 65 and older in counties across the United States with and without smoking bans from 1991 to 2008 (Vander Weg, Rosenthal, & Vaughan Sarrazin, 2012). Their study found significant reductions in hospitalization rates for AMI and COPD 36 months after smoking bans were imposed. However, Vander Weg et al. did not control for state cigarette tax rates. Between 2000 and 2005, 22 U.S. states raised cigarette taxes by at least 50 cents per pack, and the average increase of 68 cents per pack has been associated with a 4% to 5% reduction in smoking rates among adults ages 45 to 64 (DeCicca & McLeod, 2008). In addition, Vander Weg et al. (2012) only controlled for fixed differences in unobserved factors across U.S. states. This approach leaves open the possibility that unobserved fixed factors or trends in hospitalization rates across counties could explain their conclusions.
In this study, we use the State Inpatient Databases (SID) to conduct a rigorous evaluation of the effects of smoking bans and cigarette taxes on three important health conditions that are exacerbated by tobacco use: AMI, heart failure, and pneumonia (Almirall, González, Balanzó, & Bolíbar, 1999; Institute of Medicine, 2010b). The SID contains all inpatient discharges for patients of all ages, regardless of payer, from up to 47 participating states, translated into a standard format to facilitate state-to-state comparisons. We merged the SID with other data sources containing information on public place smoking bans, cigarette taxes, and local population and health care market characteristics. Analyzing this extensive data set permitted us to address the limitations of previous studies, providing a more complete understanding of public place smoking bans and their effects on hospitalizations for smoking-related conditions.
New Contribution
Our study possesses three important strengths. Unlike most previous studies of smoking bans, we measure the association between the implementation of smoking bans and hospitalization rates for hundreds of U.S. counties, rather than one or two areas, or a handful of regions. We employ an extensive set of covariates including cigarette tax rates, along with time and county fixed effects to control for factors that could confound the observed relationship between smoking bans and hospitalizations. This is the only study in the smoking bans literature that includes county-specific time trends, even though this approach has become the standard of practice for health economics studies over the past 15 years (Anger, Kvasnicka, & Siedler, 2011; DeCicca & McLeod, 2008; Dee, 1999; Finkelstein, 2007; Gruber & Yelowitz, 1999; Ruhm, 2000). Moreover, we measured the largest potential effects of smoking bans by comparing counties with no smoking bans to those that implemented comprehensive bans in bars, restaurants, and workplaces.
Method
Hospitalization Rates
We analyzed health outcomes using the Agency for Healthcare Research and Quality’s 2001-2008 State Inpatient Database, collected by the Healthcare Cost and Utilization Project (Agency for Healthcare Research and Quality, 2013). This study was conducted in collaboration with Agency for Healthcare Research and Quality. The project received institutional review board approval from Rice University. The dependent variable of interest was the hospitalization rate per 100,000 persons in a particular age category for each smoking-related condition in a county. We identified hospitalizations for adult patients (ages 18-59, 60-74, and 75+ years) due to AMI, heart failure, and pneumonia using International Classification of Diseases, Ninth Revision (ICD-9) codes, because previous studies had identified decreased admissions for each condition following the implementation of a smoking ban (see Appendix Table 1, available online at http://mcr.sagepub.com/content/by/supplemental-data; Carter et al., 2015; Institute of Medicine, 2010a; Naiman, Glaizer, & Moineddin, 2010). As a validity check for our analysis, we also identified hospitalizations for hip fracture, which are not likely to be influenced in the short term by smoking bans (Shetty et al., 2010; Vander Weg et al., 2012). Each patient discharge was matched to a county by patient’s zip code of residence, and hospitalization counts were determined for each condition and county for 6-month intervals (January to June; July to December) for the years 2001 through 2008. Discharge counts excluded records missing the patient’s zip code, transfer patients, and those admissions with a length of stay 1 day or less except those where the patient died in the hospital. County-level population counts from the U.S. Census served as the denominator to calculate hospitalization rates (U.S. Census Bureau, 2013)
Public Place Smoking Bans
Hospitalization rates were merged with information on smoking bans in effect for each city, county, and corresponding state during each 6-month time period. We identified locations with smoking bans using ordinance data from the American Nonsmokers Rights Foundation (2009). This nonprofit organization tracks the effective date of all smoke-free laws enacted by city, county, and state governments. Bans for municipalities were matched to counties, and all analyses were conducted at the county level. We compared counties that introduced comprehensive bans on smoking in restaurants, bars, and workplaces from 2001 to 2008 to counties that had introduced no bans at all during or before the study period. Counties with a comprehensive municipal ban were classified as counties without comprehensive bans if less than 10% of the county population was covered, and classified as counties with comprehensive bans if more than 75% of the population was covered. Counties with 10% to 75% of the population covered by comprehensive bans were excluded from analyses.
The SID contains hospital discharge data for at least some years between 2001 and 2008 for 41 states. We dropped four states that did not have data for at least four contiguous years. We excluded counties that implemented any bans prior to 2001 (e.g., counties in California), as well as counties where bans were enacted after 2001, but not for all three public places (work, restaurants, and bars). Five states remaining in the sample began reporting data to the SID after 2001. The final sample included counties in 26 states.
Population and County Characteristics
Following previous literature, we controlled for population and health care market characteristics that might also influence hospitalization rates. County-level measures of the percentage of the population male, White, and Black, mean household income, and the percentage of the population in poverty were drawn from the Area Health Resources File (He & Mellor, 2012). State-level measures of the percentage of the population who self-reported their health as good or better, reported physical activity in the past month, were overweight or obese, were told by a doctor that they had high cholesterol, or had high blood pressure were obtained from the Behavioral Risk Factor and Surveillance System (Centers for Disease Control and Prevention, 2013).
Past studies indicate that local availability of physicians and the number of hospitals or hospital beds are important predictors of hospital utilization (Courtemanche & Plotzke, 2010; Shetty et al., 2010; Vander Weg et al., 2012). Therefore, the number of active physicians and short-term general hospital beds per capita were obtained from the ARF. Given that insurance coverage through health maintenance organizations has been associated with reduced hospital use (Baker, 1997; Chernew, Decicca, & Town, 2008), analyses for hospitalizations for persons ages 18 to 59 years controlled for the percentage of the overall population in the county enrolled in a health maintenance organization (Managed Market Surveyor-Rx-HealthLeaders-InterStudy, 2010). Analyses for persons ages 60 years and older controlled for the percentage of Medicare beneficiaries enrolled in a Medicare Advantage program (Centers for Medicare and Medicaid Services, 2016a, 2016b). State cigarette taxes per pack were drawn from TaxFoundation.org (“State Sales, Gasoline,” 2016) and TobaccoFreeKids.org (“State Cigarette Excise Tax Rates & Rankings,” 2016).
Statistical Analysis
We used descriptive statistics to characterize counties where a comprehensive smoking ban was introduced during the sample period, compared with counties where no smoking bans were implemented through 2008. We then graphed hospitalization rates by smoking ban status to determine whether we could visually identify an effect of smoking bans on the conditions of interest. Although we included counties where smoking bans were implemented in 2001, the graphs limit the sample of counties with smoking bans to those introduced between 2003 and 2006, to visually compare trends in hospitalization rates before and after bans were introduced.
We applied regression analysis to test whether counties where a comprehensive public place smoking ban (restaurants, bars, and workplaces) was implemented between 2001 and 2008 experienced a decrease in hospitalization rates compared with counties where no ban was introduced. The explanatory variables of interest are an indicator variable for whether or not a comprehensive smoking ban is in place for the county in each period, as well as the cigarette tax in effect. Separate regressions were estimated for each of the three smoking-related health conditions by age group. In addition to controls for county health care market characteristics and county- and state-level population characteristics, the regressions include multiple fixed effects. These variables include fixed effects for each 6-month period in the sample, county fixed effects, and interactions of a linear time trend with each county fixed effect. Inclusion of these fixed effects and interactions controls for potential systematic trends in hospital admission rates across counties that may have coincided with the introduction of smoking regulations. With the inclusion of county fixed effects, the cigarette tax variable measures the association between within-state changes in taxes and hospitalization rates.
The regressions also controlled for seasonality, because hospitalization rates tend to be lower in the second half of the year versus the first half. Seasonality was removed by regressing each hospitalization rate on a set of 0/1 indicator variables for observations from the second half of the year. The residuals form each regression added to the mean of the respective hospitalization rate served as the dependent variable for the appropriate regression (Johnston & DiNardo, 1984). The regressions were estimated using Stata 13 (Stata-Corp, College Station, TX). Standard errors were adjusted to account for correlation in the error terms within counties, and the regressions were population-weighted.
Results
A total of 390 counties (in 12 states) introduced comprehensive public place smoking bans from 2001 to 2008, and 1,511 counties (in 14 states) did not introduce any smoking bans. Twelve of the bans were county level (one ban also at city level), and state-level bans affected an additional 377 counties. We excluded areas that implemented bans prior to 2001 or that did not implement comprehensive bans.
Table 1 compares counties where a comprehensive smoking ban was enacted in 2001 to 2008 with counties that never enacted one. The average population in counties that introduced a comprehensive ban was more than twice as large for all age groups relative to counties that never introduced a ban. The cigarette tax rate increase was higher in 2001 for counties that introduced a comprehensive ban (68 vs. 25 cents per pack), and the increase in the tax per pack from 2001 to 2008 was greater for counties where a comprehensive ban was introduced (63 cents vs. 50 cents per pack). Mean health status for counties that did and did not enact comprehensive bans appeared similar, although the percentage of the Black population in states that introduced bans was almost half the rate in states that never introduced a ban. Changes in population characteristics between 2001 and 2008 were relatively similar between counties that did or did not impose smoking bans. However, the number of hospital beds per capita and the share of persons enrolled in HMOs declined in counties that imposed smoking bans: while these figures rose slightly in counties that did not introduce bans.
Characteristics of U.S. Counties in 2001 and 2008 That Were Ever or Never Affected by a Comprehensive Smoking Ban During 2001 to 2008.
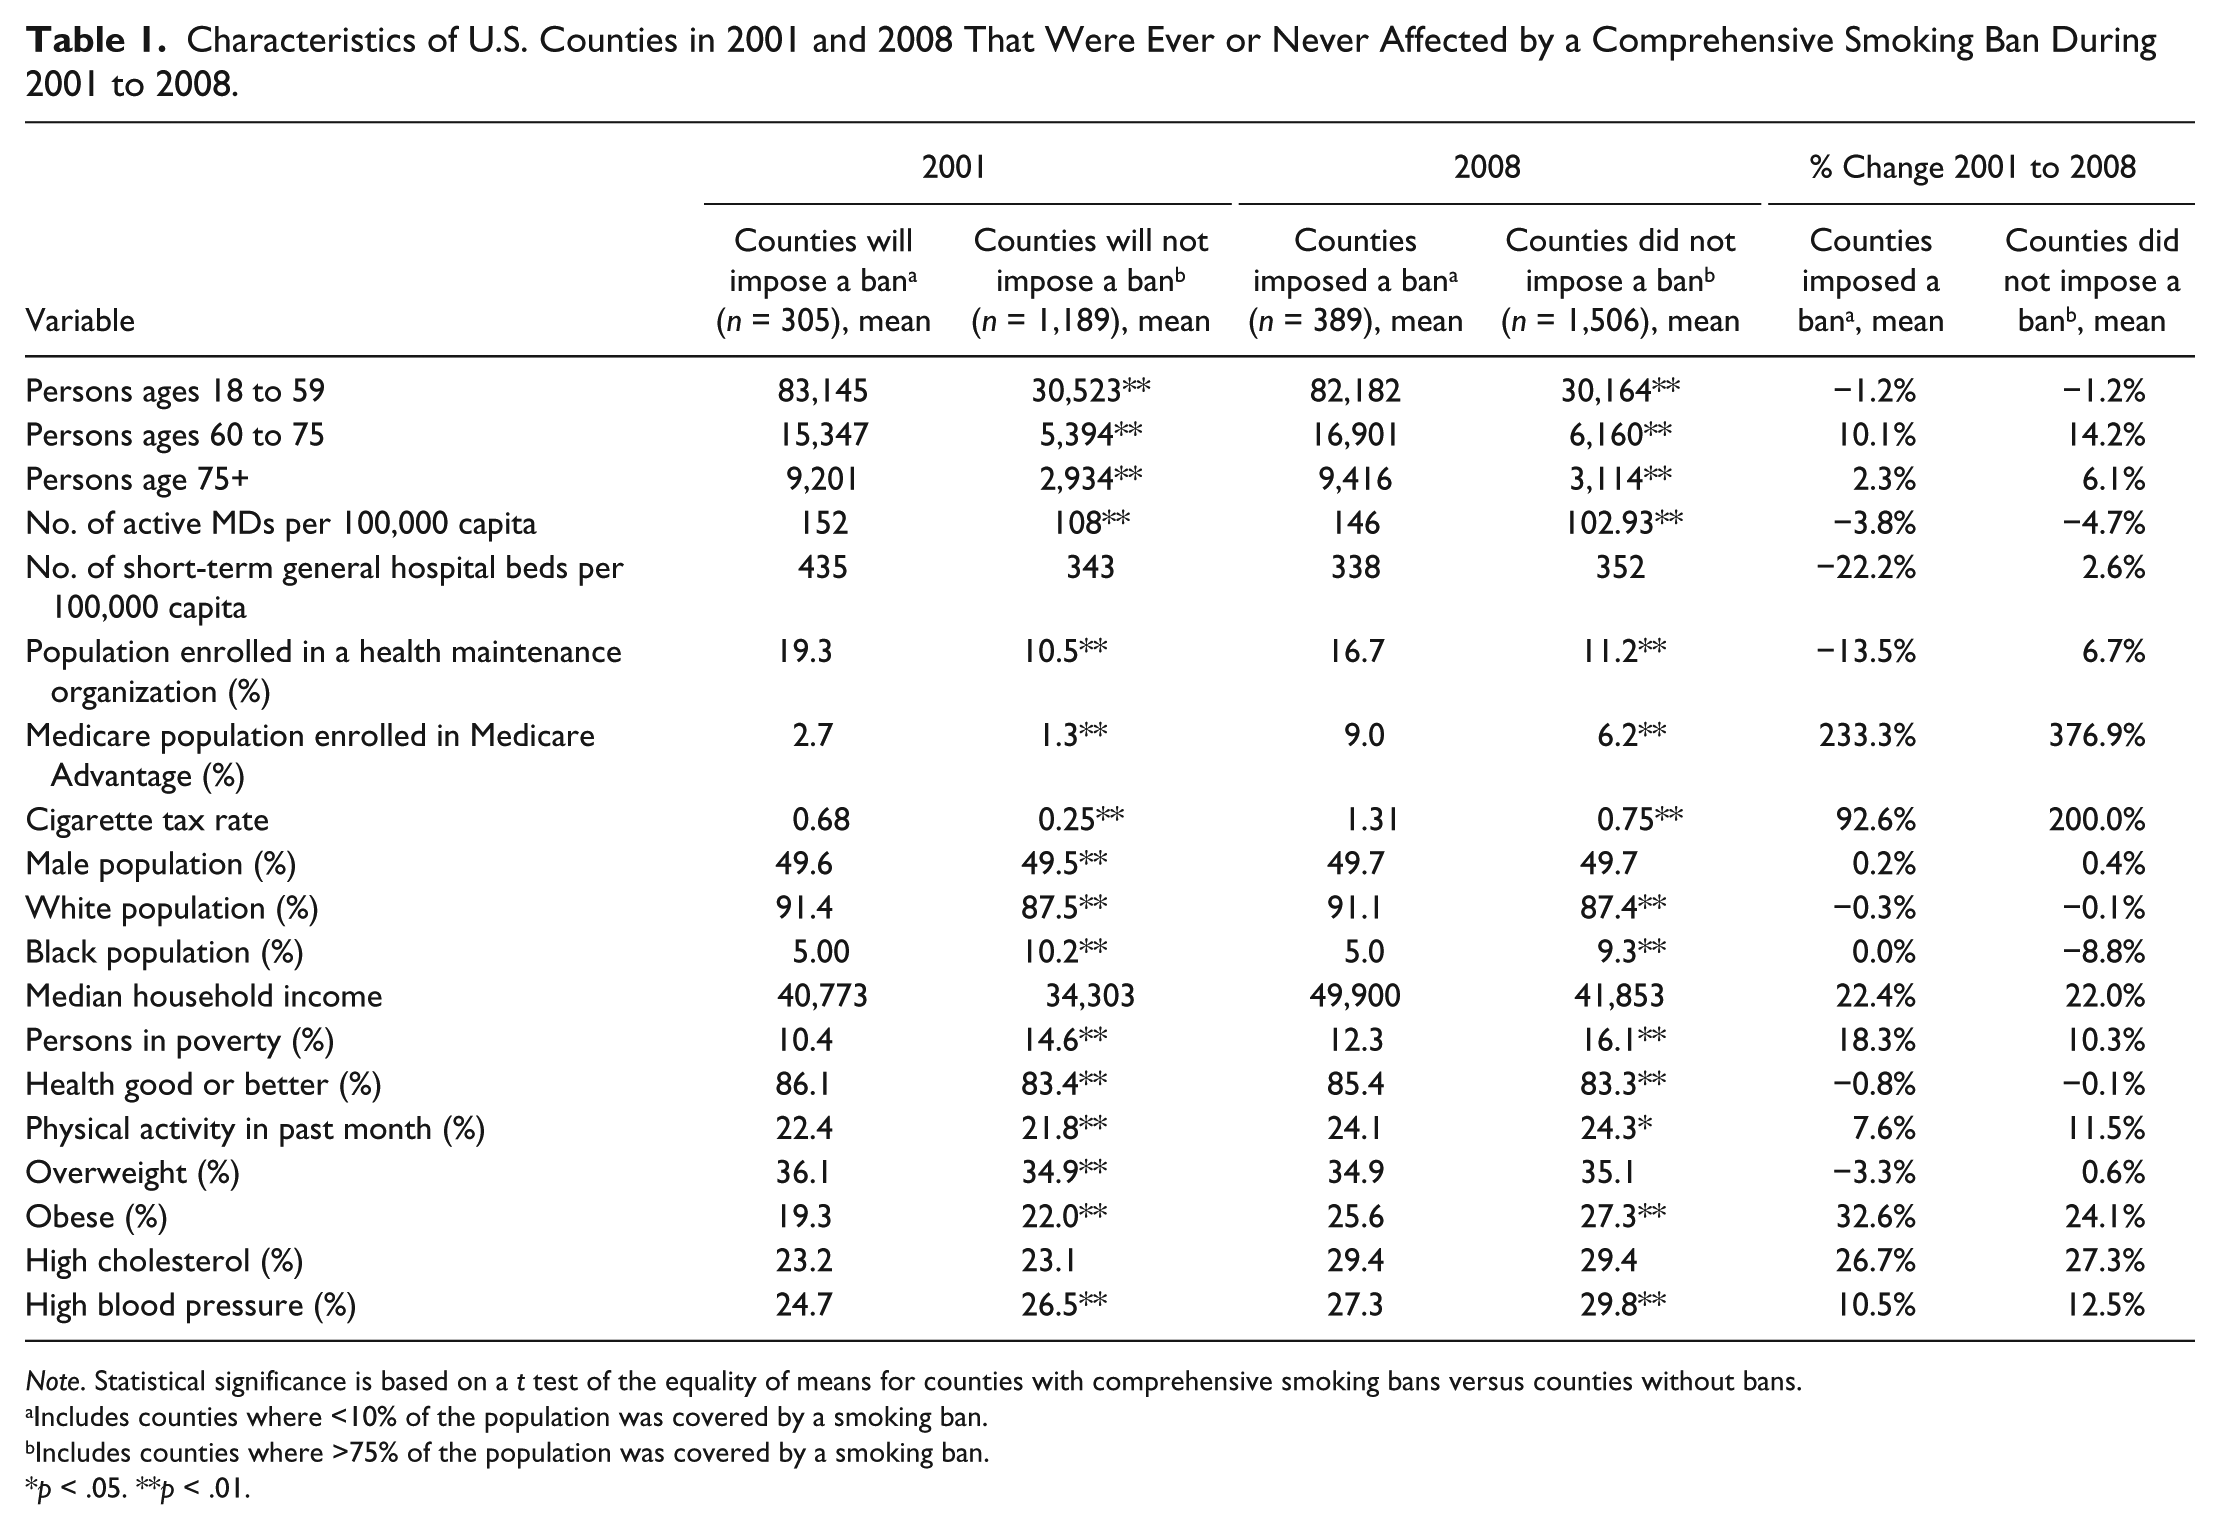
Note. Statistical significance is based on a t test of the equality of means for counties with comprehensive smoking bans versus counties without bans.
Includes counties where <10% of the population was covered by a smoking ban.
Includes counties where >75% of the population was covered by a smoking ban.
p < .05. **p < .01.
In unadjusted analyses that replicate the approach most commonly used in prior studies, we compared hospitalization rates from 2001 to 2008 for counties where a comprehensive smoking ban was introduced between 2003 and 2006 versus counties that had no smoking ban through 2008. Figure 1 graphs these trends by disease and age group. Prior to 2003, the graphs generally show similar changes in hospitalization rates by age group and smoking-related illness for states that did and did not subsequently impose bans between 2003 and 2006. Declines in AMI hospitalization rates for persons ages 60 to 74 years and age 75+ years appear steeper in counties where bans were introduced, but not for younger AMI patients, or for pneumonia patients.
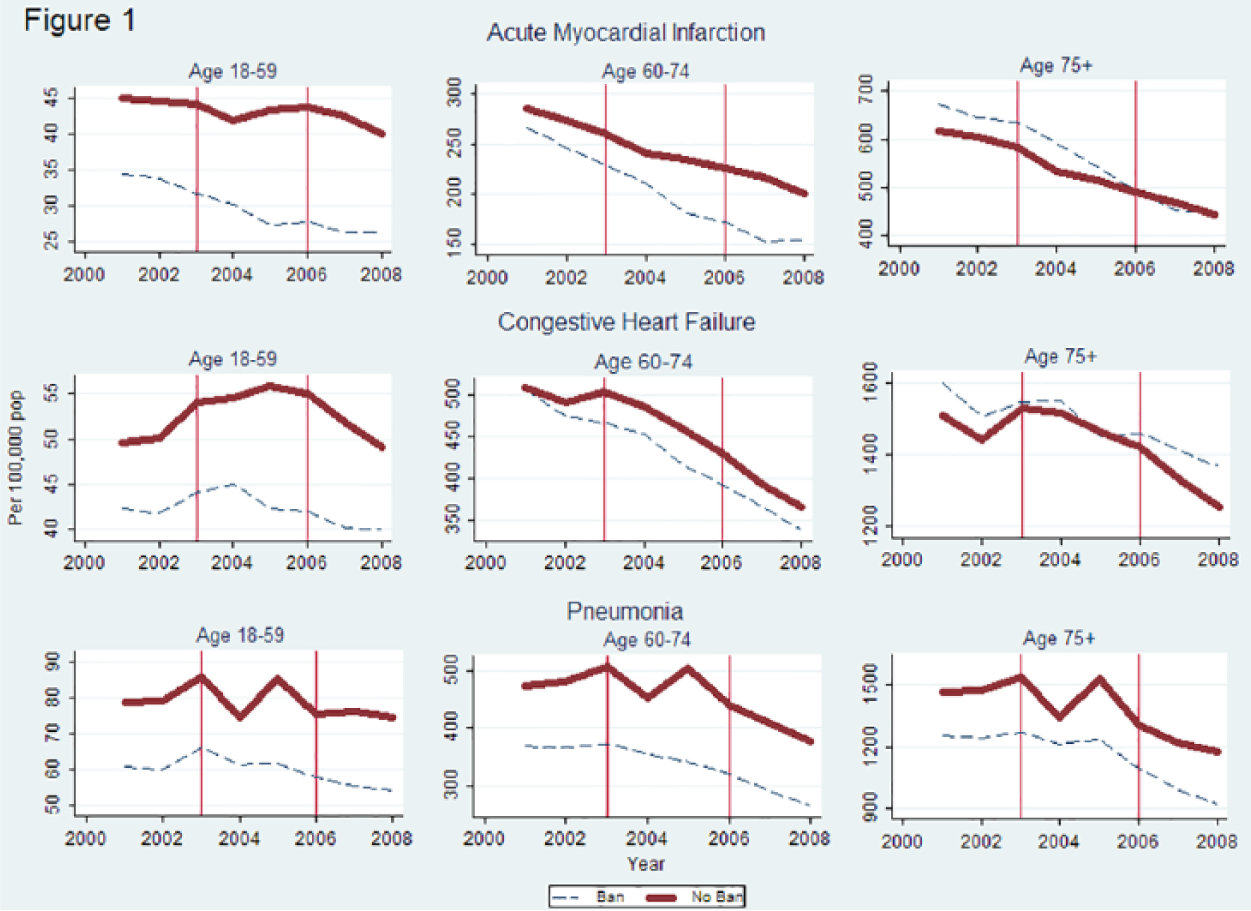
Population-weighted hospitalization rates for counties where comprehensive smoking bans were implemented in 2003-2006 compared to counties that never introduced bans
In adjusted analyses that accounted for cigarette tax rates and population and health care market characteristics, comprehensive public place smoking bans were not associated with lower AMI or heart failure hospitalization rates, overall and for all three age groups (Table 2, column 1). However, comprehensive smoking bans were associated with lower pneumonia hospitalization rates among adults ages 60 to 74 (9.9 fewer hospitalizations per 100,000 persons, 95% confidence interval [CI] −18.7 to −1.1; p = .028) but not among other age groups. This estimate represents a 2.6% reduction relative to the baseline rate of 385.2 pneumonia hospitalizations per 100,000 adults ages 60 to 74 in 2001 for counties that introduced a comprehensive ban by 2008.
Adjusted a and Unadjusted Effect of Public Place Smoking Bans and State Cigarette Taxes on Hospitalization Rates for Smoking-Related Conditions, Stratified by Condition and Age Group.
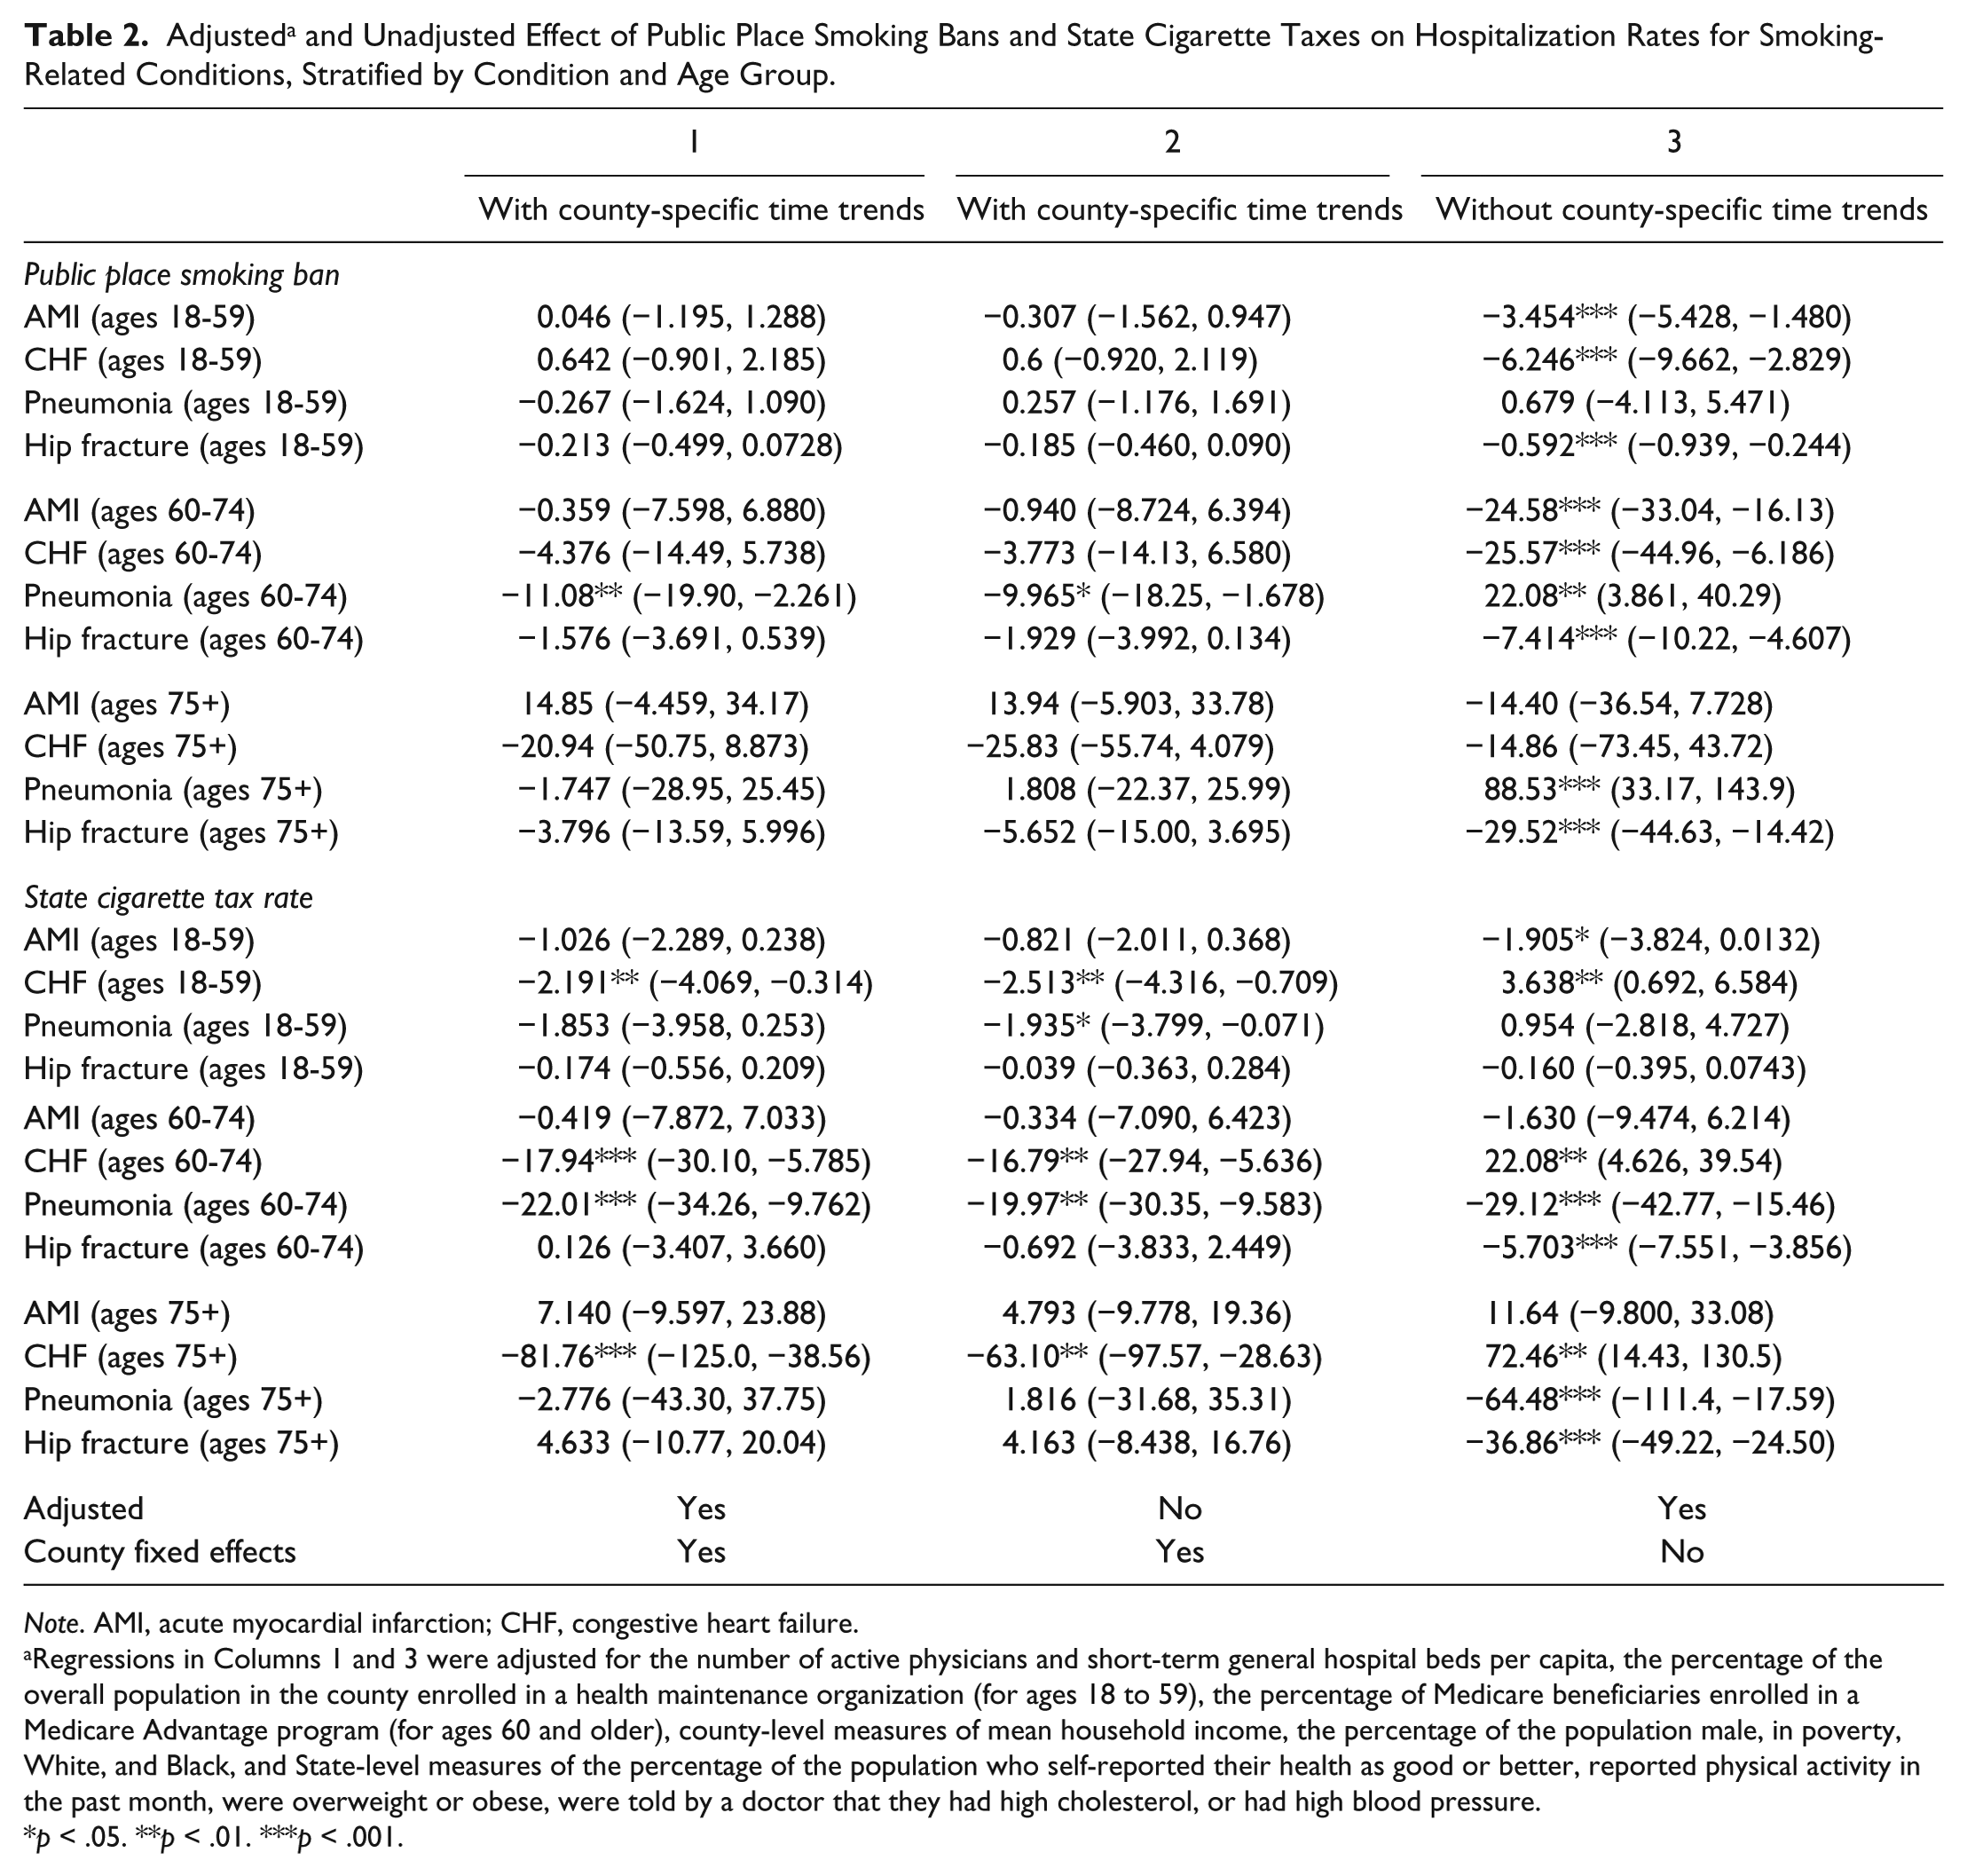
Note. AMI, acute myocardial infarction; CHF, congestive heart failure.
Regressions in Columns 1 and 3 were adjusted for the number of active physicians and short-term general hospital beds per capita, the percentage of the overall population in the county enrolled in a health maintenance organization (for ages 18 to 59), the percentage of Medicare beneficiaries enrolled in a Medicare Advantage program (for ages 60 and older), county-level measures of mean household income, the percentage of the population male, in poverty, White, and Black, and State-level measures of the percentage of the population who self-reported their health as good or better, reported physical activity in the past month, were overweight or obese, were told by a doctor that they had high cholesterol, or had high blood pressure.
p < .05. **p < .01. ***p < .001.
We estimated the association between comprehensive smoking bans and hospitalizations for three smoking-related conditions and three age groups. A Bonferroni-adjusted p value for a tangible effect of smoking bans that accounts for the nine regressions we estimated is equal to .0056, instead of the standard value of .05. Under this criterion, the association between smoking bans and reduced hospitalizations for pneumonia patients ages 60 to 74 (p = .028) is no longer statistically significant. This patient group was the only one of the nine regressions in Column 1 of Table 2 that had a p value less than .05.
In these same adjusted analyses, each dollar per pack increase in state cigarette tax rates was associated with lower heart failure hospitalization rates among adults ages 18 to 59 (2.0 fewer hospitalizations per 100,000 persons, 95% CI [−4.0, −0.1]; p = .035), among adults ages 60 to 74 (18.8, 95% CI [−31.4, −6.2]; p = .003), and among adults 75 years and older (79.2, 95% CI [−129.1, −29.3]; p = .002). Similarly, each dollar per pack increase in state cigarette tax rates was associated with lower pneumonia hospitalization rates among adults ages 60 to 74 (20.1 fewer hospitalizations per 100,000 persons, 95% CI [−33.1, −7.0]; p = .001) but not among adults aged 18 to 59 or 75 years and older. State cigarette taxes were not associated with lower AMI hospitalizations, overall or for any age group. Three of these four effects are statistically significant when applying a Bonferroni-adjusted p value of .0056.
The appendix reports (available online at http://mcr.sagepub.com/content/by/supplemental-data) coefficients estimates for the explanatory variables included in the regressions and the time fixed effects. Except for the percentage of the county population male, the 14 other local population and health care market characteristics were precisely estimated (p < .05) in at least one of the nine regressions for smoking-related conditions. The sets of time fixed effects, county fixed effects, and interactions of county with a time trend were jointly significant (based on an F test, p < .05) in each regression. As a validity check, we find no association between implementation of smoking bans on hospitalization rates for hip fracture in Column 1.
We examine the sensitivity of our analyses to exclusion of population and health care market controls in Column 2 of Table 2. The results are similar to Column 1, except that a significant association between higher cigarette tax rates and lower hospitalization rates for pneumonia for persons ages 18 to 59 now appears. In Column 3 of Table 2, we examine the relationship between smoking bans and hospitalization rates excluding county fixed effects and county-specific linear time trends. Unlike Columns 1 and 2, we now find a significant association between smoking bans and lower hospitalization rates for both AMI and congestive heart failure (CHF) for persons ages 18 to 59 and 60 to 74; while comprehensive bans appear to raise hospitalization rates for pneumonia for persons age 75+. However, unlike the first two columns, smoking bans now are associated with lower hospitalization rates for hip fracture for persons ages 18 to 59 (0.6 per 100,000 persons, 95% CI [−0.9, −0.2]; p < .001), aged 60 to 74 (7.4 per 100,000 persons, 95% CI [−10.2, −4.6], p < .001), and aged 75+ (29.5 per 100,000 persons, 95% CI [−44.6, −14.4], p < .001). The data supplement (available online at http://mcr.sagepub.com/content/by/supplemental-data) reports results where we estimate the effects of comprehensive smoking bans and tax rates in separate regressions. The magnitude of the coefficients on the ban variables or tax rates differ slightly from Column 1 of Table 2. However, the conclusions regarding the statistical significance and direction of the associations between these variables and hospitalization rates remain the same.
The decision to exclude counties with 10% to 75% of the population covered by comprehensive bans was arbitrary. Therefore, we examined the sensitivity of the results to including all counties with cities that introduced comprehensive bans; counties with more than 50% of the population covered by a comprehensive city ban were defined as counties with a ban, and the remaining counties were classified as without bans. With this sample, we found no significant impact of bans on hospitalization rates for any illness or age group. Two of the four cases where we had found that cigarette taxes lower hospitalization rates remained precisely estimated (for pneumonia patients ages 60 -74 and CHD patients ages 75+). For CHF patients ages 18 to 59, the effect was imprecisely estimated; and for CHF patients ages 60 to 74, the effect was statistically significant only at the p < .10 level.
Discussion
Contrary to most previous studies, we found no evidence that comprehensive public place smoking bans lowered hospitalization rates in the short-term for AMI or heart failure. Comprehensive bans were associated with lower admission rates for pneumonia for persons ages 60 to 74, but conducting multiple related tests increased the likelihood of concluding this effect was statistically significant only by chance. However, higher state cigarette tax rates were associated with lower heart failure hospitalization rates for all age groups and lower pneumonia hospitalizations for persons ages 60 to 74. This effect remains significant in three of four tests even when adjusting for multiple hypothesis tests.
Previous literature documents the association between higher tobacco taxes and reduced smoking. Higher cigarette taxes have been associated with higher quit rates, declines in the propensity to initiate smoking, and fewer cigarettes per day among smokers (Adda & Cornaglia, 2013; Carpenter & Cook, 2008; Colman, Grossman, & Joyce, 2003; Lillard, Molloy, & Sfekas, 2013; Nonnemaker & Farrelly, 2011). These studies include external controls, adjust for multiple confounders, and control for unobservable characteristics using regional fixed effects. To the best of our knowledge, our study is the first to apply techniques comparable to those in the tobacco tax literature to demonstrate an association between cigarette taxes and reduced hospitalizations. Cigarette taxes may have an immediate effect in reducing people’s propensity to smoke, which reduces hospitalization rates.
Many other studies have concluded that implementation of smoking bans reduces hospitalization rates for AMI and other conditions (Bartecchi et al., 2006; Cesaroni et al., 2008; Dove et al., 2010; Herman & Walsh, 2011; Hurt et al., 2012; Juster et al., 2007; Mackay, Haw, Ayres, Fischbacher, & Pell, 2010; Pell et al., 2008; Sargent, Shepard, & Glantz, 2004; Sims, Maxwell, Bauld, & Gilmore, 2010). Several of these studies came to this conclusion solely by comparing hospitalization rates before and after a smoking ban was introduced in a particular region (Cesaroni et al., 2008; Hurt et al., 2012; Mackay et al., 2010; Pell et al., 2008; Sargent et al., 2004; Sims et al., 2010). These studies cannot control for general declines in hospitalization rates that may be due to other factors, as observed in Figure 1 for both counties that did and did not introduce smoking bans. Previous research documenting a decline in AMI hospitalization rates between 2002 and 2007 among Medicare beneficiaries suggests other factors that could explain falling hospitalizations, including improved control of hypertension and hyperlipidemia (Chen et al., 2010). Improvements in blood pressure, glucose, and cholesterol levels between 1999 and 2006 among adults with cardiovascular disease and diabetes were identified in a nationally representative survey (McWilliams, Meara, Zaslavsky, & Ayanian, 2009).
Our results are consistent with those reached by Shetty et al. (2010), who found that neither workplace smoking bans nor bans of any type produced short-term declines in hospital admissions or mortality for AMI or COPD. However, their sample included at most a sample of 20% of U.S. community hospitals in each year, so one could not be certain whether their null findings were attributable to incomplete counts of hospitalizations in each area. Our results differ from Vander Weg et al. (2012), which analyzed Medicare claims data in counties across the United States. However, Vander Weg et al. did not control for state cigarette tax rates. In addition, our regressions and those by Shetty et al. (2010) included indicator variables for each county or hospital catchment area, while Vander Weg et al. (2012) included only state indicator variables.
Unlike past studies, we include county specific time trends in our regression models. These trends help control for county-specific actions such as private smoking restrictions that are effective in reducing smoking related hospitalizations, but unmeasured in the data. Inclusion of region-specific time trends when comparing trends in outcomes across regions has become the standard of practice over the past 15 years for health economists (Anger et al., 2011; DeCicca & McLeod, 2008; Dee, 1999; Finkelstein, 2007; Gruber & Yelowitz, 1999; Ruhm, 2000). Controlling for differences in county time trends ensures that we are not confusing preexisting trends in hospitalization rates across counties with any apparent association between smoking bans and hospitalization rates.
We measured the association between smoking bans and hip fracture hospitalizations to test the validity of our approach. With county fixed effects and county-specific time trends included in the analysis, we find no association between smoking bans and hip fracture hospitalizations. But when these county-level variables are excluded from the analysis, we find a significant association between the introduction of smoking bans and lower hip fracture hospitalizations rates for both persons ages 60 to 74 and ages 75+. Vander Weg et al.’s (2012) analysis also found multiple significant associations between the introduction of smoking bans and lower hip fracture hospitalization rates.
The relative absence of studies concluding that smoking bans do not lower hospitalization rates may be due to publication bias. Shetty et al. (2010) used their nationwide representative 20% sample of hospitals to conduct 30,143 pairwise comparisons of hospitals that were in an area where a workplace smoking ban was introduced, compared to a hospital in a region without a ban. In these simulations they found that large short-term increases in AMI incidence following a smoking ban are as common as the large decreases reported in the published literature.
Several caveats to our conclusions should be noted. Classifying counties where comprehensive city bans covered 75% or more of the population as counties with bans may have lowered our estimates of the effects of smoking bans. However, these counties represented only 5% of individuals covered in the population-weighted regressions at the start of the sample in 2001 and 4.5% of persons in 2008. Similar to several previous studies, we use counties that have not adopted comprehensive bans as a control group to quantify the effects of bans. Counties that have and have not adopted bans may still differ in ways that could not be captured by the set of observed variables and county-specific trends we utilized.
Our estimates may not apply to countries in Europe, which generally have higher rates of cigarette smoking than in the United States (“Tobacco consumption,” 2013). Other studies have examined hospitalization rates for a wider range of conditions than we did, and they should be studied similarly. Also, we cannot exclude long-term effects, as the benefits may not accrue immediately. However, we sought to address the claims that effects were immediate.
As of January 2014, 49.1% of the U.S. population lives in a location subject to comprehensive smoking bans, and 81.5% are in an area with at least a restaurant, bar, or workplace ban. Smoke-free workplaces reduce cigarette consumption among continuing smokers and increase successful smoking cessation (International Agency for Research on Cancer, 2009). In this study, we did not detect a corresponding effect of smoking bans on hospitalizations. The benefits in reduced hospitalizations may be more long term. Our study suggests that cigarette taxes have a more immediate effect in reducing hospitalizations. Both smoking bans and cigarette taxes play a crucial role in improving public health. However, public health officials must maintain a realistic perspective of the potential benefits and their timing when considering the effects of multiple policies to reduce smoking.
Footnotes
Acknowledgements
Authors’ Note
The funders had no role in the design and conduct of the study; collection, management, analysis, and interpretation of the data; and preparation, review, or approval of the manuscript; and decision to submit the manuscript for publication. Vivian Ho, PhD, had full access to all the data in the study and takes responsibility for the integrity of the data and the accuracy of the data analysis.
Declaration of Conflicting Interests
The author(s) declared the following potential conflicts of interest with respect to the research, authorship, and/or publication of this article: Dr. Ross reports that he is a member of a scientific advisory board for FAIR Health, Inc. Dr. Krumholz reports that he chairs a scientific advisory board for UnitedHealthcare. Vivian Ho, Dr. Claudia Steiner, Dr. Aditya Mandawat, Marah Short. and Meei-Hsiang Ku-Goto declare no conflicts of interest.
Funding
The author(s) disclosed receipt of the following financial support for the research, authorship, and/or publication of this article: Drs. Joseph S. Ross and Harlan M. Krumholz receive support from Medtronic, Inc. and Johnson and Johnson, Inc. to develop methods of clinical trial data sharing, from the Centers of Medicare and Medicaid Services to develop and maintain performance measures that are used for public reporting, and from the Food and Drug Administration to develop methods for postmarket surveillance of medical devices. Dr. Ross is supported by the National Institute on Aging (K08 AG032886) and by the American Federation for Aging Research through the Paul B. Beeson Career Development Award Program. Dr. Krumholz is supported by a National Heart Lung Blood Institute Cardiovascular Outcomes Center Award (1U01HL105270-04). Dr. Steiner is staff at the DHHS Agency for Healthcare Research and Quality.
References
Supplementary Material
Please find the following supplemental material available below.
For Open Access articles published under a Creative Commons License, all supplemental material carries the same license as the article it is associated with.
For non-Open Access articles published, all supplemental material carries a non-exclusive license, and permission requests for re-use of supplemental material or any part of supplemental material shall be sent directly to the copyright owner as specified in the copyright notice associated with the article.