
Abstract
The presence of rail surface damage leads to increased vibrations on railway bridges as wheels cross the localized irregularities. These short wavelength irregularities appear frequently on the top of rail in railway tracks and, along with the increased axle loading, fatigue failure accelerates, and ultimately, serviceability decreases. Compromised bridge safety and reliability is countered by an increase in inspections as bridge structures continue to age and deteriorate. In recent years, the effects of rail surface spot irregularities on the condition of railway bridges have attracted the attention of the industry and the research community. This study has two objectives. Firstly, it introduces the methodology, algorithms, and models for Vehicle Track Interaction (VTI) simulations developed to study the effects of Rail Surface Spot Irregularities (RSSI) on system response. The proposed VTI simulator solves the wheel-rail interaction problem in a Staggered Time Marching (STM) form. Long- and short-wave surface irregularities are accounted for. A multi-point wheel-rail contact algorithm is developed and implemented for properly capturing the wheel contact points in view of the relative size of the wheel and the rail surface irregularities. The proposed method is verified analytically. Subsequently, this paper investigates and quantifies the effects of the shape and location of RSSI on the vibrations of the bridge structure and the train for different train speeds. It is shown that RSSI affects wheel-rail interactions forces significantly and the induced vibrations substantially stimulate bridge velocity and acceleration. The effects are more pronounced for specific RSSI locations and train speeds.
Keywords
1. Introduction
Railroads are the backbone of the economy of several nations around the world and preserving the infrastructure in a good state of repair is critical to the safe, reliable, and uninterrupted operations. Rail Surface Spot Irregularities (RSSI) are among the most common types of damage in railway networks that affect track operating conditions and may lead to rail breaks, track failure, and derailments (Liu et al., 2018; Nielsen et al., 2003). Such irregularities are local defects on the rail surface arising from rolling contact fatigue (Kaewunruen et al., 2015; Tao and Zhang, 2022) (squats, spalling, shelling, etc.), joints (Mandal et al., 2016), and welds (Gedney and Rizos, 2022), among others, which, over time, they will become deeper and form saddle shaped features (Liu et al., 2015; Xu et al., 2017), as illustrated, for example, in Figure 1. RSSI wavelengths vary from about a few centimeters when they are initially formed to as much as one meter after load accumulation (Steenbergen, 2008). Since the RSSI wavelength is much shorter than other irregularities, RSSI may significantly increase the wheel-rail dynamic forces and the wheel unloading rate, becoming, thus, significant dynamic excitation sources on track and structures (Gao et al., 2018; Meymand et al., 2016). RSSI model schematics and qualitative effects on wheel-rail interaction: (a) bulge, (b) cavity.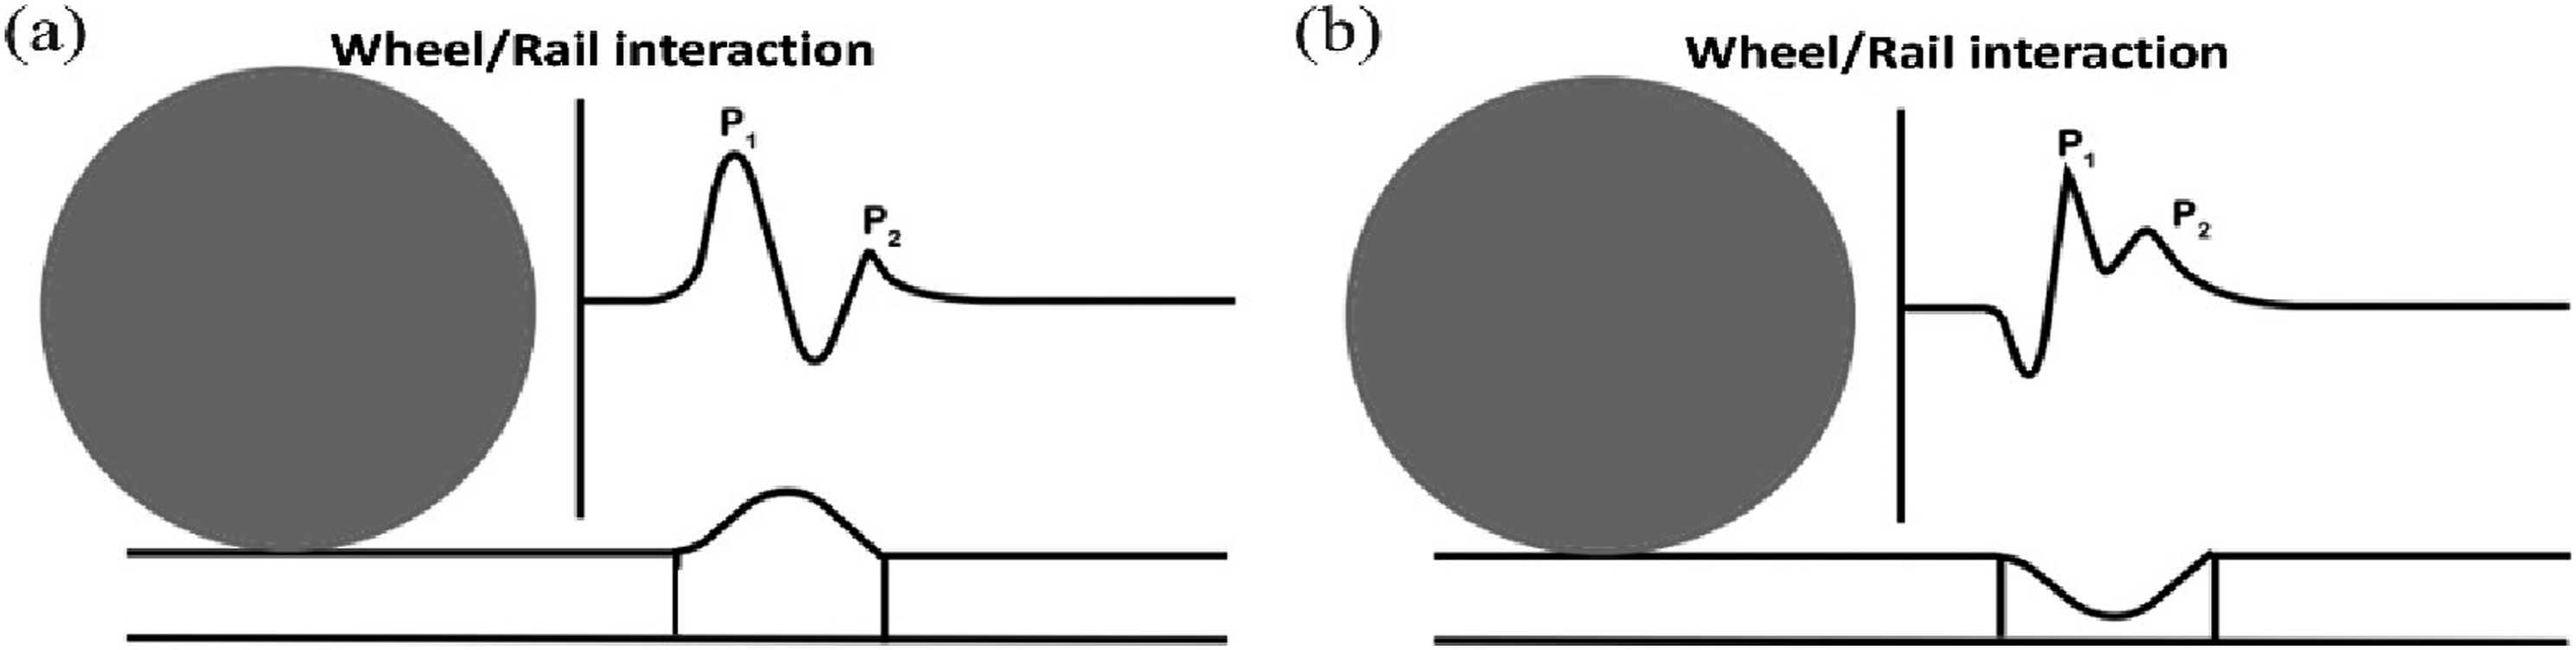
Studies reported in the literature showed that RSSI substantially increase the free field vibrations levels, even at larger distances away from the track (Kouroussis et al., 2015), may lead to ballast settlement, track deterioration, and hanging ties (Ataei et al., 2016; Tao and Zhang, 2022), lead to a 60% increase in the force exerted on bridge decks (Naseri and Mohammadzadeh, 2020), and drive maintenance costs higher (Rapp et al., 2019). Zimmerman (1888) presented a pioneering study of an existing rail joint applied as RSSI, and its consequences on wheel-rail interaction forces as the wheel passes over the rail welded joint at which time the forces attain their peak values (Steenbergen and Esveld, 2006). Kaewunruen et al. (2015) observed periodicity in transient vibrations, indicating RSSI influence on train ride quality and rolling noise. Andersson et al. (2020) demonstrated that RSSI with depths of 0.125 mm can cause a 15% increase in equivalent stress intensity factor. RSSI can result in significant track geometry and stiffness degradation and wheel rail noise (Sun et al., 2022; Xu et al., 2017). Furthermore, Cui et al. (2021) emphasized the impact of feedback vibration on wheel-rail interactions due to rail corrugation. Ekberg et al. (2007) discussed how corrugated wear in high-speed railways amplifies wheel-rail interaction forces, contributing to rolling contact fatigue and crack propagation (Cannon et al., 2003). Even small track short-wavelength irregularities can carry substantial impact forces under high-speed operations (Gao and Zhai, 2014). Additionally, Gedney and Rizos (2022) discussed the heightened stress state within Continuous Welded Rail (CWR) weldments due to welding residual stress and thermal expansion stress, increasing vulnerability to RSSI development.
It is evident that research on RSSI has focused on wheel-rail dynamics, track degeneration, and train ride comfort, while there is still a gap regarding the effects of RSSI induced vibrations on the performance of bridges (Hou et al., 2020). It is estimated that RSSI locally induced vibrations stimulate the system hundreds of times per train as the train wheels traverse the local surface irregularity, which, in the long term, accelerates damage accumulation and increases fatigue rate. A further factor to consider is that the short path between the vibration initiation zone and the bridge superstructure may cause vibration levels that exceed the permissible thresholds (Naseri, 2020). Thus, these excitations can have adverse effects on the integrity and safety of the bridge.
The present paper discusses findings of the study focusing on quantifying the effects of RSSI on railway bridge and train vibrations considering different situations of damage location, damage geometry, and operating conditions. This is achieved by first developing a train-track-bridge interaction technique for Vehicle Track Interaction (VTI) simulations. The proposed VTI simulator solves the wheel-rail interaction problem in a Staggered Time Marching (STM) form and the method is verified through simulated measurements and benchmark solutions reported in the literature. Long- and short-wave surface irregularities are accounted for. A multi-point wheel-rail contact algorithm is developed and implemented for properly capturing the wheel contact points in view of the relative size of the wheel and the rail surface irregularities. Subsequently, the VTI simulator is used within a parametric study framework to gain insight on the vibration characteristics of the system components due to RSSI. In particular, the study quantifies the effects of the shape and location of rail surface irregularities on the vibrations of the bridge structure and the train for different train speeds.
2. Development of models for computer simulations
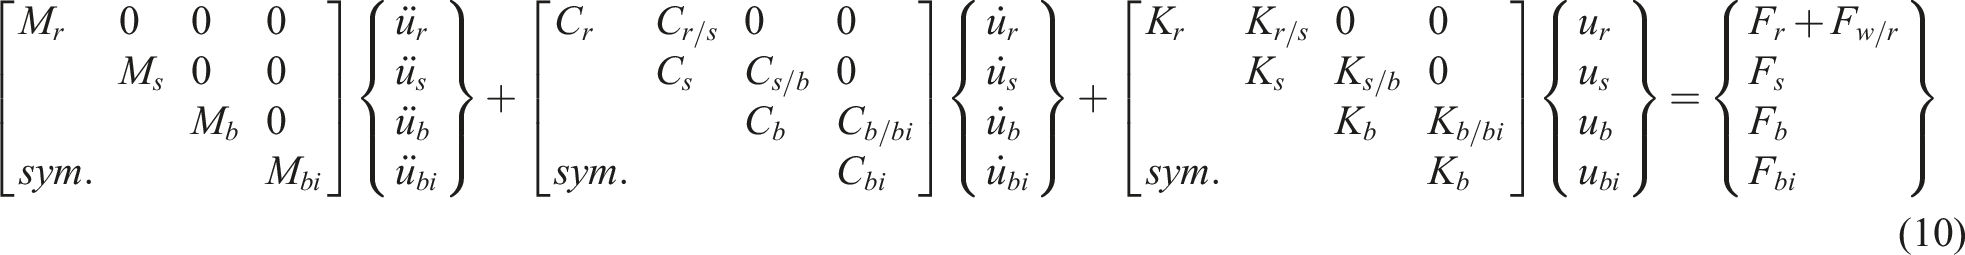
The components of the Train-Track-Bridge Interaction (TTBI) model considered in this study are: (i) the vehicle, (ii) the track (iii) the bridge, (iv) rail surface irregularities, and (v) wheel-rail interaction. The vehicle model is considered as the moving subsystem and the track and bridge models are combined to form the stationary subsystem. The rail surface irregularities are considered as the in-system excitations while the nonlinear rail-wheel interaction implements the coupling of the moving and stationary subsystems. Each of the TTBI components is described in detail in the following sections.
2.1. Vehicle model
The geometry of RSSI is such that the vertical and pitching vibration modes of the vehicle are expected to be predominantly affected. Thus, a model of a railcar vehicle is adequately represented by a typical lumped parameter model consisting of a car body, two bogies and two wheelsets per bogie connected by linear springs and viscous dashpot elements, as shown in Figure 2(a). Model schematics and nomenclatures (a) train, (b) track.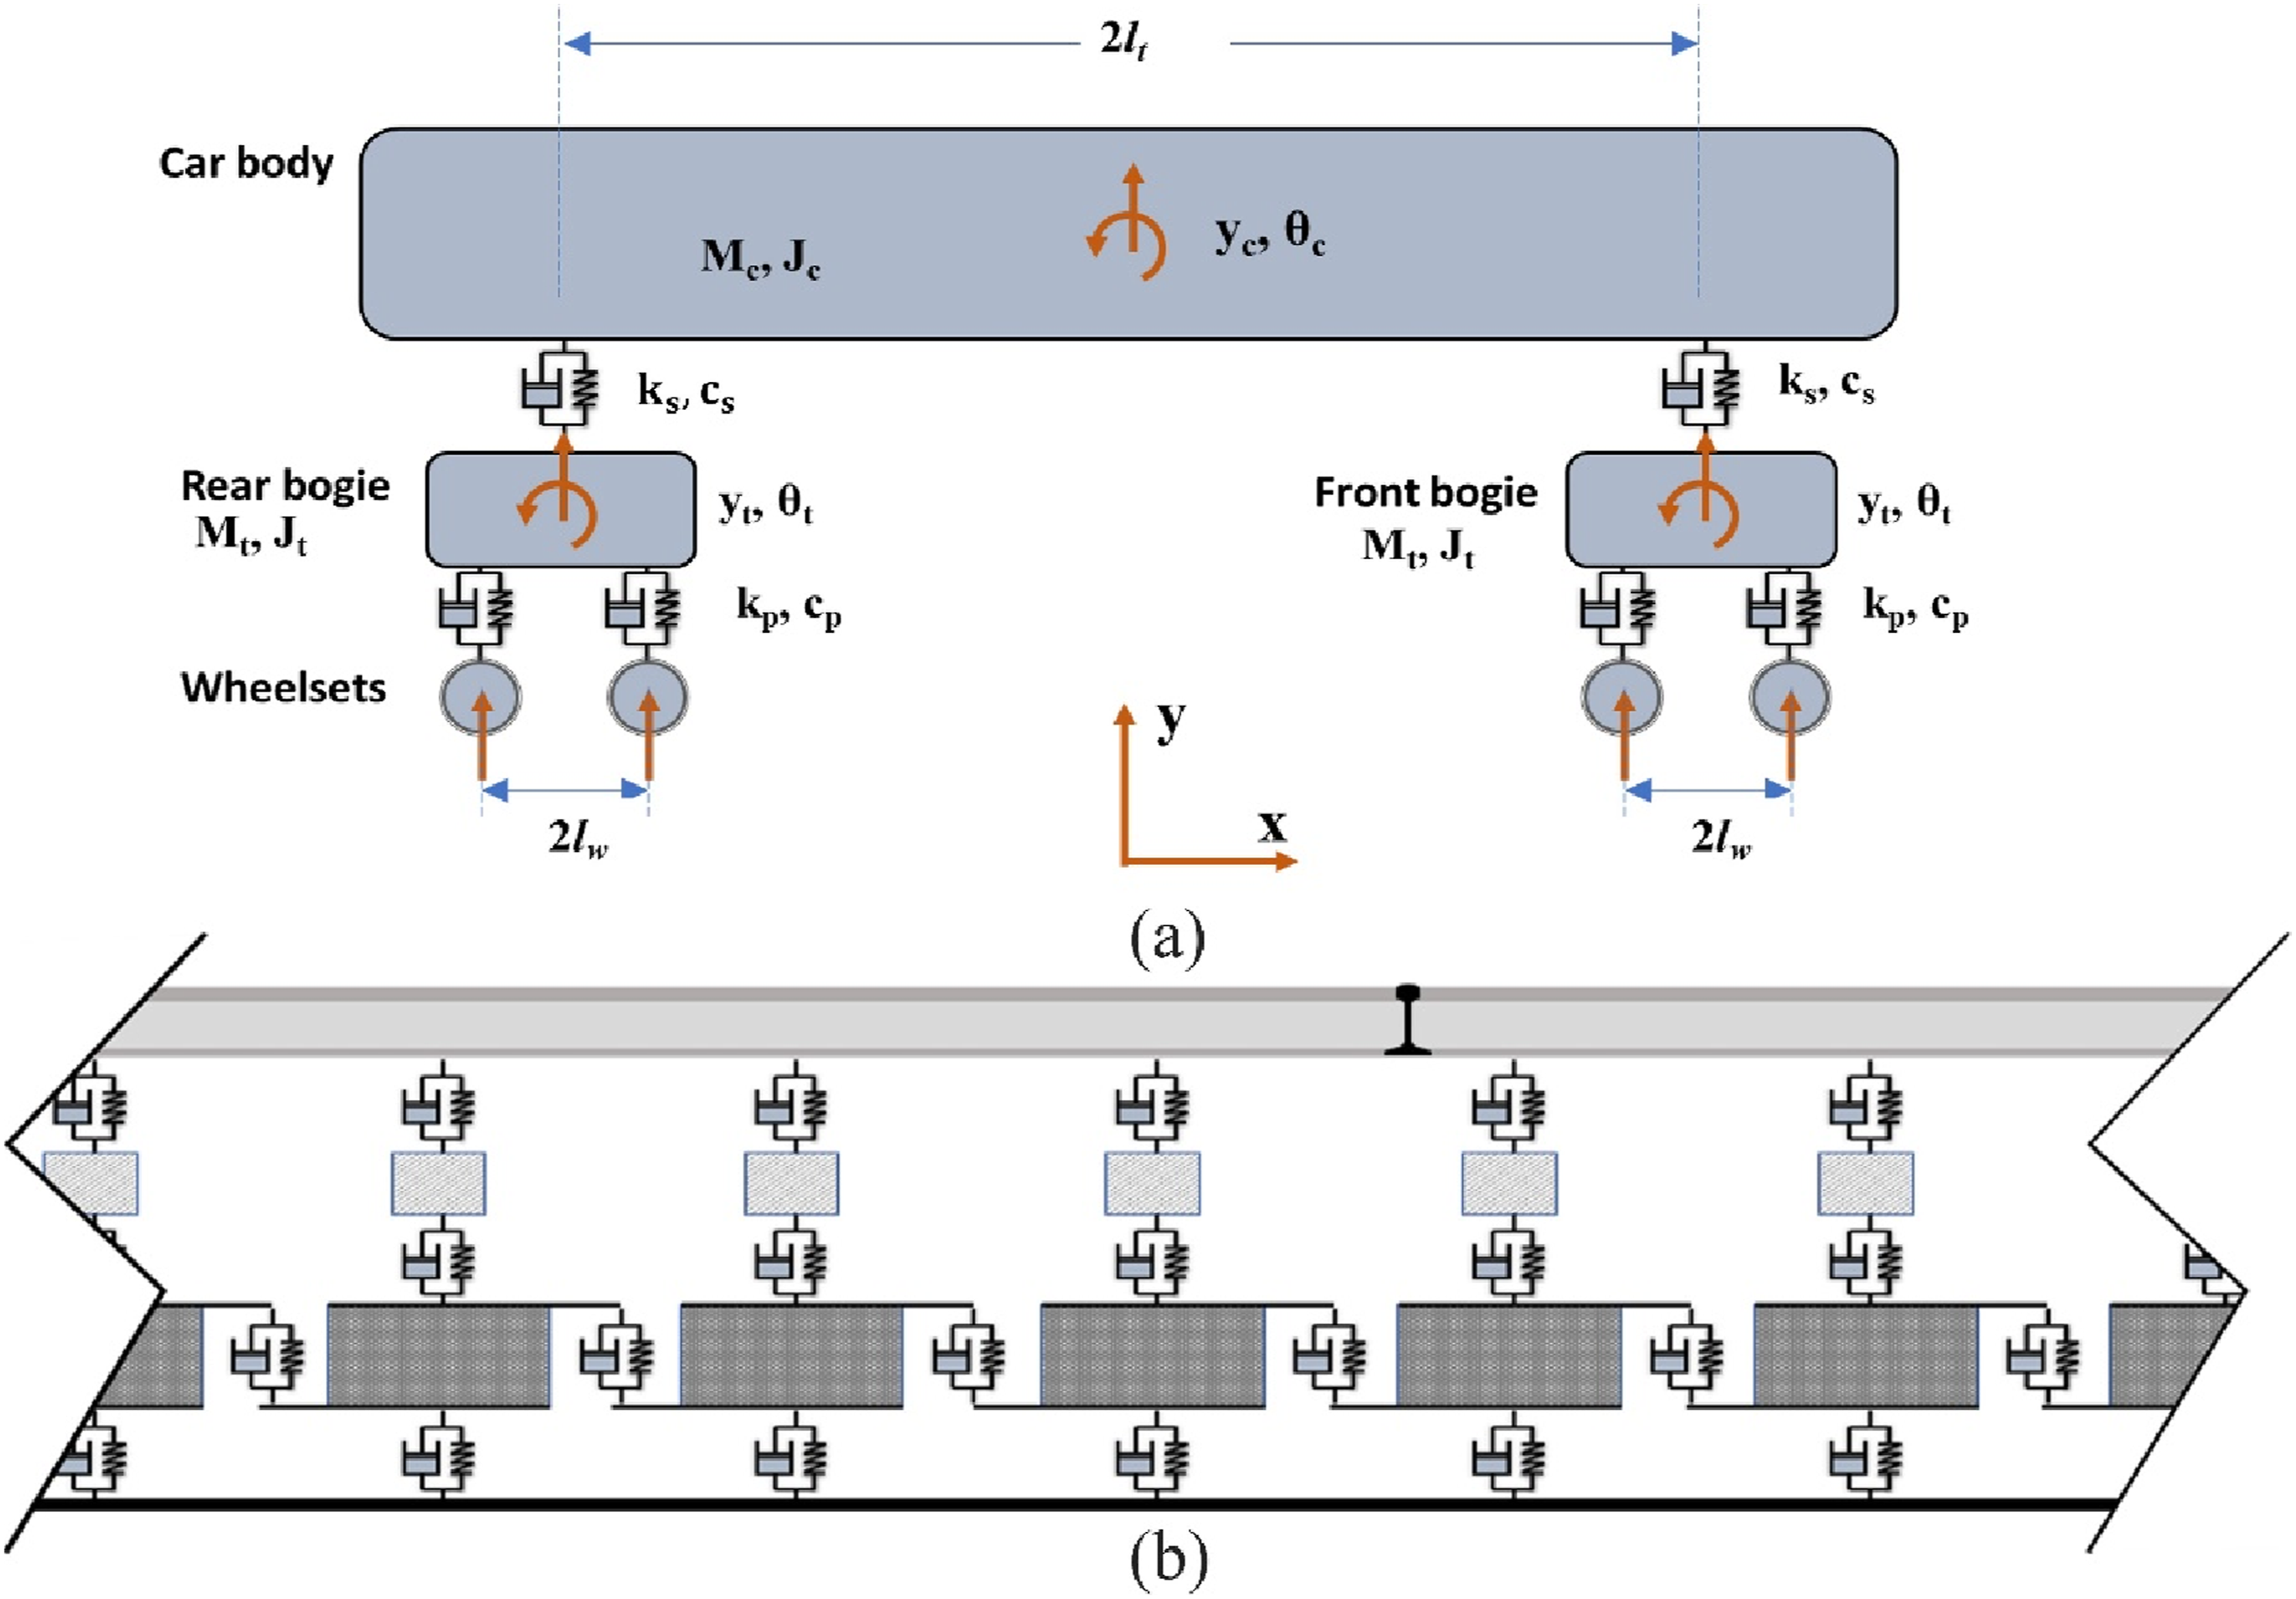
The car body is modeled as a rigid body with vertical and pitching vibration modes and is connected to the rear and front bogies by the secondary spring (ks) and dashpot (cs) set. Each bogie is also modeled as a rigid body with vertical and pitching vibration modes and is linked to the wheelsets by the primary spring (kp) and dashpot (cp) set. Each wheelset is represented as a lumped mass and only the vertical vibration mode is considered. Ιn Figure 2(a), subscripts c, t, and w denote the car-body, truck, and wheelset, respectively, and subscripts p or s denote the primary and secondary suspension systems. Variables y and θ indicate the vertical translation and pitching, respectively, while the stiffness and damping are denoted by k and c, respectively. Finally, M, J, and l represent, respectively, mass, mass moment of inertia, and the center-to-center distance, as shown in Figure 2(a). Thus, the motion of the vehicle is represented by 10 degrees of freedom (DOF) and the corresponding equations of motion can be expressed in a semi-discrete form as

2.2. Track model
The track component of the train-track-bridge significantly affects the level of vibrations on the bridge surface (Sung and Han, 2018). Hence, track models in the bridge zone need to capture the vibration characteristics of the track in adequate detail to include the dynamic track-bridge interaction effects. The beam-tie-ballast model introduced by Yuan et al. (2021), shown in Figure 2(b), is implemented in this study. The model represents the ties and ballast by lumped masses connected by springs and dashpots. Considering the aspect ratio (length to thickness) of the rail element between consecutive sleepers, the influence of shear bending on the overall system, particularly on the bridge response, is marginal. Therefore, Euler–Bernoulli model (Pau and Vestroni, 2021) is used to enhance computational efficiency while maintaining accuracy, compared to the Timoshenko model. The rail is connected to ties through a spring-dashpot system representing the elastic fastener. The equations of motion of the rail-sleeper-ballast system are expressed as

2.3. Bridge model
The shear effects of the short concrete bridge in this study need to be captured in the proposed TTBI. Accordingly, the Timoshenko beam element (Zhai et al., 2019) is adopted within the framework of the Direct Stiffness Method (DSM). Only vertical and rotational DOF are considered and it is assumed that there is no separation between the bridge and the track throughout the analysis (Xia et al., 2018). The equations of motion for the bridge are expressed in a semi-discrete form as

2.4. Rail irregularities model
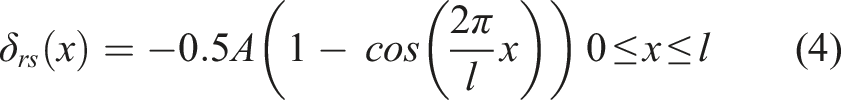
Aside from moving trains, rail irregularities are regarded as the main cause of vibration on rail tracks (Xu et al., 2020; Youcef et al., 2013). In TTBI models, rail irregularities are typically considered as stochastic processes, extending across the entire rail surface (Cantero et al., 2016). However, in this study RSSI is defined in a deterministic manner as a known localized irregularity enabling the systematic exploration of RSSI effects, encompassing their different sizes and varied placements. As illustrated in Figure 3, given the different wheel path over RSSI, the RSSI geometry can be represented as a cos function. This model is commonly used in the literature to simulate rail surface imperfections (Andersson et al., 2015; Zhang et al., 2020). The RSSI shape, RSSI representation at different wheel paths.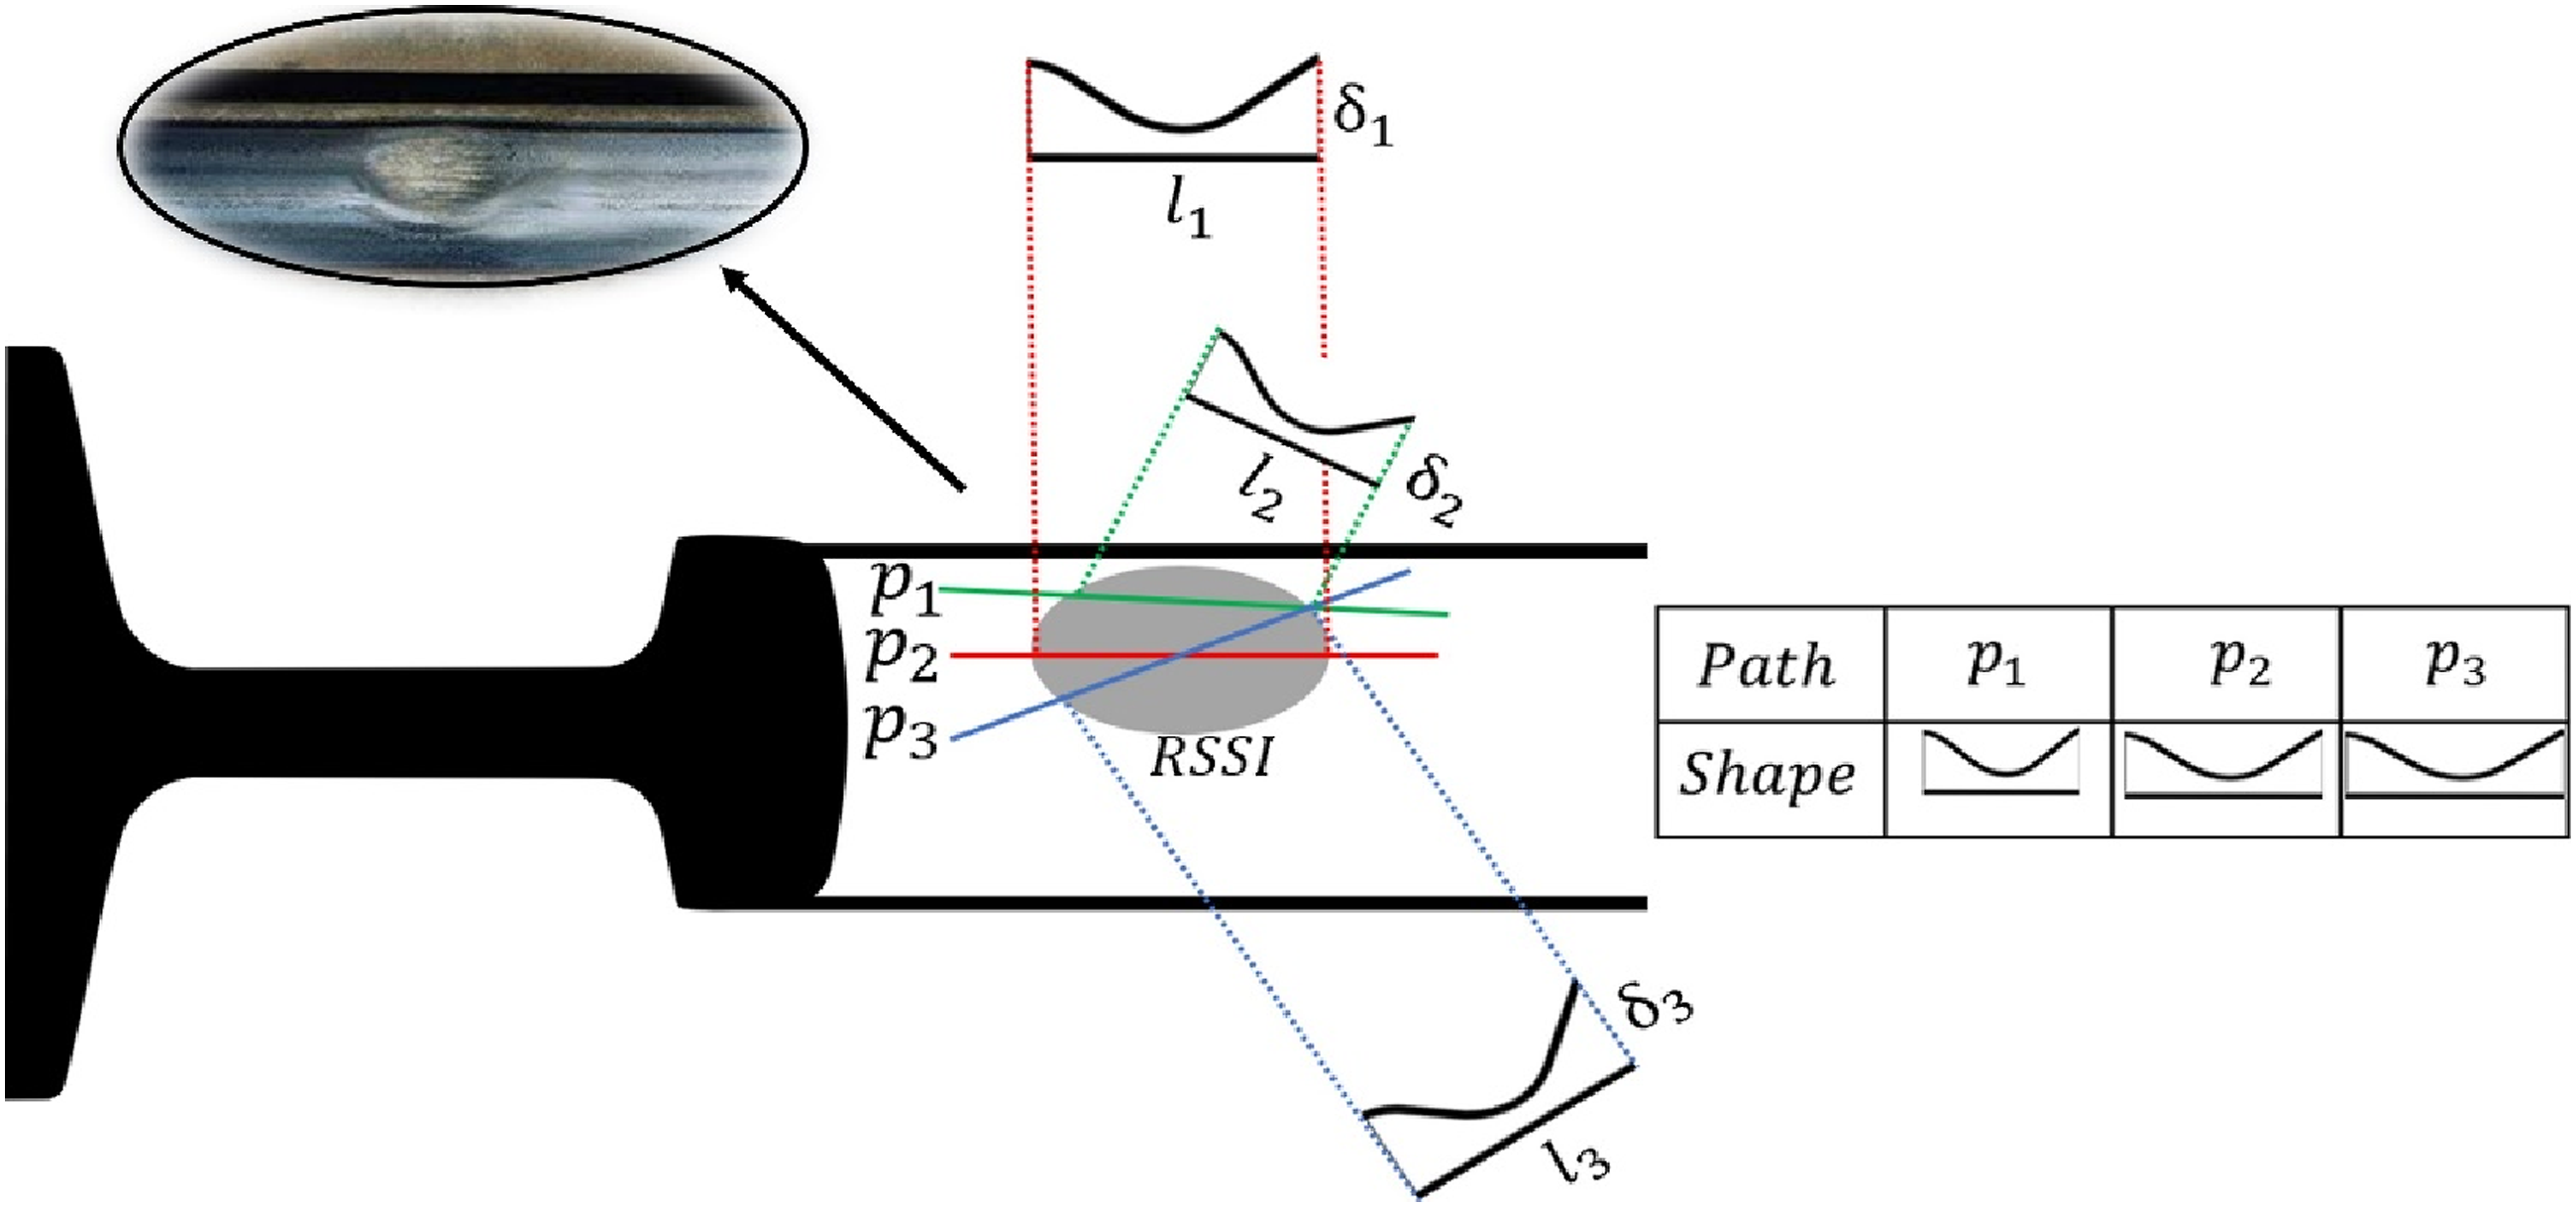
2.5. Wheel-rail interaction model
Wheel-rail interaction is a crucial part of the dynamic analysis of the TTBI system that links the train and track-bridge subsystems (Meymand et al., 2016; Zhang et al., 2008). In this work, the interaction is achieved through a non-linear Hertzian spring where the deformations are derived based on the actual path of the center of the wheel as discussed next.
2.5.1. Wheel-rail interaction force
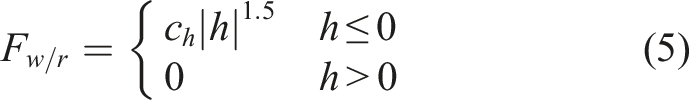
The wheel-rail interaction force is derived through an iterative process that considers the performance of both subsystems at every time step. The corresponding contact forces are calculated based on Hertzian non-linear theory, according to which the interaction force,

2.5.2. The virtual and actual paths of the wheel center
Due to the short wavelength of RSSI patterns used in this study, the wheel is not expected to reach the maximum depth at RSSI and the wheel-rail contact may occur at multiple points along the wheel circumference, as shown in Figure 4(a). In fact, if the RSSI wavelength is too small compared to the wheel diameter, the wheel will not sense the presence of the defect and will roll over it, as depicted in Figure 4(b) for the shortwave rail irregularity. A common simplified approach in estimating the wheel-rail interaction forces, Wheel-rail actual contact for longwave and shortwave rail surface irregularity path.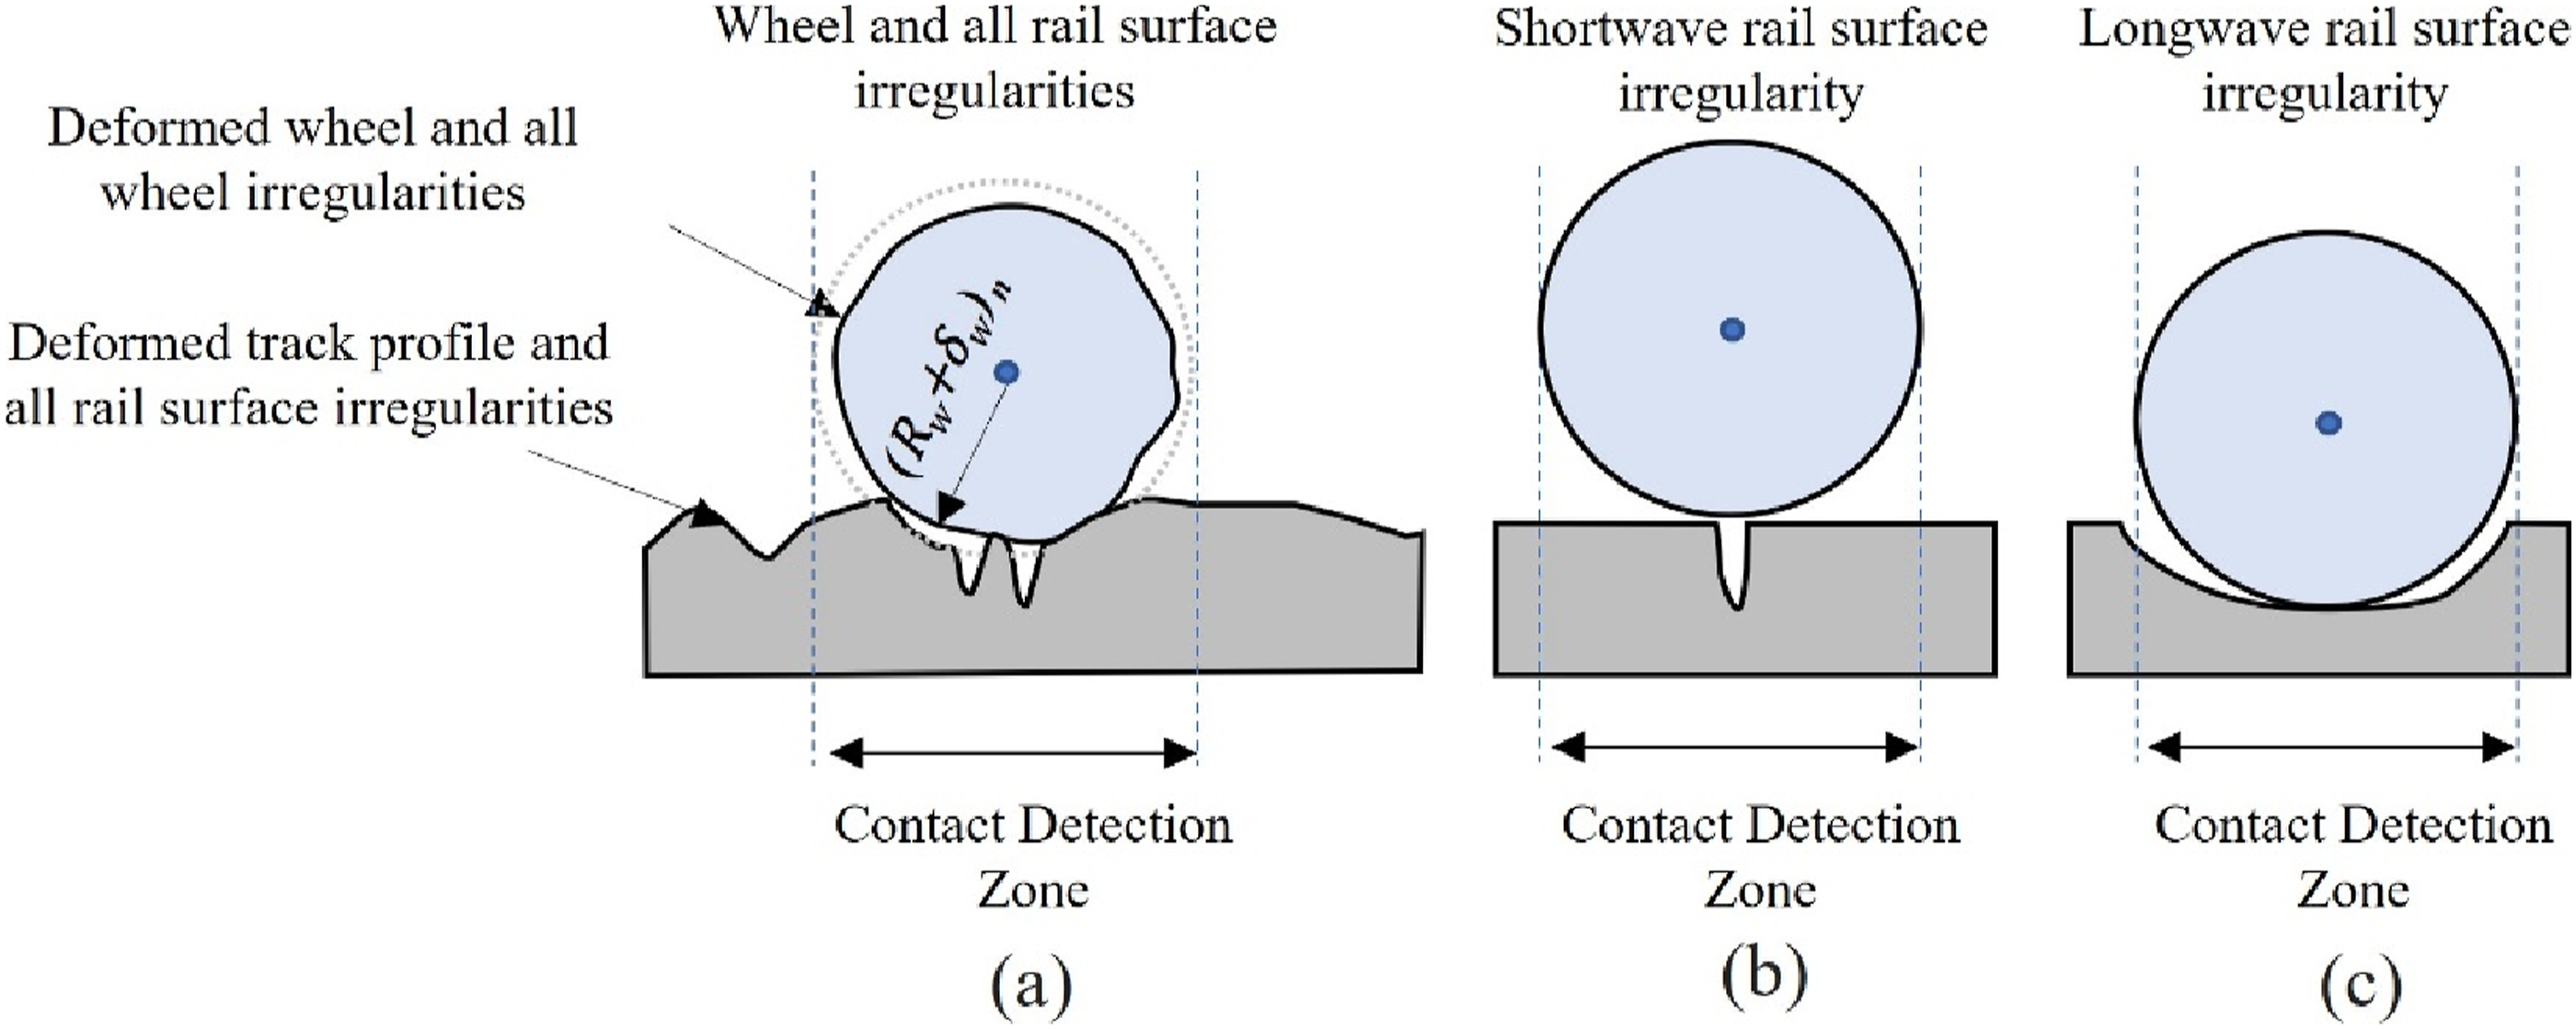
2.5.3. Estimating the actual path of the wheel center
The actual wheel deflection depends on the RSSI wavelength, track response, and wheel radius. A two-step process has been adopted to locate all possible actual wheel-rail contact point(s) and determine the actual path of the center of the wheel. The first step uses the virtual path of the wheel center and defines the virtual wheel-rail contact state, that is, the virtual penetration, separation, and contact. Subsequently, the wheel center is moved in the vertical direction by an amount equal to the maximum virtual separation or virtual penetration within the contact detection zone. The two steps are depicted in Figure 5 for cases A and B, corresponding to the detection of one, and two actual contact points, respectively, and are discussed next. The 2-step process for wheel-rail contact points determination.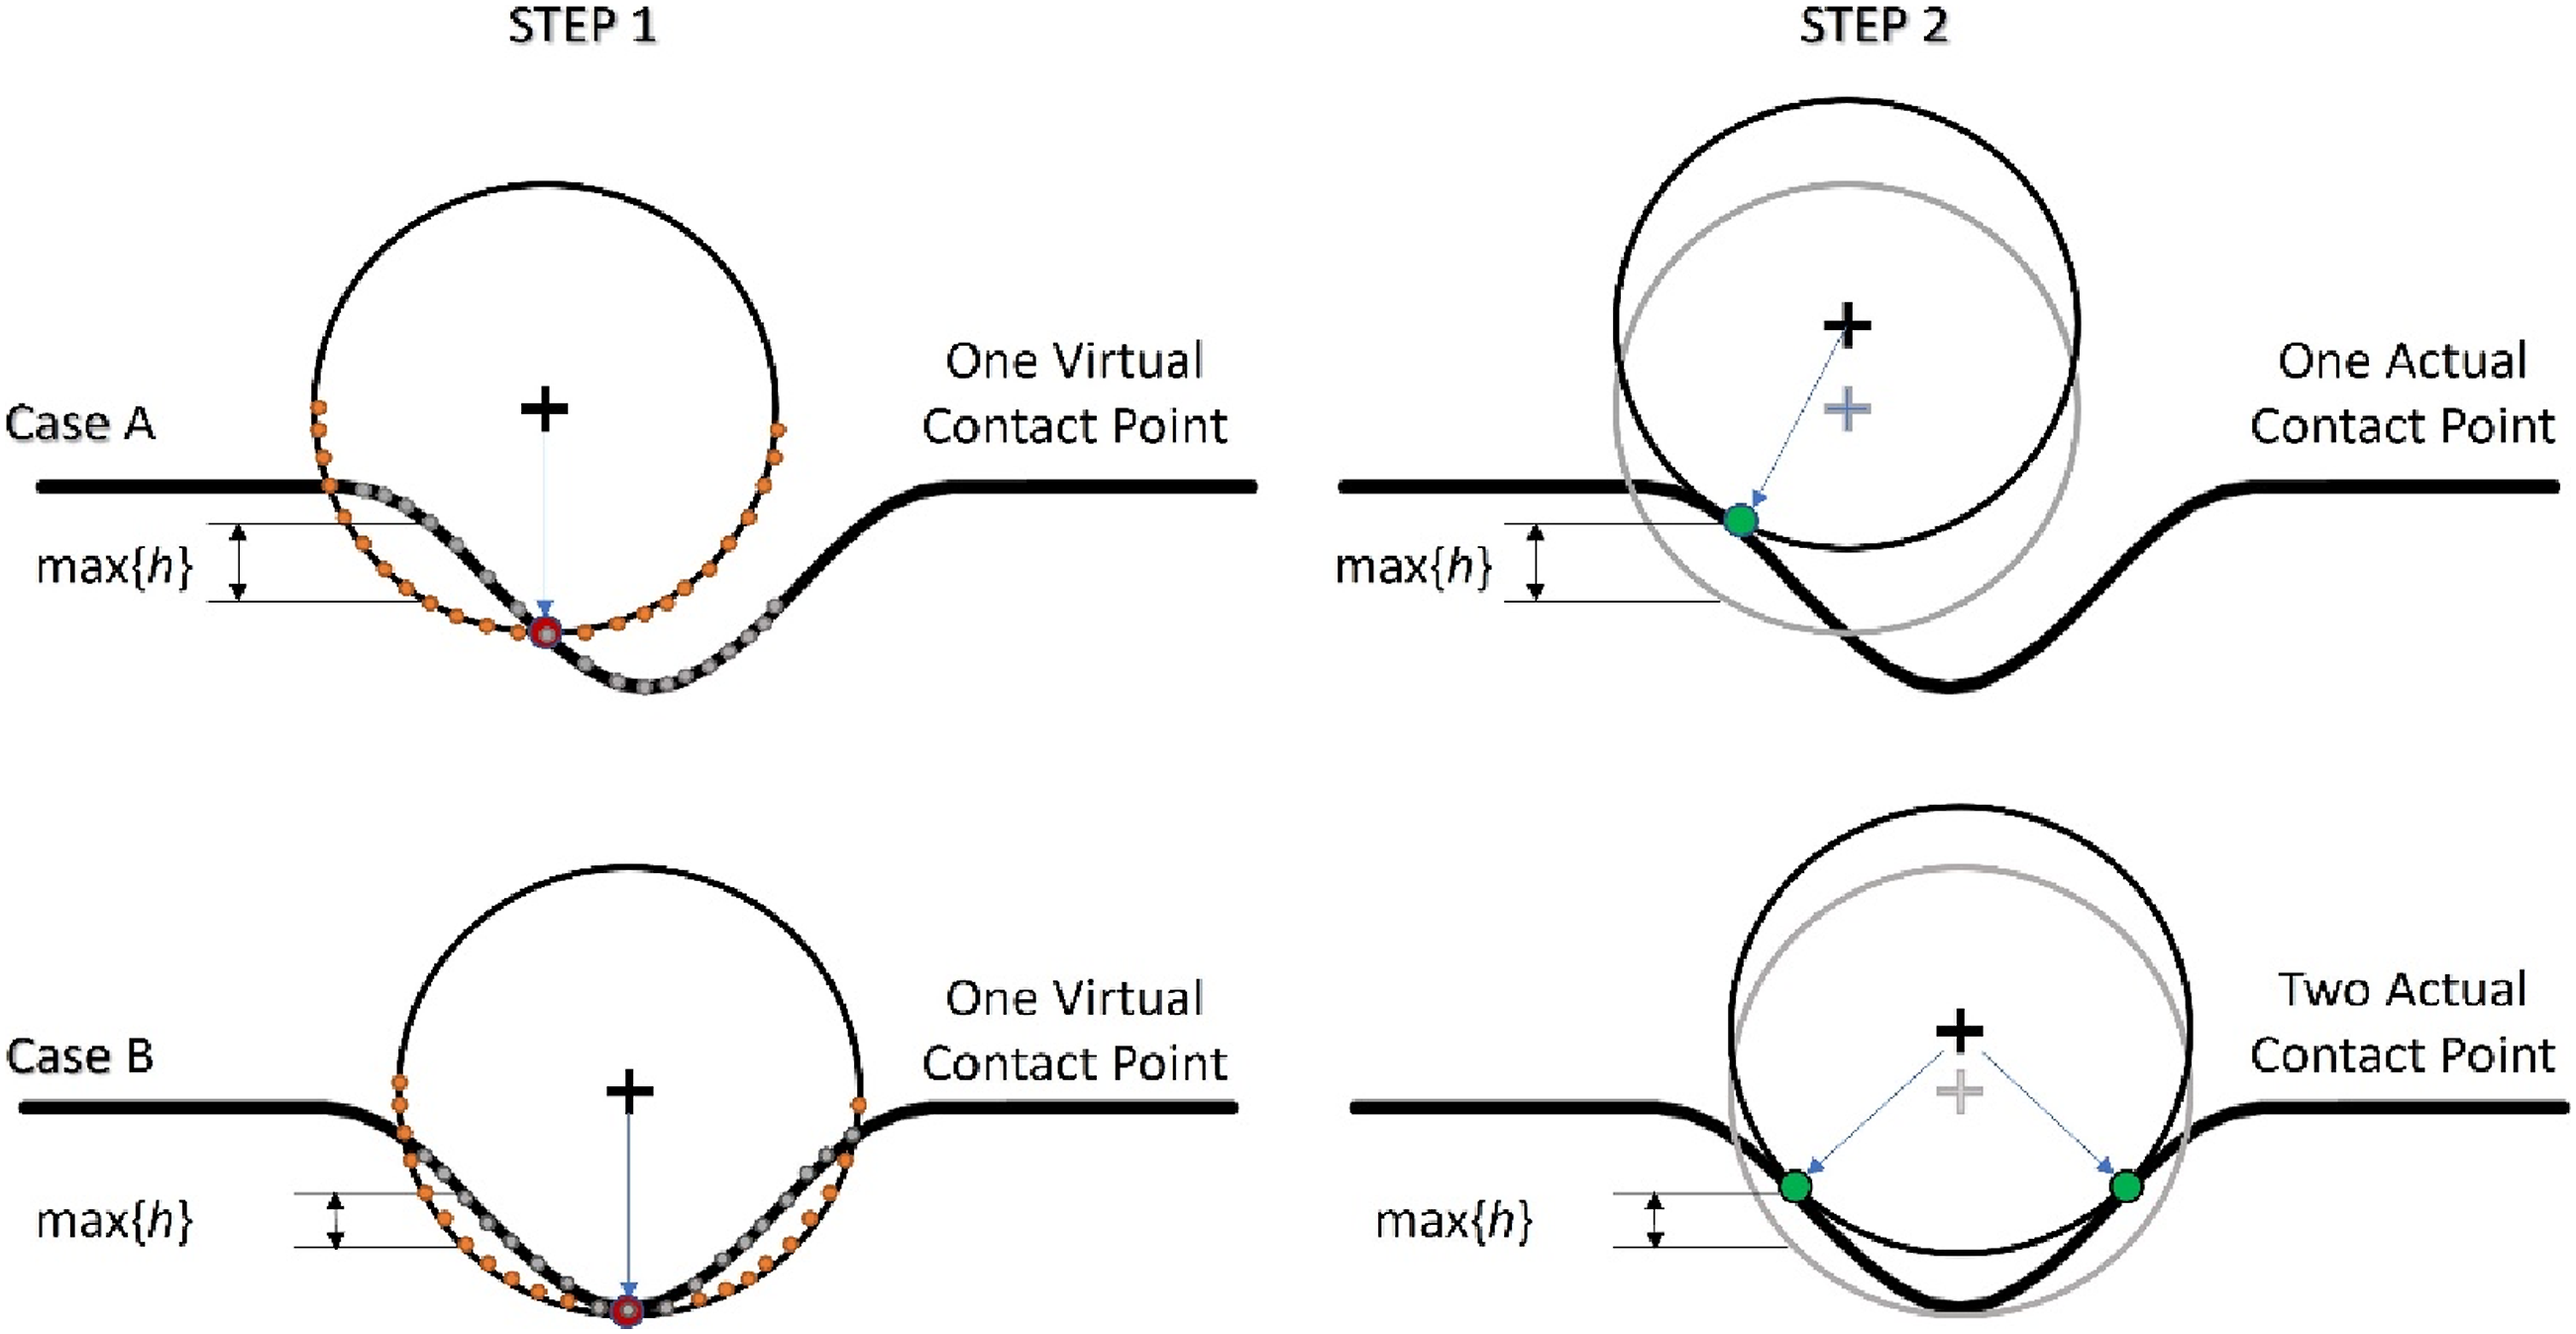
A circular wheel of radius

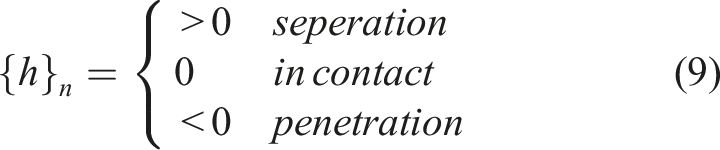
The first step assumes that the wheel center moves in the vertical direction based on the virtual path. The vertical distance,

The significance of considering the actual instead path of the wheel center instead of the virtual path is demonstrated in Figure 6. An RSSI of wavelength l = 60 mm and amplitude A = 1.5 mm is considered along with wheel diameters R
w
= 55, 45 and 20 cm. Figure 6(a) shows the development of the actual wheel-rail contact path as a 55 cm wheel radius rolls over the RSSI. The actual path is shown by the dotted line as it evolves during the wheel rolling at specific time instances. It is noted that one actual contact point is detected at all times except at t = t
4
, where two actual wheel contact points appear. In this case, the contact forces are computed through two Hertzian contact elements, placed at each actual contact point. Figure 6(b) shows the effect of the wheel diameter on the actual path. Actual contact path of center of wheel rolling over the proposed RSSI pattern: (a) development of path over time; (b) wheel-rail virtual and actual contact path for three wheel diameters.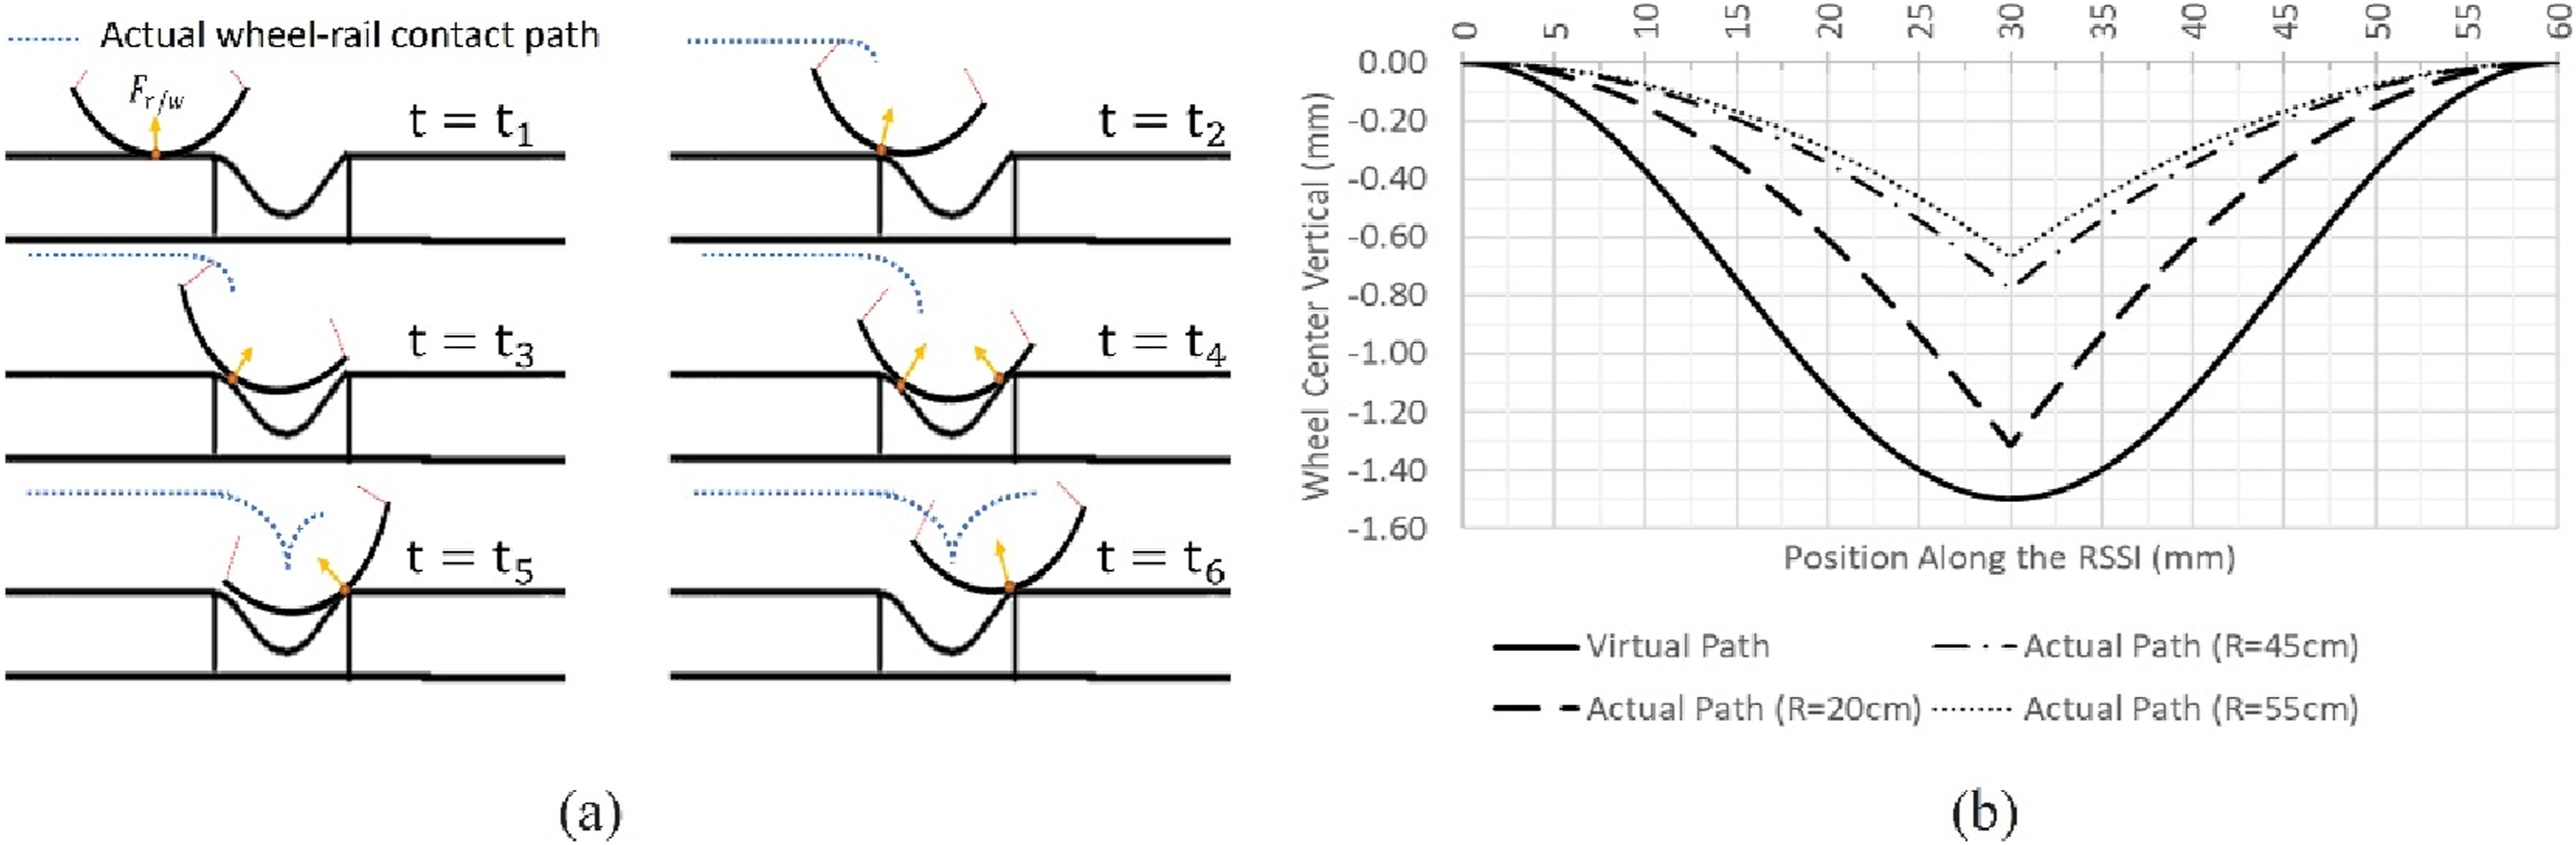
3. TTBI simulator
This section introduces the coupling of the models in Vehicle-Track Interaction (VTI) simulator used in parametric studies. The proposed VTI simulator solves the wheel-rail interaction problem in a STM form, and the method is validated through simulated measurements and benchmark solutions reported in the literature.
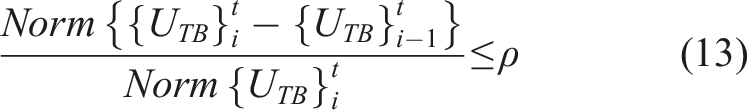
3.1. The coupling technique and the STM scheme
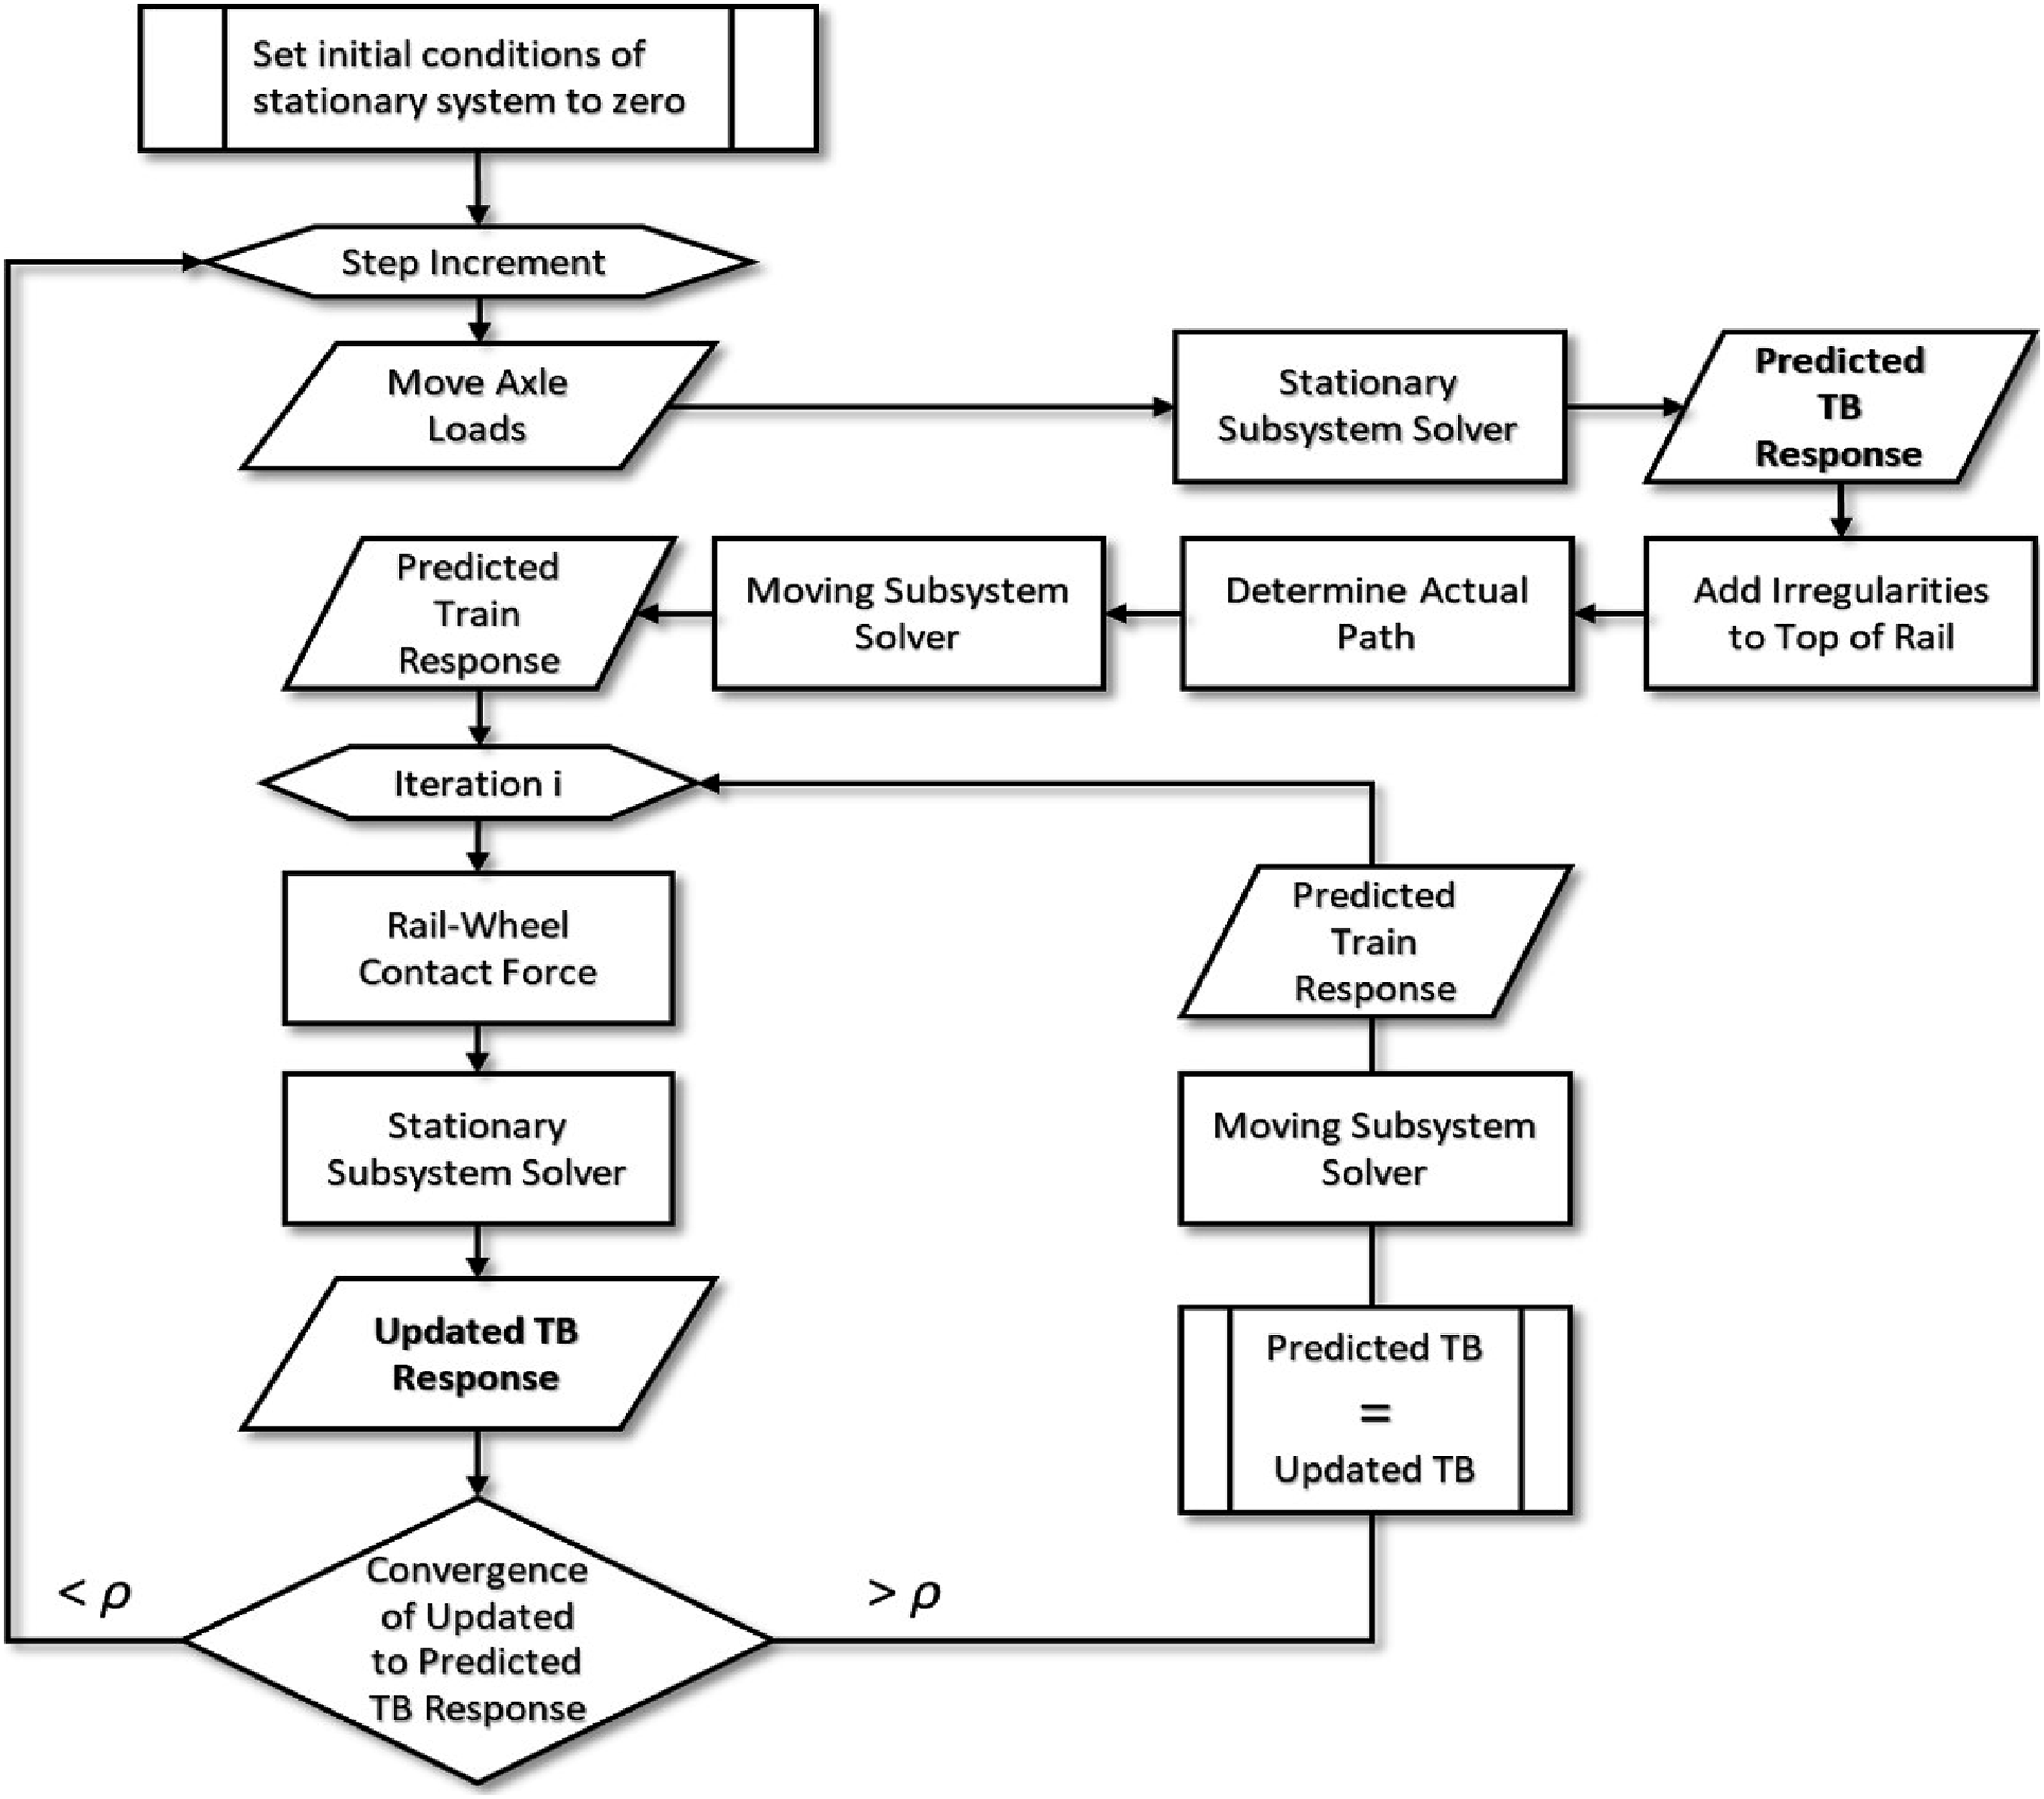
In this study, the STM approach is implemented, and a time-marching integration scheme is used with iterations within each time step to couple train and track-bridge subsystems at the actual contact points (O’brien and Rizos, 2005). A new iterative algorithm is proposed that integrates dynamic equations of both subsystems by the Newmark-β time marching scheme (Zhang et al., 2018). In order to improve efficiency and reduce computation time, all time-dependent coefficients and interaction elements are accounted for in the force vector. Additionally, this study uses an adaptive time step instead of the constant time step for the entire computation time, since the use of the latter would be inefficient and time-consuming (Zhu et al., 2019). For RSSI regions, a short time step is chosen to capture high-frequency components of wheel-rail interaction, and for other parts, a larger time step is chosen to capture coarse-scale dynamics of the track-bridge subsystem that do not require such high temporal resolutions (Yang and Hwang, 2016). The number of iterations for each step was optimally reduced, resulting in fast convergence (Lei et al., 2016; Wang et al., 2017). The workflow of the STM scheme is depicted in Figure 7 and the processes within each time interval are discussed next: Flowchart of the proposed STM algorithm.


3.2. Numerical validation study
To validate the proposed method, a widely used benchmark problem of the dynamic behavior of a simply supported beam under the moving sprung mass shown in Figure 8(a) is considered (Biggs, 1964). The STM approach is evaluated through comparisons with Finite Element Method (FEM) simulations in ABAQUS commercial software, Non-Iterative Coupling (NIC) methodology presented in (Datta et al., 2022), and AIVE program, as documented in (Ticona Melo et al., 2018). In Case 1, the proposed method is assessed with FEM and NIC techniques, representing a scenario where the system has no imperfections. Subsequently, to assess the presented contact algorithm and consider surface imperfections, Case 2 is introduced. This involves expanding the foundational model described in Case 1 by introducing a sinusoidal profile denoted as Numerical validation study (a) model schematic and parameters; (b) midpoint deflection (c) midpoint acceleration.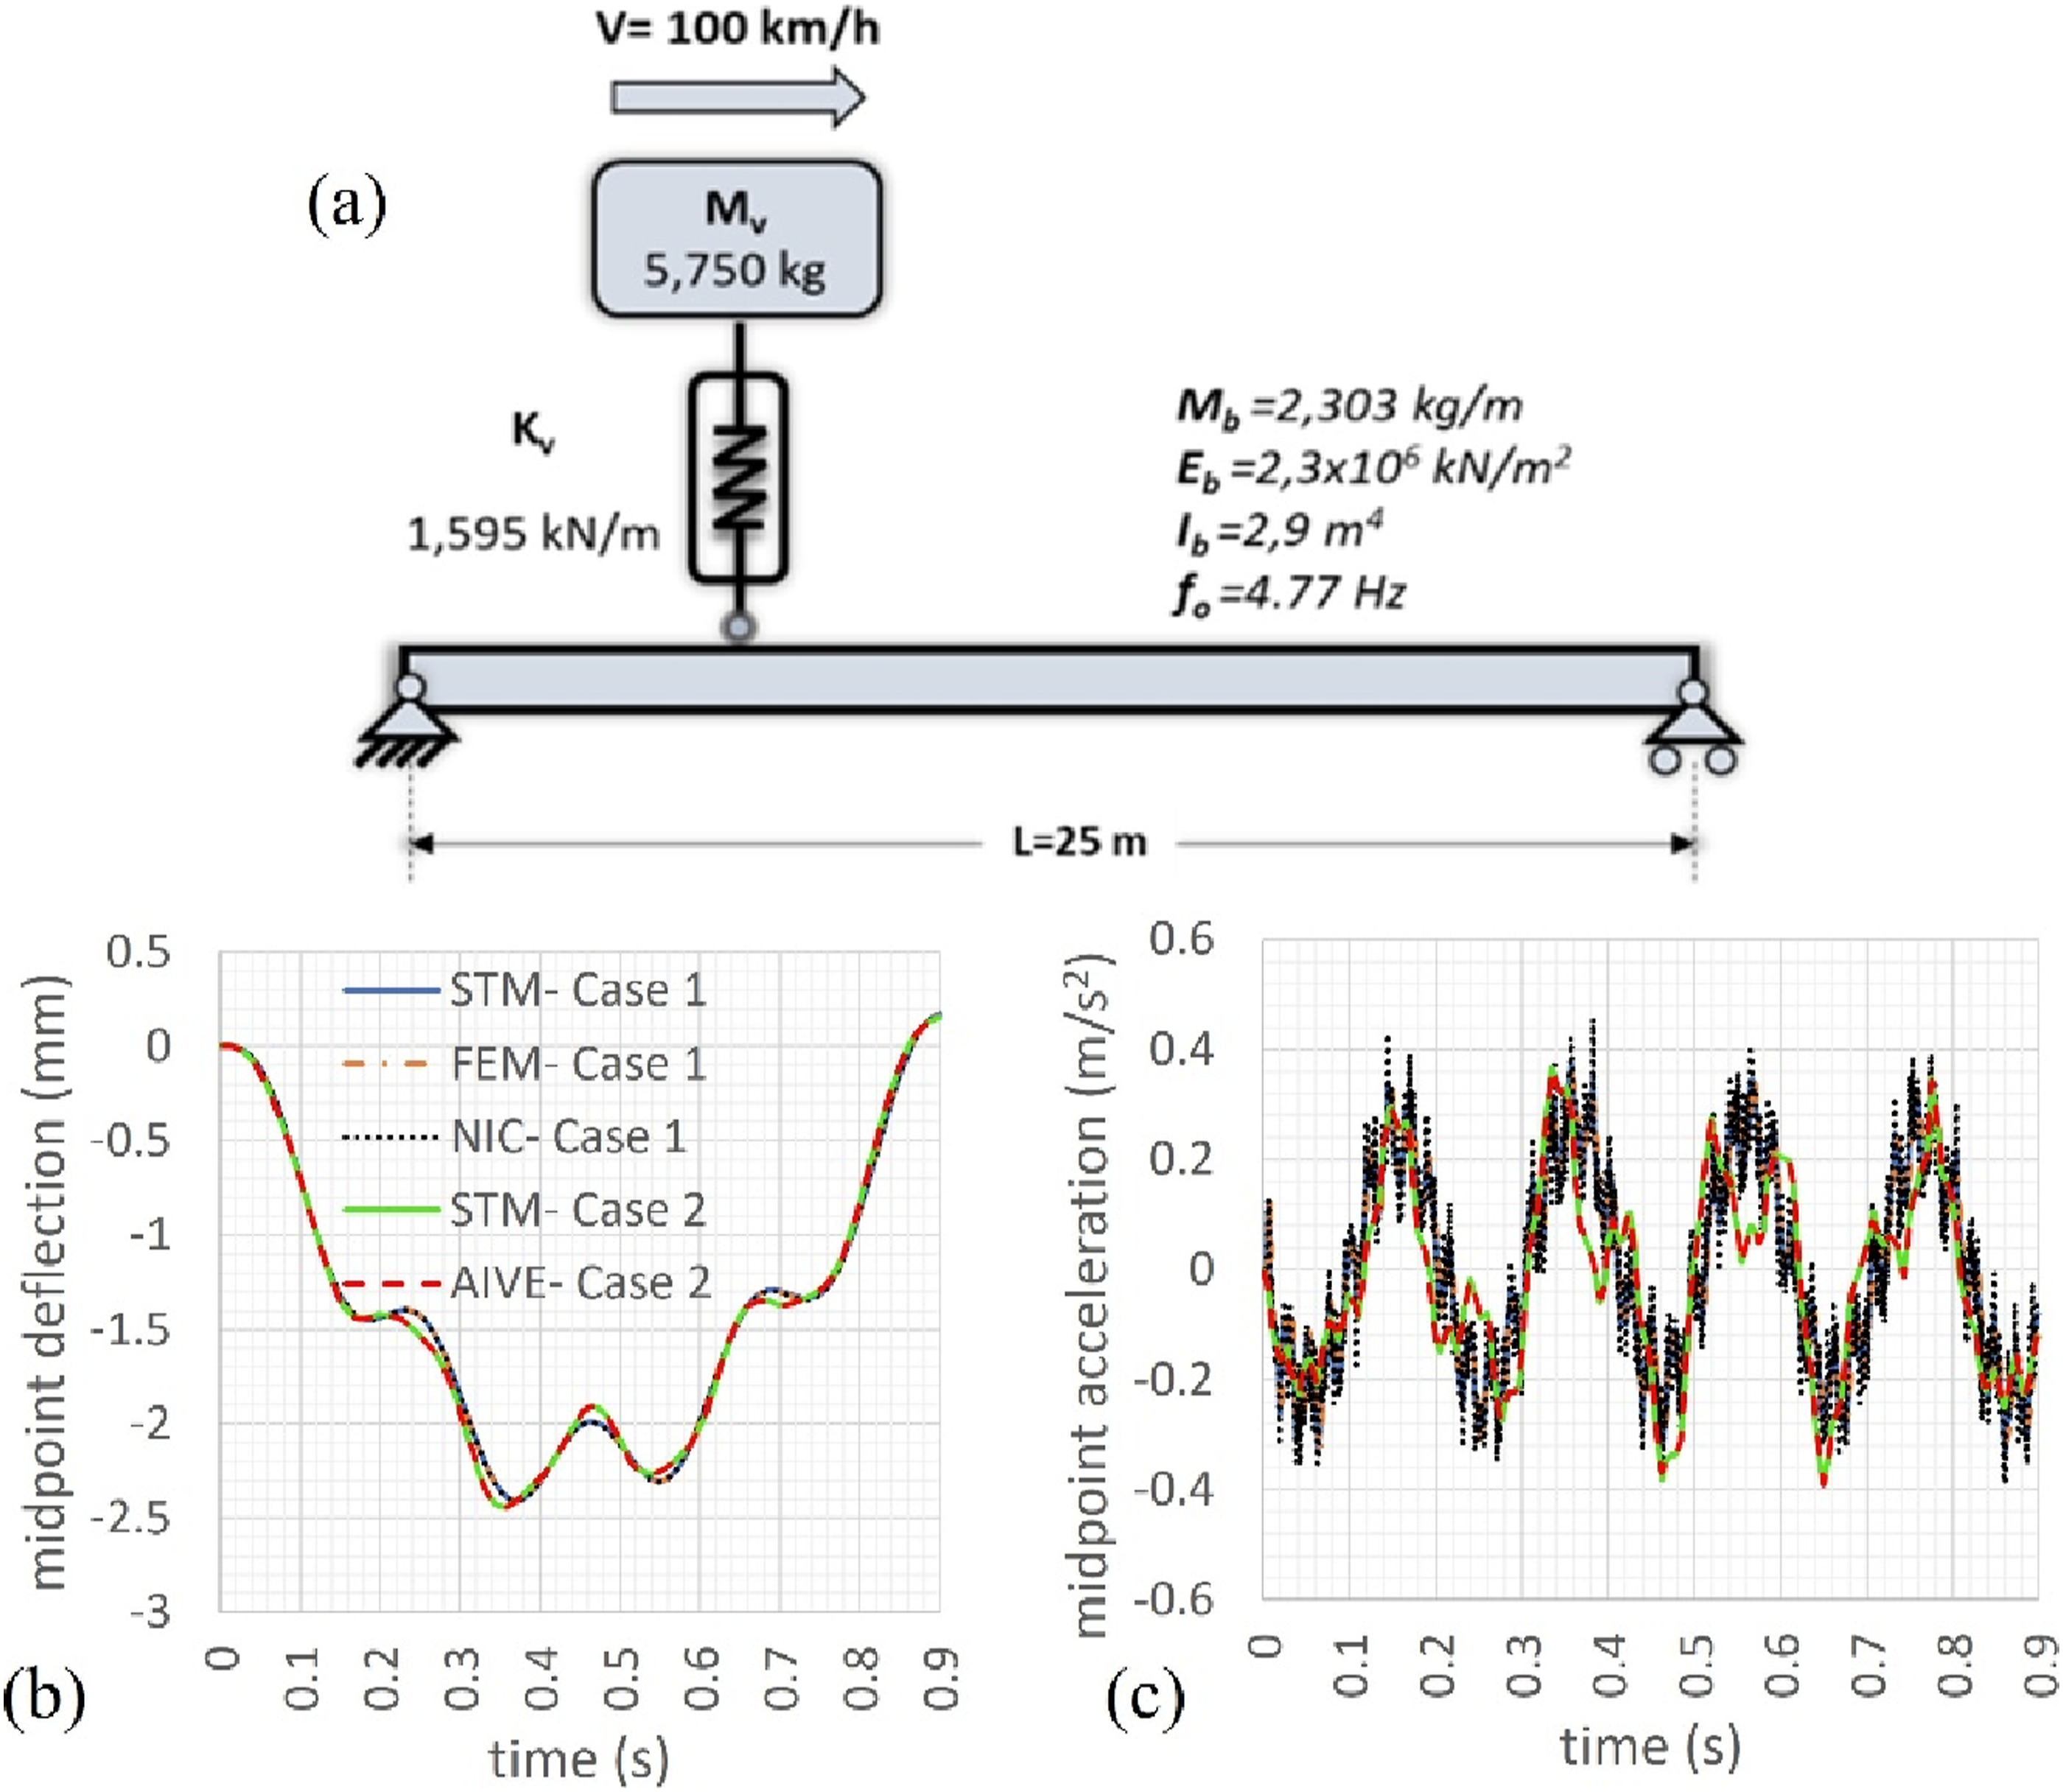
4. TTBI analysis and effects of RSSI on system response
4.1. Base model
The base model in this study is a 16 m, single-span bridge presented in (Yau et al., 1999). The physical and mechanical characteristics of the train and the ballasted track are adopted from (Zakeri and Xia, 2008), with consideration of ballast shear interlocking through the equation developed in (Heydari et al., 2023). The train model consists of three railcars with a total length of 74.5 m and an axle load of 195.7 kN (97.85 kN per wheel). The railcars are considered independently, and a constant train speed is maintained throughout the entire analysis. The RSSI profile is l = 60 mm long and A = 1.5 mm deep, and is evaluated based on a wheel radius of R w = 45 cm.
4.2. Evaluation of the RSSI effects on the dynamic responses
This section studies the influence of RSSI on the dynamic responses of the system. In the presence of RSSI, wheel-rail contact forces may significantly increase, as shown in Figure 9(a) for one case of the base model regarding the train traveling at 140 km/h over an RSSI placed at the quarter point on the bridge. Quantification of the RSSI effects on the bridge dynamic response: (a) wheel-rail interaction force; (b), (c), and (d) bridge midpoint deflection, velocity, and acceleration, respectively.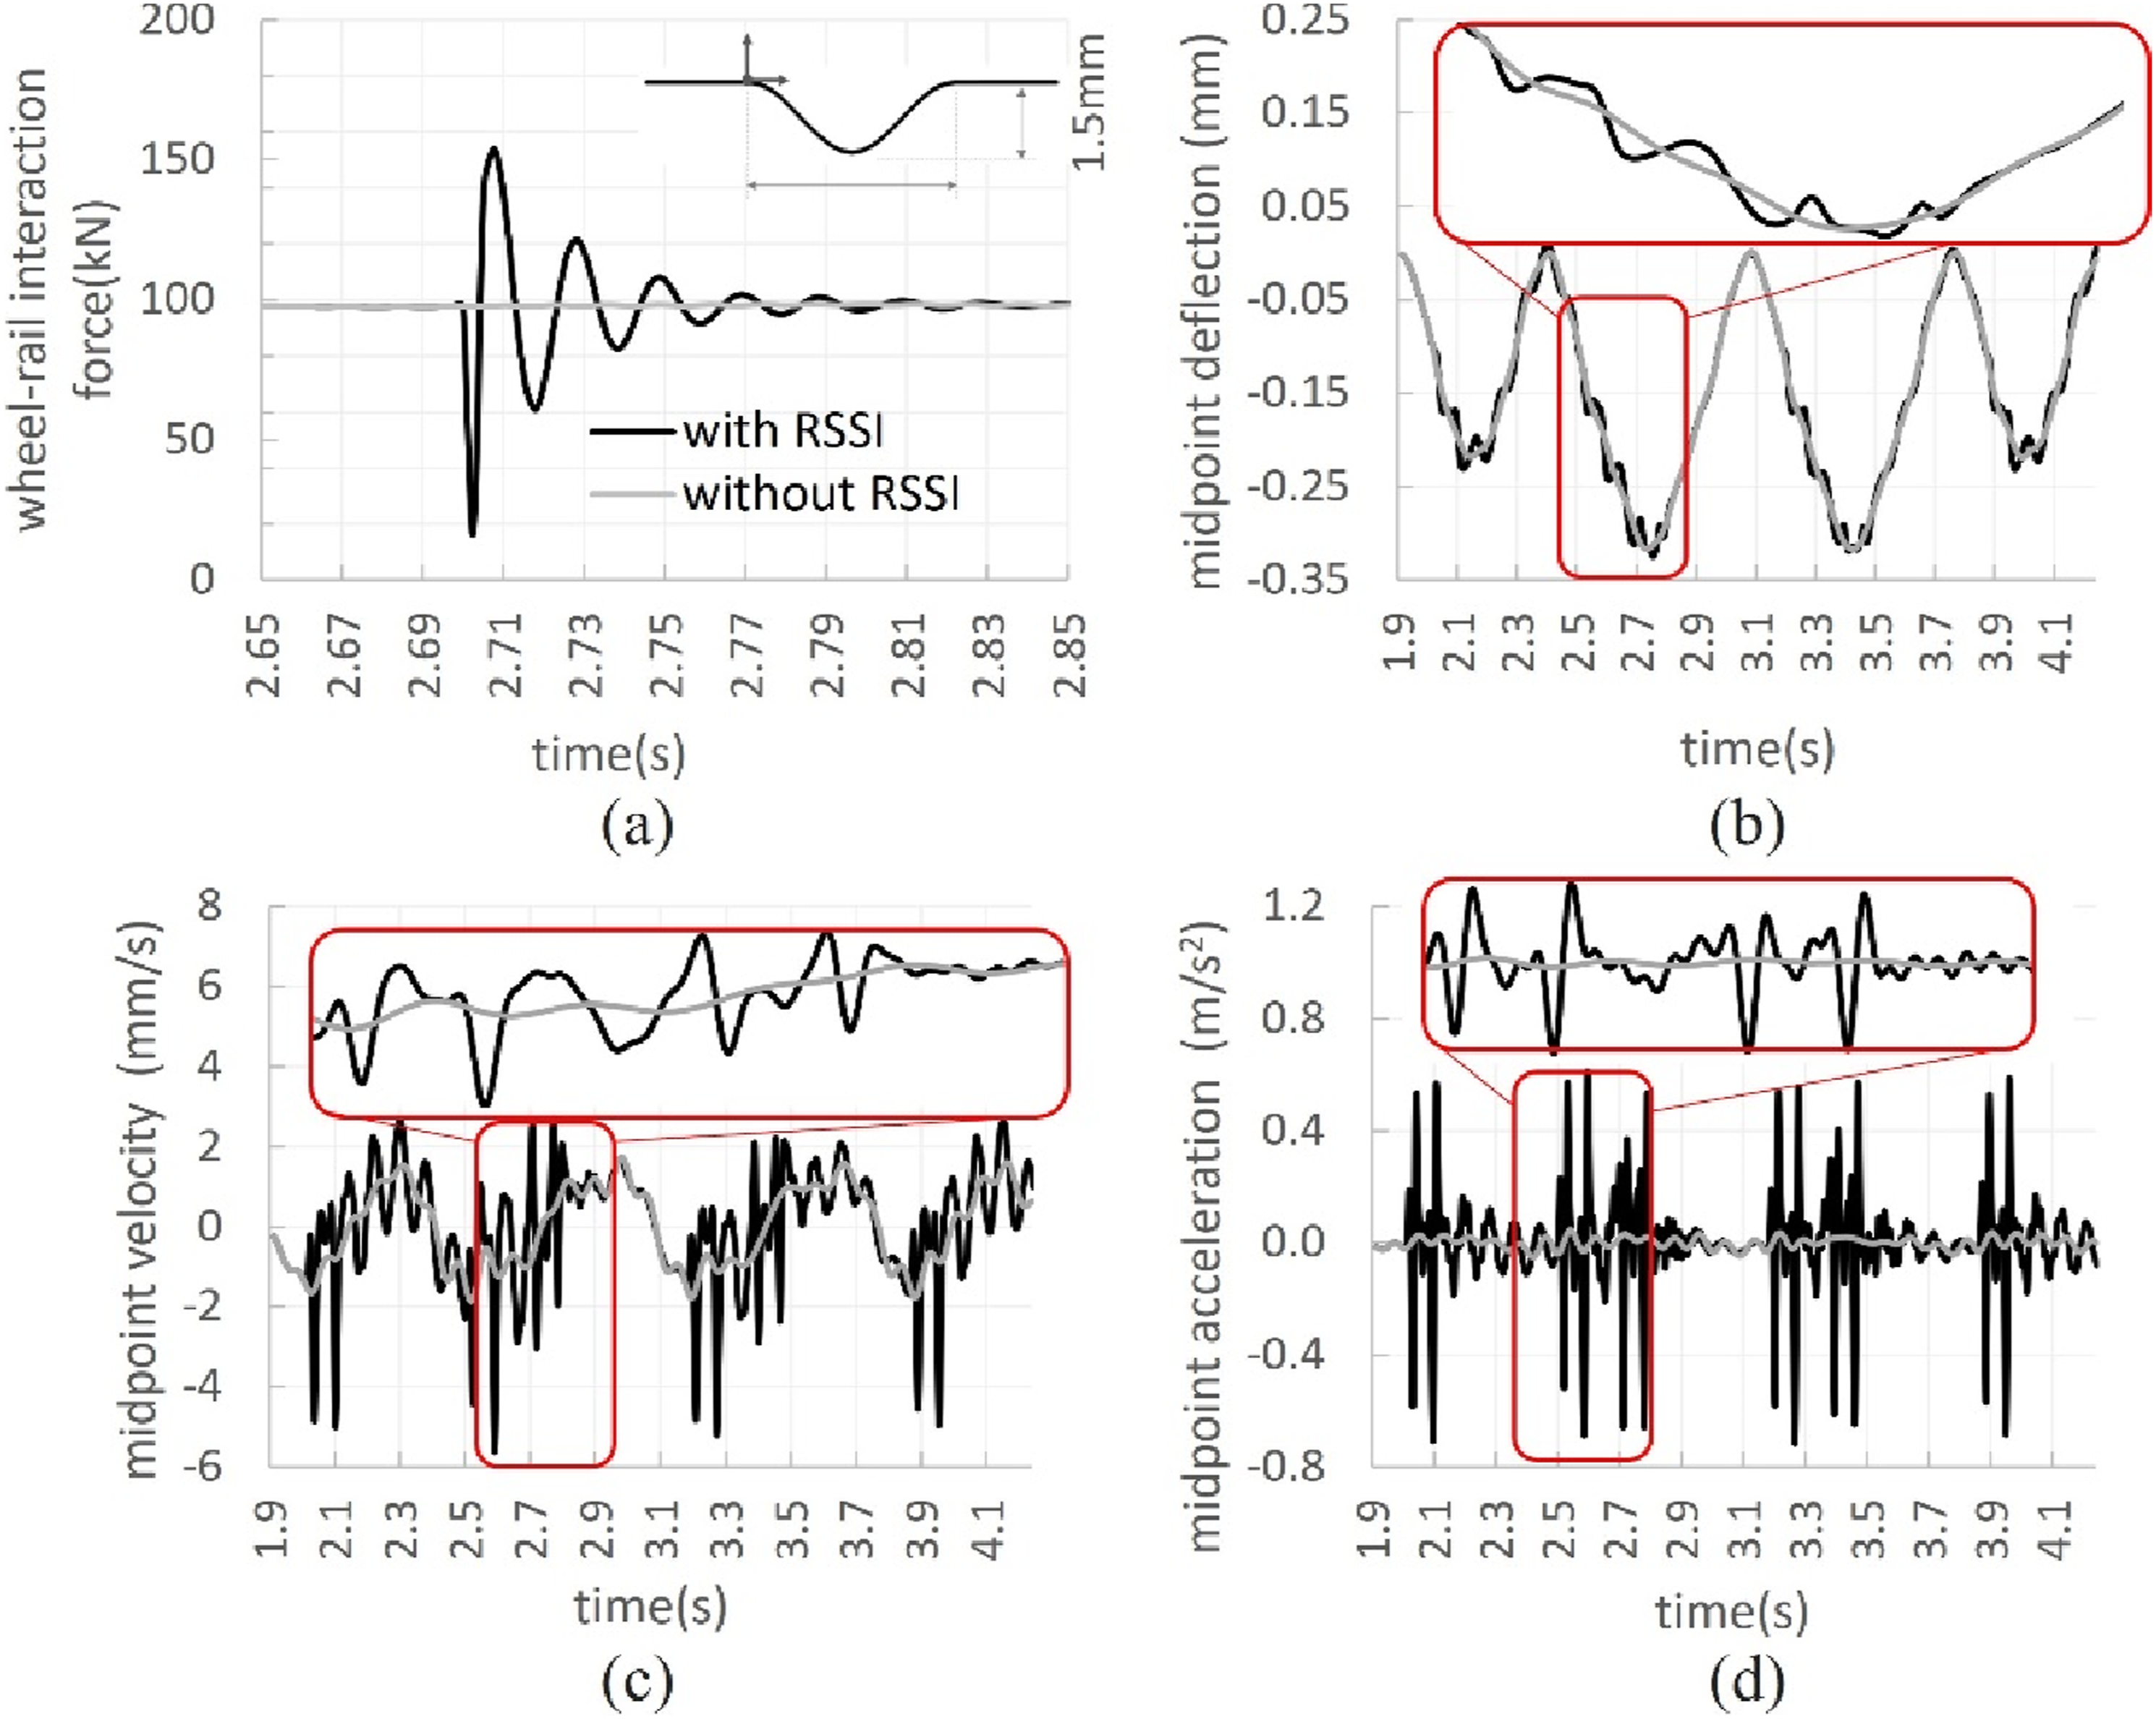
The wheel-rail force is amplified by as much as 60% as the wheel traverses the RSSI providing evidence that bridge performance may be adversely affected by this localized excitation. The deflection, velocity, and acceleration response time history of the bridge midpoint, with and without RSSI, are shown in Figures 9(b)–(d), respectively. Although the bridge midpoint deflection is slightly affected by RSSI, the corresponding velocity and acceleration response is considerably amplified. It is evident that bridge acceleration and velocity attain the maximum values as each axle passes over the RSSI. Considering that most bridge standards limit the maximum acceleration (Eurocode 1992-2, 2003; Code UIC 776-2R, 2009), the significant impact of the RSSI on the acceleration response needs to be addressed in view of predictive and/or preventive maintenance for rail surface damage. In addition to the dynamic effects induced by an individual axle traversing the RSSI, it is essential to note that axle spacing and train speed, induce periodic excitations that may stimulate different bridge vibration modes. Figure 10 demonstrates the bridge deformed configurations at time instances when: (i) the 5th train axle (ii) the 6th train axle (iii) the center of gravity of the middle railcar and (iv) the 8th train axle crosses over the RSSI. Effects of RSSI on bridge spatial responses (solid line: with RSSI and dash-dot: without RSSI): (a) axle spacings (in meter) and arrival times (in sec) (b) deflection (c) velocity (c) acceleration.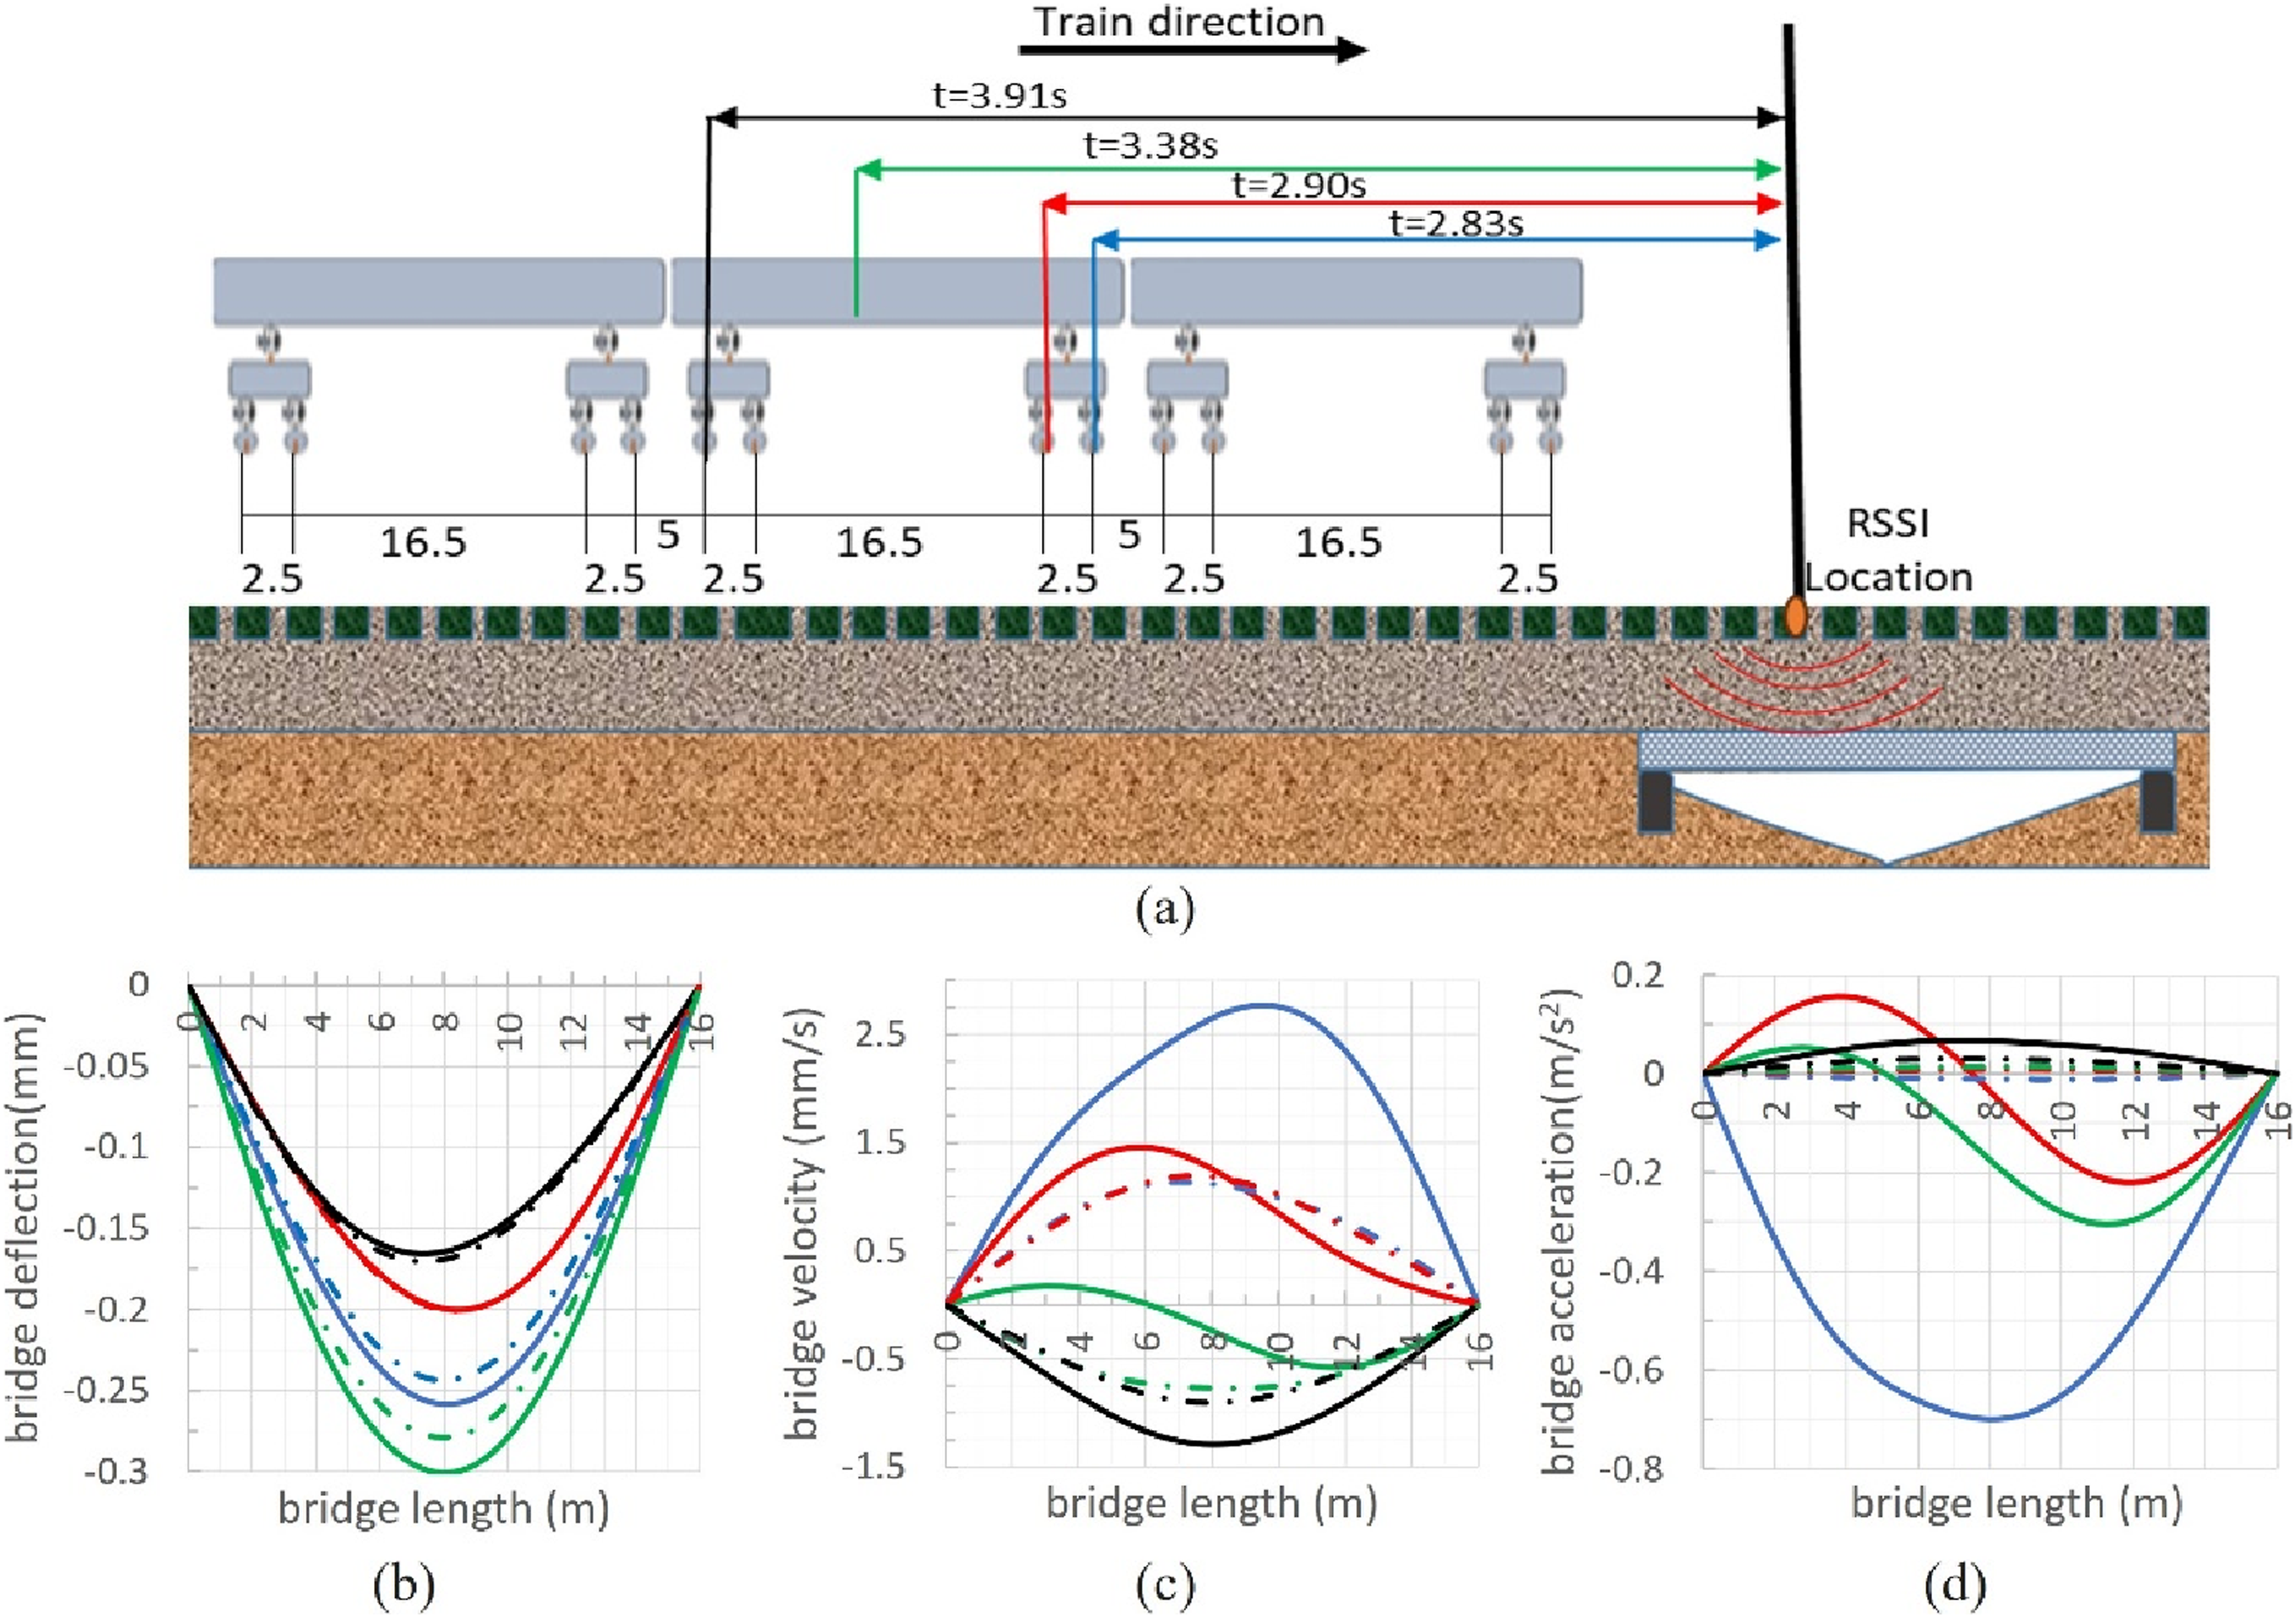
The findings indicate that in the absence of RSSI, the bridge predominantly exhibits motions aligned with its first mode. However, upon introducing RSSI, the bridge velocity and acceleration exhibit vibrations that include the second, or higher modes.
4.3. Effects of RSSI location on bridge response
The effects of the location of the RSSI on the bridge acceleration response is studied by locating a single RSSI at the 1/8th- points along the bridge span, while the train speed varies in the range of 40 to 200 km/h, resulting in a total of 153 analysis cases. Figure 11 represents graphically the maximum bridge acceleration as a function of train speed and RSSI location for all cases considered. As the train crosses the RSSI at a certain speed, the various axle spacing combinations, for example, axles in a bogie (2.5 m), axles in adjacent bogies (5, 7.5 and 10 m), etc. induce periodic excitations at distinct periods. On the other hand, the first three natural periods of the simply supported, unloaded bridge are T
1
= 0.18, T
2
= 0.05, and T3 = 0.02 s, respectively (Unsworth, 2017). In view of the excitation periods and bridge natural periods, resonance at a specific bridge mode is induced at the critical speeds also listed in Figure 11. It is noted that the presence of RSSI has significantly amplified bridge acceleration. This effect is particularly noticeable when RSSI is positioned at the 2/8th and 6/8th of the bridge span, and a train speed of 180 km/h as indicated by the prominent peaks depicted in Figure 11. Considering the minimum axle spacing of 2.5 m and a train speed of 180 km/h the corresponding excitation period is T
e
= 0.05 s. This period is consistent with the second mode of the bridge, as listed in Figure 11. Therefore, the maximum response values are expected to appear at the 2/8th and 6/8th points of the bridge for RSSI locations at the same points. It is also evident that when the same RSSI is placed at the midspan, which is the location of the node of the second mode, the effects of RSSI are minimum. Maximum acceleration of the bridge and train critical speeds.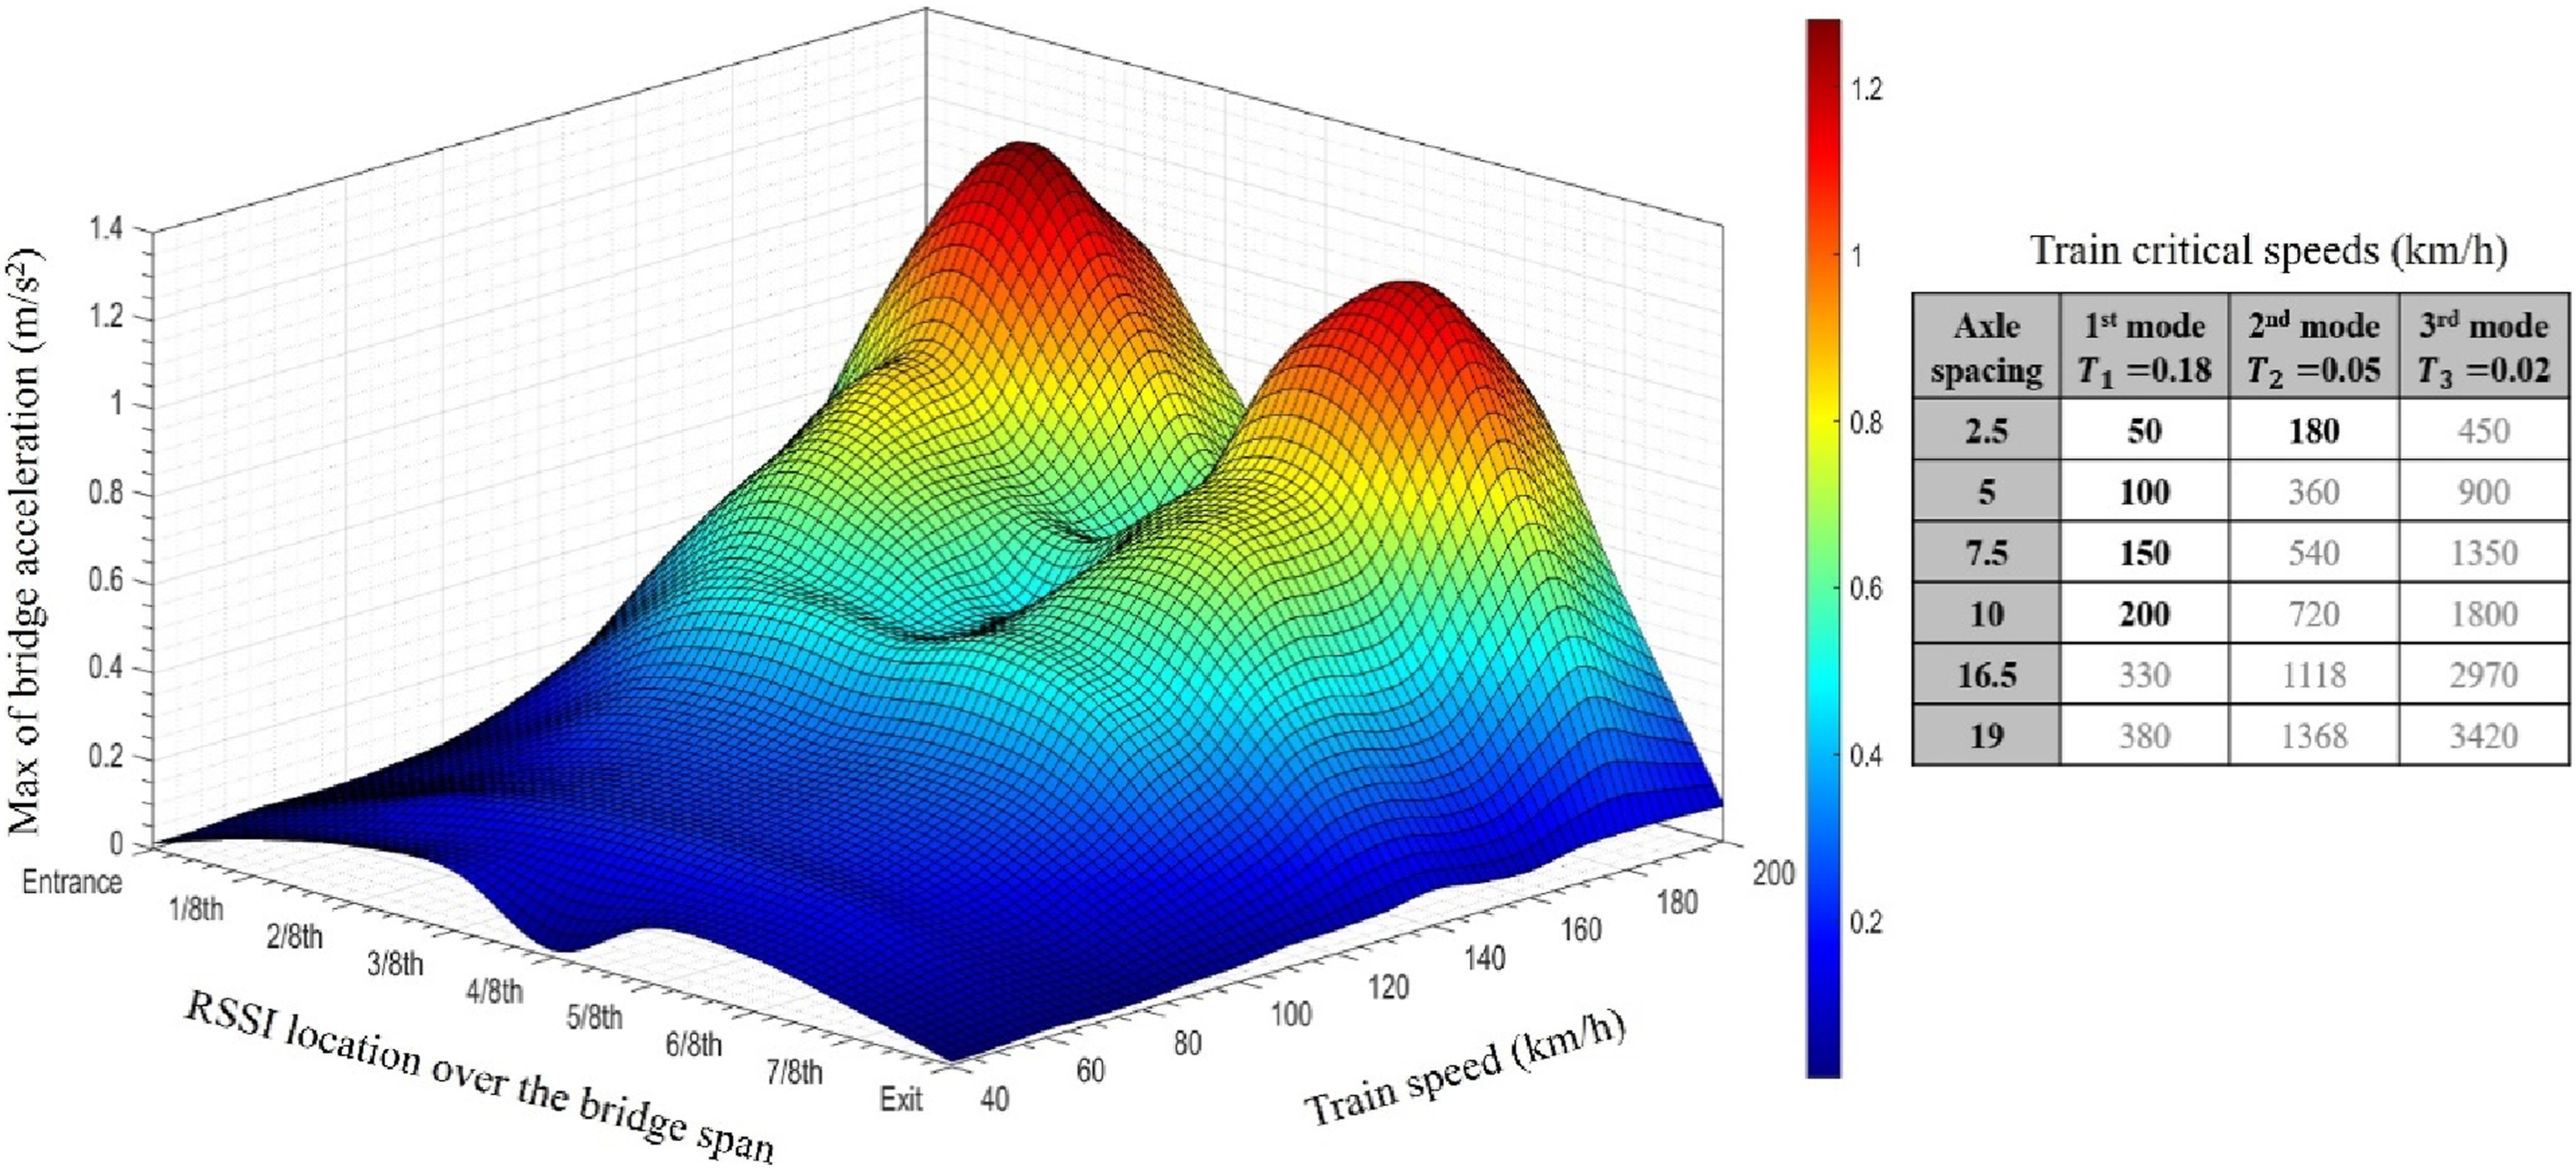
Furthermore, as depicted in the 3D plot, both the 1st and 2nd modes of the bridge are stimulated within a typical train speed range, with the 2nd mode exhibiting the higher participation for a combination of RSSI location and train speed. In summary, comparing the different cases shows that bridge acceleration increases as the train crosses the RSSI location at a higher speed while the presence of RSSI contributes significantly to the 2nd, or higher, modes of the response, particularly in shorter spans.
The maximum applied forces at the ballast-bridge interface arising from wheel-rail interactions as the wheel crosses over the RSSI have been examined for all analysis cases and the results are presented in Figure 12. It is shown that, for a specific train speed, the interface force experiences an increase of up to 15% due to the induced impacts at the RSSI location. The ballast-bridge interface forces and corresponding bridge deformations are dominated by the moving train and bridge gravity loads which are expected to cause the maximum deflections approximately at the bridge midspan when the heaviest axle groups travel over the midspan. However, velocity and acceleration are dominated by the impact force induced by the RSSI, which excites higher bridge vibration modes. Consequently, while the maximum deflection and ballast-bridge interface force are observed at the midpoint, as expected, the maximum acceleration is observed at the 2/8th and 6/8th points, consistent with the second vibration mode. Additionally, the interface forces are slightly higher in the first half of the bridge span, given that the train direction is towards the midspan while in the second half the direction is towards the bridge end support, therefore, the second amplitude of the wheel-rail contact force (P
2
) in the first half is closer to the midpoint. Maximum applied force (kN) at the ballast-bridge interface.
4.4. Evaluation of RSSI size
Varying RSSI size (length and depth) on both the bridge and wheel-rail contact force is evaluated in this section. The RSSI in this analysis is 0.5 mm deep, consistent with a median depth measured in the field (Krishna et al., 2020), while its length varies from 40 mm to 1 m. The imperfection is strategically placed at midspan and the train speed for all cases is assumed to be 100 km/h at which bridge performance is minimally affected by the RSSI location. Figure 13(a) and (b) depict the maximum acceleration on the bridge and the maximum wheel-rail contact force, respectively, as functions of the RSSI length. It is observed that RSSI results in an overall increase in the wheel-rail force. RSSI introduce short discontinuities that induce, in essence, localized impacts resulting in an overall increase in wheel-rail interface force. When the surface defect is relatively small compared to the wheel radius, RSSI acts as an obstruction or local irregularity in the wheel path leading to instantaneous excitation and to an increase in the wheel-rail contact forces. As long as the RSSI length is smaller than the wheel radius, a larger imperfection leads to higher vibration. In contrast, when the RSSI length exceeds the wheel radius, the wheel is rolling over a smoother surface and does not encounter an abrupt profile change. Consequently, as the defect length increases and the wheel rolls over it, the impact is less severe, leading potentially to a decrease in contact force. Effects of RSSI length on (a) bridge response (b) wheel-rail contact force.
Figure 14 provides a visual representation of the maximum wheel-rail contact force and bridge acceleration, considering a 6 cm long RSSI with profile amplitudes in the range −0.8 mm to 0.8 mm representing profile peaks and valleys. The RSSI is placed at the midpoint of the bridge and the train speed is 100 km/h. The chosen profile amplitude is based on the maximum depth the wheel (R
w
= 45 cm) can reach at the assumed RSSI. It is evident that even slight changes in RSSI amplitude result in significant amplification of dynamic system responses. For example, the maximum wheel-rail force increases from around 100 kN on a smooth surface to 148 kN (48%) and 210 kN (110%) for profile valleys and peaks with a 0.8 mm amplitude. Similarly, the bridge acceleration increases significantly from 0.05 m/s2 to approximately 0.22 m/s2 (340%) and 0.27 m/s2 (440%), respectively. This emphasizes the substantial excitation of the bridge due to induced vibrations in the wheel-rail system caused by RSSI. Effects of RSSI cavity (amplitude <0) and bulge (amplitude >0) shapes on: (a) bridge response (b) wheel-rail contact force.
5. Conclusions
The dynamic impacts of RSSI on the concrete bridge vibrations were investigated. Initially, an iterative multi-point contact strategy was developed, and the actual wheel-rail contact path was established which led to deriving the real wheel-rail contact force at RSSI. Then an STM coupling procedure was introduced to link the moving and stationary subsystems. The proposed method was verified with FEM simulations and other techniques described in the literature. The following findings were derived from the present study. ▪ The study revealed that even slight changes in RSSI amplitude result in significant amplification of dynamic system responses. ▪ Studying the effects of short length rail surface imperfections, like RSSI, needs to consider the actual wheel-rail contact path to properly account for the dynamics of wheel-rail coupling. RSSI induces impact forces that increase wheel-rail forces and bridge vibration, especially when the defect is smaller than the wheel radius. Conversely, when the defect length exceeds the wheel radius, the wheel can smoothly roll over it, potentially reducing contact forces. ▪ It is demonstrated that RSSI affect significantly wheel-rail interactions and bridge vibration. This RSSI induced vibration affect slightly bridge deflections, but RSSI induced vibrations, as the wheels cross over RSSI, stimulate bridge velocity and acceleration at higher modes. ▪ The RSSI-induced excitation stimulates the second velocity and acceleration vibration mode of the single-span bridges and this excitation is amplified when the RSSI is located at 1/4th or 3/4th of the span. ▪ The results indicate that the force excitation applied at the ballast-bridge interface experiences an increase of up to 15% due to the induced impacts at the RSSI location.
Further studies may consider the length of the span and freight versus passenger trains.
Footnotes
Declaration of conflicting interests
The author(s) declared no potential conflicts of interest with respect to the research, authorship, and/or publication of this article.
Funding
The author(s) received no financial support for the research, authorship, and/or publication of this article.