
Abstract
This paper demonstrates the feasibility of simultaneously identifying both the location and severity of structural damage in a beam by using two independent moving load experiments. First, a simple but sufficiently accurate single degree of freedom model is presented to simulate the structure efficiently over a wide range of relevant inputs. We then introduce a damage sensitive feature (DSF) based on the integral of the velocity time history of the beam at its midspan when the load moves over the beam. A critical velocity, a function only of the beam’s first natural frequency and length, is obtained for the proposed DSF, upon which the damage can be located more accurately. The only required data for the damage detection is the midspan velocity-time history of the cracked beam subjected to a moving load, and the midspan static deflection of the intact beam subjected to a load of the same magnitude. In the last section of this paper, the capability of the proposed DSF is examined in the presence of noise. The results demonstrate the capability of the proposed method to find both the damage location and severity successfully, and methods for further reducing the effects of noise are suggested.
Keywords
1. Introduction
The advantages of the moving load-based damage detection methods have been mentioned by several researchers (Li and Zhao, 2006; Link and Weiland, 2009; He et al., 2017)—the key ones are:
the devised procedures are usually close to the operational condition of a bridge structure hence a real experiment is very easily conducted; as the structure can be excited to vibrate with a moderately large amplitude, a high signal-to-noise ratio is achievable; and more often than not the number of sensors required is fewer than in other structural health monitoring techniques.
Solutions to the problem of finding damage on a beam subjected to a moving load can be categorized according to the type of the applied method (finite element (FE) based method or nonFE based methods), the type of crack (open or breathing), and the feature being detected (severity or location of the crack).
Recent nonFE based damage detection using a moving load can generally fall into two main categories: wavelet transform (WT), and Hilbert–Huang transform (HHT) based techniques (He et al., 2017). The main characteristics of these methods is that they attempt to detect a peak in the transformed vibration time history of the structure.
Zhu and Law (2006) introduced a WT based damage detection method that analyses the deflection-time history of the bridge subjected to a moving load. Accordingly, any crack damage will induce an abrupt change in the spatial variation of the WT of the structural response. In another study, Pakrashi et al. (2010) successfully related the WT phase space of the structural response obtained from strain gauges to the presence of cracks in the structure. They also investigated how noise and vehicle configuration affect the proposed method.
He and Zhu (2016) state that the dynamic response of a beam with an open crack subject to a moving load is a superposition of the time varying frequency component due to the moving load and the natural-frequency component of the beam. Hence, they exploited a multi-scale discrete WT to separate the time varying frequency component from the total dynamic response to locate the damage on a simply supported beam (SSB) subjected to a moving load.
The HHT based techniques have also been used by several researchers in this context. The HHT employs a procedure called empirical mode decomposition (EMD) to find the changing modal frequencies over time of a nonstationary signal. EMD decomposes the signal by recursively subtracting intrinsic mode functions (IMFs) that are constructed by fitting splines to the peaks and troughs and averaging them. The resulting IMFs are generally smooth locally sine-like functions with gradually varying amplitude and frequency, and it is possible to define an instantaneous frequency by differentiating the phase of the analytic representation of the IMFs. Roveri and Carcaterra (2012) introduced a novel method that applies the instantaneous frequency of the first IMF of the structural force response to locate an open crack along the beam span. Although the proposed method is not model-based and is relatively insensitive to noise, it cannot determine the severity of the damage. In another study, Meredith et al. (2012) introduced a two-stage strategy based on moving average and the EMD to construct a damage feature from the acceleration response of the bridge subjected to a moving load. First, the moving average is applied to the acceleration response of the structure to improve its sensitivity towards damage, and then the EMD is used.
NonFE based methods typically use a simplified model (e.g., single degree of freedom (SDOF)) of the beam in order to perform the many simulations necessary to study the proposed damage detection method. In contrast, FE based methods offer a first-principles approach to determining the structure’s response to stimuli, but often at significant additional computational cost, hence they are more used for the direct than the inverse problem.
Recently, He et al. (2017) introduced a model-based damage detection technique that used the FE method to calculate and compare the quasi-static moving-load induced displacement response of the undamaged and damaged structures. They also used discrete WT for denoising the signal. To investigate the damage in the structure, they introduced a two-stage damage detection procedure based on the change in the area of the region encircled by the displacement influence line.
Nguyen (2013) introduced a wavelet-based strategy for the detection of open and breathing cracks in a vehicle–bridge system subjected to a moving vehicle. He shows that, based on simulations, the amplitude of vibration of the structure is smaller when the crack breathes, but that the peaks in WTs are larger in the case of having a breathing crack compared to an open crack. However, overall, his proposed method is more robust with respect to noise for detection of a breathing crack.
The sudden stiffness reduction in the structural response has been addressed in the literature. Aied et al. (2016) studied the acceleration response of a bridge model subjected to a moving load using ensemble empirical mode decomposition (EEMD) for a sudden stiffness change due to damage. The advantage of EEMD is its ability to separate high frequency components related to the sudden stiffness reduction from other frequency components associated with the interaction between the vehicle and bridge. Other techniques such as genetic algorithm have also been used for the damage detection in a bridge subjected to a moving vehicle (Li and Au, 2014).
Although most of the above studies are capable of pinpointing the location of the damage, it is still an unresolved issue to propose a damage index that reliably quantifies the severity of damage at the same time (He et al., 2017). Moreover, the lack of a decent SDOF model for vibration analysis of cracked beams has been noted by authors despite some existing methods for vibration analysis of an SSB with a breathing crack (Bakhtiari-Nejad and Mirzabeigy, 2013). Hence, in this paper, we first propose a simple SDOF model for vibration analysis of a cracked beam. Then, a novel method that can find both the location and severity of a crack in an SSB (bridge model) subjected to a moving load is proposed. The technique can also be applied to monitor growth of the crack through time. It can be used alongside other techniques that are capable of raising an early alarm as soon as a crack occurs but are not able to find the position or severity of it.
2. Direct problem definition and solution
2.1. Governing equations
In this sub-section an equivalent SDOF model for simulating the vibration time history of an SSB with an open crack subjected to a moving load is proposed.
The full system being modeled is shown in Figure 1(a). It consists of a beam of length L, with rectangular cross-section of height h and width w, hence flexural rigidity (a) simply supported beam subjected to a moving load; and (b) equivalent single degree of freedom model of the vibration of the beam.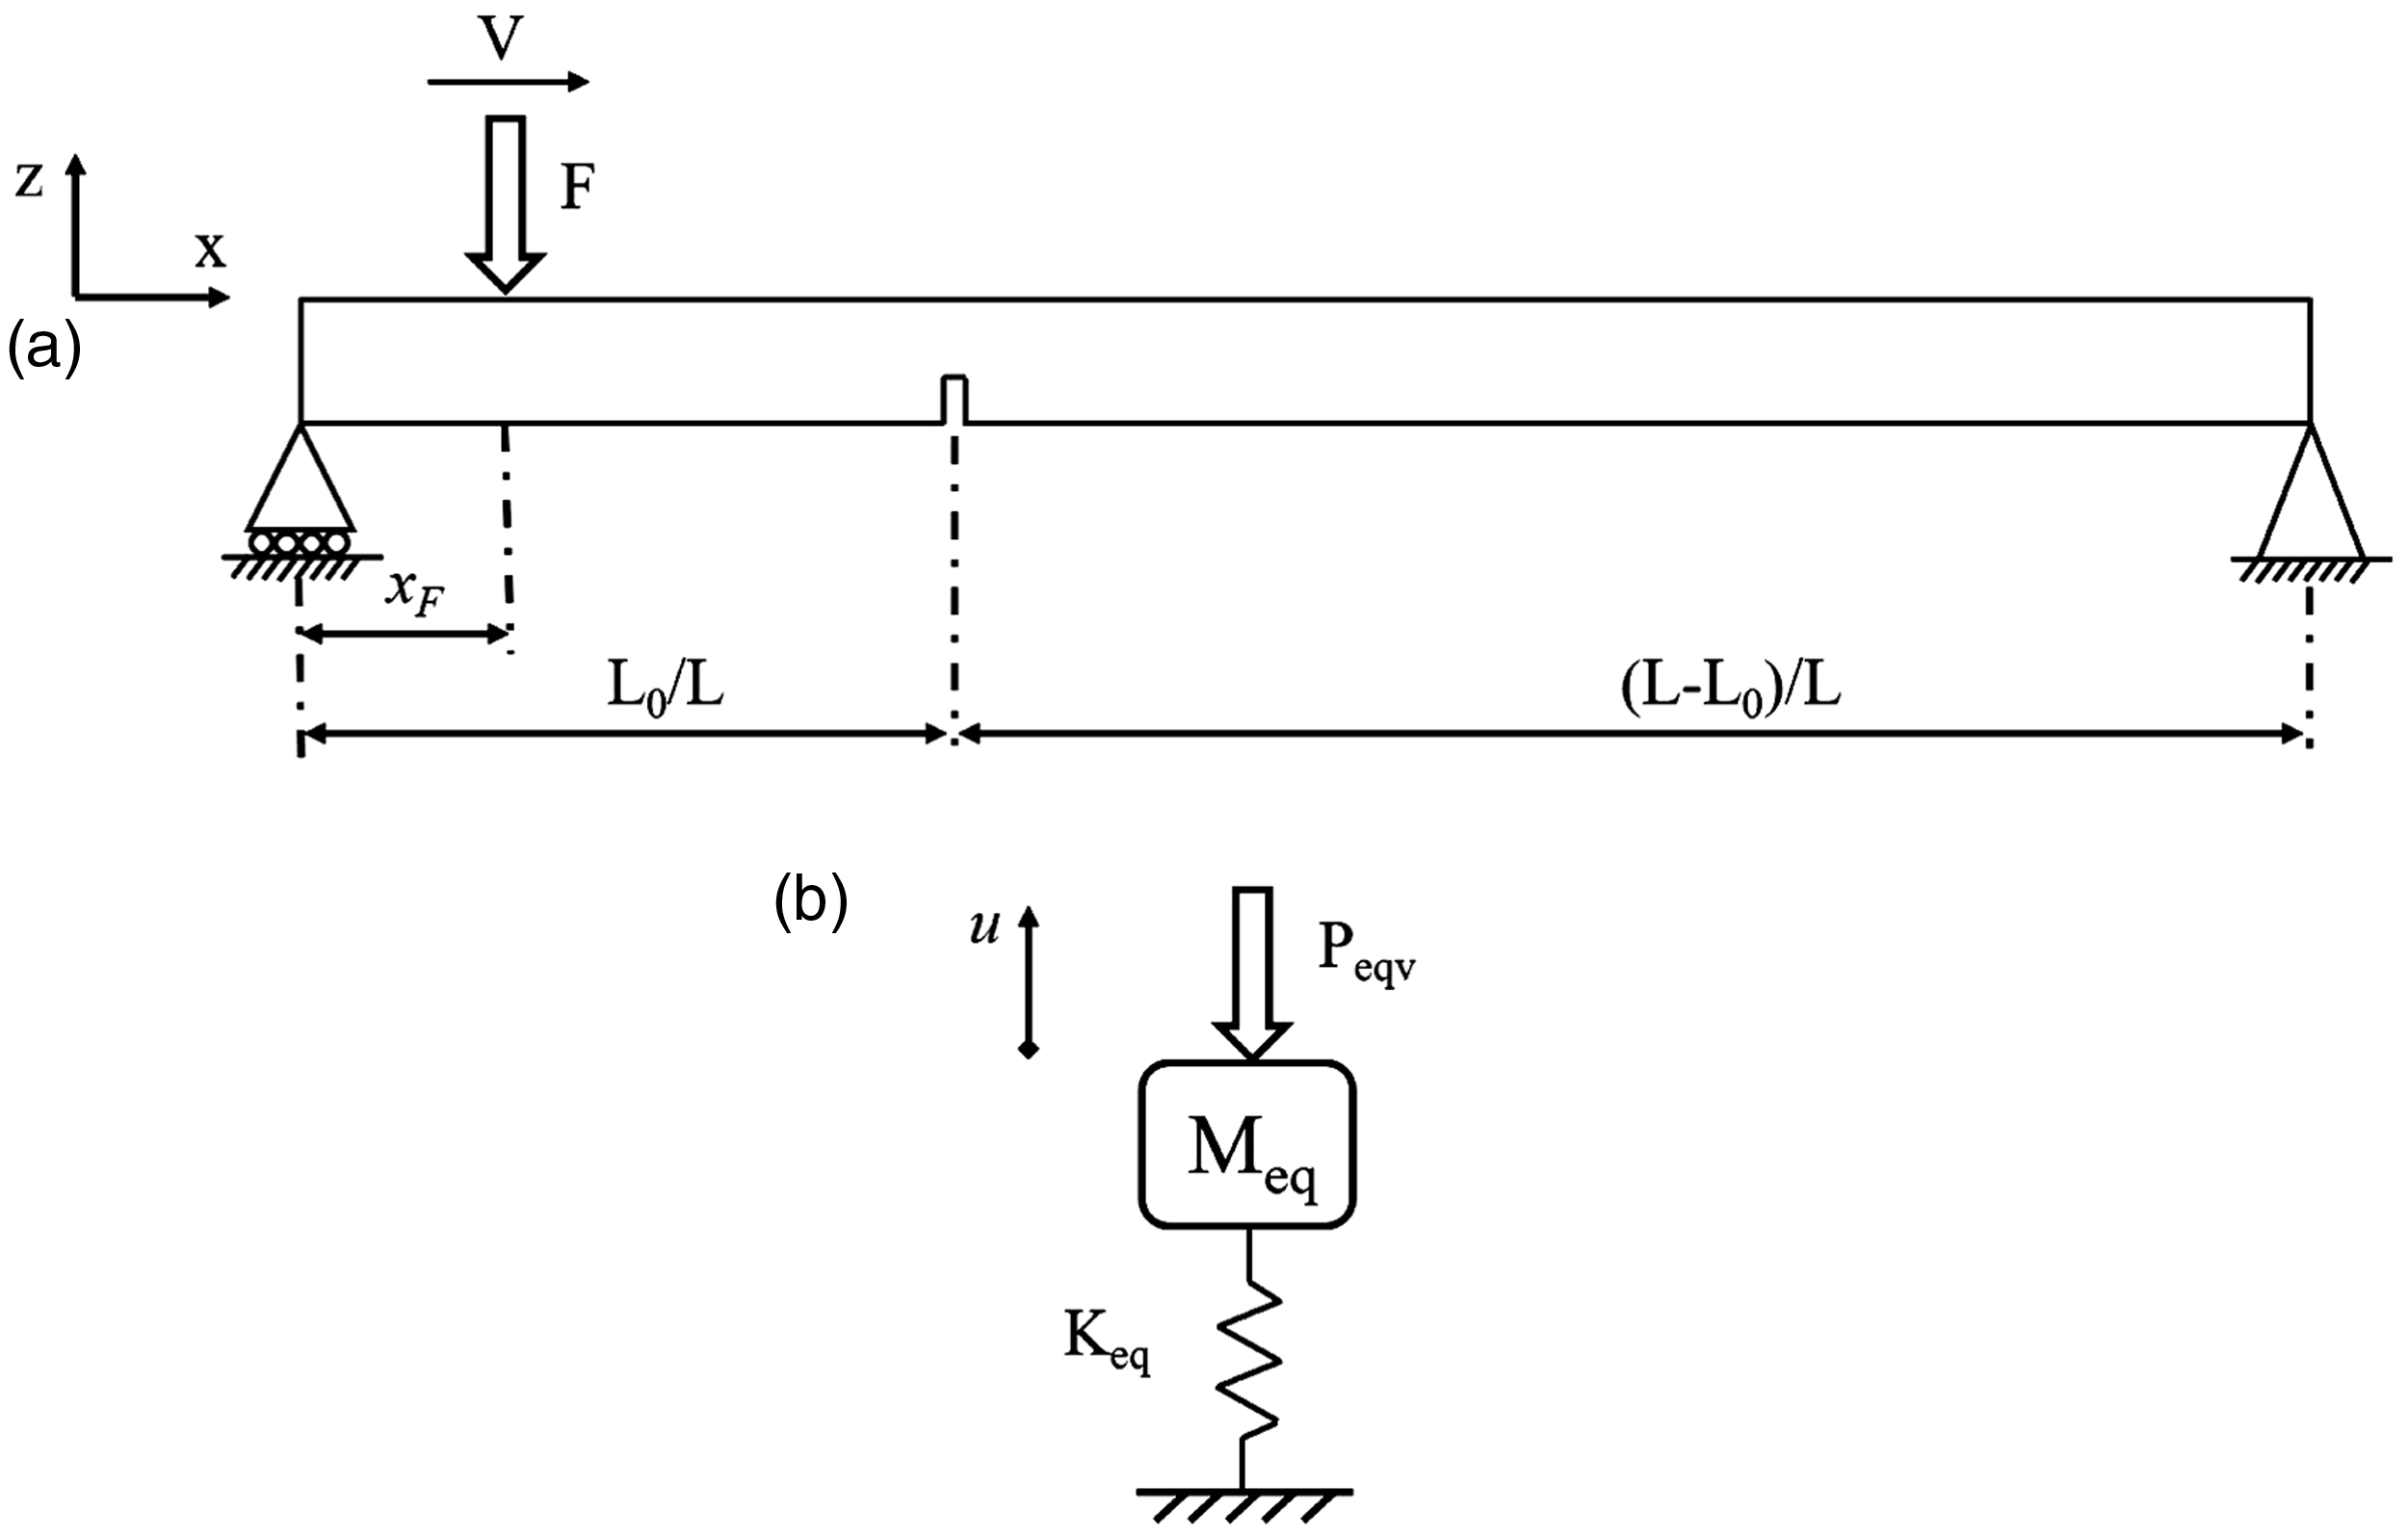
The beam in question is a continuous system with infinitely many degrees of freedom. However, in order to implement an equivalent SDOF model of the cracked beam (Figure 1 (b)) we require the equivalent mass, Meq, equivalent stiffness, Keq, and an equivalent force, Peq, for the first mode vibration, as indicated in Figure 1 (b). In doing so it is assumed that only one crack exists on the beam, that during the period of interest (i.e., the load traversal) the beam is sagging, hence the crack is open and the equivalent stiffness of the beam may be treated as constant, and that the crack does not significantly affect the mode shape of the first mode, therefore the crack does not affect the equivalent mass of the beam. These assumptions will be tested below and are shown to have no significant effect and it will be demonstrated that the neglect of this is valid. Further, following the work of Andreaus et al. (2007), since the forcing is not harmonic and only a short time is simulated, the vibration damping may be neglected in this proof-of-concept study.
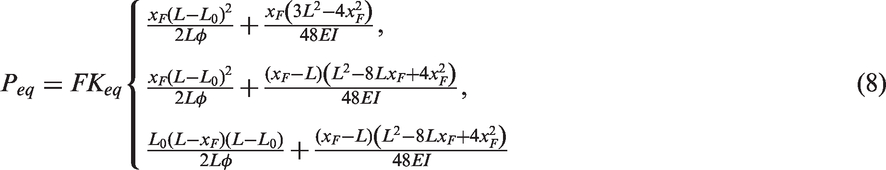
The equivalent stiffness, Keq, is the force applied at midspan required to produce a unit deflection at midspan. Similarly, the equivalent force, Peq, is the force applied at midspan that produces the same deflection at midspan as the actual force (F) in its actual location (xF). These both require calculation of the deflection of a cracked SSB at an arbitrary abscissa x with an open crack present at abscissa L0, imposed by a force at position xF.
Caddemi and Morassi (2007) present this total deflection of the cracked beam at position x,

For


Note that the second case in equation (3) is obtained by symmetry, replacing x and L0 with L – x and
Accordingly, Keq, the equivalent cracked beam stiffness, is the inverse of
Thus, putting F = 1 and
Finally, the equivalent applied force for the SDOF model is, by definition,
To obtain the equivalent mass Meq a key requirement of the SDOF dynamic model is to replicate the fundamental frequency of the beam as
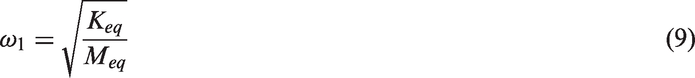
A corollary of the assumption that the crack does not affect the mode shape is that the equivalent mass is the same for both the uncracked and cracked beam. It can therefore be determined by equating the above expression for ω1 with the well-known fundamental frequency for an undamaged uniform SSB (e.g., Irvine, 2012)


Having determined Meq, Keq and Peq, the SDOF differential equation of the vibration of the undamped cracked beam at its midspan can be written as

To normalize the above equations, a nondimensional load position variable

We further introduce a dimensionless crack location,
The dynamic response of the beam,
2.2. A simple FE model of the beam
In order to demonstrate that the SDOF model captures all the important features of the response of this complex multi-degree of freedom problem, a corresponding FE model of the current problem has been implemented in MATLAB. However, following its validation, the results in this paper are generated using the SDOF model because of its computational efficiency.
Details of the FE model for the undamped vibration of a cracked SSB subjected to a moving load can be found in several references (Peng et al., 2007; Rowley, 2007; He and Zhu, 2016). In the FE model, the beam is divided into line elements with two nodes, each with four degrees of freedom—the vertical translation and rotation of its two nodes. These degrees of freedom correspond to principal axes of the beam, so are uncoupled from lateral and torsional degrees of freedom, hence the latter do not influence results and may be neglected. It was found that ten elements, giving the 20 active degrees of freedom shown in Figure 2, were sufficient to achieve good accuracy at the frequencies of interest. The sought output is the translational degree of freedom of the beam at its midspan, namely the tenth degree of freedom.
The beam is divided into 10 elements. There is no vertical translation at the supports, accordingly there are 20 active degrees of freedom (11 rotations and nine translations, labeled 1–20), of which the deflection time history of the beam mid-span (tenth degree of freedom) is of interest.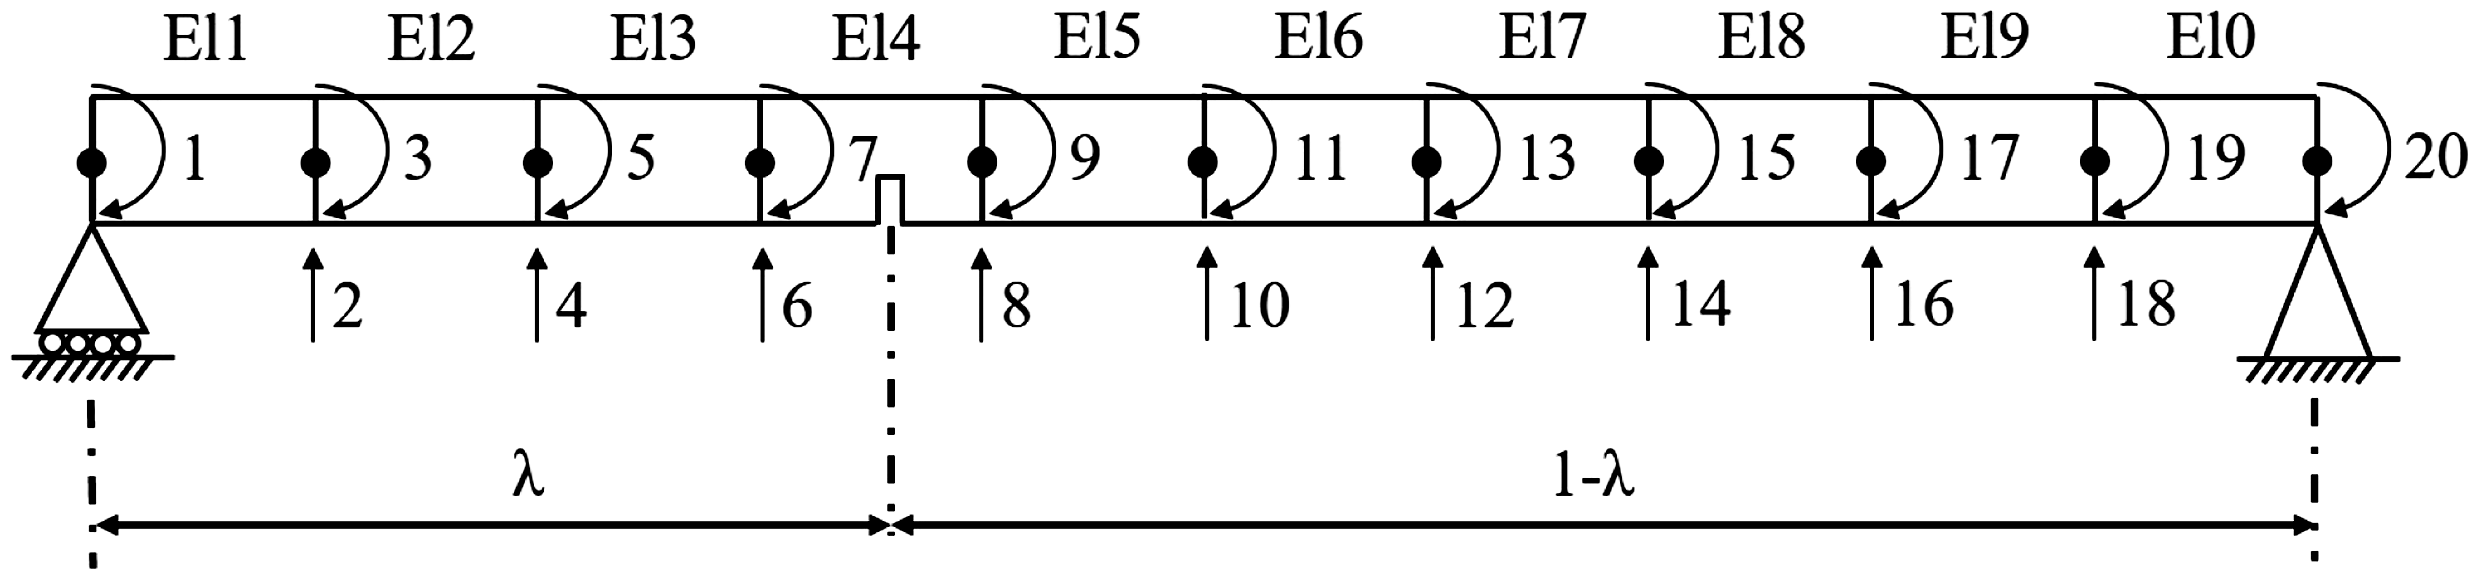
Damage in structures can also be in the form of fatigue defects, which can appear over a more extended area of the beam rather than being localized. This form of defect can be modeled by reducing the effective modulus of elasticity of a portion of the beam (Kurata et al., 2010). Therefore, one way to simulate a defect is to introduce an equivalent stiffness reduction factor, ε, based on continuum crack mechanics (Sinha et al., 2002). In the element containing the crack the flexural rigidity of the intact beam EI is multiplied by ε, where
Several researchers have proposed different models to calculate the stiffness reduction of the beam at the crack position (Brown and Srawley, 1966; Dimarogonas, 1996; Wang, 1996; Ostachowicz and Krawczuk, 2001; Zheng and Fan, 2003; Alsabbagh et al., 2009); however, these all contain empirical constants. Indeed, the crack model of Caddemi and Morassi (2007) used in the SDOF method of this paper is no exception (see equations (4) and (5)). Hence the choice of method will affect numerical simulations.
Therefore, in this paper, in order to achieve a local stiffness reduction (FE model) that is consistent with the global stiffness reduction (SDOF model), first the static deflection of the cracked beam is calculated using the SDOF model. Then, ε for the cracked element is set to achieve the same value for the static deflection of the cracked beam in the FE model.
A test case is presented in the following sub-section to demonstrate the equivalence of the SDOF and FE models for both the damaged and undamaged beams.
2.3. Numerical simulation, validation, and observations leading to the proposed damage detection method
System constants.
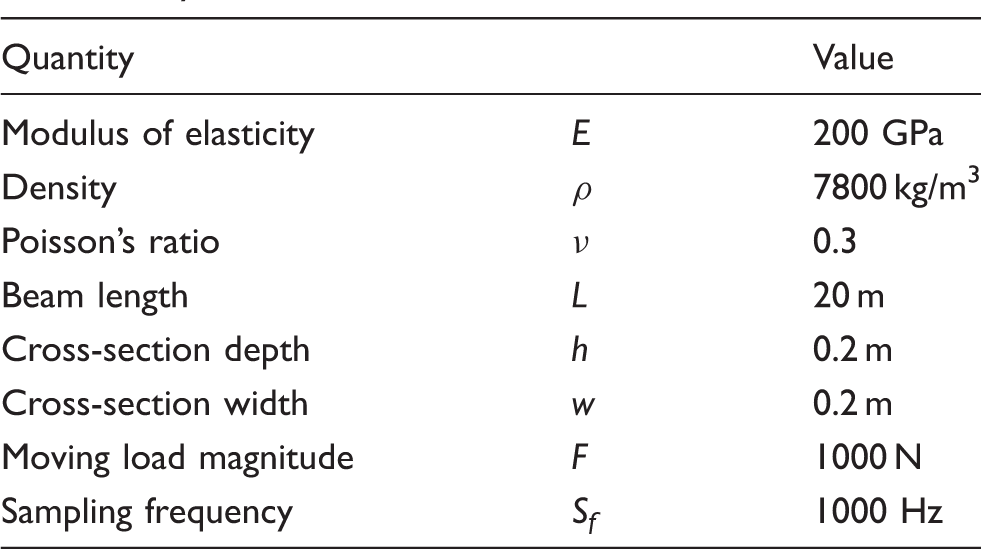
In all graphs in this paper, the displacements are normalized with respect to the midspan static deflection in the undamaged beam due to the load F applied at the midspan, which is

As a test case for the FE validation of the SDOF model, it is assumed that a crack of depth
Figure 3 shows the deflection-time histories in the undamaged beam predicted by the FE and SDOF models for different moving load velocities. The Figure 3 captions also show the time taken for the load to traverse from position μ = 0 to μ = 1, expressed as the number of periods T of the first vibration mode oscillation.
Comparing the results of the single degree of freedom and finite element models for the case of the undamaged beam using different velocities of the moving load. For the small velocities the results are in excellent agreement: (a) V = 5 m/s (load traverse time = 4.59 T); (b) V = 30 m/s (load traverse time = 0.765 T); and (c) V = 50 m/s (load traverse time = 0.459 T).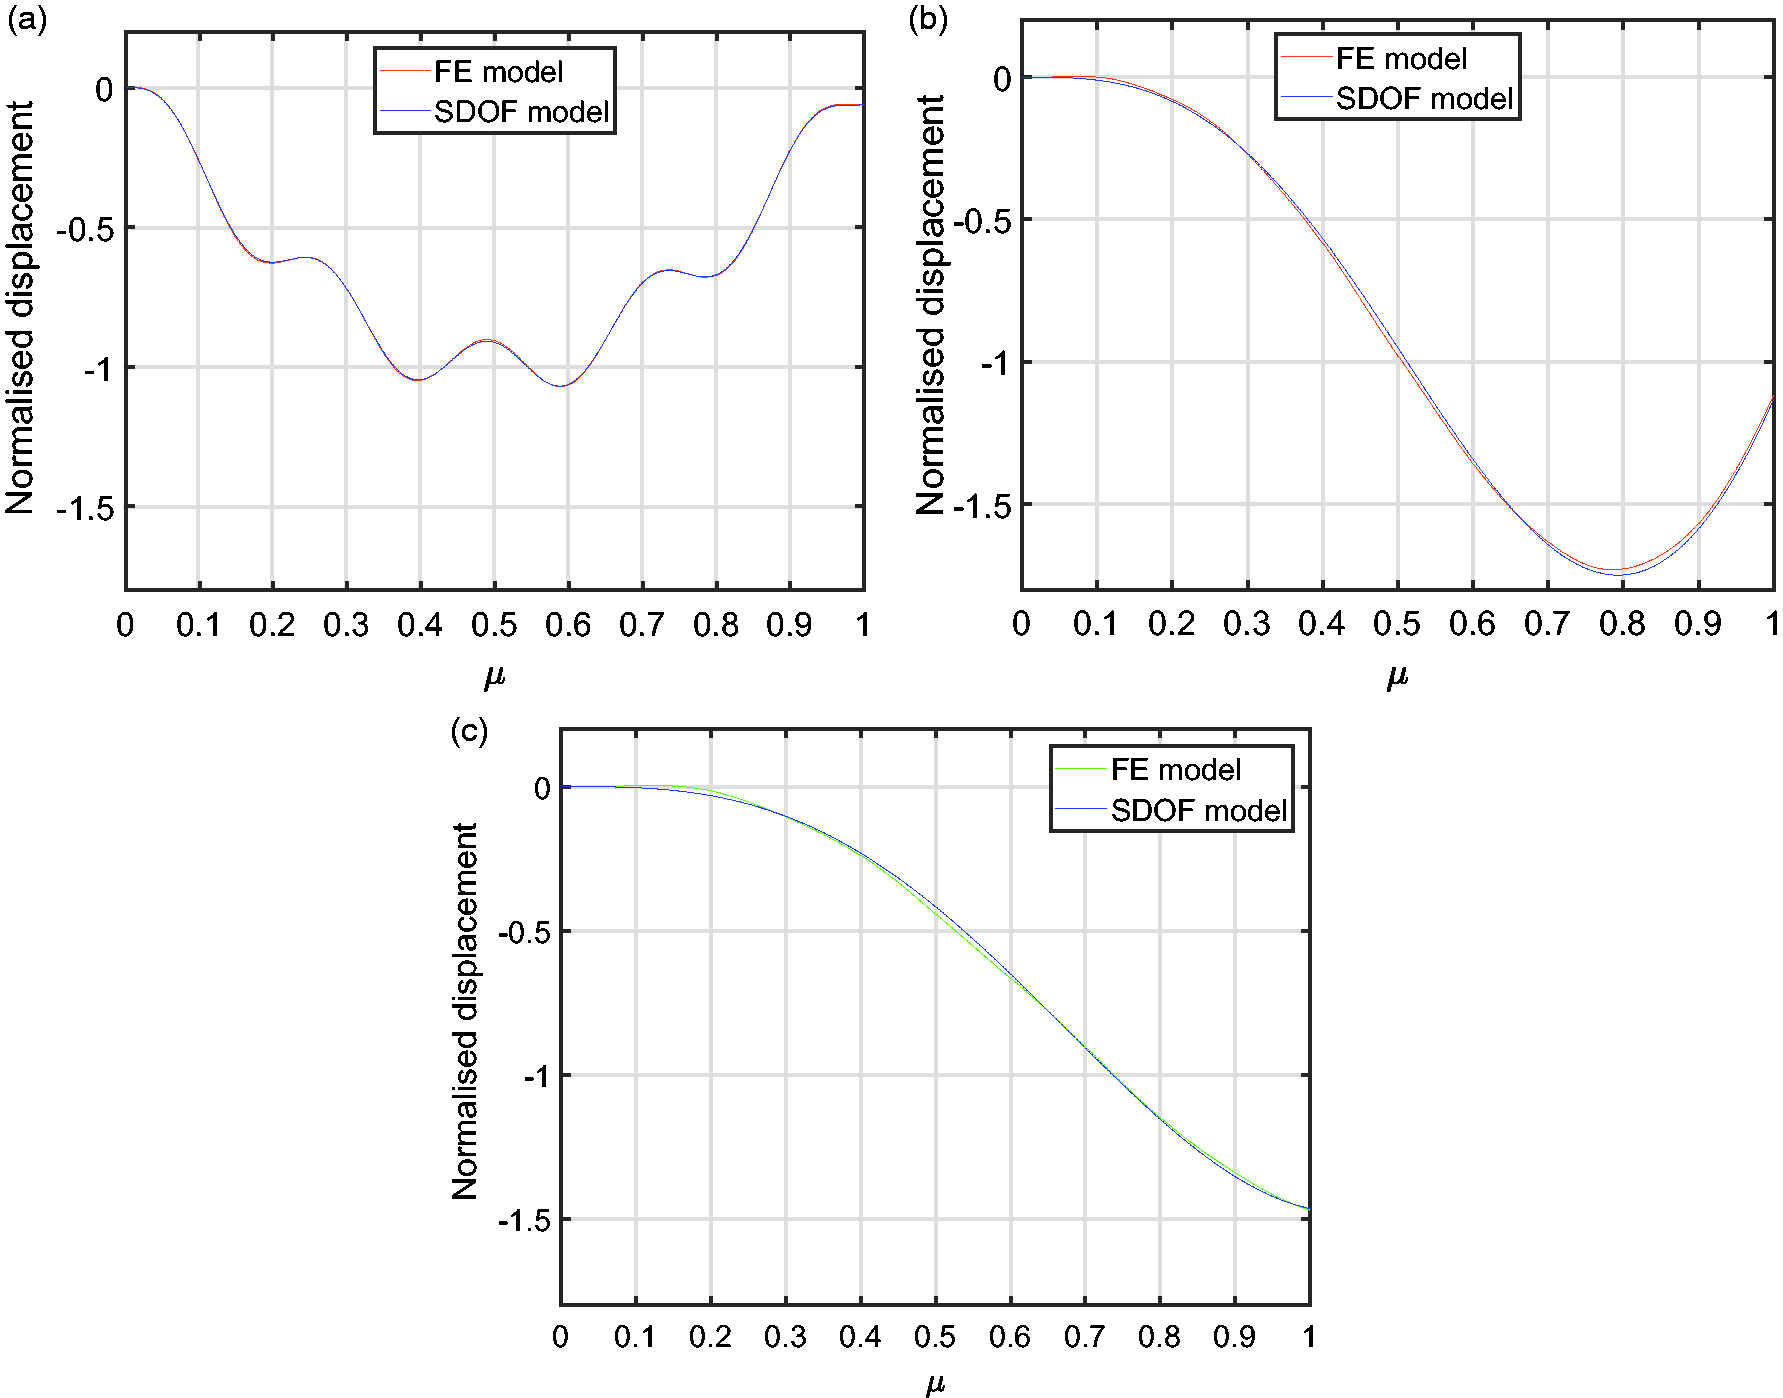
Results for the slowest moving loads (V = 5 m/s, Figure 3 (a)) can clearly be decomposed into a small dynamic response (evident in Figure 3 (a) as 4.59 periods of the first mode oscillation) superimposed on the static deflection (which rises to a unit magnitude at
This means that the SDOF and FE results are in excellent agreement. It has already been noted that the dynamic component of the response in Figure 3(a) occurs at the beam’s first natural frequency, which the SDOF model is designed to capture.
Figure 4 compares the SDOF and FE results for the damaged beam, at load speeds more typical of what will be used later, plotting also the undamaged beam results for reference.
Comparing the results of the single degree of freedom model (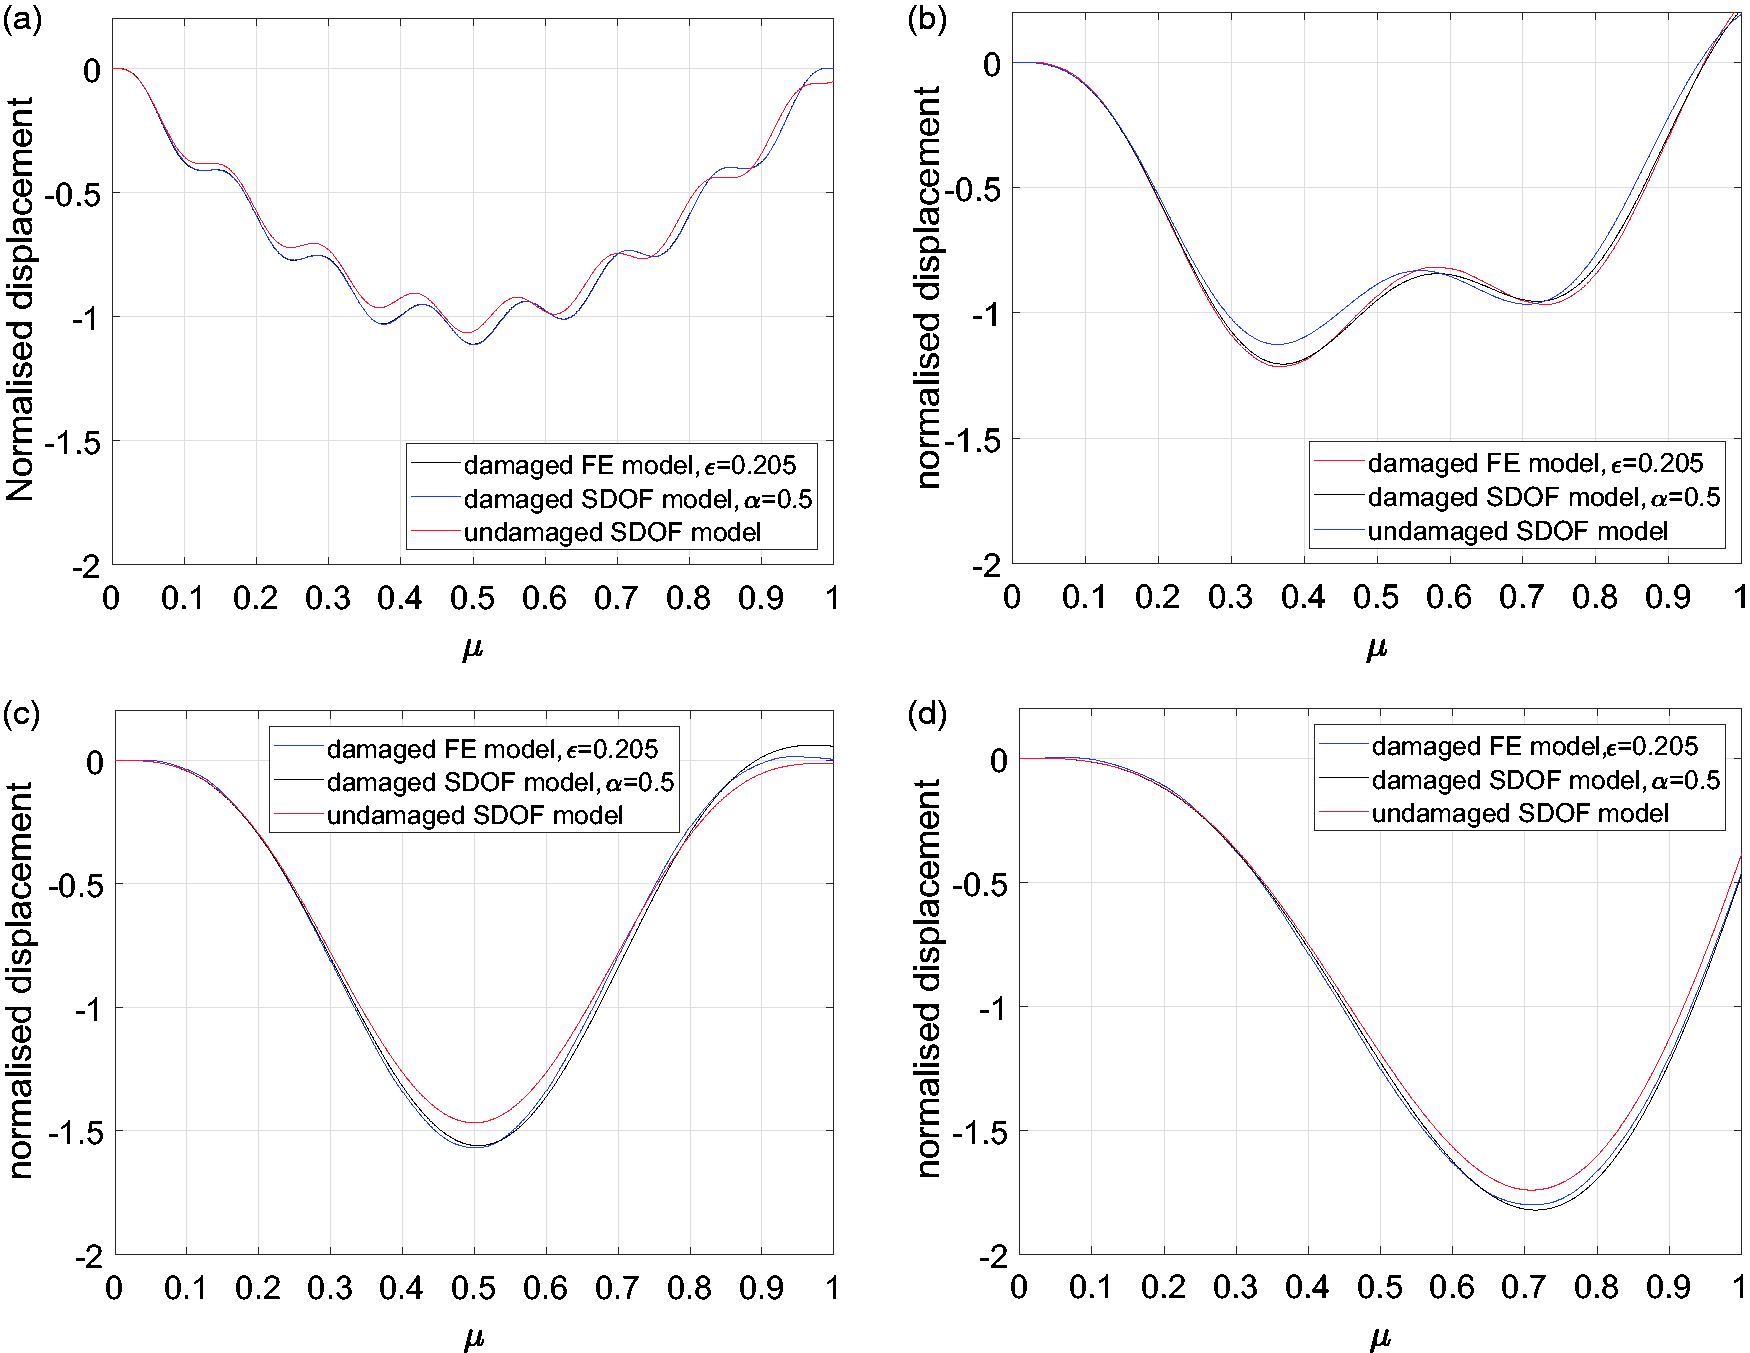
A key observation is that the difference between the SDOF and FE results is much less than the difference between the damaged and intact results, justifying again the use of the SDOF model and further demonstrating that the global stiffness reduction technique used in the SDOF model aligns well with the local stiffness reduction of the FE model.
3. Solving the inverse problem to determine a damage sensitive feature (DSF)
In the previous section, the direct problem of the vibration of a cracked beam subjected to a moving load is solved. In this section, a method for detecting the crack location and size is proposed based on the velocity-time history of the beam at its midspan. A critical velocity is first introduced, at which the damage can be pinpointed on the beam with a higher level of precision.
3.1. Definition of a critical velocity
Consider the undamaged case. We seek a velocity for which the moving load reaching the beam’s right end coincides with a zero midspan displacement, and will call this the critical velocity. This is of interest because when damage exists the midspan displacement at this time will change, thus providing an easy means of detecting the damage.
If the beam has unit impulse response 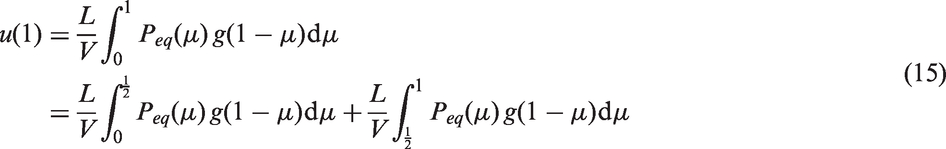
However, we observe in equation (7) (or equation (8)) that 
Over the interval 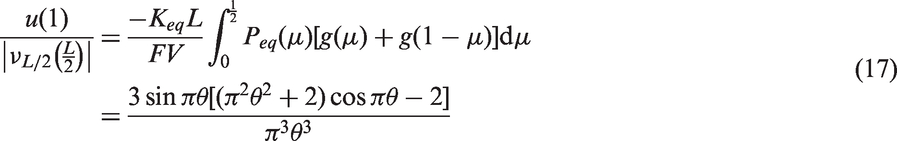
The sought critical velocities are obtained from the values of θ that give 
For the purpose of simulation, we refer to equation (10), the fundamental period is 
There are infinitely many lower critical velocities

For the example of this paper (Table 1)
Figure 5 plots full displacement-time histories for several critical velocities. The odd critical velocities (solutions to Deflection time history of the undamaged beam at its midspan for different critical velocities. As can be seen, the deflection of the beam at μ = 1 is equal to zero.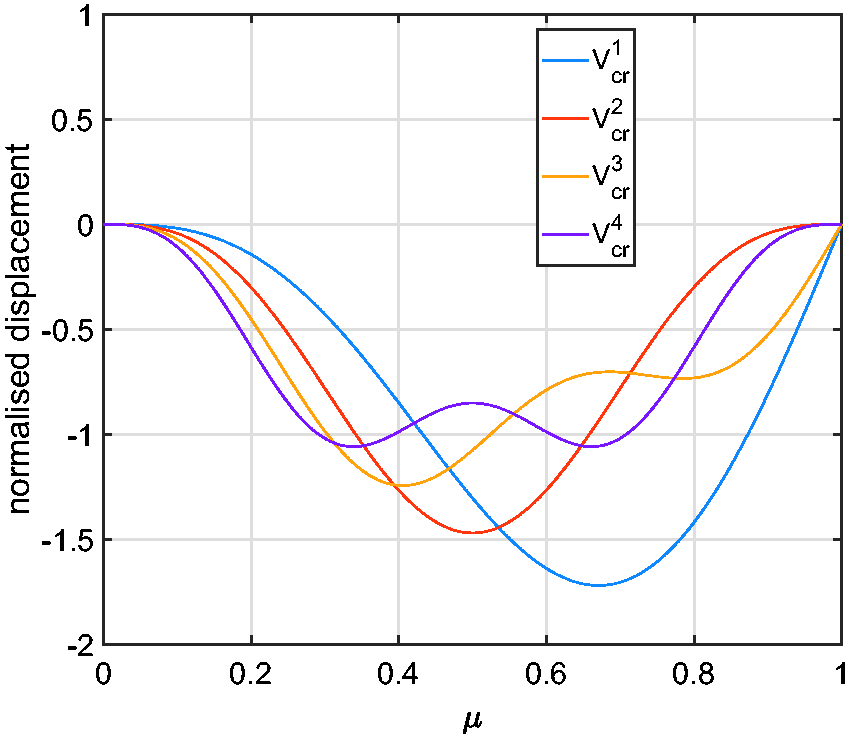
3.2. Proposing a DSF
As can be seen from equation (18), the critical velocity has an inverse relationship with the length of the beam L and direct relationship with the root of flexural rigidity of the beam EI. This makes the application of the proposed Vcr for crack detection on a real structure more practical as discussed in the following sub-sections.
Let us assume that the beam has an open crack with arbitrary crack parameters α and λ, where α specifies the crack severity and
It is obvious that the beam response varies as the beam becomes more flexible due to the crack. The first period of the cracked beam
The degree to which the deflection of the beam varies from zero when the load arrives at μ = 1 is strongly related to the crack parameters and can therefore be considered as a DSF for damage detection. On the other hand, because initial conditions are that the deflection of the beam at its midspan at the start of the experiment (μ = 0) is also equal to zero, in order to obtain the maximum integrity with regards to noisy measurements an alternative formula for the proposed DSF can be introduced as

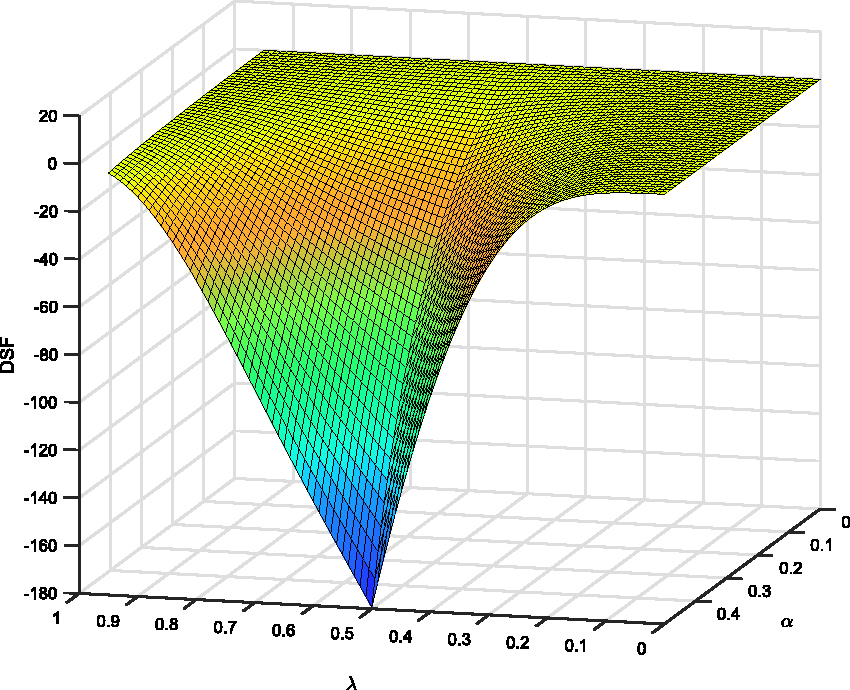
The variation of DSF with α and λ for a beam with a single crack is shown in Figure 6, calculated using the following procedure:
Keq, Meq and equation (13) was solved to obtain the DSF was obtained using equation (21). Damage sensitive feature graph (Sf = 1000 Hz) for different crack depth α and position λ using the first critical velocity
3.3. Choice of critical velocity
If the load moves at a critical velocity then, by definition, the proposed DSF will be zero when the beam is undamaged. However, considering that there are infinitely many critical velocities, it is not immediately obvious which critical velocity will produce the DSF that gives the strongest indication of the damage parameters.
To resolve this, Figure 7 shows the DSF for the case of a crack of severity Calculated damage sensitive features (Sf = 1000 Hz) for a crack with severity 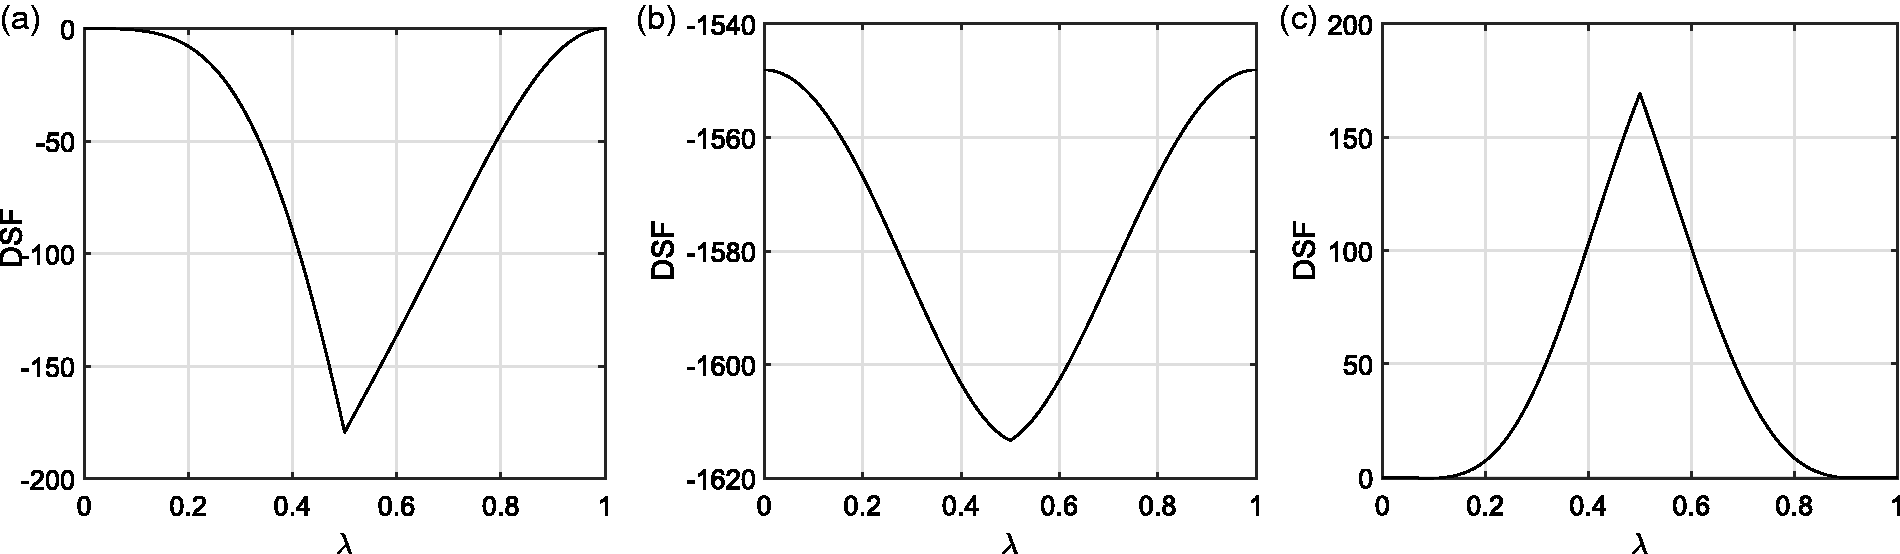
As an interesting aside, Figure 7 (b) shows a similar DSF plot for a moving load velocity of
The next sub-section examines further properties of the proposed DSF, before a damage detection strategy is proposed in the section that follows.
3.4. Investigating the properties of the proposed DSF
In this sub-section, without loss of the generality, we focus mainly on the properties of the first critical velocity as the proper velocity for the damage detection purpose. It can be shown that the conclusions will apply to other critical velocities as well, though less conclusively, as foreshadowed in the previous section.
As might be expected from Figure 7, using the first critical velocity one obtains a fairly smooth graph for the proposed DSF when both α and λ are considered. However, one of the most important properties of the introduced DSF is that it is not completely symmetric. This means that for a fixed crack depth α the calculated DSF for the same crack at λ and
This asymmetry allows us to detect the damage location. To this end, we introduce a two-stage damage detection method in the next section: it first uses the recorded midspan velocity time history when the load moves from left to right, and then the history for a load moving from right to left. We find this procedure also yields the crack severity.
First though, we investigate more properties of the proposed DSF. Referring to equation (18), and keeping in mind that for a prismatic beam 
Equation 22 shows that for two prismatic beams with the same material the critical velocity is a function of the ratio
It is worth mentioning that one may couple the proposed method with some preliminary model updating technique, so as to work with an updated (less erroneous) model when generating the contour plot of the Figure 6.
The following properties of the proposed DSF can be directly deduced from the above discussions:
the DSF graph is not symmetric and, hence, for a fixed crack depth α, the calculated DSF for the crack positions λ and the proposed DSF is not sensitive to the magnitude of the applied force as it is normalized by the static deflection of the beam due to the same load; and the proposed DSF is independent of the width of the beam w, and does not change when L/h is maintained as constant. In this paper
To illustrate the third point, it is noted from equation (13) that the damage influences the DSF via the Keq and Peq terms. From the definitions of these terms (equations (6)–(8)) it is seen that the relative effect of the crack depends on the ratio
4. Concurrent determination of both location and severity of damage
4.1. Noise-free case
Now that the properties of the proposed DSF have been stated, we can introduce a damage detection procedure to simultaneously find both the location and severity of an open crack in an SSB using the proposed moving load experiment. To uniquely solve for these two variables, two experiments must be conducted. For this, we exploit the first property of the proposed DSF identified above, namely its asymmetry.
First, the load is moved over the beam from left to right, as shown in Figure 8 (a). The resulting DSF does not uniquely define either α or λ—two different cracks with different α and λ might have equal DSF—however, it does constrain the possible combinations, which can be represented as a contour of Figure 6. As an example, consider the case of a crack of severity Two experiments are required to obtain the vibration data of the beam subjected to a moving load: (a) from left to right; and (b) from right to left. (Color online) Contour plots of damage sensitive feature (Sf = 1000 Hz) obtained from two experiments. In the first experiment (red lines) the load moves from left to right, while for the second (blue lines) it moves from right to left. The intersections uniquely identify the exact crack parameters 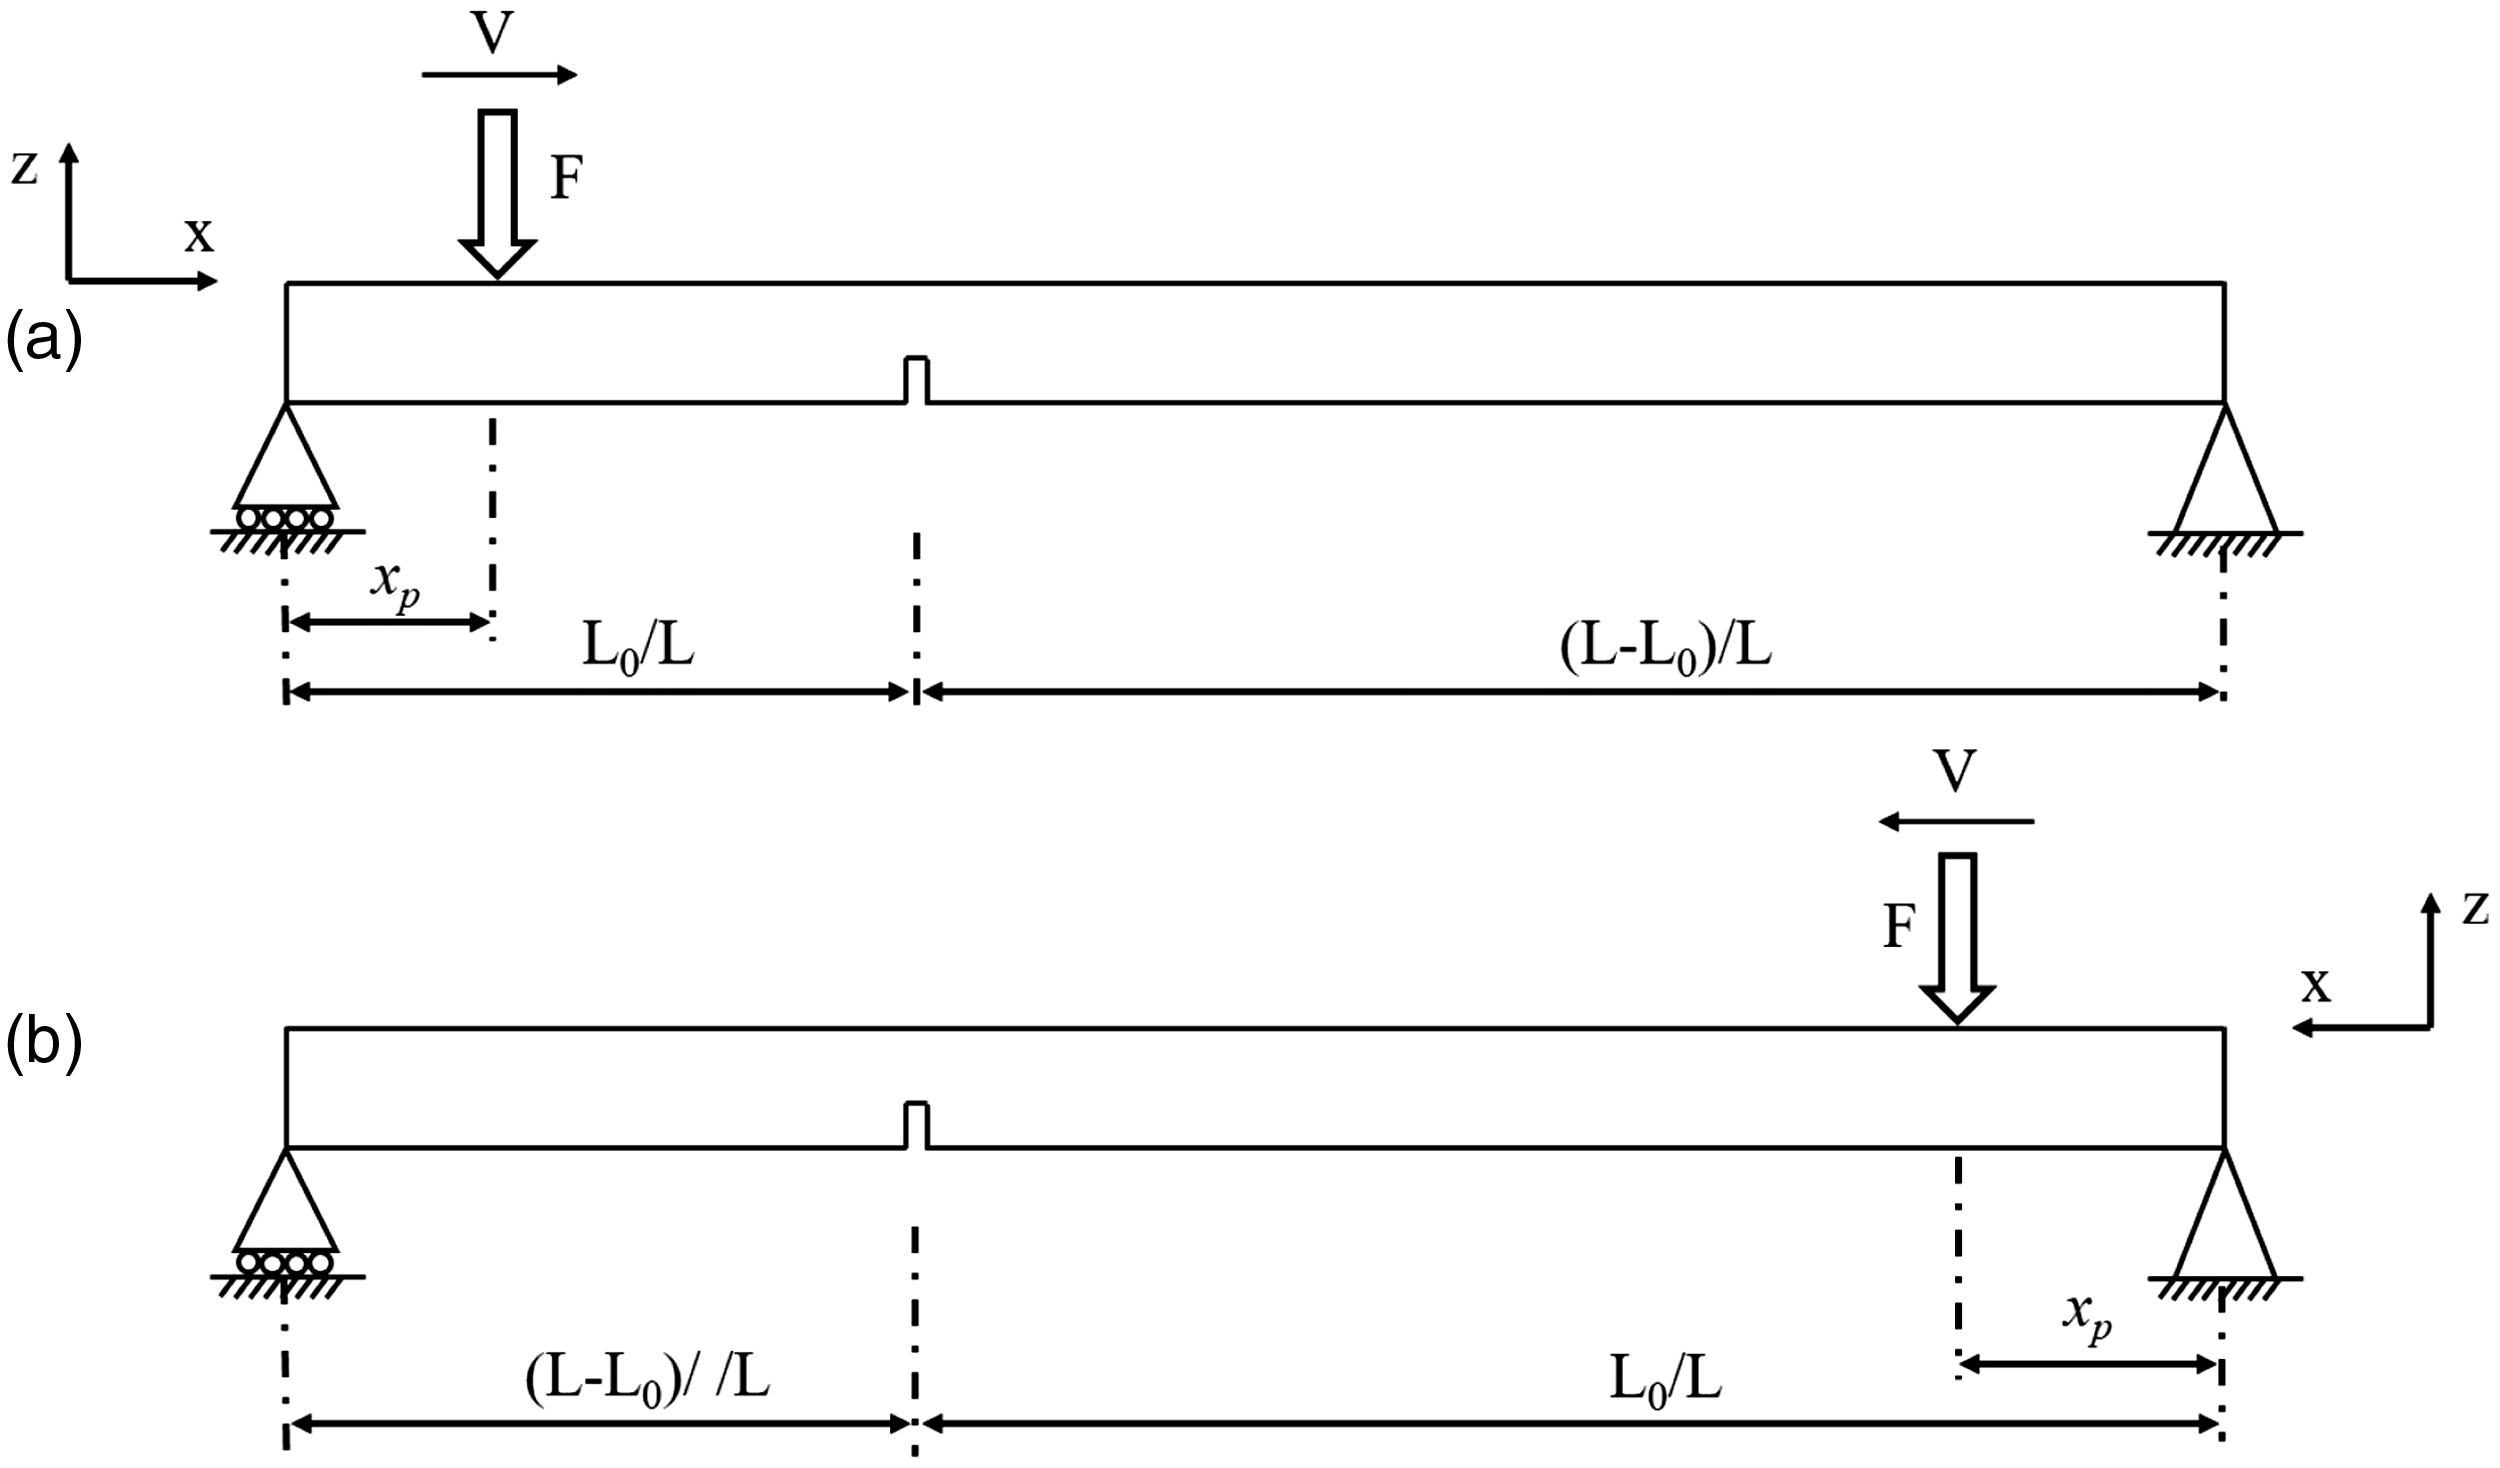
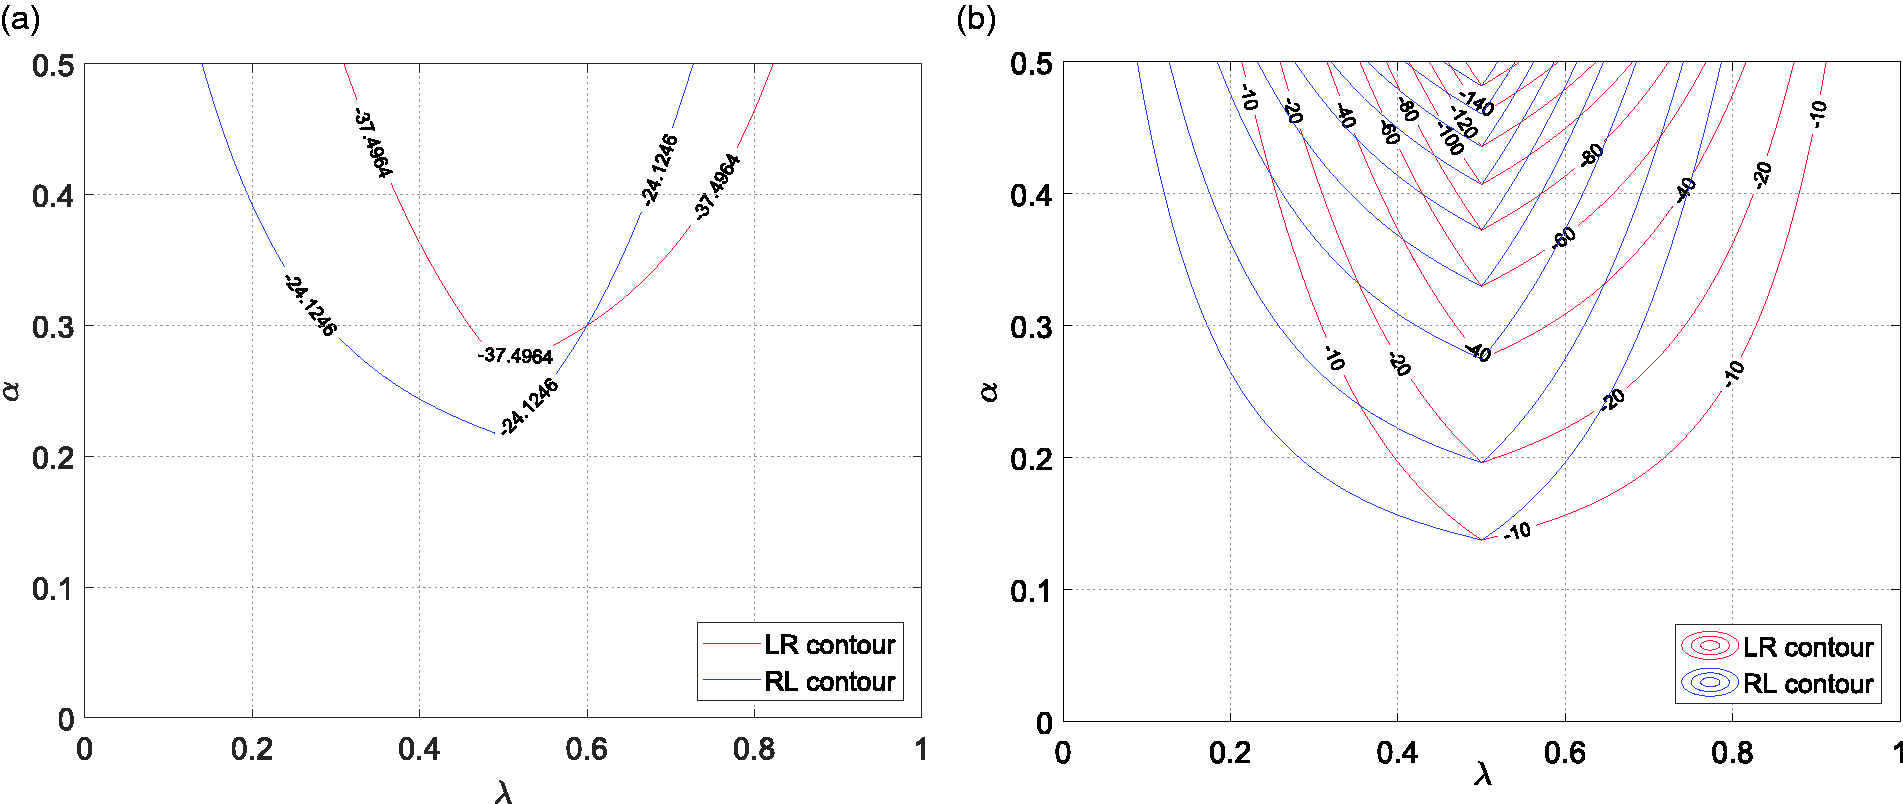
Next, the load is moved from right to left, shown in Figure 8 (b). Possible outcomes from this experiment are represented by a reversed version of the surface of Figure 6, that is, with λ replaced by
The point at which these two contours intersect,
In this example the load has been moved at velocity (Color online) Damage sensitive feature contours (Sf = 1000 Hz) for left-right and right-left experiments for higher critical velocities: (a) third critical velocity; (b) fifth critical velocity; and (c) seventh critical velocity.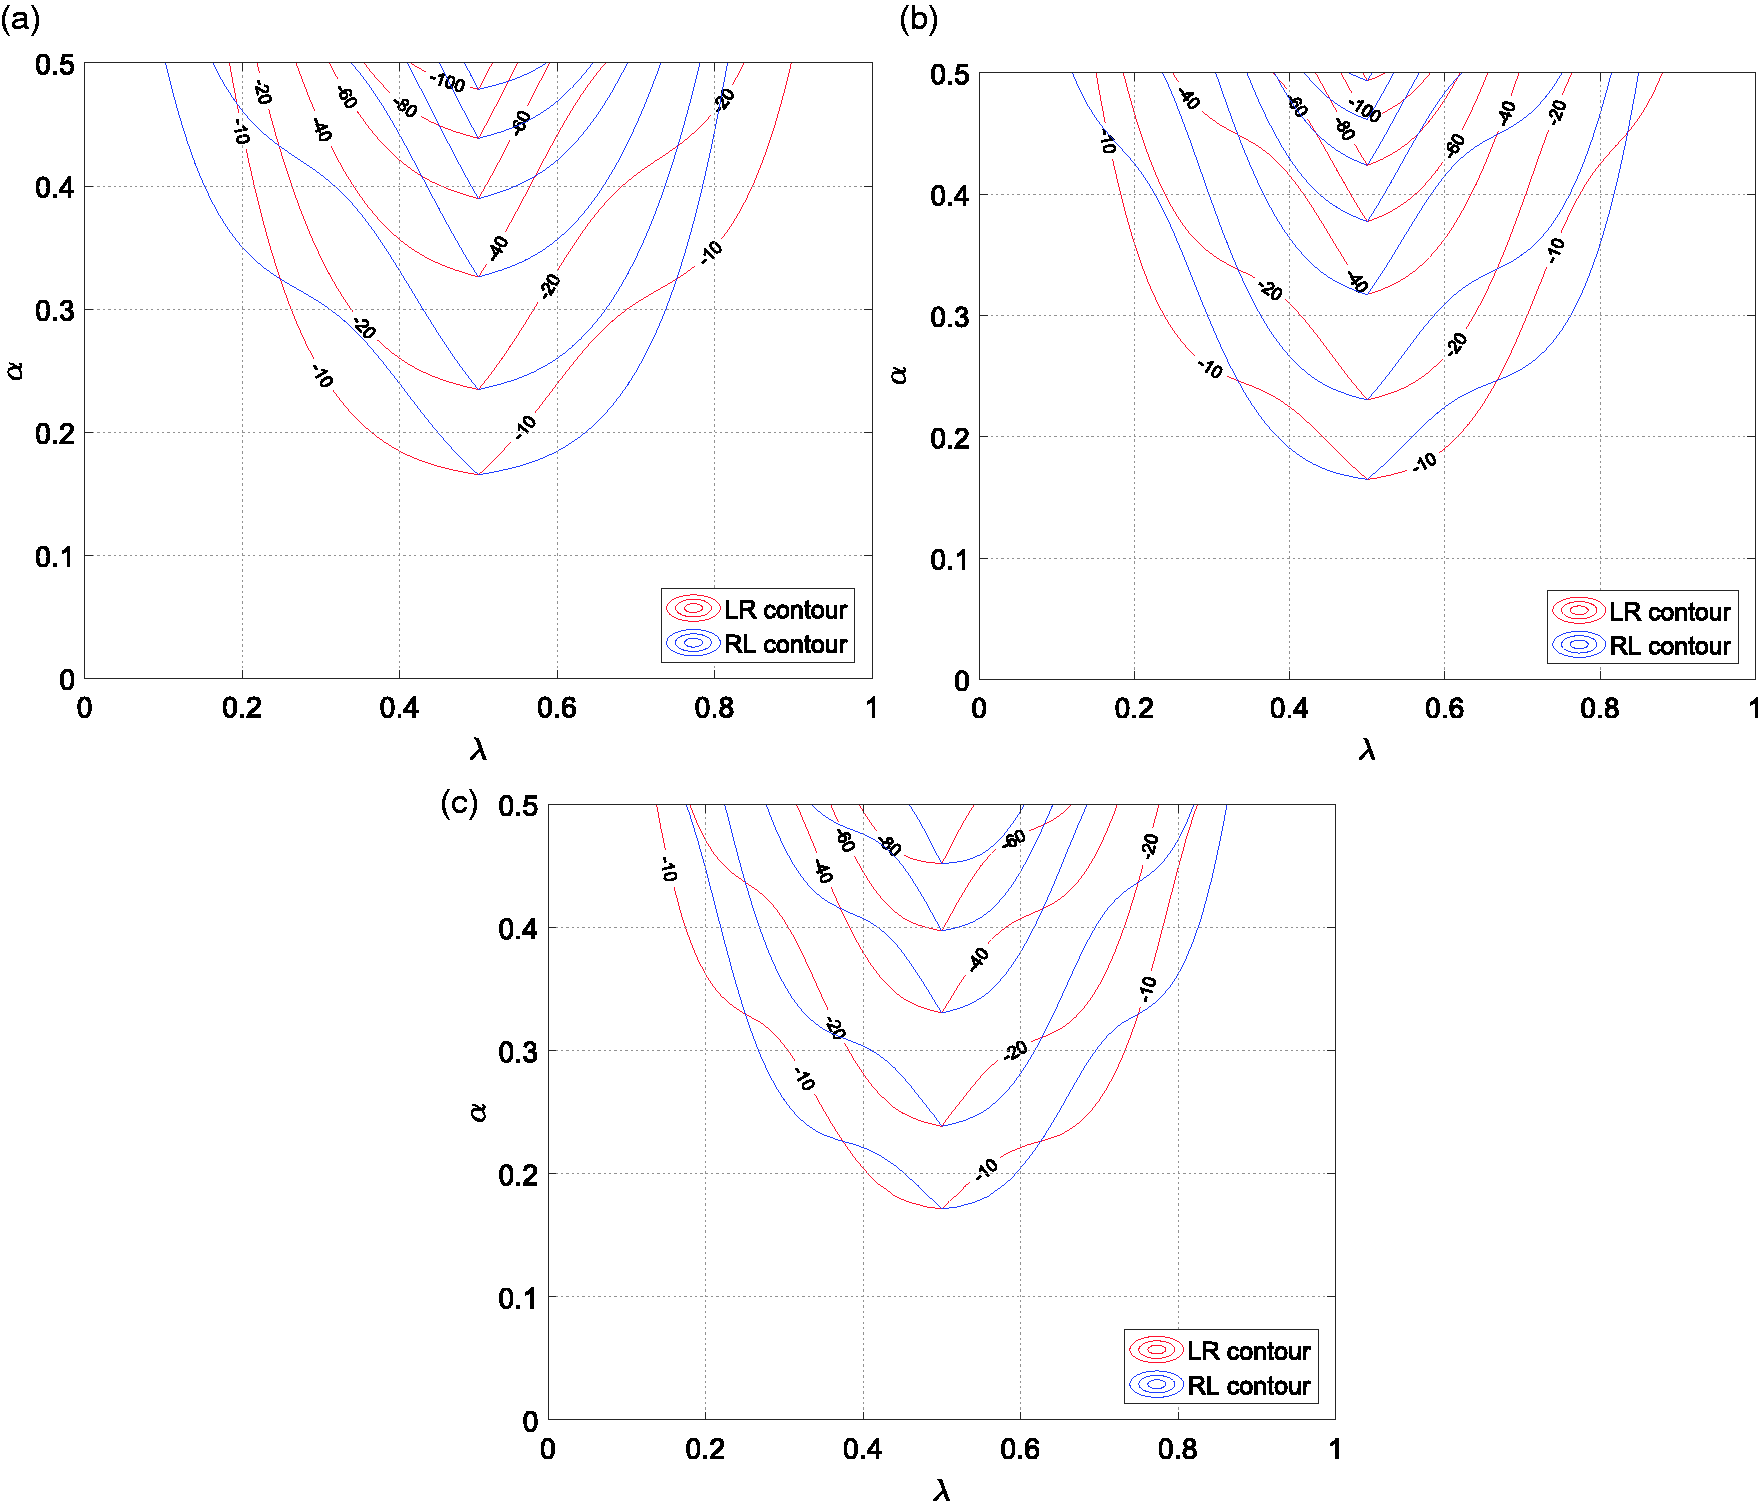
Accordingly, a damage detection procedure can be summarized as follows:
a load is moved over the beam with the velocity the DSF is computed for each case; and the intersection of the relevant contours of Figure 9(b) defines the location and the severity of the crack.
4.2. Assessment of accuracy of crack characterization in the presence of noise
Since most real data will be contaminated by noise, it is necessary to demonstrate the robustness of the method in the presence of noise. In this sub-section, the performance of the proposed damage detection technique is examined with simulated noise of the form suggested by He et al. (2017)

Damage scenarios.
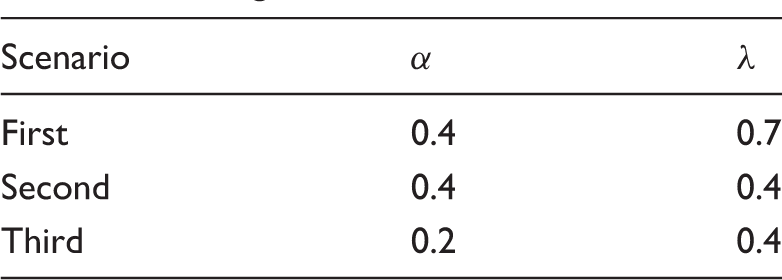
In the first scenario a relatively large crack exists on the beam at a point almost midway between the right support position and the midspan of the beam. In the second scenario the crack, also large, is closer to the midspan of the beam. Finally, the third scenario is a case of a relatively small crack, but again near the midspan of the beam.
In order to evaluate the effect of noisy measurements on damage detection, 2% noise of the form of equation (23) has been introduced to the data simulated in MATLAB and the DSF has been calculated after using a low pass filter with a cut-off frequency of 50 Hz. The simulation was run 1000 times with different random number seeds for each scenario, and the length of the vector between the predicted pair Contour of the possible crack area obtained for the first damage scenario after 1000 simulations per each experiment.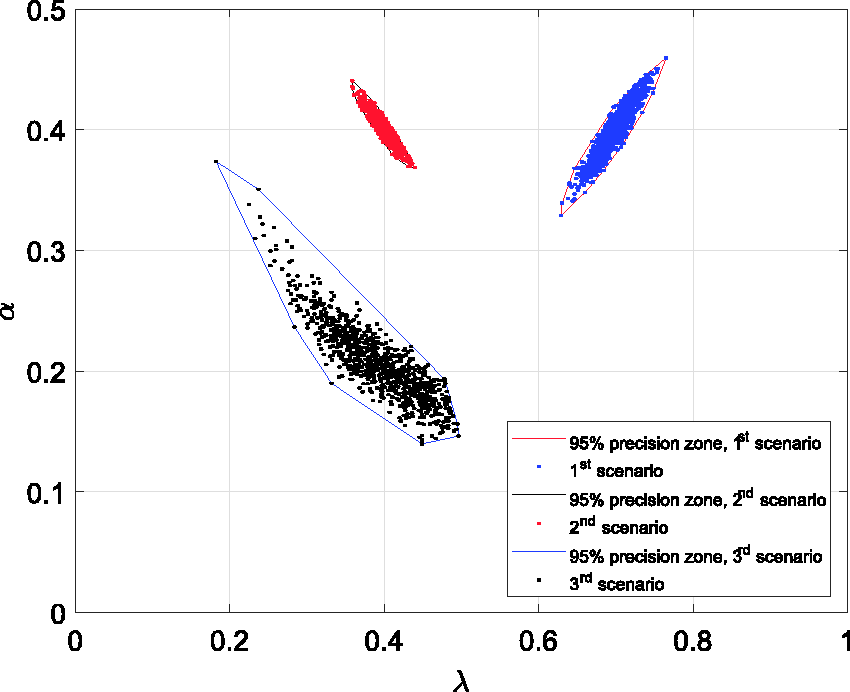
As can be seen in Figure 11, the most reliable damage detection occurs when the DSF is largest, that is, the large crack close to the midspan of the beam (second scenario), followed by the large crack at a point farther from the midspan (first scenario). It is also clear from the scatter of the predictions that for a relatively small crack, even when it is close to the midspan, there is significantly more uncertainty in the detected severity and location (third scenario).
Sometimes the measured vibration data can be sensitive to environmental effects such as diurnal temperature variation (Sohn, 2006; George et al., 2017). As such a higher level of 10% noise is now considered. Figure 12 shows the histogram of the obtained DSF for the undamaged and damaged beam having a crack with The histogram of the damage sensitive feature obtained for: (a) a healthy beam; and for the damaged beam when the load is moved on the beam from (b) right to left (α = 0.5, λ = 0.3), and (c) left to right (α = 0.5, λ = 0.7).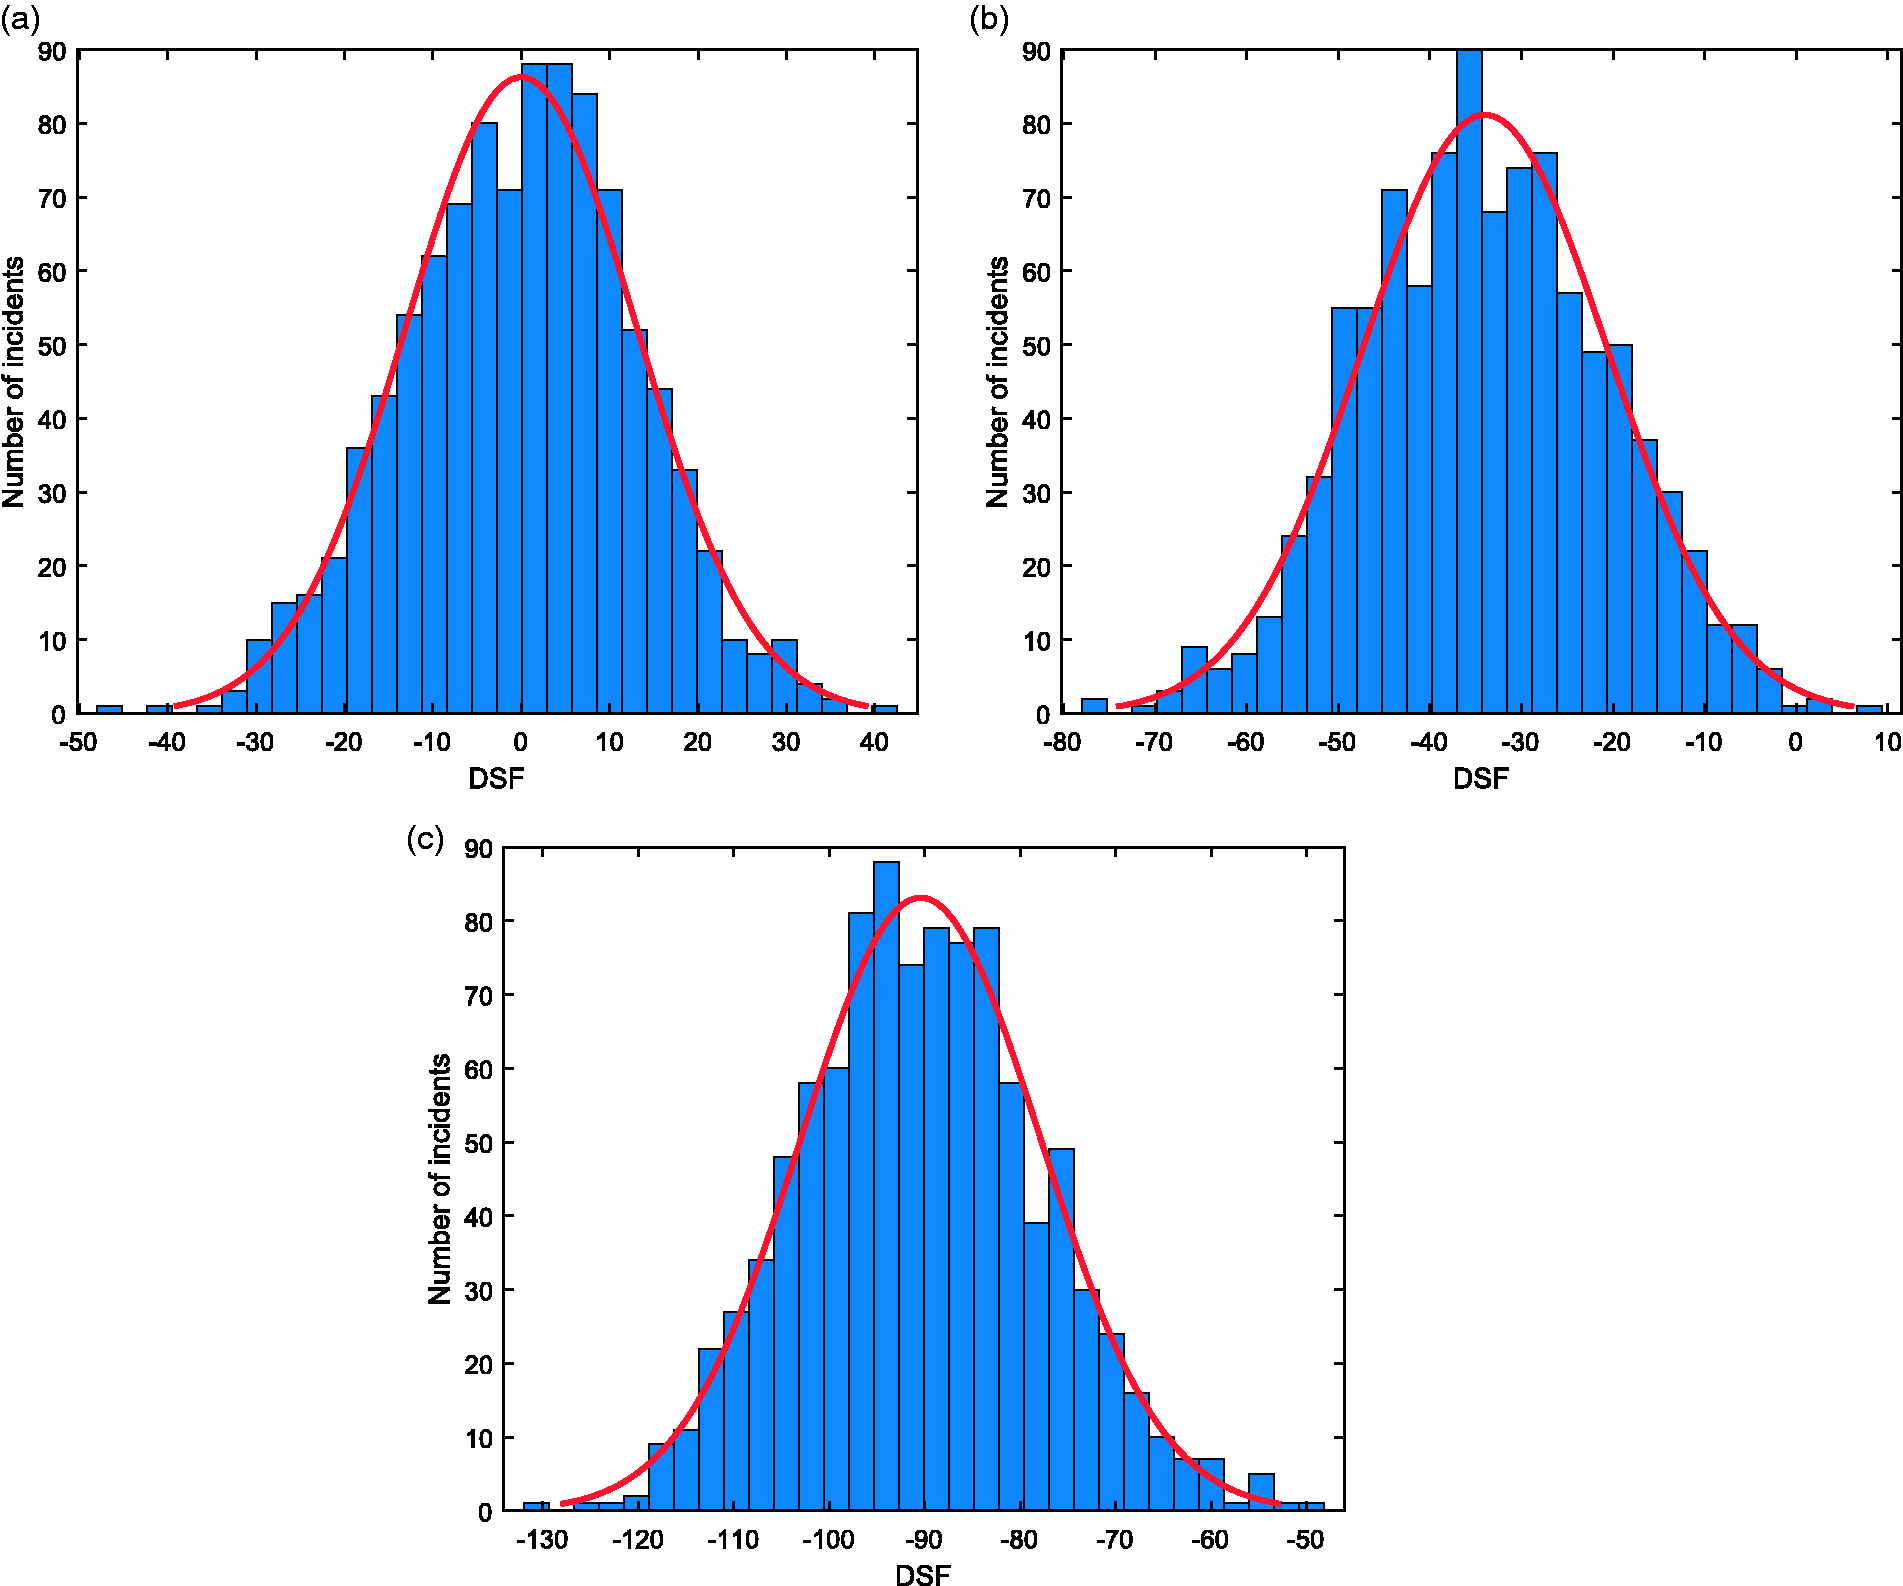
5. Conclusions
In this paper a new damage detection method is proposed for detection of a crack in an SSB subject to a moving load. The proposed method is able to determine both the location and severity of the crack, and is robust in the presence of moderate noise.
To that end, two experiments must be conducted. In the first experiment the load is moved over the beam from left to right and the velocity-time history of the beam is measured at its midspan. In the second experiment the load is moving from right to left. In particular, it is shown that the first (highest) critical velocity
In order to see how the noisy measurements can affect the results, 2% noise has been introduced to the simulated data. The results show, unsurprisingly, that the accuracy of the crack detection improves for bigger cracks closer to the midspan of the beam.
For real-world situations the impact of the higher modes, noise, damping, and other environmental effects may make the analysis considerably more complex but it may be possible in future work to solve these and related problems using techniques such as supervised machine learning alongside the proposed approach. If these problems are solved it may also open the technique to using multiple sensors to improve the robustness of the method. However, while there are many further questions that could be explored, this paper provides a proof of concept that multiple crack parameters may be determined from multiple independent experiments.
Declaration of Conflicting Interests
The author(s) declared no potential conflicts of interest with respect to the research, authorship, and/or publication of this article.
Funding
The author(s) received no financial support for the research, authorship, and/or publication of this article.