
Abstract
Background
Post-intervention coagulation abnormalities are potentially modifiable factors influencing ischemic stroke outcomes, but comprehensive assessment tools are lacking. This study developed a novel coagulation score integrating platelet count, INR, and APTT to evaluate its association with mortality in ischemic stroke patients undergoing cerebrovascular intervention.
Methods
A historical cohort study was conducted using data from the MIMIC-IV v3.0 database. 1711 adult ischemic stroke patients receiving intervention with documented baseline platelet, INR, and APTT levels were included. A coagulation score (range 0–6) was calculated by summing points assigned for abnormal APTT, INR, and platelet values. Patients were stratified into quartiles (Q1-Q4) based on score. Primary outcomes were 28-day and 60-day all-cause mortality. Associations were analyzed using Kaplan-Meier curves, multivariable Cox regression (adjusting for demographics, illness severity scores, and comorbidities), and restricted cubic spline (RCS) models. Discriminative performance was assessed via ROC analysis.
Results
Increasing coagulation score quartiles were significantly associated with progressively worse survival (Log-rank P = 0.006 for 28-day; P = 0.0032 for 60-day). Multivariable Cox regression revealed a significant dose-response relationship: each point increase in the continuous score was associated with higher 28-day (HR = 1.075, 95%CI:1.025–1.127, P = 0.003) and 60-day mortality risk (HR = 1.086, 95%CI:1.038–1.136, P < 0.001) in base models. Q4 patients had significantly higher mortality risk than Q1. RCS confirmed a linear positive association without threshold effects (P-nonlinearity>0.05). Subgroup analysis showed stronger associations in patients without heart failure (P-interaction<0.001). While the coagulation score had the highest AUC among individual parameters (28-day: 0.5494; 60-day: 0.5494), overall discriminative performance was modest.
Conclusion
An integrated coagulation score demonstrates a linear dose-response relationship with increased mortality risk in ischemic stroke patients post-intervention, particularly among those without heart failure, in partially adjusted analyses. However, its association was attenuated after full adjustment for comorbidities and illness severity. This score may have value as a component of a comprehensive assessment rather than as a standalone predictor, though its predictive ability is limited.
Introduction
Ischemic stroke represents a leading cause of mortality and long-term disability worldwide, posing a substantial burden to healthcare systems and society. According to the Global Burden of Disease study, stroke remains the second-leading cause of death globally. 1 Despite advancements in acute reperfusion therapies and neurocritical care, 2 a significant proportion of patients experience poor outcomes following intervention, with mortality rates remaining persistently high in the critical post-procedural period. The complex pathophysiology of post-intervention course involves multiple mechanisms, among which coagulation abnormalities have emerged as a potentially modifiable factor influencing clinical outcomes. 3
The coagulation system plays a dual role in ischemic stroke pathophysiology, 4 contributing both to the initial thrombotic event and subsequent complications. 5 Following cerebrovascular intervention, patients undergo a complex hemostatic rebalancing, where both hypercoagulable and hypocoagulable states can adversely affect recovery. 6 Hypercoagulability may predispose to re-occlusion or thrombotic complications, while coagulopathy increases hemorrhage risk, particularly in the context of antiplatelet and anticoagulant therapies routinely administered post-intervention. This delicate balance underscores the importance of comprehensive coagulation assessment beyond conventional isolated parameter measurement.
Traditional coagulation monitoring in stroke care has predominantly relied on individual parameters such as International Normalized Ratio (INR), activated partial thromboplastin time (APTT), and platelet count.7–9 However, emerging evidence suggests that composite coagulation scores, 10 integrating multiple aspects of hemostatic function, may provide superior prognostic information in critical care settings. The concept of coagulation scoring systems has gained traction in other clinical contexts, particularly in trauma and surgical critical care, where scores such as the Trauma-Induced Coagulopathy Clinical Score have demonstrated utility in predicting massive transfusion requirements and mortality. 11 Despite this progress, the development and validation of comprehensive coagulation assessment tools specific to the neurocritical care population, particularly post-intervention stroke patients, has remained notably limited. 12
Current literature reveals significant gaps in our understanding of coagulation disturbances following cerebrovascular intervention. While numerous studies have established associations between individual coagulation parameters and stroke outcomes, the integrative prognostic value of composite coagulation scores remains inadequately explored.13,14
This study aims to explore the relationship between the novel coagulation score and the 28-day and 60-day all-cause mortality of ischemic stroke patients undergoing cerebrovascular interventional therapy. By developing and validating a scoring system based on conventional coagulation parameters, the independent association and nonlinear relationship between it and mortality were analyzed, and the effect correction in different clinical subgroups was examined. And evaluate the discriminative performance of this score compared to a single parameter; We hypothesized that an elevated coagulation score was dose-responsive to the risk of death and had a better prognostic predictive ability than a single parameter.
Method
Database
This study employed a historical cohort design using anonymized clinical data extracted from the MIMIC-IV v3.0 database. As an enhanced iteration of MIMIC-III, this version utilizes a modular data lake architecture that supports efficient data management and integration of up-to-date patient records. All sensitive health information underwent rigorous de-identification procedures. Secondary analysis of these pre-anonymized datasets was conducted in compliance with relevant regulations, thereby exempting the study from additional ethics committee approvals or individual consent requirements.
Enrollment Standard
Patient selection followed these inclusion criteria: 1) Patients diagnosed with ischemic stroke according to ICD-9 and ICD-10 code; 2) Documented baseline levels of both platelet, INR and APTT, enabling calculation of coagulation score; 3) patients stayed in ICU and hospital > 24 h; 3) Patients first admitted in hospital and ICU;4) 18< Patient age <85. We simultaneously marked those patients who underwent cerebrovascular intervention. Datasets exhibiting less than 30% missing values in continuous variables underwent mean imputation using the study population's averages to maintain analytical power. From this cohort of 1711 patients retrospectively identified, the coagulopathy score was determined by summing the scores from the following three sections: the APTT score (0 point: APTT <29 s, 1 point: 29 s~34 s, 2 point: APTT >34 s), the INR score (0 point: INR <1.4, 1 point: 1.4~2.6, 2 point: INR >2.6) and the platelet score (0 point: plt >150*109/L, 1 point: 100~150*109/L, 2 point: plt <100*109/L).. Subjects were subsequently stratified into quartiles based on RPR interquartile ranges: Q1 (<2.0), Q2 (2.0-3.0), Q3 (3.0-6.0) and Q4 (>6.0).
Clinic Outcomes
The primary endpoints of this study comprised 28 days and 60 days all-cause mortality.
Standard of Patients Selection
The analysis incorporated demographic variables, comorbidities, ICU severity scores, and laboratory parameters. Categorical variables, including gender and specific preexisting conditions, are presented as percentages (%). Continuous variables are summarized as median with interquartile range [IQR]. These include length of ICU stay (los_icu), patient age, and metrics such as International Normalized Ratio (inr), Prothrombin Time (pt), Partial Thromboplastin Time (ptt), Glasgow Coma Scale (gcs), Simplified Acute Physiology Score II (sapsii), Oxford Acute Severity of Illness Score (oasis), Systemic Inflammatory Response Syndrome score (sirs), along with multiple laboratory values: anion gap, bicarbonate, blood urea nitrogen (bun), calcium, chloride, creatinine, glucose, sodium, potassium, hematocrit, hemoglobin, mean corpuscular hemoglobin (mch), mean corpuscular hemoglobin concentration (mchc), mean corpuscular volume (mcv), platelet count, red blood cell count (rbc), red cell distribution width (rdw), white blood cell count (wbc), as well as derived platelet, INR, and APTT scores. Comorbidities assessed include myocardial infarction, congestive heart failure, peripheral vascular disease, cerebrovascular disease, dementia, chronic pulmonary disease, rheumatic disease, peptic ulcer disease, mild liver disease, diabetes without chronic complications, diabetes with chronic complications, paraplegia, renal disease, malignant cancer, severe liver disease, metastatic solid tumor, and the Charlson Comorbidity Index.
Statistical Analysis
Baseline characteristics of the study cohort were summarized by outcome groups. Categorical variables are expressed as frequencies and percentages, while continuous variables are presented as mean ± standard deviation or median with interquartile range, depending on their distribution. Group comparisons for continuous variables were performed using ANOVA or the Wilcoxon rank-sum test, as appropriate. Categorical variables were compared across outcomes using the Chi-square test or Fisher's exact test.
Kaplan-Meier curves were generated to visualize survival probabilities based on coagulation quantile score defined groups, with incidence rates for the primary endpoint derived therefrom. The log-rank test was used to evaluate statistical significance between groups.
The independent association between the coagulation score and 28 days and 60 days all-cause mortality was assessed via Cox regression, while its relationship with delirium risk was evaluated using logistic regression. The index was incorporated both as a categorical and a continuous variable. Four hierarchical models were constructed: Model 1 was unadjusted; Model 2 adjusted for sex and age; Model 3 further adjusted for age, Glasgow Coma Scale (GCS), SAPS II, OASIS, Systemic Inflammatory Response Syndrome (SIRS) score, and Charlson Comorbidity Index; Model 4 built upon Model 3 by additionally incorporating comorbidities including myocardial infarction, congestive heart failure, peripheral vascular disease, cerebrovascular disease, chronic pulmonary disease, diabetes without complications, diabetes with complications, and renal disease.
A restricted cubic spline (RCS) model was employed to examine non-linear relationships between coagulation score levels and outcome risks. Statistical significance for trends across coagulation score quartiles (Q1–Q4) was assessed. Stratified analyses and interaction tests using likelihood ratio tests were conducted to evaluate effect modification by key covariates: gender, age (<65 vs ≥65 years), heart failure, peripheral vascular disease, paraplegia, mild liver disease, severe liver disease, and metastatic solid tumor.
Result
Baseline Information for Survival and non-Survival
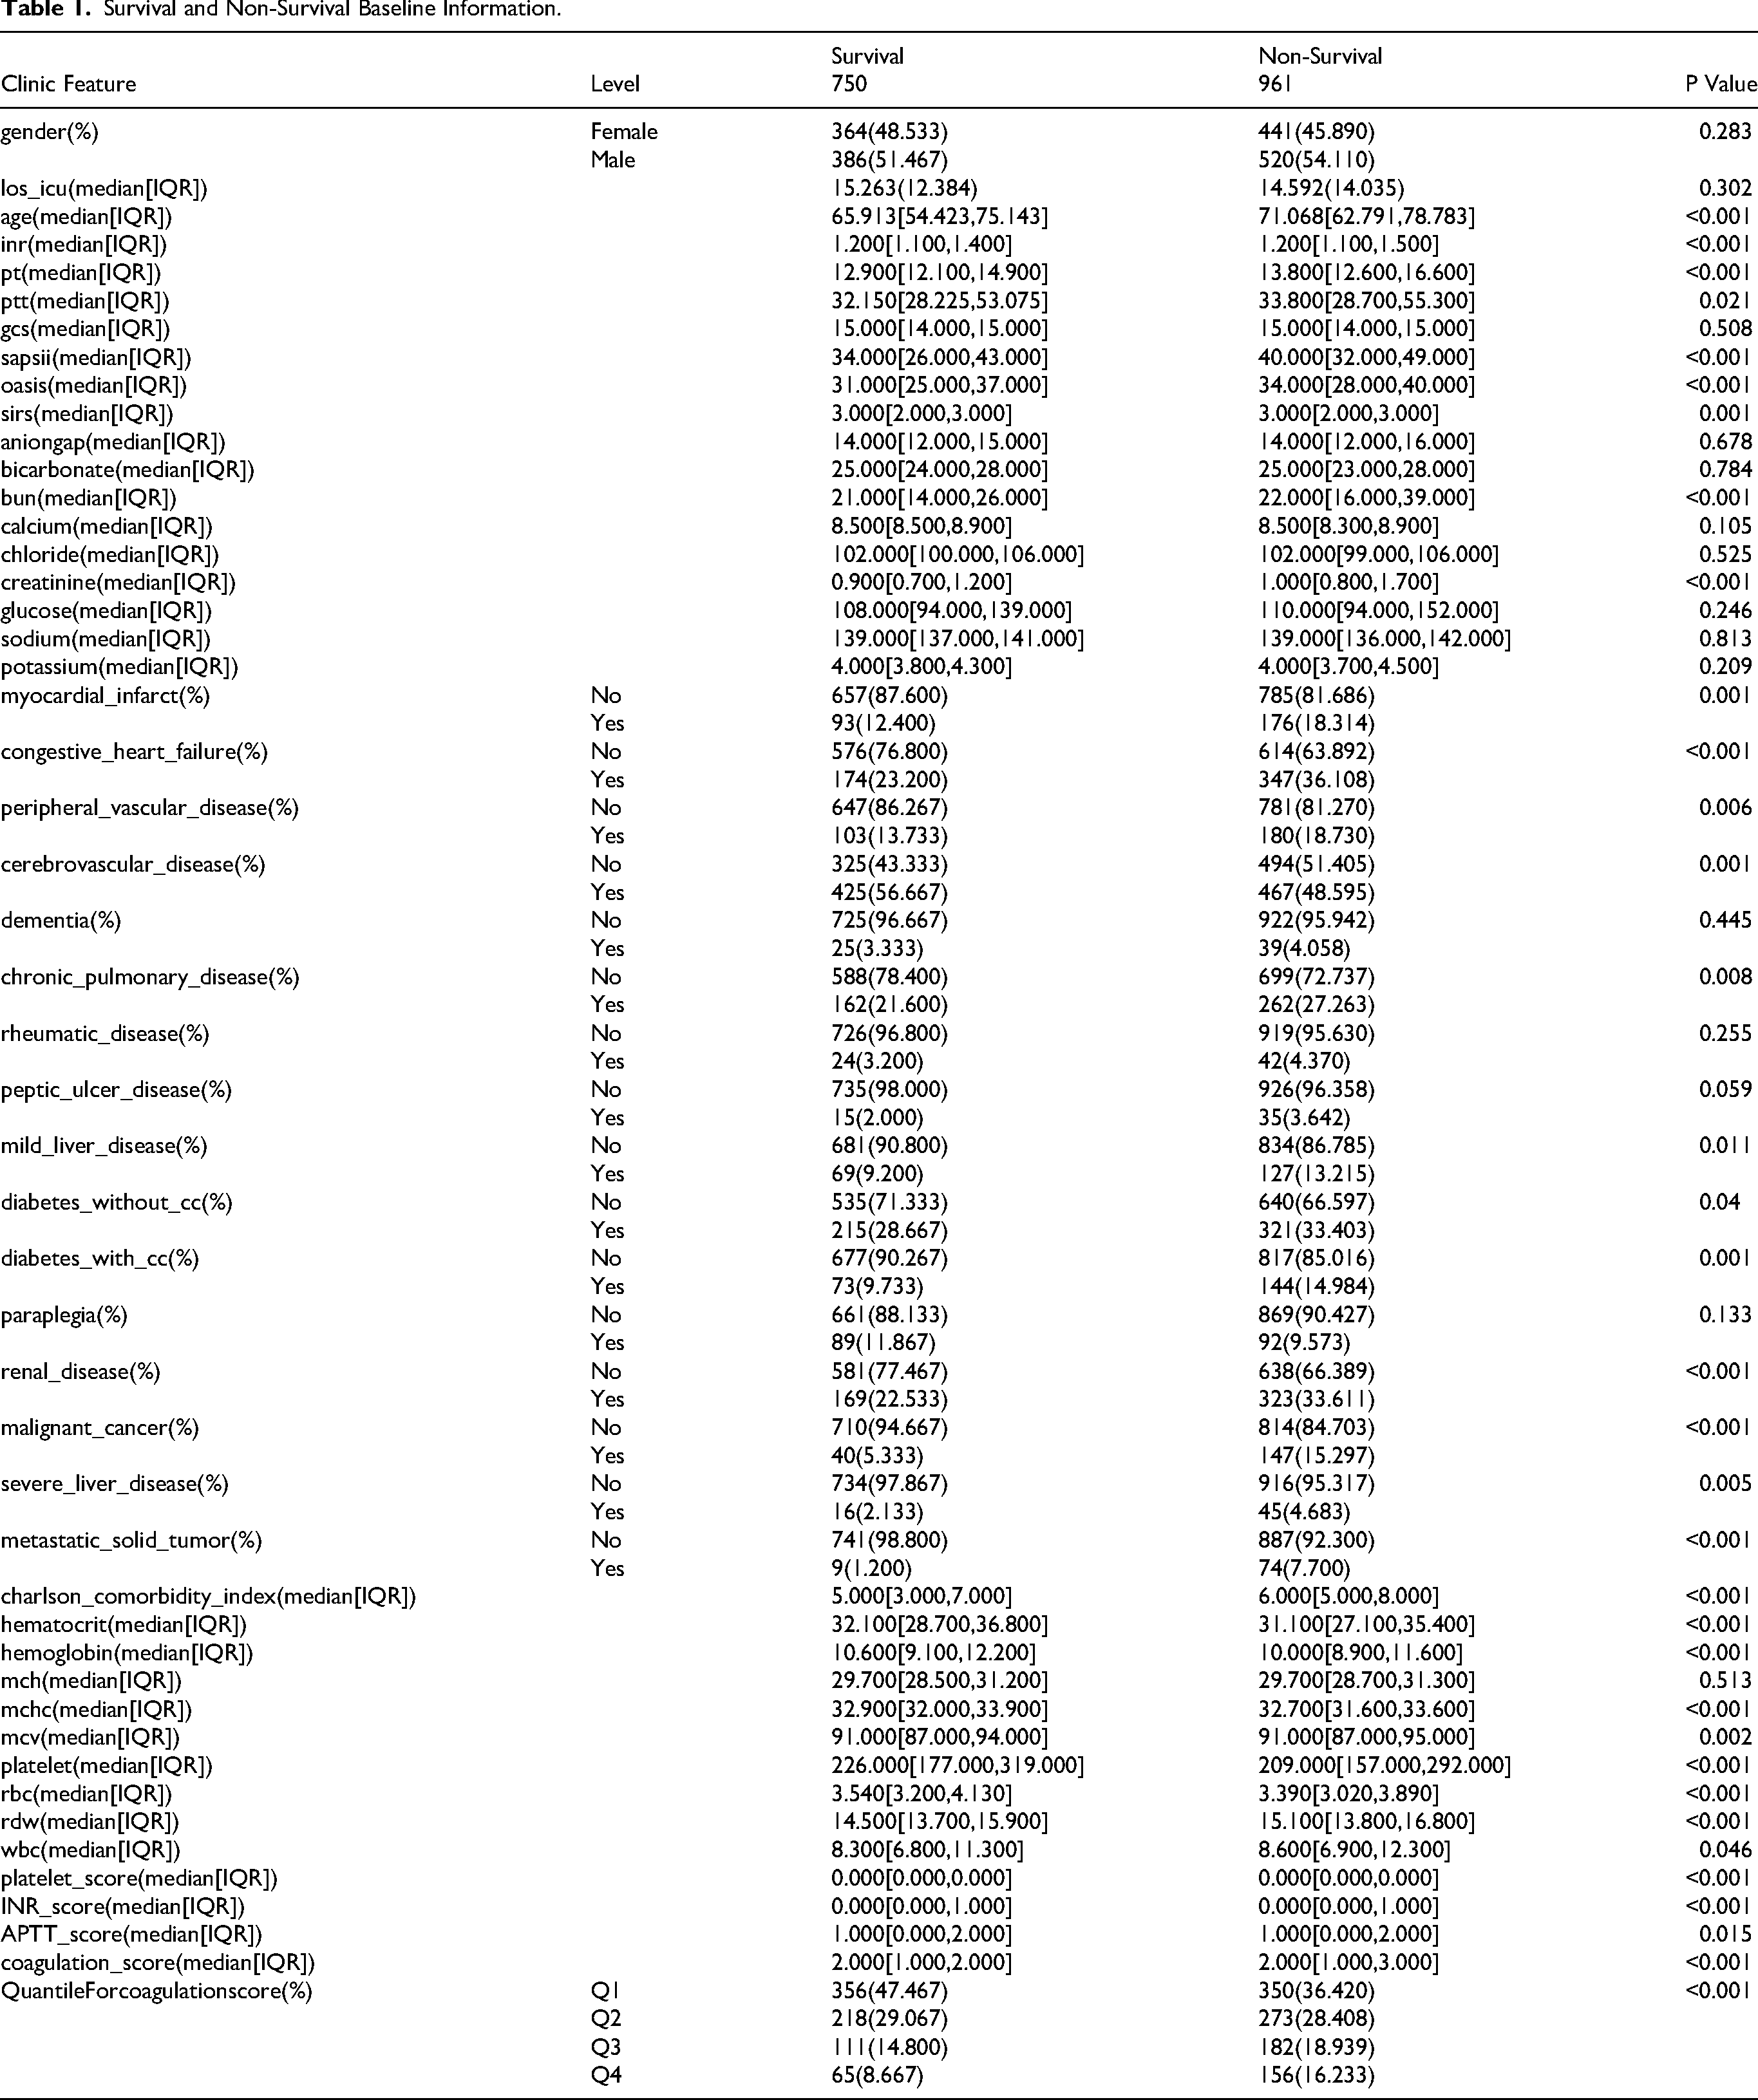
A total of 1711 subjects were included in the baseline data of this study, among which 750 were in the survival group and 961 were in the non-survival group. Baseline characteristics include demographic features, laboratory test indicators and comorbidities. In terms of demography, 48.53% were female in the survival group and 45.89% were female in the non-survival group. There was no statistically significant difference in gender distribution (P = 0.283). The median age of the survival group was 65.91 years old, and that of the non-survival group was 71.07 years old. There was a significant difference between the groups (P < 0.001). Laboratory examination indicators showed that there were significant differences between the two groups in terms of coagulation function (INR, PT, PTT), renal function (BUN, creatinine), hematological indicators (hematocrit, hemoglobin, MCV, platelets, RBC, RDW, WBC), etc (P < 0.05). The analysis of comorbidities showed that there were statistically significant differences in the distribution of myocardial infarction, congestive heart failure, peripheral vascular disease, cerebrovascular disease, chronic lung disease, mild liver disease, diabetes, kidney disease, malignant tumor, severe liver disease and metastatic solid tumor between the two groups (P < 0.05), among which the proportion of various comorbidities in the non-survival group was generally higher. The Charlson comorbidity index also showed significant differences between the two groups, with a median of 5 in the survival group and 6 in the non-survival group (P < 0.001). Coagulation score analysis showed that there were significant differences between the two groups in platelet score, INR score, APTT score and total coagulation score (P < 0.05). Stratification analysis by quartile also showed that the distribution differences between the groups were statistically significant (P < 0.001) (Table 1).
Survival and Non-Survival Baseline Information.
Baseline Information for Coagulation Score
We classified the patients into four grades (Q1-Q4) based on the coagulation function score. Research shows that as the coagulation function score increases, the coagulation indicators (INR, PT, PTT) of patients show a significant upward trend, and this is statistically significant (P < 0.001). In terms of demographic characteristics, there was a slight but statistically significant difference in gender distribution among different rating groups (P = 0.018), but no significant difference in age distribution (P = 0.398). Laboratory test results showed that renal function indicators (BUN, creatinine), hematological indicators (hematocrit, hemoglobin, MCV, platelets, RBC, RDW), etc all changed significantly with the increase of coagulation score (P < 0.001). Analysis of comorbidities revealed that there were statistically significant differences in the distribution of congestive heart failure, peripheral vascular disease, cerebrovascular disease, mild liver disease, paraplegia, nephropathy, severe liver disease and metastatic solid tumors among different coagulation score groups (P < 0.05). Among them, patients with higher coagulation scores generally had a higher incidence of various comorbidities. In addition, the Charlson comorbidity index also increased with the rise of the coagulation score (P = 0.024). There were significant differences in each coagulation score sub-item (platelet score, INR score, APTT score) and the total score among the four groups (P < 0.001), verifying the validity of the grouping (Table 2).
TheBaseline Information for Coagulation Quantile Score.

KM
This study evaluated the 28-day and 60-day survival prognosis of patients in different coagulation function score groups through Kaplan-Meier survival analysis (Figure 1). The left graph shows the 28-day (Figure 1A) survival rate (P = 0.006), and the right graph shows the 60-day (Figure 1B) survival rate (P = 0.0032). Specifically, the Q1 group (blue curve) with the lowest coagulation function score maintained the highest survival probability in both observation periods, while the Q4 group (pink curve) with the highest score had the most significant decline in survival rate, and the number of people at risk also decreased most obviously during the observation period. In the 28-day survival analysis, the survival curves of each group showed significant separation in the early stage. The 60-day survival analysis further revealed that this disparity continued to widen over time. The results indicated that abnormal coagulation function was significantly associated with poor short-term and medium-term prognosis of patients, and the higher the coagulation score, the worse the survival prognosis.

Km analysis for coagulation score for 28 days and 60 days all cause mortality. (A) 28-day all-cause mortality for different Coagulation score levels.(B) 60-day all-cause mortality for different Coagulation score levels.(P: P Value).
Cox Regression
This study evaluated the relationship between coagulation function scores and 28-day and 60-day all-cause mortality of patients through Cox regression analysis (Table 3), and a total of four stepwise adjusted regression models were constructed. For 28-day all-cause mortality, the effect value of the continuous coagulation function score in Model 1 was 1.075 (95%CI: 1.025–1.127, P = 0.003), even after adjusting for age, gender, GCS, SAPSII, OASIS, SIRS, Charlson comorbidity index and many other comorbidities in fully adjusted model4, it was still statistically significant (HR = 1.029) 95%CI: 0.979–1.082, P = 0.257. Analysis by quartile grouping showed that in Model 1, compared with group Q1, both group Q3 (HR = 1.216, 95%CI: 1.006–1.469, P = 0.043) and group Q4 (HR = 1.343, 95%CI: 1.098–1.643, P = 0.004) exhibited significantly higher risks of death. In the fully adjusted model (Model 4), the risk increase for Q4 versus Q1 was not statistically significant (HR = 1.154, 95%CI: 0.935–1.424, P = 0.183), indicating that the observed association may be confounded by illness severity and comorbidities. For 60-day all-cause mortality, the effect value of the continuous coagulation function score was 1.086 in Model 1 (95%CI: 1.038–1.136, P < 0.001), and it was still statistically significant in fully adjusted Model 4 (HR = 1.038, 95%CI: 0.990–1.089, P = 0.119. Analysis by quartile grouping showed that in Model 1, both group Q3 (HR = 1.247, 95%CI: 1.040–1.494, P = 0.017) and group Q4 (HR = 1.398, 95%CI: 1.154–1.693, P < 0.001) exhibited significantly higher risks of death. In fully adjusted model4, the Q4 group still maintained a significantly increased risk of death (HR = 1.183, 95%CI: 0.968–1.447, P = 0.101). The results indicated that an elevated coagulation score was associated with an increased risk of mortality in less adjusted models. However, this association was substantially attenuated and became non-significant in the fully adjusted model (Model 4), suggesting that the relationship may be largely explained by the overall burden of comorbidities and illness severity.
The Cox Regression for 28 Days and 60 Days all Cause Mortality.
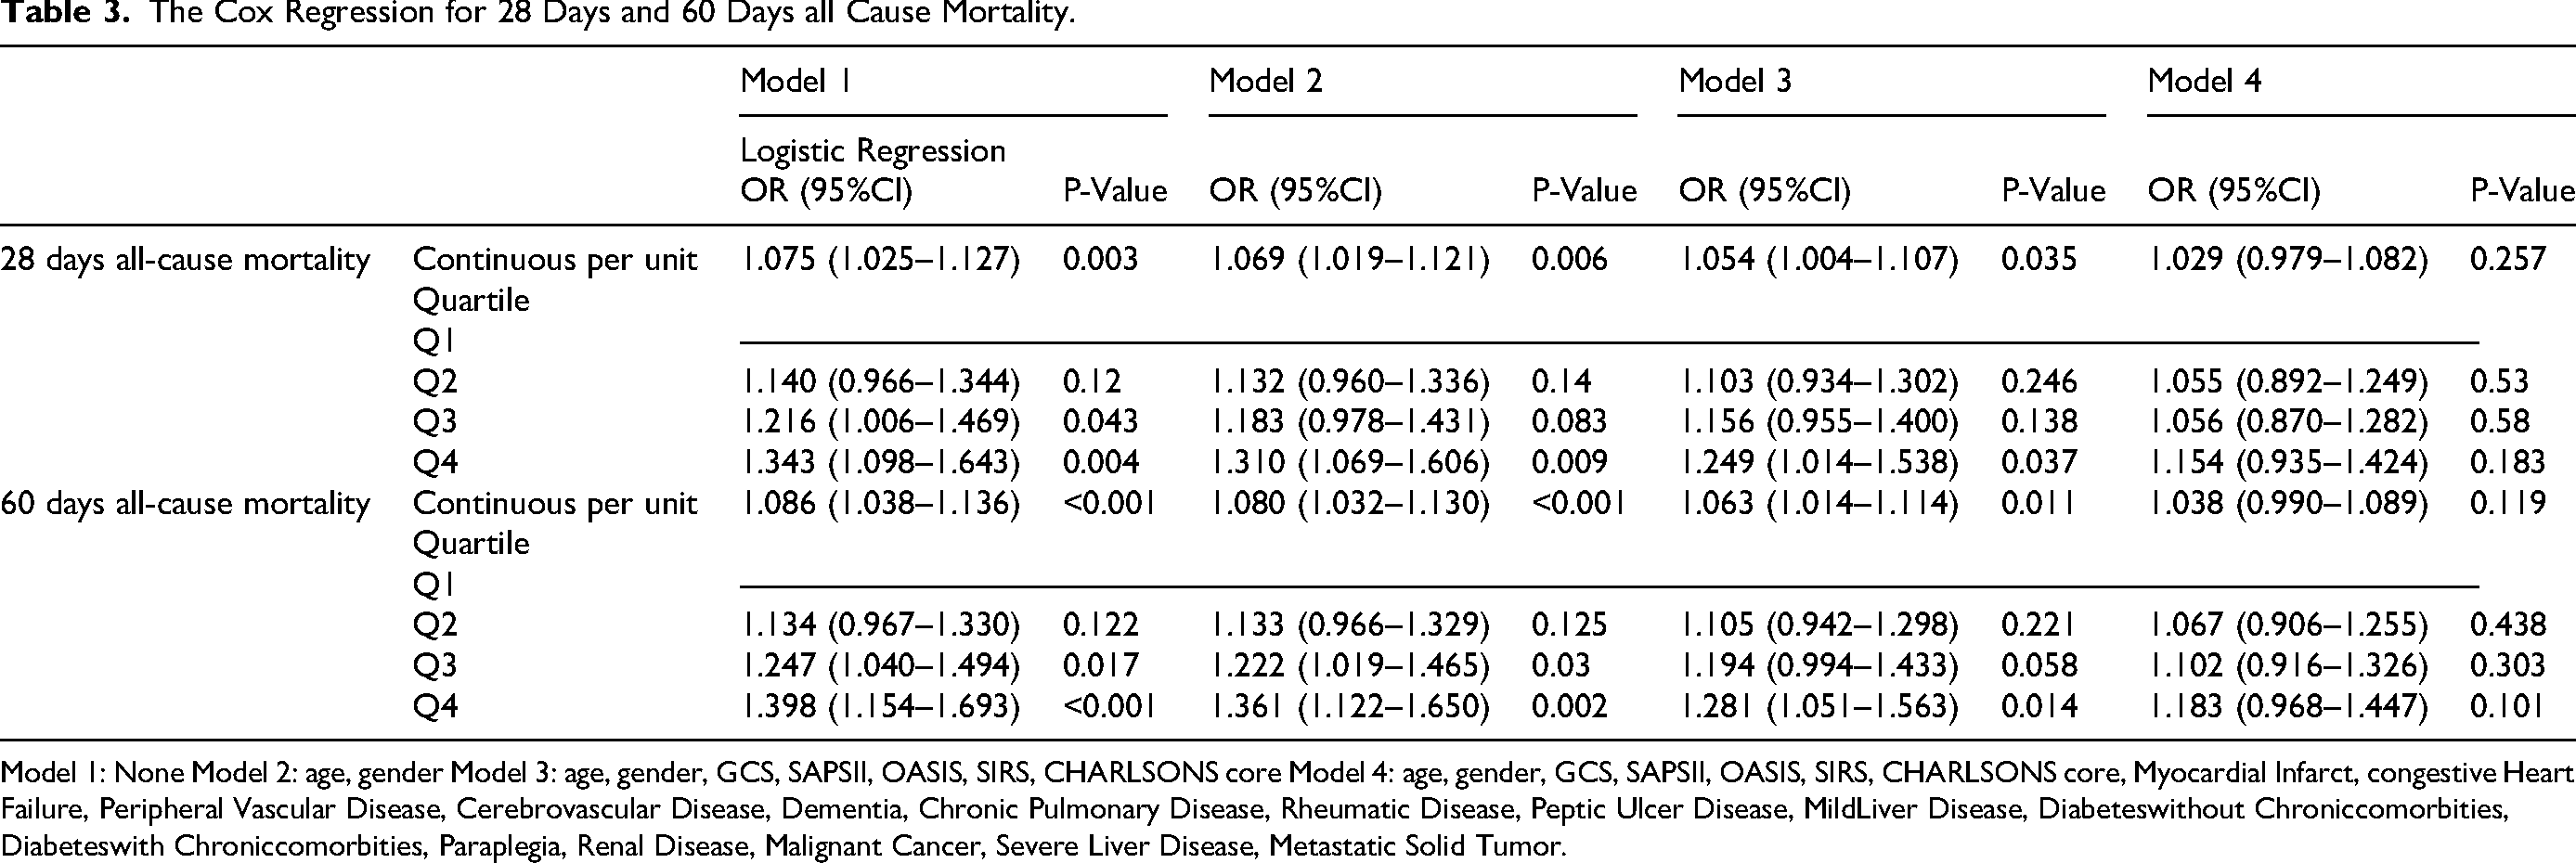
Model 1: None Model 2: age, gender Model 3: age, gender, GCS, SAPSII, OASIS, SIRS, CHARLSONS core Model 4: age, gender, GCS, SAPSII, OASIS, SIRS, CHARLSONS core, Myocardial Infarct, congestive Heart Failure, Peripheral Vascular Disease, Cerebrovascular Disease, Dementia, Chronic Pulmonary Disease, Rheumatic Disease, Peptic Ulcer Disease, MildLiver Disease, Diabeteswithout Chroniccomorbities, Diabeteswith Chroniccomorbities, Paraplegia, Renal Disease, Malignant Cancer, Severe Liver Disease, Metastatic Solid Tumor.
RCS Analysis
In this study, restricted cubic splines (RCS) were used to analyze the dose-response relationship between coagulation function scores and mortality risk (Figure 2). The analysis results showed that the coagulation function score was linearly positively correlated with both outcomes (nonlinear P values >0.05). The 95% confidence intervals were narrowest near the reference point and gradually widened towards the higher score ranges, indicating greater uncertainty in risk estimates at the upper extremes of the score. When the coagulation function score is lower than the reference value (2 points), the hazard ratio (HR) is slightly lower than 1.0. When the score exceeds 2 points, the HR value remains stable above 1.0 and continues to rise with the increase of the score. The 60-day mortality curve shows an earlier upward trend in risk (starting to rise when the score is slightly below 2), and the overall risk level is higher than that of the 28-day mortality. The 95% confidence intervals of the two graphs are the narrowest near the reference point and gradually widen towards the high score end, especially more obvious at the high score end of the 28-day mortality rate, indicating that there is considerable uncertainty in the risk estimation of the high score area. The results indicated that there was an approximately linear dose-response relationship between the coagulation function score and the short-term and medium-term risk of death in patients. The higher the score, the greater the risk of death, and this association was more obvious in the 60-day outcome.
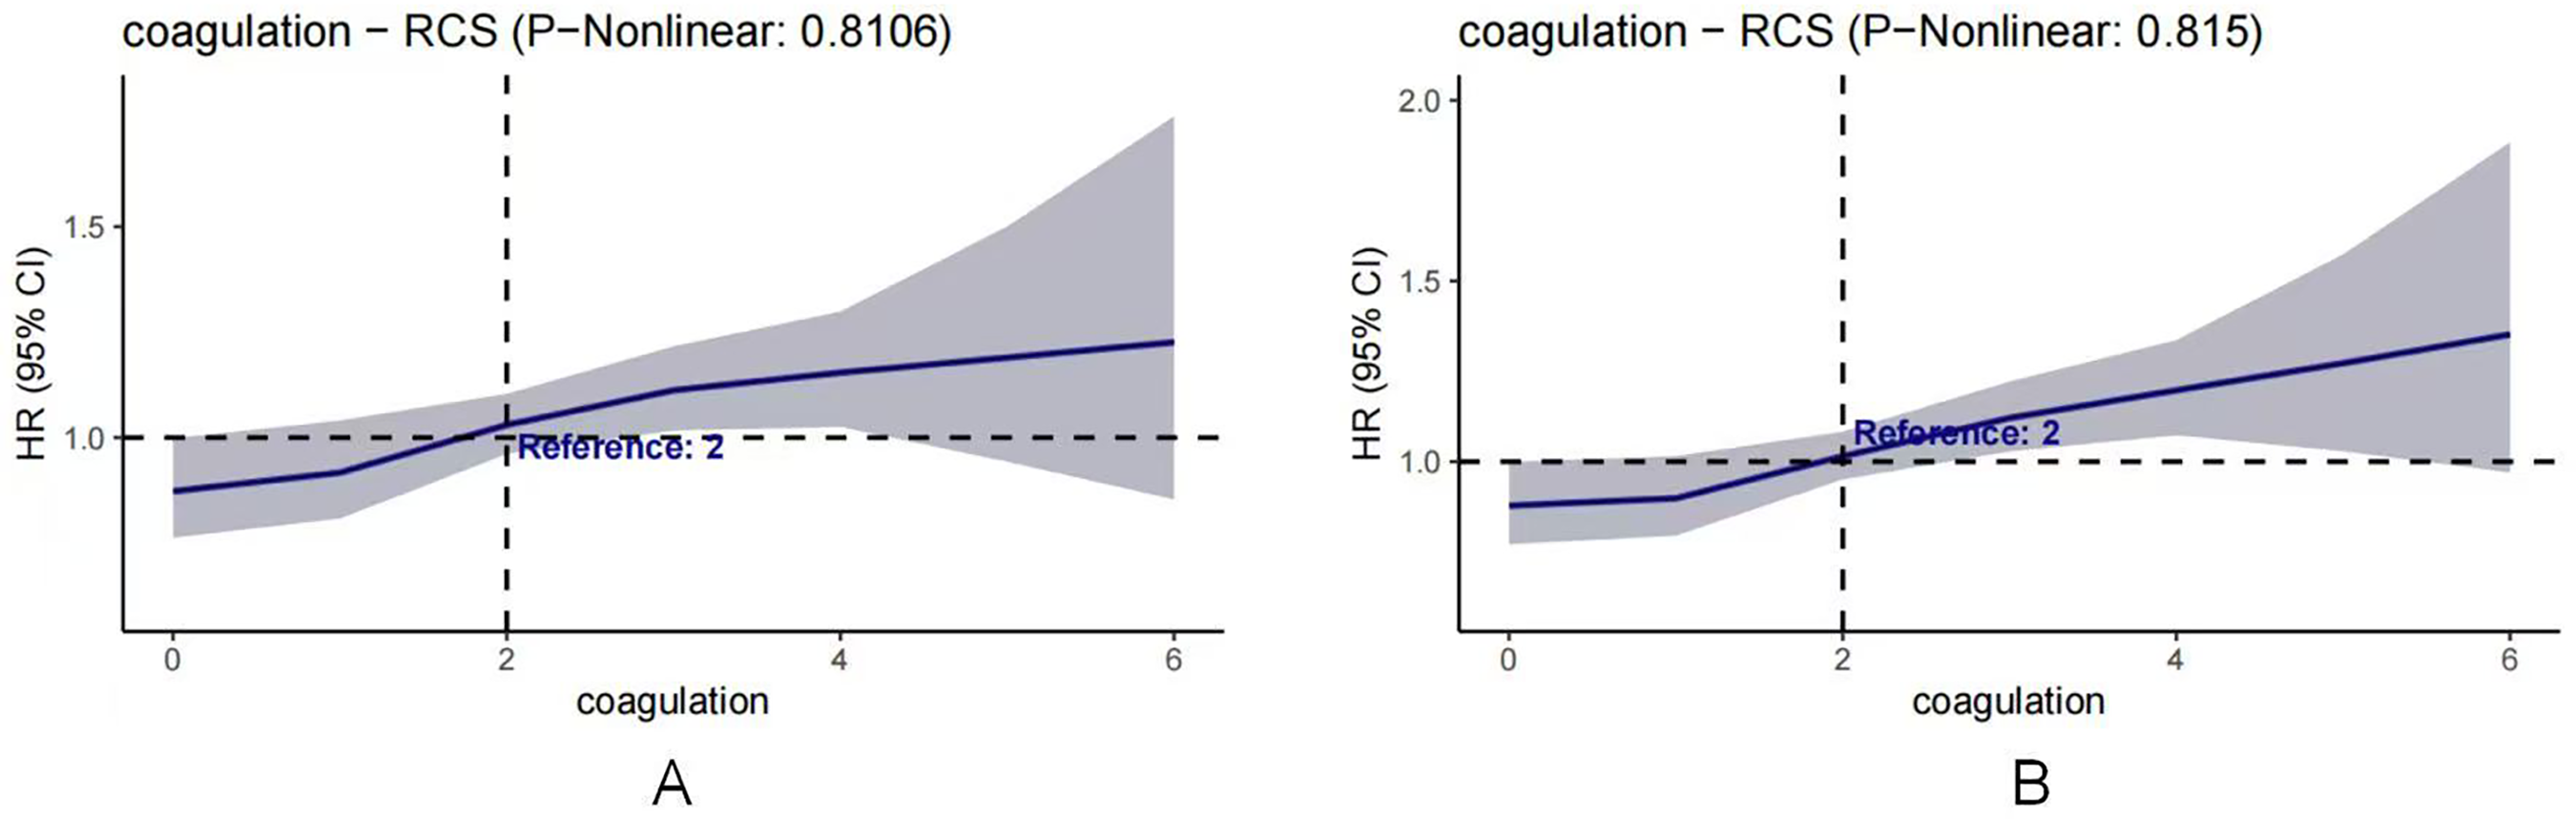
RCS for coagulation score for 28 days and 60 days all cause mortality. (A) 28-day all-cause mortality for different Coagulation score levels.(B) 60-day all-cause mortality for different Coagulation score levels.
Subgroup Analysis
This study evaluated the consistency of the association between coagulation function scores and 28-day (Figure 3A) and 60-day (Figure 3B) all-cause mortality of patients in different clinical characteristic populations through subgroup analysis. A total of 1711 patients were included in the analysis, covering 8 subgroup variables such as age, gender, and heart failure. The results showed that an elevated coagulation function score was significantly associated with an increased risk of death (28-day total HR = 1.07, 95%CI: 1.03–1.13, P = 0.003; 60-day total HR = 1.09, 95%CI: 1.04–1.14, P = 0.003). Subgroup analysis revealed that the association between coagulation scores and the risk of 60-day death was stronger in patients aged ≤65 years (HR = 1.15 vs HR = 1.04 for those over 65 years), but the interaction was not significant (P interaction=0.113). There was a significant interaction with heart failure (28 days P interaction=0.001; 60 days P interaction=0.001), and the coagulation score was significantly positively correlated with the risk of death in patients without heart failure (28 days HR = 1.12, P < 0.001; The 60-day HR = 1.14, P < 0.001), while there was no significant association among patients with heart failure. The coagulation score was significantly positively correlated with the risk of death in patients without heart failure, while there was no significant association among patients with heart failure. This interaction should be interpreted as hypothesis-generating, as it could be influenced by unmeasured confounding factors such as differential anticoagulant use, and requires confirmation in future studies.

Subgroup analysis for 28 days and 60 days all cause mortality by coagulation score. (A) 28-day all-cause mortality for different Coagulation score levels.(B) 60-day all-cause mortality for different Coagulation score levels.
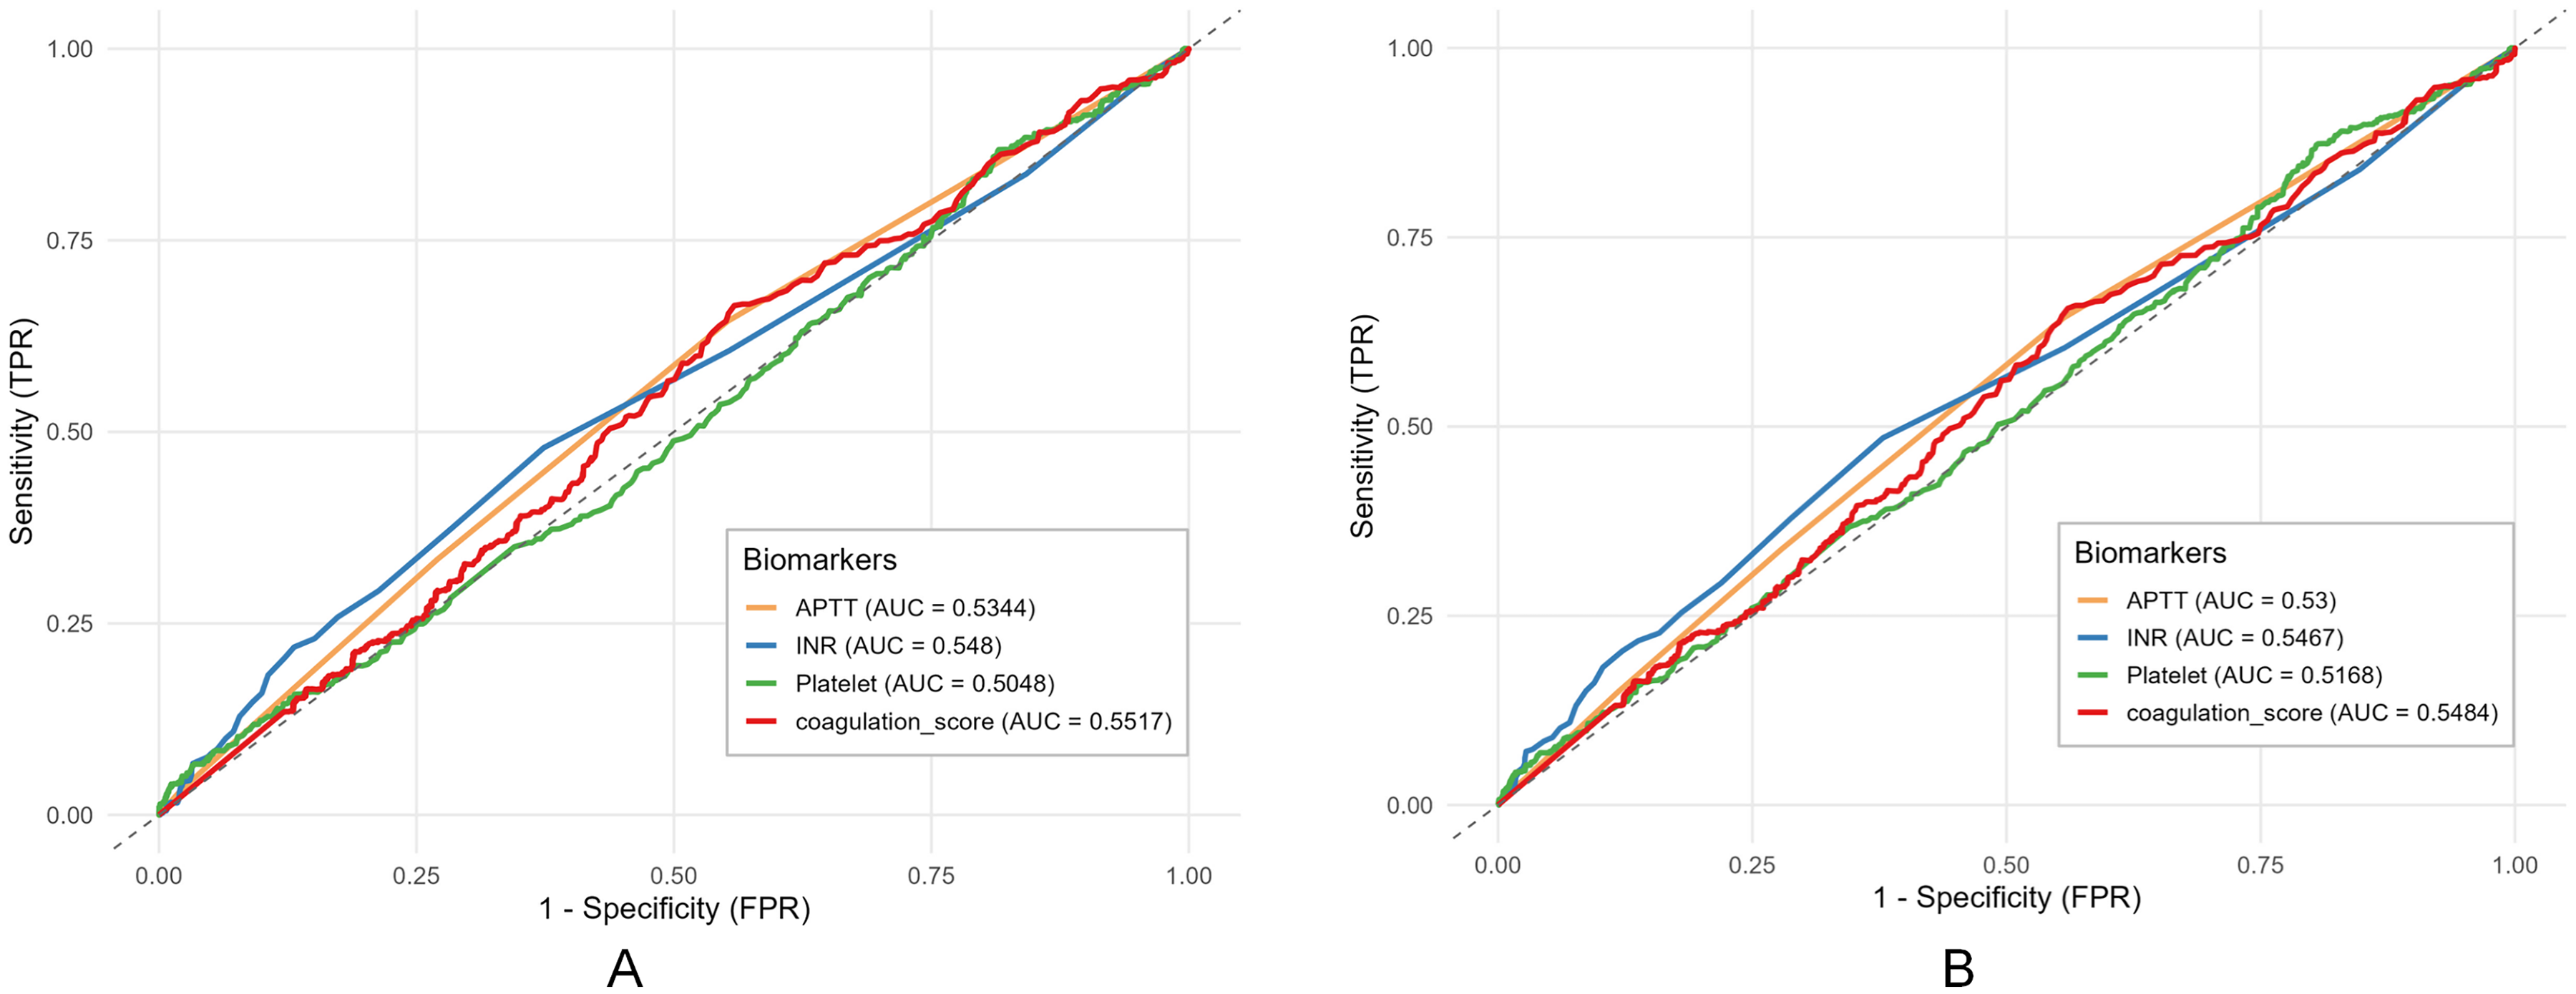
Roc curve for 28 days and 60 days all cause mortality by different coagulation index comparison. (A) 28-day all-cause mortality for different Coagulation score levels.(B) 60-day all-cause mortality for different Coagulation score levels.(P: P Value).
ROC
This study evaluated the predictive performance of four coagulation-related biomarkers—APTT, INR, platelet count, and coagulation score—for 28-day (Figure 4A) and 60-day (Figure 4B) mortality using receiver operating characteristic (ROC) curve analysis. The coagulation score demonstrated the highest discriminatory ability among the biomarkers, with an area under the curve (AUC) of 0.5517 for 28-day mortality and 0.5484 for 60-day mortality. INR exhibited the next best predictive efficacy, with AUC values of 0.5480 and 0.5467 for 28-day and 60-day mortality, respectively. APTT and platelet count showed the lowest predictive performance, with AUC values consistently close to 0.5 across both timepoints—APTT yielding AUCs of 0.5344 (28-day) and 0.5300 (60-day), and platelet count showing AUCs of 0.5048 (28-day) and 0.5168 (60-day). Overall, while none of the biomarkers exhibited strong predictive power (AUC > 0.7), the coagulation score consistently outperformed the conventional coagulation parameters, though its discriminatory capacity remained limited in this cohort.
Overall, while the coagulation score consistently outperformed the conventional coagulation parameters, its discriminatory capacity remained limited in this cohort (AUC ∼0.55), suggesting poor performance as a standalone predictive tool.
Dicussion
This comprehensive retrospective cohort study of 1711 patients with ischemic stroke following cerebrovascular intervention yields several noteworthy findings regarding the prognostic significance of coagulation abnormalities. Our principal results demonstrate that a composite coagulation score was significantly associated with both 28-day and 60-day all-cause mortality in unadjusted and partially adjusted analyses. However, this association was attenuated after comprehensive adjustment for comorbidities and illness severity scores, indicating a substantial contribution of these confounding factors. The restricted cubic spline analysis further revealed an approximately linear dose-response relationship between coagulation scores and mortality risk, without evidence of threshold effects. Notably, subgroup analyses identified potential effect modification by heart failure status, with stronger associations observed in patients without heart failure. However, this association was attenuated and lost statistical significance after comprehensive adjustment for comorbidities and illness severity scores, indicating a substantial contribution of these confounding factors and underscoring that the score is not an independent predictor of mortality.
Our findings align with and extend the growing body of evidence supporting the prognostic value of coagulation abnormalities in stroke outcomes. The observed association between elevated coagulation scores and increased mortality risk resonates with previous investigations focusing on individual parameters.15,16 For instance, Hani et al demonstrated that elevated INR values upon admission were associated with increased mortality in ischemic stroke patients, though their study focused primarily on pre-stroke anticoagulation status rather than post-intervention coagulation dynamics. 17 Similarly, the association between thrombocytopenia and poor outcomes in critical care has been established in multiple studies, including the work of Qian et al, who reported that platelet count depletion was associated with doubled mortality risk in ICU patients. 18
However, our study advances beyond previous research by demonstrating the superior integrative value of a composite score compared to individual parameters. This approach acknowledges the complex, multifactorial nature of coagulation disturbances in critically ill patients. Our findings are consistent with emerging literature supporting composite coagulation assessment in other clinical contexts.19,20 For example, in trauma care, the concept of trauma-induced coagulopathy scores has gained significant traction, with studies demonstrating that composite scores outperformed individual parameters in predicting massive transfusion requirements and mortality. 21 Similarly, in septic shock, coagulation scoring systems have shown promise for risk stratification, as evidenced on sepsis-induced coagulopathy. 22
The temporal pattern of risk association observed in our study—with stronger effects for 60-day compared to 28-day mortality—warrants particular consideration. This finding suggests that coagulation abnormalities may not only influence early complications but also contribute to sustained vulnerability through mechanisms potentially involving recurrent vascular events, healthcare-associated infections, or other complications related to persistent inflammatory-coagulative cross-talk.
The subgroup analysis revealing effect modification by heart failure status presents intriguing implications. The attenuated association between coagulation scores and mortality in heart failure patients may reflect several factors: competing risks from cardiovascular mortality, altered hemodynamic influences on coagulation parameters, or differential medication effects including more prevalent anticoagulation use.23,24 We frame this finding as hypothesis-generating. The attenuated association between coagulation scores and mortality in heart failure patients may be confounded by unmeasured factors such as differential anticoagulant use or competing risks, and thus requires confirmation in future studies.
The biological mechanisms underlying the observed associations likely involve complex interactions between coagulation pathways, inflammatory responses, and endothelial dysfunction—a triad increasingly recognized as central to stroke pathophysiology.25,26 The coagulation score utilized in our study captures distinct but interrelated aspects of hemostatic function: platelet count reflecting primary hemostasis, INR representing the extrinsic pathway, and APTT indicating the intrinsic pathway. Abnormalities across these multiple domains likely signify more severe disruption of hemostatic balance, with implications for both thrombotic and hemorrhagic complications.
The linear dose-response relationship observed through RCS analysis suggests a continuous risk gradient without apparent safety thresholds. This pattern implies that even moderate deviations from normal coagulation parameters may confer increased risk, supporting the concept of a continuum of coagulation disturbance rather than a dichotomous normal/abnormal classification. From a pathophysiological perspective, this continuum may reflect progressive endothelial dysfunction and dysregulation of coagulation-inflammation cross-talk, mechanisms that have been increasingly implicated in stroke progression and recovery.27,28
The particularly strong association with 60-day mortality may be explained through several mechanistic pathways. First, persistent coagulation abnormalities could facilitate recurrent ischemic events during the vulnerable recovery period. 29 Second, coagulopathy may predispose to hemorrhagic complications, particularly in the context of antithrombotic therapies routinely administered post-intervention. 30 Third, coagulation disturbances may serve as a marker of systemic illness severity, reflecting multisystem dysfunction that influences long-term recovery. 31 Finally, emerging evidence suggests bidirectional relationships between coagulation abnormalities and common post-stroke complications including infections, which themselves significantly impact medium-term outcomes. 32
This research has several limitations. Firstly, as a retrospective study using the MIMIC-IV database, our findings are susceptible to selection bias, and the requirement for complete baseline coagulation data may have excluded patients with severe illness, limiting generalizability. Secondly, despite adjusting for many covariates, residual confounding remains a concern, particularly regarding dynamic clinical variables and specifics of the endovascular intervention that were not fully captured. Thirdly, the coagulation score quartiles were derived from our cohort's data distribution rather than established clinical criteria. Although we adjusted for multiple confounders, the loss of statistical significance in the fully adjusted model suggests residual confounding by unmeasured factors, such as the specifics of the endovascular procedure. The imputation of missing laboratory values using the population mean, although minimal, may introduce bias. Lastly, the inclusion of numerous covariates in Model 4 raises the potential for overfitting. Additionally, since coagulation data were obtained on the first day of admission, they may not fully reflect post-intervention coagulation abnormalities. Future studies should consider post-intervention data for more accurate assessment.
In conclusion, an integrated coagulation score demonstrated a significant association with increased mortality risk in ischemic stroke patients post-intervention, showing a linear dose-response relationship. However, this association was not independent of overall illness severity and comorbidity burden in fully adjusted analyses. The score's discriminative performance was modest (AUC ∼0.55). Therefore, its potential value lies as a component of a comprehensive assessment rather than as a standalone predictor. While requiring validation in external cohorts, these findings support the incorporation of comprehensive coagulation assessment into risk stratification protocols and generate hypotheses regarding potential targeted interventions to optimize hemostatic function during recovery.
Footnotes
Funding
The authors received no financial support for the research, authorship, and/or publication of this article.
Declaration of Conflicting Interests
The authors declared no potential conflicts of interest with respect to the research, authorship, and/or publication of this article.