
Abstract
Clot waveform analysis (CWA) involves an analysis of the activated partial thromboplastin time (CWA-APTT), diluted prothrombin time (CWA-dPT), and small amount of thrombin time (CWA-sTT), and clot fibrinolysis waveform analysis (CFWA). CWA was evaluated in order to propose its clinical application. CWA exhibits an abnormal waveform, as well as peak times and heights in its derivative curves. Although the CWA-APTT is frequently examined and
Introduction
Traditionally, clotting times, such as activated partial thromboplastin time (APTT), 1 prothrombin time (PT), 2 and thrombin time (TT) 3 have been measured manually (Figure 1). After the development of automatic optical coagulation analyzers, it became possible to visualize the clot reaction curves using different clotting time techniques. The MDA system (Organon Teknika, Cambridge, United Kingdom) was first able to visualize clot formation to detect biphasic waveforms in disseminated intravascular coagulation (DIC)4-6 or very low concentrations of FVIII activity. 7 The biphasic clot reaction curve was reported to be caused by a complex of C-reactive protein, very-low-density lipoprotein, and calcium ions. 8
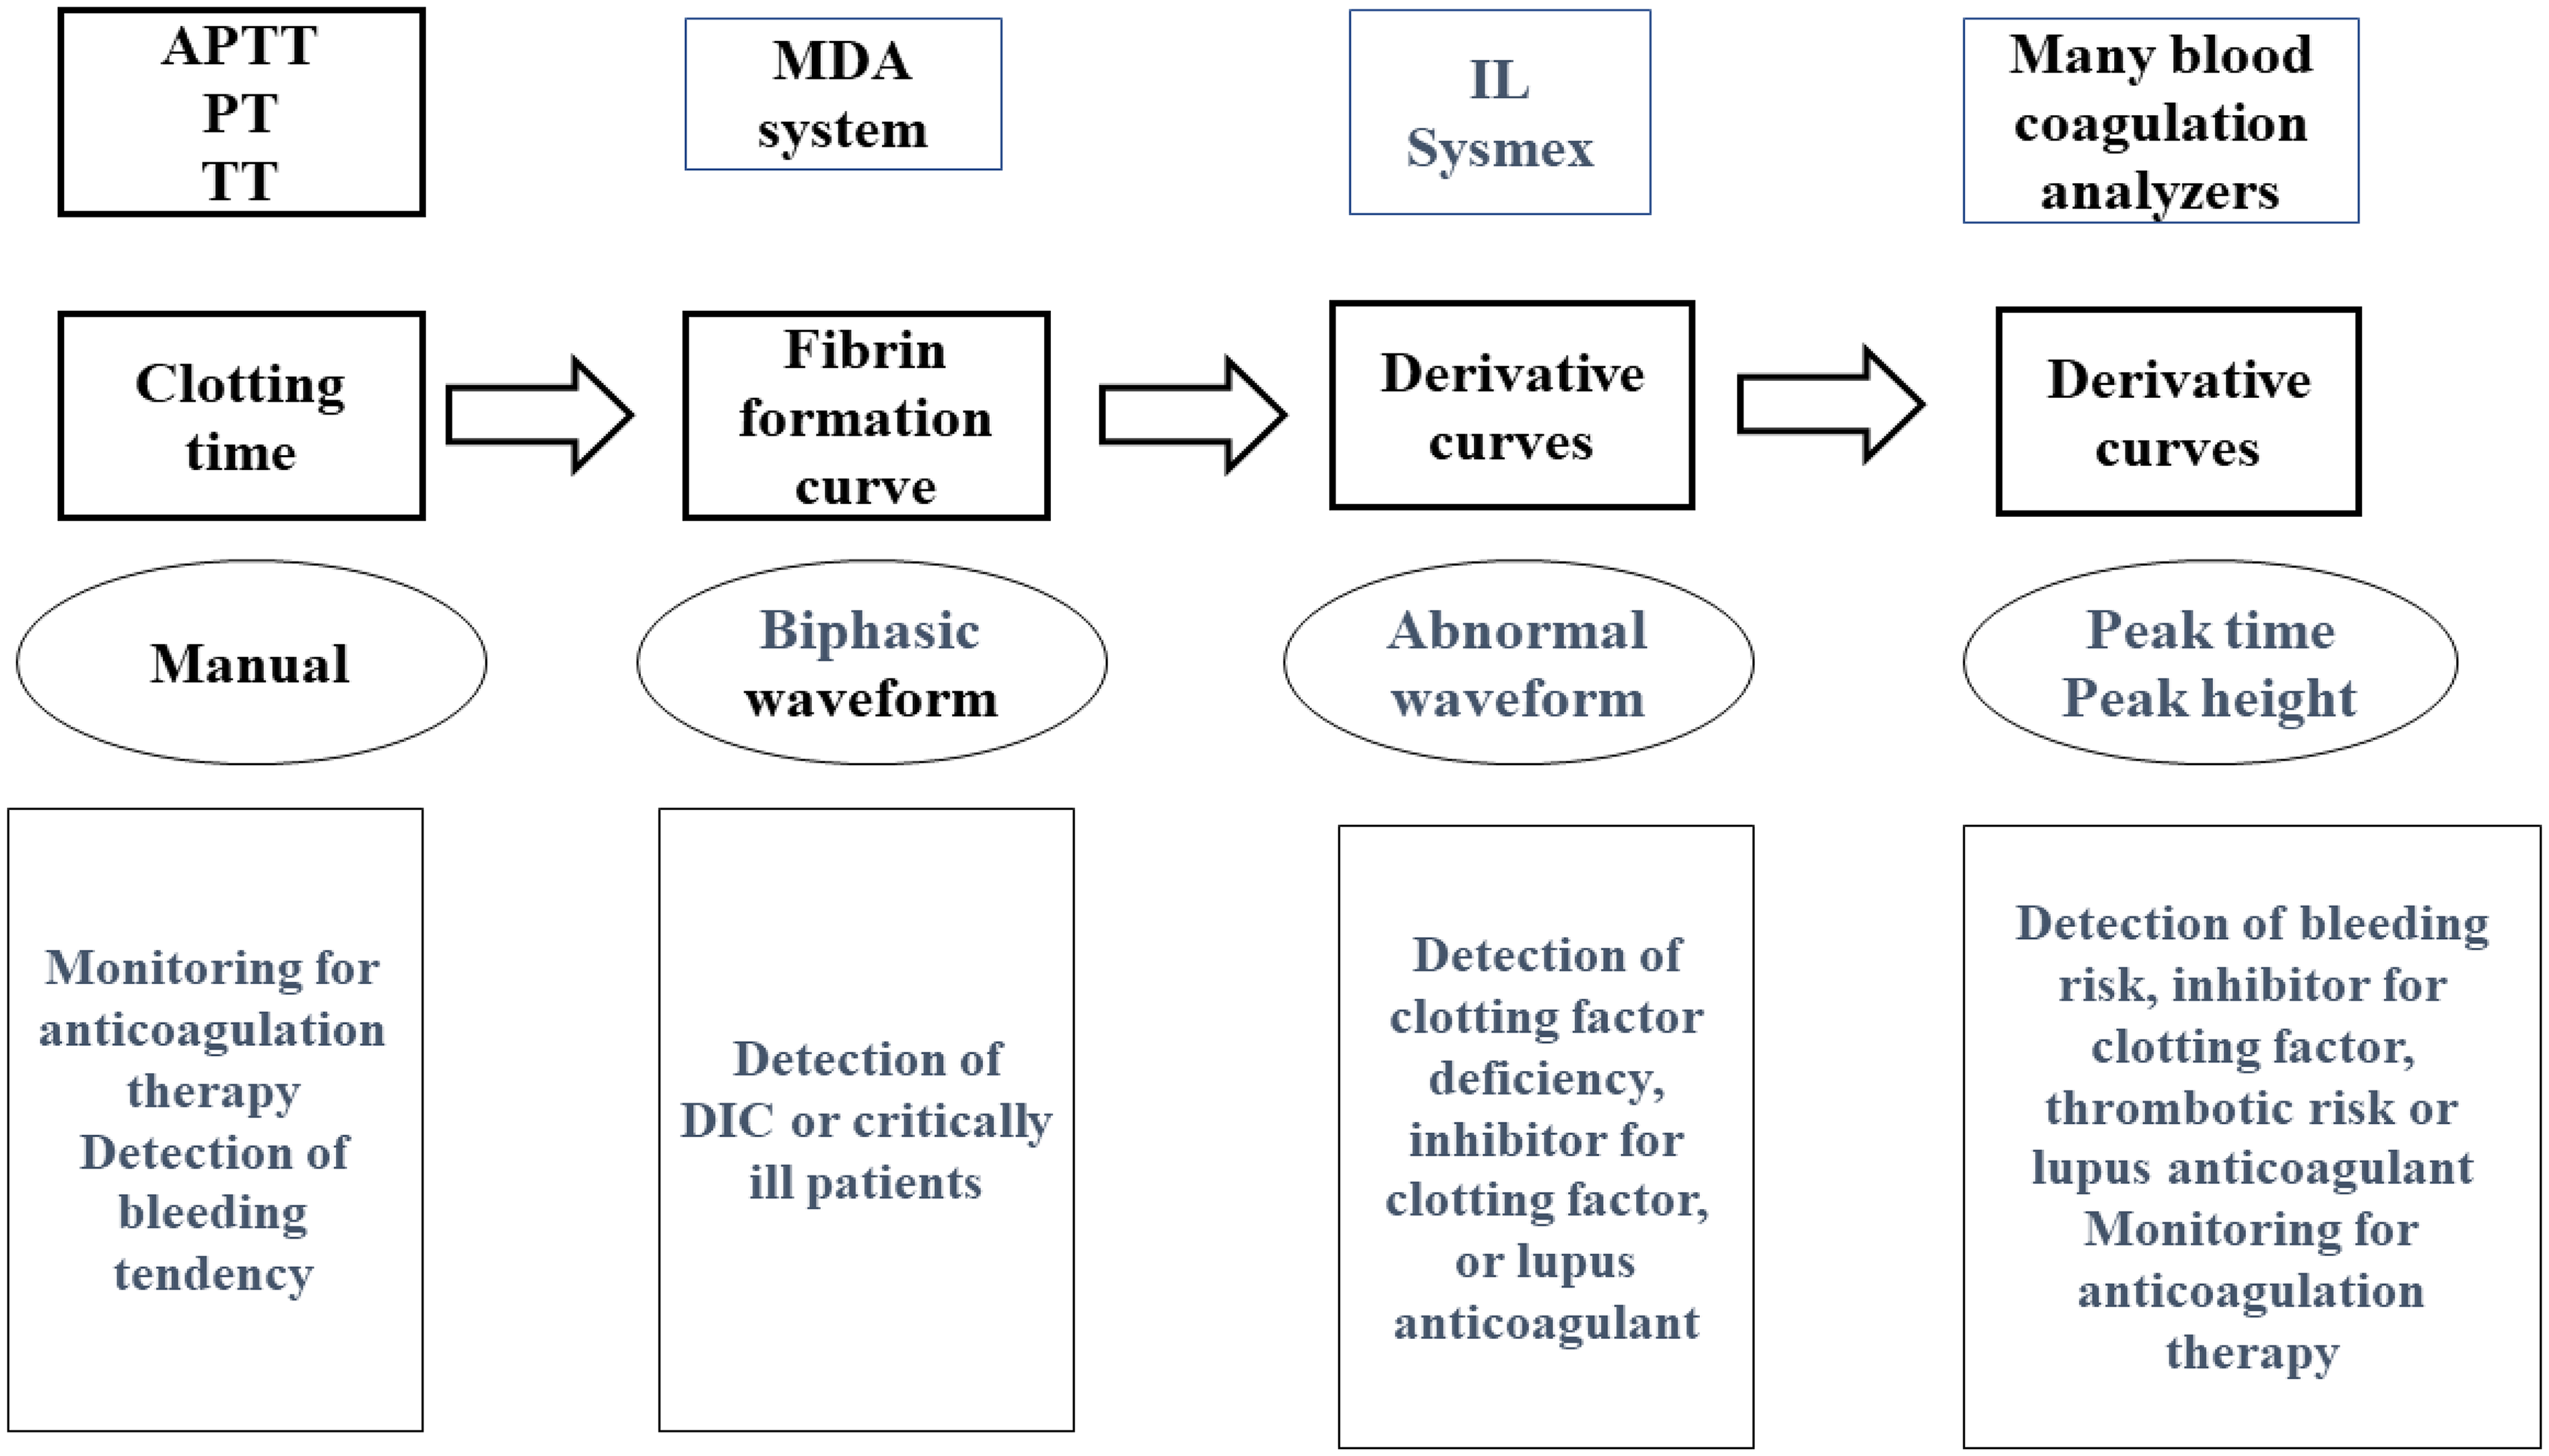
Development of clotting time. APTT, activated partial thromboplastin time; PT, prothrombin time; TT, thrombin time; IL, instrument laboratory; DIC, disseminated intravascular coagulation.
Clot waveform analysis (CWA) of the derivative curve from the fibrin formation curve in the ACL-TOP series (Werfen, Bedford, MA, USA) 9 and CS-Series analyzers (Sysmex Corporation, Kobe, Japan) 10 showed abnormal waveforms, which suggested hemostatic abnormalities such as clotting factor deficiencies, 11 inhibitors of clotting factor, 12 and lupus anticoagulant (LA). 13 Subsequently, analysis of the evaluation for the peak time and height of each derivative curve allowed for further evaluation of hemostatic abilities in hemophilia A, acquired hemophilia A, LA, and monitoring for anticoagulant.14-17 Although LA showed marked abnormality in CWA-APTT, there were no significant differences between LA and clotting factor deficiency, 14 suggesting that another method is required for the differential diagnosis of LA based on clotting factor deficiency. The limitations of APTT are attributable to APTT reagents, methodology, and use of platelet-poor plasma (PPP). Several modified CWAs has been developed, including CWA-diluted PT (CWA-dPT), CWA-small amount of tissue-factor induced FIX activation assay (CWA-sTF/FIXa), 18 clot fibrinolysis waveform analysis (CFWA),19,20 and CWA-small amount of thrombin time (CWA-sTT) (Table 1). 21
Modified CWA

CWA, clot waveform analysis; sTF/FIXa, small amount of tissue factor induced FIX activation assay; sTT, small amount of thrombin time; CFWA, clot fibrinolysis waveform analysis; PRP, platelet rich plasma; PPP, platelet poor plasma; PT, prothrombin time; APTT, activated partial thromboplastin; tPA, tissue type plasminogen activator.
An evaluation using only the clotting time of APTT without CWA may fail to detect the risk of major bleeding or thrombotic, and the clinical application of CWA should be developed and expanded. Therefore, we reviewed the development of CWA, modified CWAs, and the clinical application of CWA in predicting the risk of thrombosis or bleeding.
Clot Waveform Analysis (CWA)
Automatic optical coagulation analyzers that contain software programs for CWA include the ACL TOP series, 9 CN-Series analyzers, 10 STACIA (PHC Corporation, Tokyo, Japan), and S-400CF (Sekisui Corporation, Tokyo, Japan) This software can display clot reaction curves as well as associated first- and second-derivative plots. These derivative plots were automatically calculated from the absorbance data and were reflected in the first and second derivative curves. The first and second derivative curves are called velocity and acceleration, respectively (Figure 2). The first derivative curve reflects coagulation ability22,23 and the second derivative curve reflects FVIII activity 24 or its interaction with phospholipids.25,26

Fibrin formation curve, first derivative curve and second derivative curve in clot wave form analysis – activated partial thromboplastin time.
CWA showed an abnormal biphasic waveform, peak time, peak height, peak width, and area under the curve in the fibrin formation curve, as well as first- and second-derivative curves.
Abnormal Waveform
An abnormal waveform (biphasic waveform) appears in samples from patients with clotting factor deficiency or clotting factor inhibitors,5,27,28 DIC, 29 liver dysfunction, 30 LA, 13 or treatment with anticoagulant therapy17,25 (Figure 3), suggesting that further examination for hemostatic abnormalities is required; however, an abnormal waveform can be visualized by automatic enlargement of the waveform, which may cause missed detection of the prolongation of the peak time or reduced peak height.14,25

Abnormal waveform in clot waveform analysis of APTT. HA, hemophilia A; AHA, acquired HA; LA, lupus anticoagulant; DIC, disseminated intravascular coagulation; navy line, fibrin formation curve; fibrin formation; pink line, first derivative curve; light blue, second derivative curve; solid line, patient; dotted line, control.
Peak Time
The peak time of fibrin formation and the first and second derivatives of the CWA-APTT curve provided a good reflection of the cascade system 31 within the hemostatic process. APTT is determined as the beginning, middle, or peak time of fibrin formation, or the second derivative curve of CWA-APTT. The APTT, including the peak time of the CWA-APTT, reflects the effect of unfractionated heparin (UFH) treatment 32 but does not reflect the risk of major bleeding due to UFH treatment. The peak time of CWA-APTT also reflects the effect of direct oral anti-Xa agents 17 and argatroban. 23
Peak Height
The peak height of the first-derivative curve of the CWA indicates blood coagulation ability.14,25 Elevated peak heights of CWA-APTT and CWA-sTF/FIXa have been reported in patients with malignant neoplasms, 22 especially hepatic cell carcinoma, 30 infection, 33 and acute cerebral infarction, 23 and reduced peak heights have been reported in patients with hemophilia A, 5 FVIII inhibitors, 27 and idiopathic thrombocytopenic purpura. 34 In particular, the reduced peak height of the first derivative in CWA-APTT, rather than the prolonged peak time of the first derivative in CWA-APTT, suggests a risk of major bleeding (Figure 4). Although the peak time of the first derivative in CWA-APTT was prolonged in patients treated with UFH, a normal peak height of the first derivative in CWA-APTT suggests that there is no risk of major bleeding. However, both prolonged peak time and low peak height suggest a risk of bleeding.
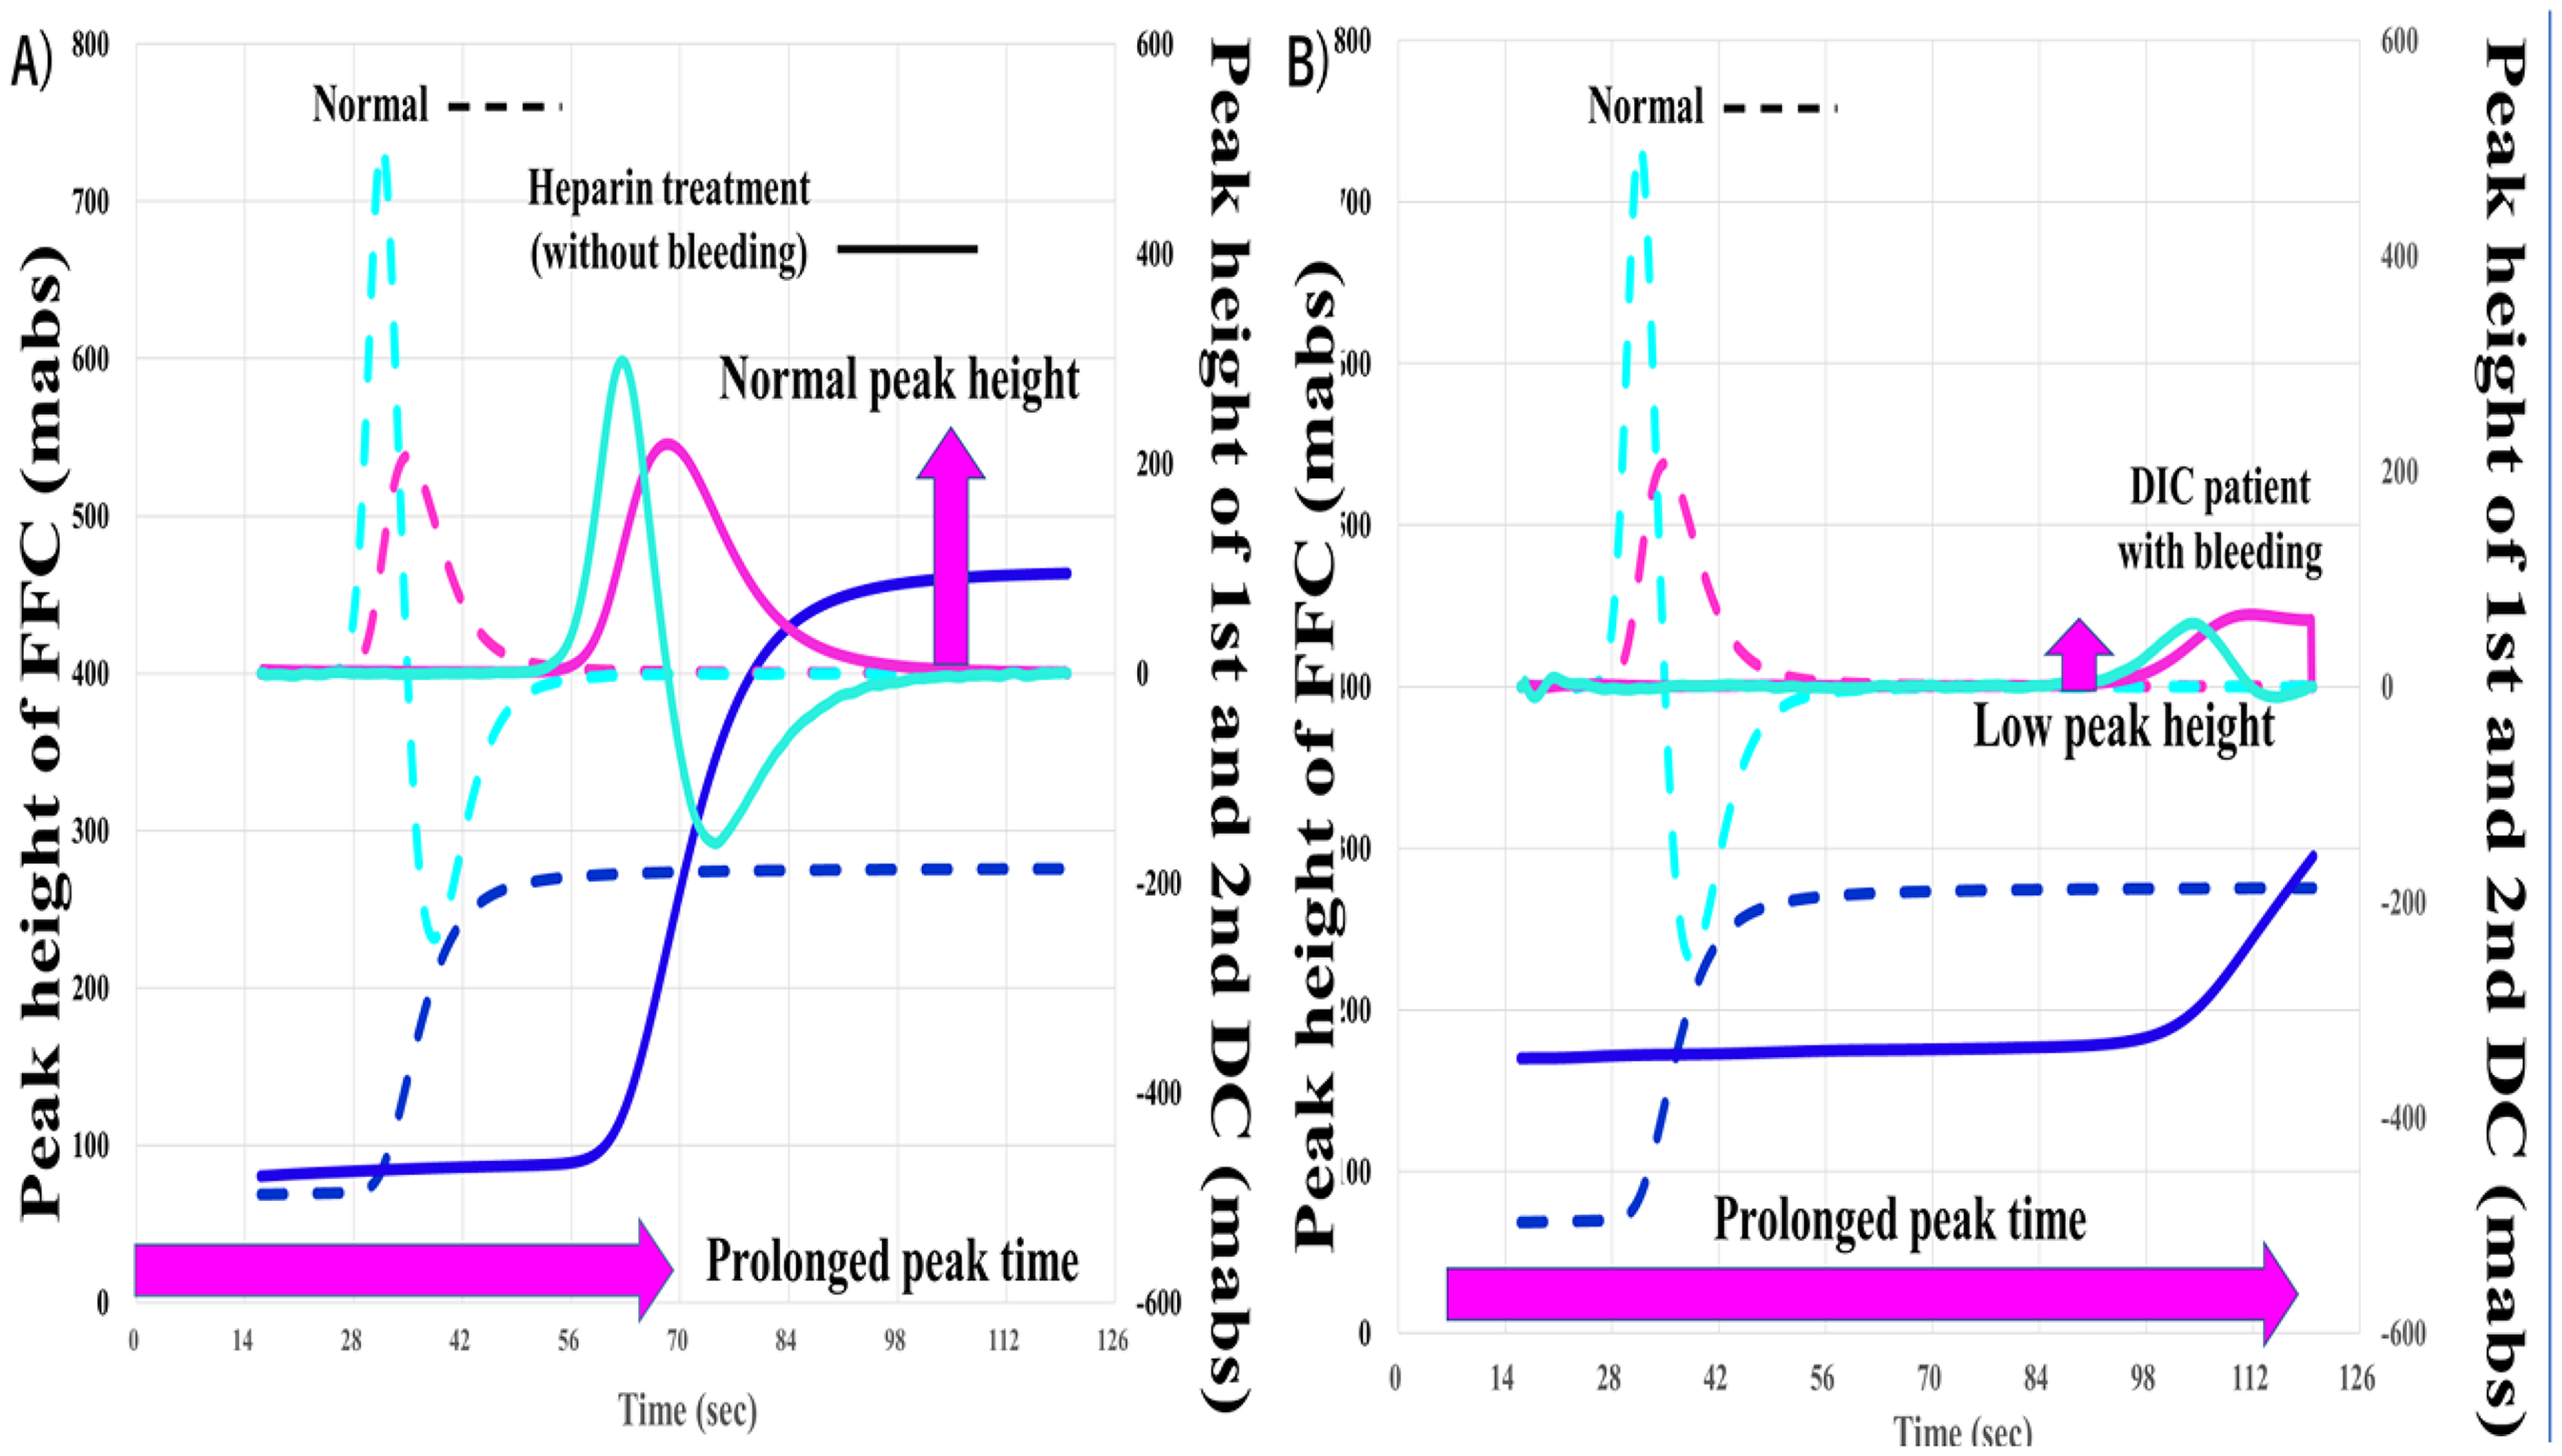
Clot waveform analysis of activated partial thromboplastin time in patients with heparin treatment (A) and DIC (B). DIC, disseminated intravascular coagulation, FFC, fibrin formation curve; first and second DC, first and second derivative curve.
Peak Width
The peak widths of the first- and second-derivative curves were greater than 10 s, suggesting that the coagulation reaction continued during this period due to thrombin burst. 35 An enlargement of the peak width is usually associated with reduced peak height.
Thrombin Burst
Thrombin burst has been reported and investigated using the thrombin generation test (TGT)36,37 and thromboelastography,38,39 and has attracted attention since the development of CWA.14,25 A small amount of tissue factor activates FIX and finally generates a small amount of thrombin. The small amount of thrombin generated was not sufficient to cause fibrin formation but activated FXI, FVIII and FV. Activated FVIII and FV activate downstream coagulation factors, resulting in the continuous activation of clotting factors from FXIa to thrombin, leading to thrombin burst (Figure 5). Thrombin burst 35 and enhancement of clotting activation on PLs 26 significantly enlarge blood coagulation. Thrombin burst is reportedly enhanced in platelet-rich plasma (PRP). 40 CWA-sTT, which reflects thrombin burst, was reported to be enhanced in PRP compared to PPP.21,41 Platelets play several important roles in hemostasis, the concentration of clotting factors on phospholipids of the platelet cell membrane, 42 and thrombin burst.43,44 Activation of CWA-sTT by an increased platelet count or the addition of phospholipids has been reported in patients with malignant neoplasms 45 and hemophilic patients treated with FVIII concentrate, 46 suggesting that hypercoagulability in these patients may be caused by thrombin burst and FVIII concentrate may be easily affected by thrombin burst.

Thrombin burst. TF, tissue factor; XIIa, activated FXII; Xia, activated FXI, FVIIa, activated factor FVIIa, FIXa, activated FIX; FVIIIa, activated factor FVIII; FVa, activated FV; PLs, phospholipids.
Modified CWA
APTT,14-16 PT 47 and TT 43 were analyzed using CWA. APTT is most frequently applied in various diseases, such as clotting factor deficiency and its inhibitor,11-14 DIC,4,29 LA 13 monitoring bleeding risk. 48 CWA-APTT has also been studied for the monitoring of bypass therapy in patients with FVIII inhibitors, 49 anticoagulation therapy17,23 and bleeding tendency, 50 as well as the analysis of the enzyme kinetics of anti-Xa agents, heparin, hirudin, and other drugs.51,52 However, massive amounts of artificial phospholipids in APTT or PT reagents usually activate the contact phase of the clotting system and cannot be used to evaluate a hypercoagulable state. 41 Furthermore, numerous APTT reagents are used to measure the clotting time, and the results obtained with different reagents are heterogenous, suggesting that standardization of APTT reagents will also be required in the clinical application of CWA. 28 The clotting time of PT and TT were short for CWA. Therefore, the clinical applications of modified CWAs including CWA-dPT (CWA-sTF/FIXa), CWA-sTT and CFWA, were also examined.
CWA-sTF/FIXa
PT and diluted PT have been reported to be used for monitoring direct oral anticoagulants, 53 suggesting that CWA-dPT may be more useful for monitoring anticoagulant therapy. CWA-dPT employs two methods. CWA-PT with APTT, 54 which combines diluted PT reagent with diluted APTT reagent, can activate both the intrinsic and extrinsic pathways. The dilution of TF in CWA-sTF/FIXa 24 is able to activate FIX but not activate FX, suggesting that this assay can reflect the intrinsic pathway independently of the extrinsic pathway. In addition, sTF/FIXa uses PRP as a phospholipid instead of APTT reagent, 41 suggesting that CWA-sTF/FIXa is more similar to physiological coagulation than CWA-APTT. 25 CWA-PT with APTT is useful for evaluating very low FVIII activity and FVIII inhibitors,16,20 whereas sTF/FIXa can measure FVIII activity,18,55 hypercoagulability in thrombotic patients,22,23 and hypocoagulability in idiopathic thrombocytopenic purpura. 34 In CWA, hypercoagulability shortens the peak time and increases the peak height, whereas hypocoagulability prolongs the peak time or decreases the peak height14,25 (Figure 6).
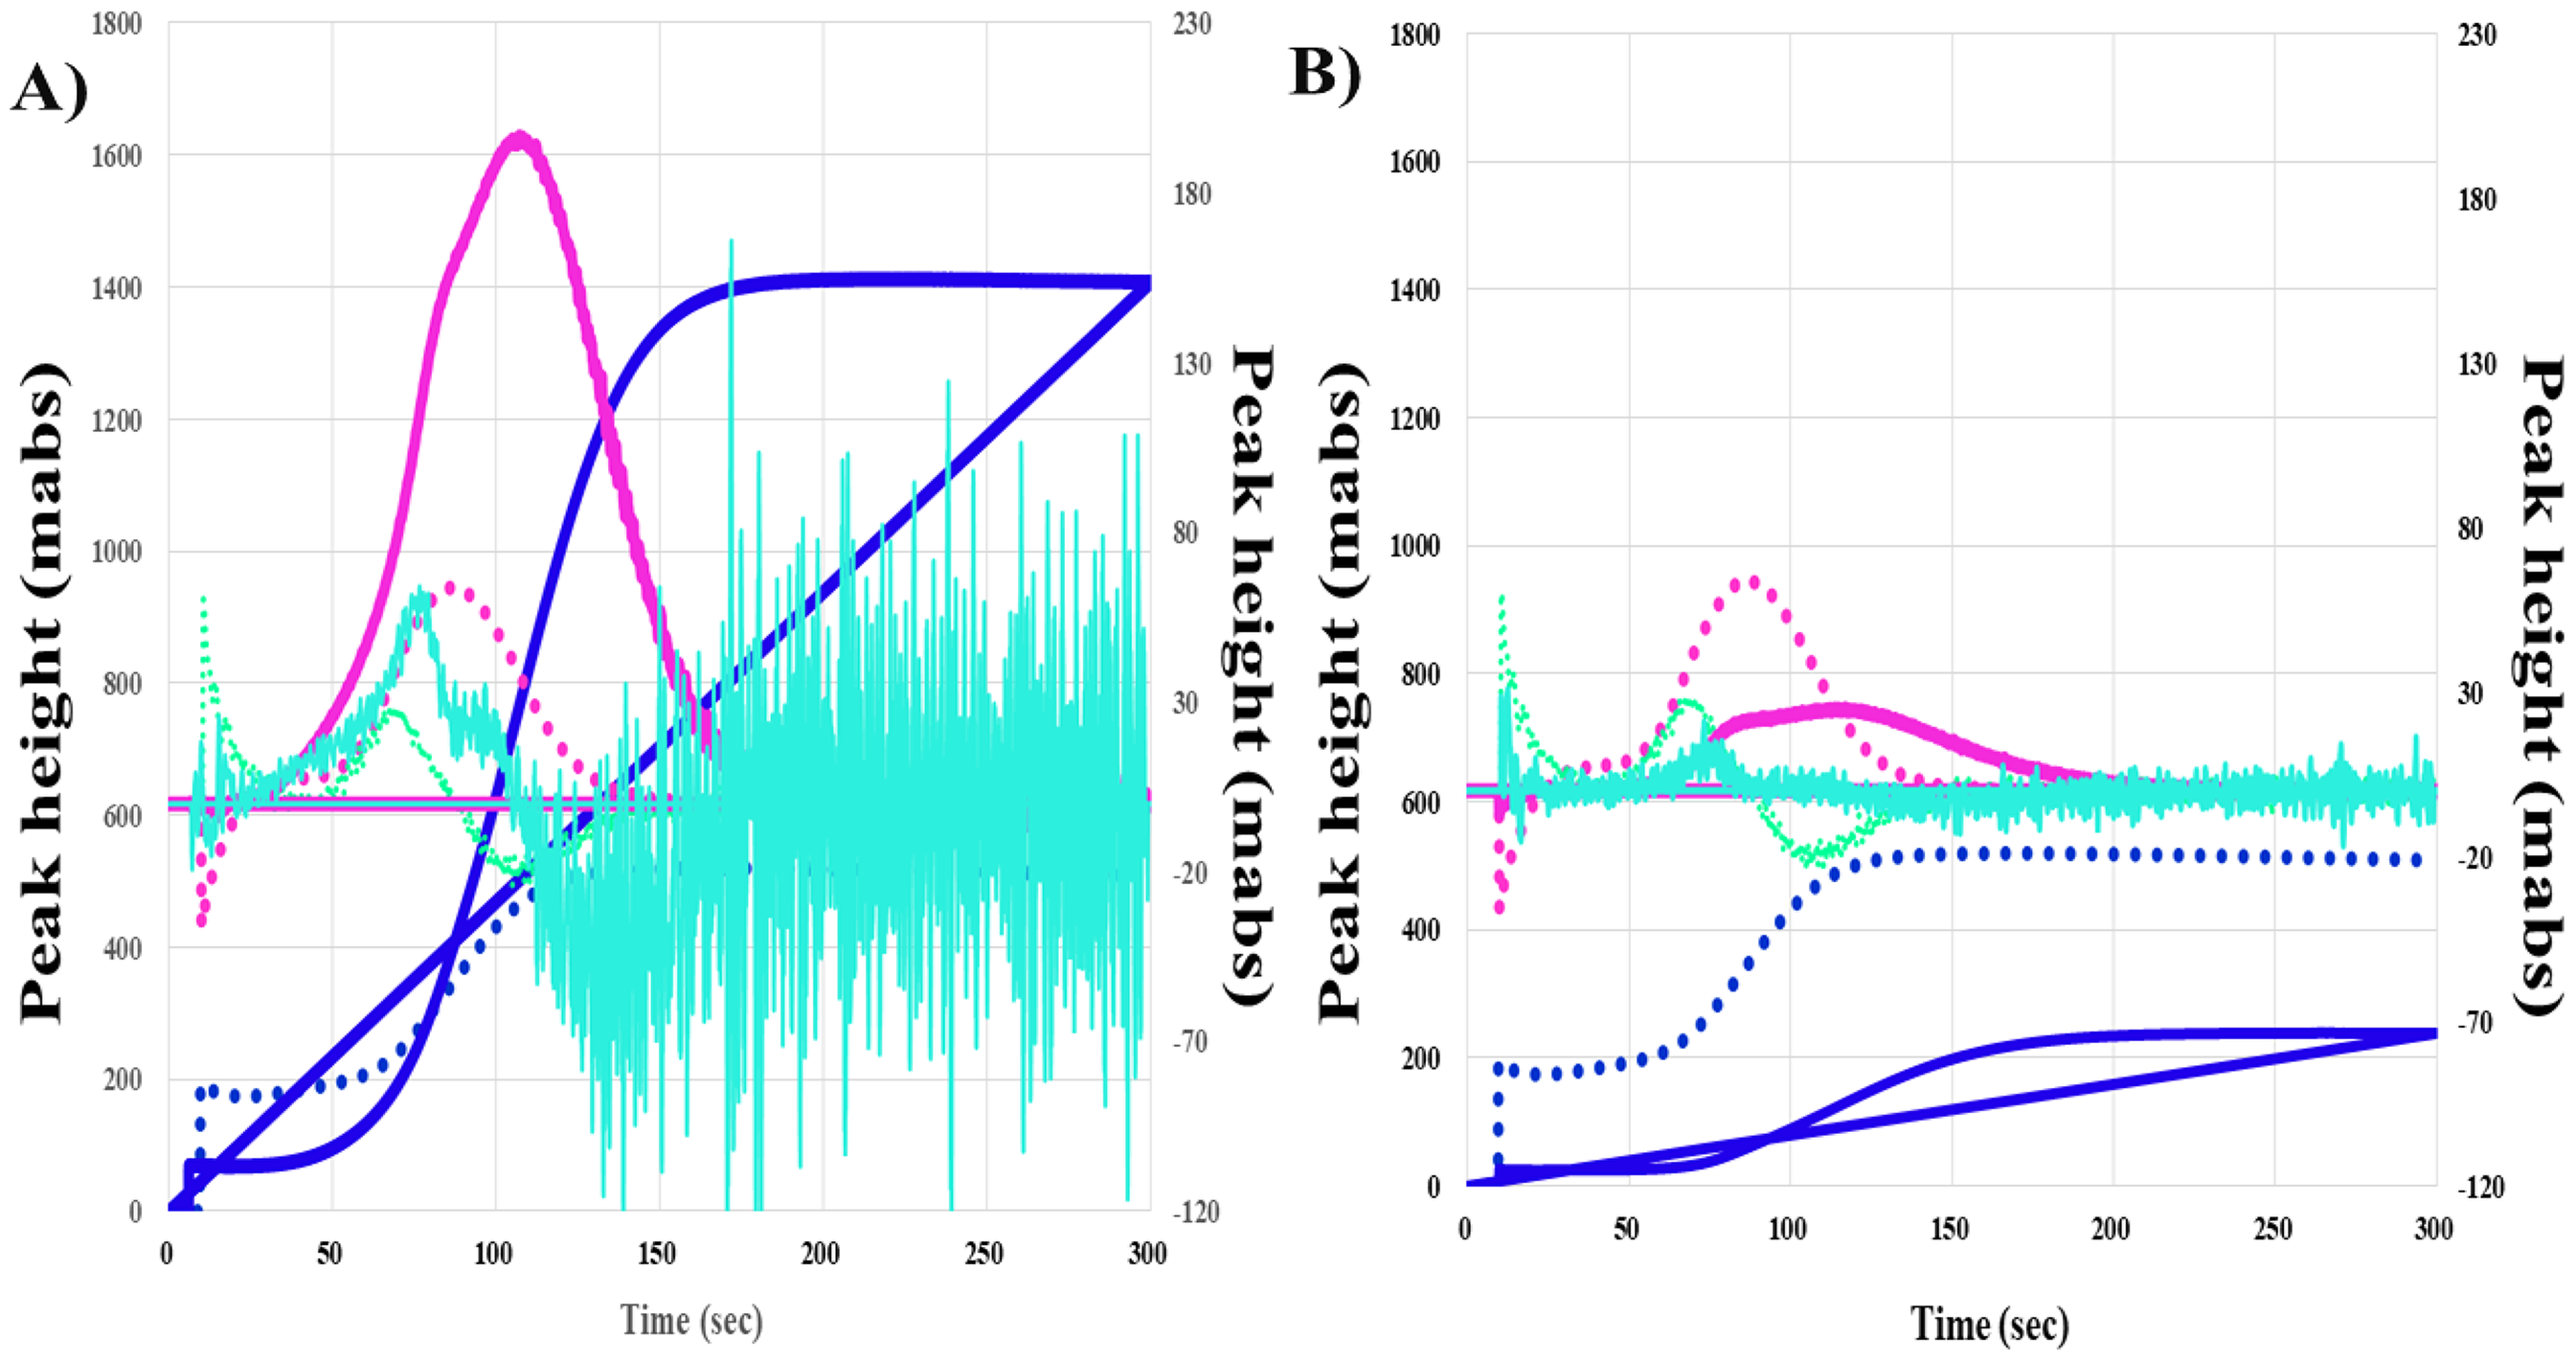
CWA-sTF/FIXa in patients with acute coronary syndrome (A) and disseminated intravascular coagulation (B). CWA, clot waveform analysis; sTF/FIXa, small amount of tissue factor induced FIX activation assay; navy line, fibrin formation curve; pink line, first derivative curve (velocity); light blue, second derivative curve (acceleration); solid line, patient; dotted line, reference plasma.
CWA-sTT
Thrombin time measured using a high concentration of thrombin is generally useful for the diagnosis of fibrinogen abnormality,56,57 whereas a low concentration of thrombin can cause thrombin burst.21,39 CWA-sTT can evaluate upstream abnormalities in the clotting system 21 and measure FVIII activity in patients treated with and without emicizumab.58,59 In patients with hemophilia A treated with emicizumab, a bispecific antibody for FIX and FX, 60 it is difficult to monitor hemostatic ability and measure FVIII activity.61,62 The APTT system consisted of two steps; massive artificial phospholipid addition and Ca2+ solution addition. During these processes, several coagulation factors are activated by emicizumab, resulting in a marked shortening of APTT. 58 Therefore, CWA-sTT may be useful for monitoring hemophilic patients treated with emicizumab. CWA-sTT can be used to visualize the enhancement of thrombin burst by platelets. That is, the second peak of the first derivative curve in CWA-sTT is higher and shorter in PRP than in PPP, suggesting that thrombin burst is enhanced by platelets 25 (Figure 7). Although there is little evidence on CWA-sTT,21,39,58 it may be useful for evaluating hypercoagulability due to thrombin burst.

CWA-sTT in a healthy volunteer (A and C) and in a patient with acute coronary syndrome (B and D). CWA, clot waveform analysis; sTT, small amount of thrombin time; navy line, fibrin formation curve; pink line, first derivative curve (velocity); light blue, second derivative curve (acceleration); solid line, patient; dotted line, reference plasma.
CFWA
The CFWA was the CWA-APTT, with a low t-PA concentration. This assay examines both coagulation and fibrinolysis systems,19,20 and shows a hyperfibrinolytic state in patients with DIC. 63 CFWA showed two peaks: the first peak was a positive fibrin formation peak caused by APTT, and the second peak was a negative peak caused by t-PA-induced fibrinolysis. The first peak showed a strong correlation with clotting time as well as with CWA-APTT. Although a shortened or increased second peak reflects increased hyperfibrinolysis, the second peak may be affected by the first peak, indicating coagulability. In addition, this assay, with the addition of t-PA, did not reveal true intrinsic fibrinolysis. The concentration of tPA has been adjusted to show two different peaks, and using different concentrations of tPA provides further information,19,64 which has been reported in patients treated with direct oral anticoagulant therapy, 64 critical care patients 62 and hemophilic patients treated with emicizumab. 65 In particular, the fibrinolytic activity of CFWA has been reported to correlate with the global fibrinolysis capacity assay, thrombin/plasmin generation assays, and rotational thromboelastography.66,67
In conclusion, CWA has the ability to detect hemostatic abnormalities by showing abnormal waveforms, peak times, and heights. This can increase the accuracy of diagnosis of various hemostatic conditions. Furthermore, various modifications of CWA, including CWA-dPT, CWA-sTT, and CFWA, have improved routine assays to allow the examination of complicated hemostatic abnormalities and monitoring of various anticoagulant agents.
Limitations and Future Perspectives of the CWA
There are many limitations to CWA. Some limitations of CWA-APTT are caused by the APTT assay, which is not useful for evaluations in a hypercoagulable state due to activation of the contact system, incubation time with APTT reagent, and the use of PPP. Another limitation is that CWA has several methods for drawing clotting curves such as absorbance and transmittance. In the future standardization of CWA-APTT, the application of artificial intelligence (AI), flagging systems and the developing modified CWA methods may be required. CWA itself is a flag for the risk of bleeding and thrombosis. However, a flagging value may be required by busy clinicians or technicians. Currently, a flagging value is usually used in APTT (CWA-peak time) but is not sufficiently useful for indicating the risk of bleeding. The combination of the peak time and height may be useful for flagging systems. The developing of flagging systems using CWA images may require an AI analysis.
Footnotes
Funding
The authors disclosed receipt of the following financial support for the research, authorship, and/or publication of this article: This research was funded in part by a Grant-in-Aid from the Ministry of Health, Labor, and Welfare of Japan (grant number 24FC1016) and the Ministry of Education, Culture, Sports, Science, and Technology of Japan.
Conflicting Interests
The authors declared no potential conflicts of interest with respect to the research, authorship, and/or publication of this article.