
Abstract
Keywords
Introduction
In recent years, platelet transfusion has emerged as a crucial component of transfusion medicine, with growing attention directed towards the issue of PTR. 1 PTR refers to a condition where patients show little or no increase in platelet count after consecutive transfusions of fresh platelets (stored for less than 72 h) that are ABO blood type compatible. In some cases, patients may even experience a decline in platelet count. 2 As early as the 1960s, the clinical problem was recognized and described. 3 According to its definition and study population, the incidence of PTR can range from 10% to 49%. 4 This large-span incidence may reflect the variability due to the challenge of diagnosis of PTR. Up to 30% of patients with hematological diseases have PTR, 5 and more than 50% of patients receiving hematopoietic stem cell transplantation are found to lack sufficient platelet increment after transfusion. 6 PTR significantly impacts the prognosis of patients with hematological diseases.3,7 If PTR is not well controlled to develop into refractory PTR, it will lead to a serious decline in the quality of life of patients, and even endanger the lives of patients. It has been reported that early use of HLA-matched platelet transfusion, intravenous immunoglobulin (IvIg), plasma exchange (PE), immunoadsorption and rituximab are successful methods for the treatment of PTR patients.8,9
Therefore, based on the retrospective cohort data, this study explores the incidence and influencing factors of PTR, establishes a predictive model for the occurrence of PTR, visualizing it in the form of a nomogram. For patients relying on platelet transfusion support therapy, PTR remains a significant challenge. The prediction model constructed in this study facilitates early identification of high-risk PTR populations by clinicians. Healthcare providers can offer personalized interventions based on risk factors, thereby enhancing treatment efficacy and clinical prognosis for PTR patients.
Materials and Methods
Patient Data
The potential risk factors of PTR were retrospectively analyzed in 250 patients who were diagnosed as de novo AML in the First Affiliated Hospital of Suzhou University from January 1, 2022, to November 31, 2023. The diagnosis of AML was based on the 2016 revision to the World Health Organization classification of myeloid neoplasms and acute leukemia. 10 AML risk category is according to the Acute Myeloid Leukemia, Version 3.2019, NCCN Clinical Practice Guidelines in Oncology. 11 Inclusion criteria comprised patients who (1) had a confirmed diagnosis of AML, (2) were aged 18 or older, and (3) underwent quantitative examinations for PAAs and HLA antibodies. Patients excluded from the study were those (1) with acute promyelocytic leukemia, (2) who received less than two consecutive platelet transfusions during hospitalization, and (3) with incomplete data records leading to variable data gaps. The study was performed in accordance with the Declaration of Helsinki and was approved by the Ethics Committee of The First Affiliated Hospital of Soochow University.
Data Collection
Drawing from relevant clinical guidelines, expert consensus, and clinical experience related to PTR, the independent variables for this study were selected. Recorded clinical data encompassed: (1) general demographic information: gender, age, height and weight; (2) laboratory test data: blood type, complete blood cell count, bone marrow morphology, cytogenetic (chromosomal karyotype), molecular biology, preliminary screening results of PAAs, the number of HLA antibodies, and average mean fluorescence intensity(MFI) value; (3) imaging data: spleen ultrasound results; (4) medical history: pregnancy history, transfusion history, presence of fever, infection, sepsis, graft versus host disease (following the international consensus12,13) and bleeding severity (following the WHO bleeding grading standards 14 ). Complete blood cell counts and bone marrow examination data were based on the results of the initial examination at the first diagnosed, with the study endpoint being the occurrence of PTR.
Diagnostic Criteria for PTR
The criteria for assessing the efficacy of platelet transfusion primarily rely on the corrected count increment (CCI), 15 calculated as follows: CCI = [(post-transfusion platelet count - pre-transfusion platelet count) x 100 × body surface area (m2)]/total infused platelet count. The body surface area is determined by the formula: 0.0061 × height (cm) + 0.0124 × weight (kg) - 0.0099. The total infused platelet count corresponds to approximately 2.8 × 10^11/L for a therapeutic dose of platelets. There is currently no consensus on the CCI threshold indicating PTR. According to the TRAP study, 16 PTR is defined as when a patient receives two consecutive transfusions of ABO-compatible platelets with a storage time of less than 72 h, and the 20–24 h CCI is less than 5 × 10^9/L.
Statistical Analysis
In this study, SPSS 26.0 software was used for statistical analysis, LASSO-logistic regression was developed by R software (version 4.2.1). Normality of continuous variables were expressed as the median (interquartile range) [M(IQR)], and between-group comparisons were conducted using the Mann-Whitney U test. Categorical variables were described using frequency (%), and comparisons between groups were assessed using χ2 test or Fisher's exact test. Ordered categorical variables were compared between groups using the rank-sum test. In the training set, initial variable selection involved single-factor logistic regression analysis, including variables with both statistical and clinical significance. The LASSO regression model was constructed using cross-validation with the cv.glmnet function. 17 Finally, the selected variables were validated in a multivariate logistic regression model and presented in the form of a nomogram. The ROC curve was plotted to evaluate the discriminative ability of the predictive model, a calibration curve and the Hosmer–Lemeshow goodness of fit test were employed to access the variance between the predicted value derived from nomogram and the actual value, and the DCA curve determined the net benefit threshold for predictions. In the validation set, the above models were validated, and differences were considered statistically significant at p-value < 0.05.
Results
Comparison of Baseline Data of Patients
The detailed flow diagram is presented in Figure 1. A total of 250 de novo AML patients were included in the study, among whom 95 patients experienced PTR, resulting in an incidence rate of 38.0%. The rate of PTR in female patients (39.69%, 52/131) was slightly higher than that in male patients (36.13%, 43/119). In the PTR group, there were statistically significant differences (p < 0.05) in the composition ratio of B blood type patients, the incidence of splenomegaly, the bleeding episode of WHO grade 2 or higher, the number of HLA-I antibodies, the average HLA-I MFI, the number of HLA-II antibodies, the average HLA-II MFI, and the positivity rate of PAAs, all of which were higher compared to non-PTR patients. In the non-PTR group, the composition ratio of AB blood type patients was higher than that of the PTR group, and the difference was statistically significant (p < 0.05), as shown in Table 1.
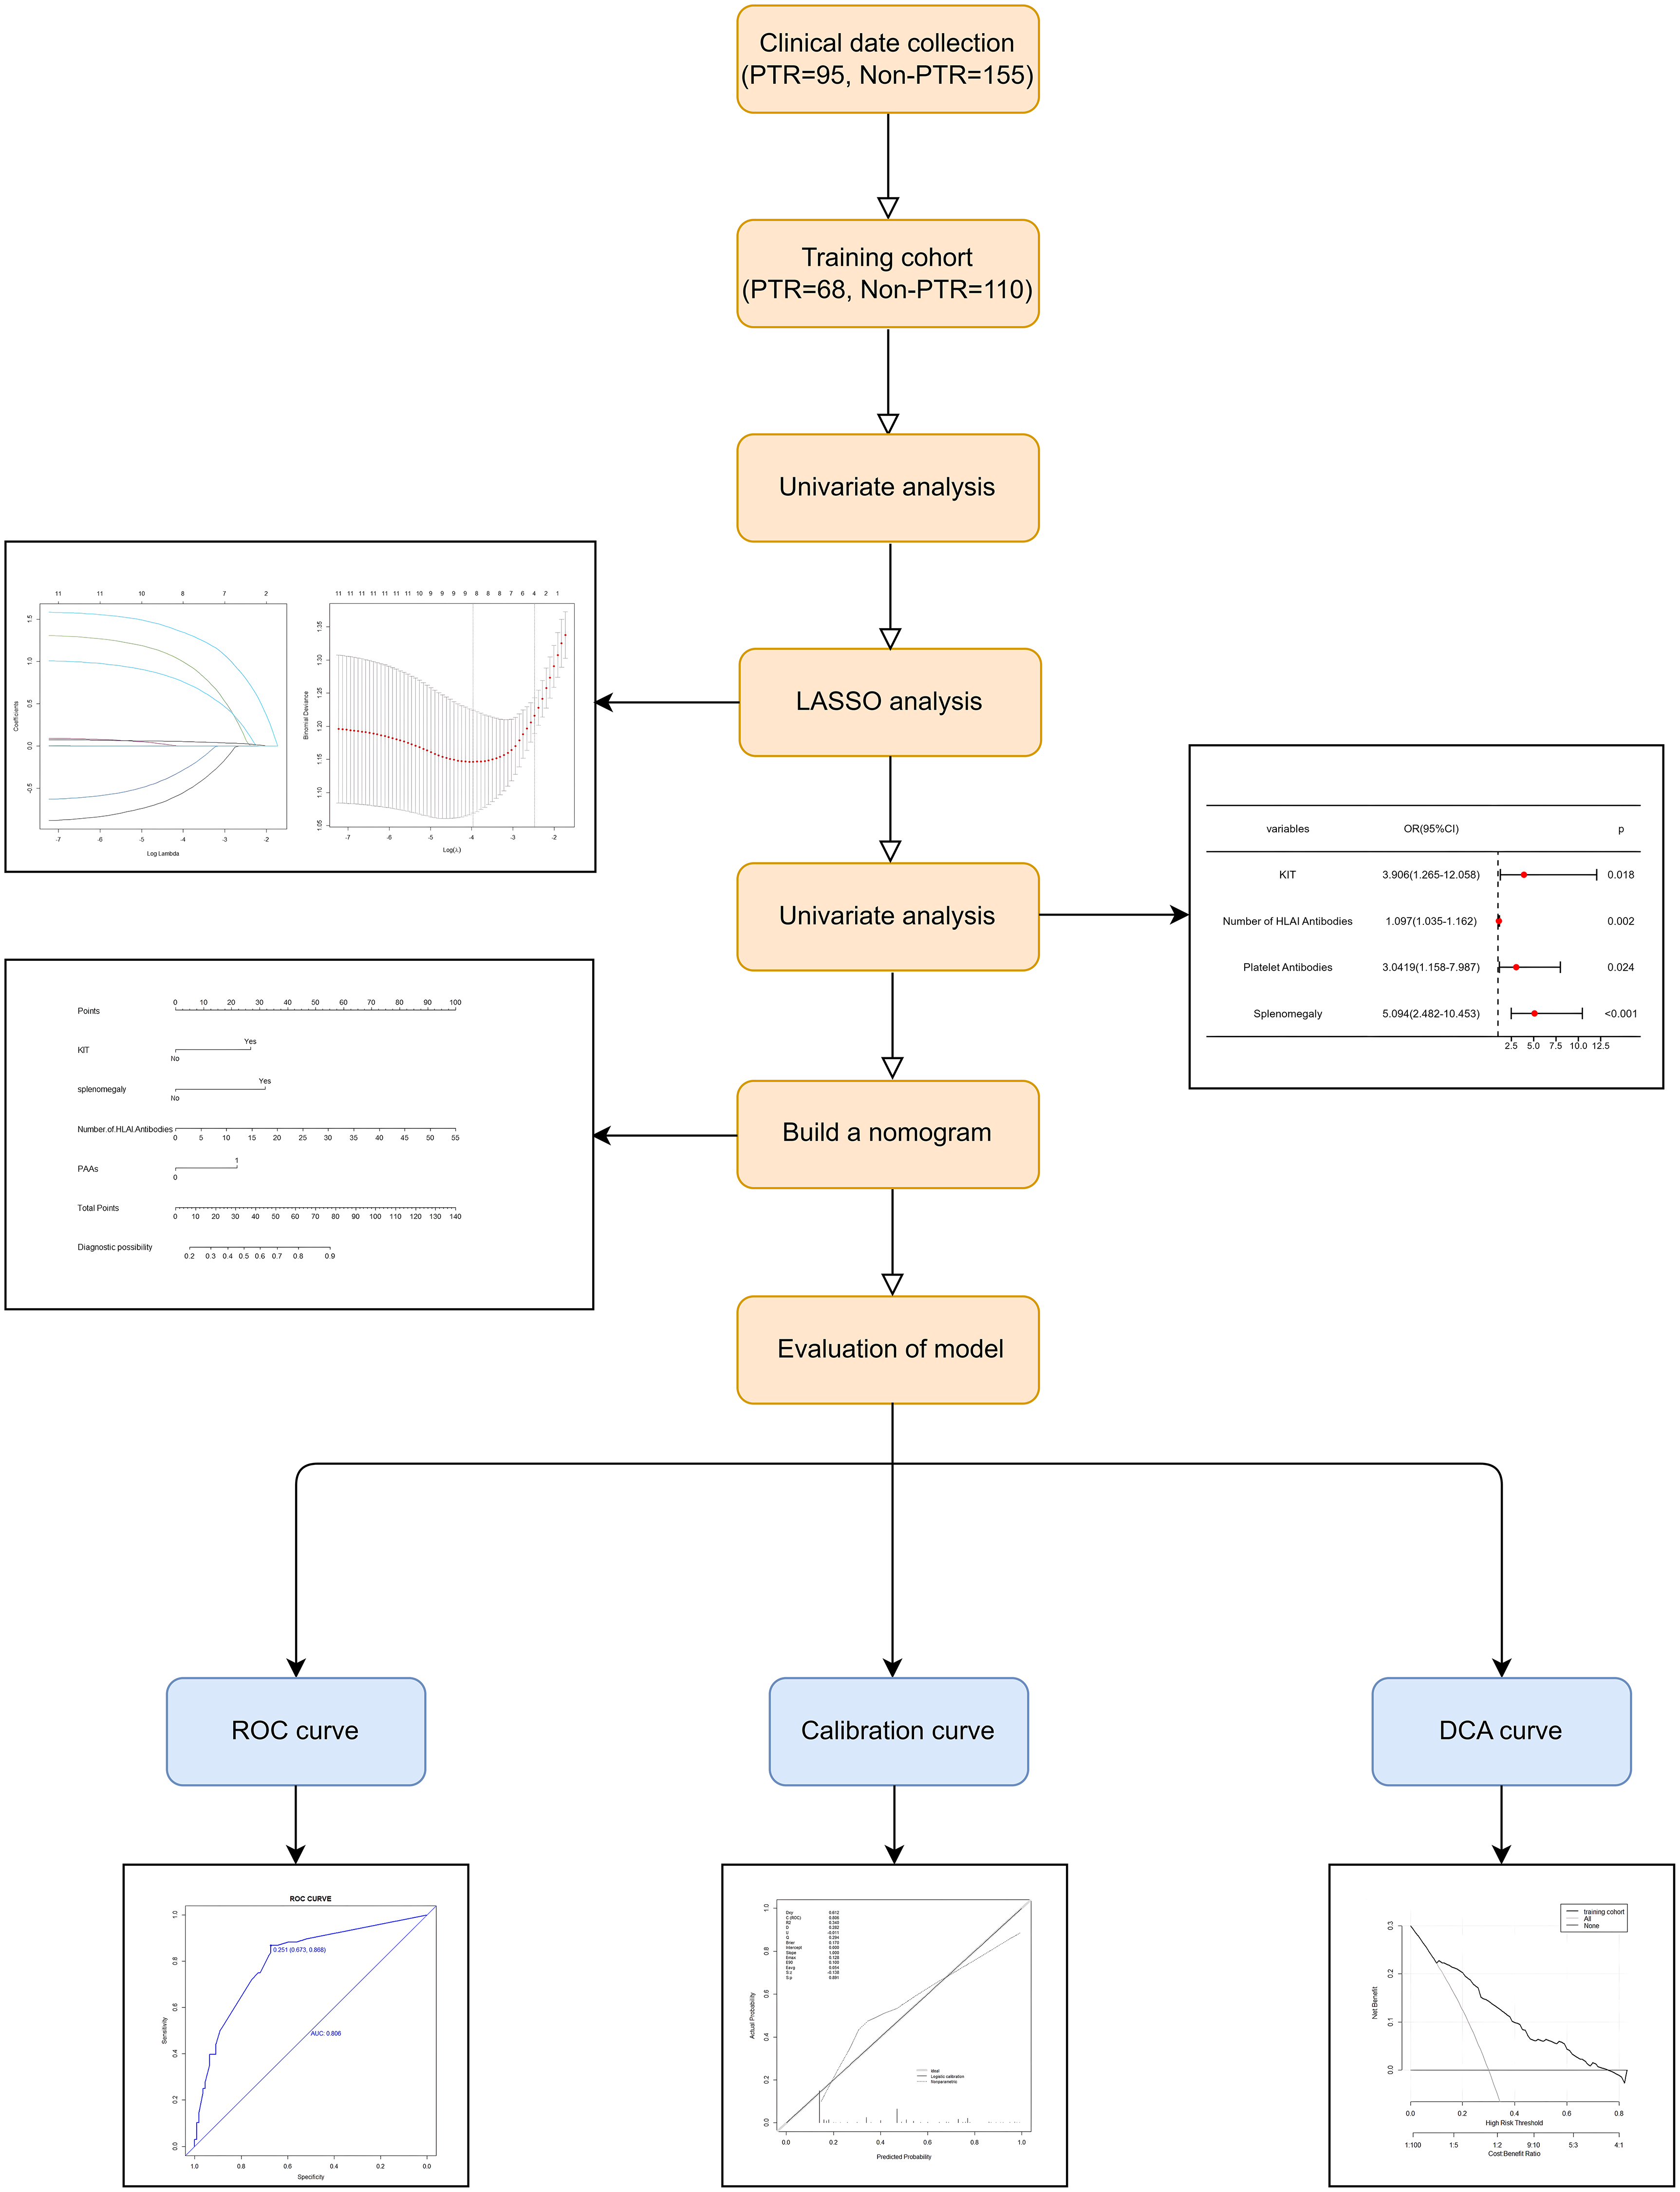
Flow diagram.
Comparison of Baseline Data Between PTR and non-PTR Patients.
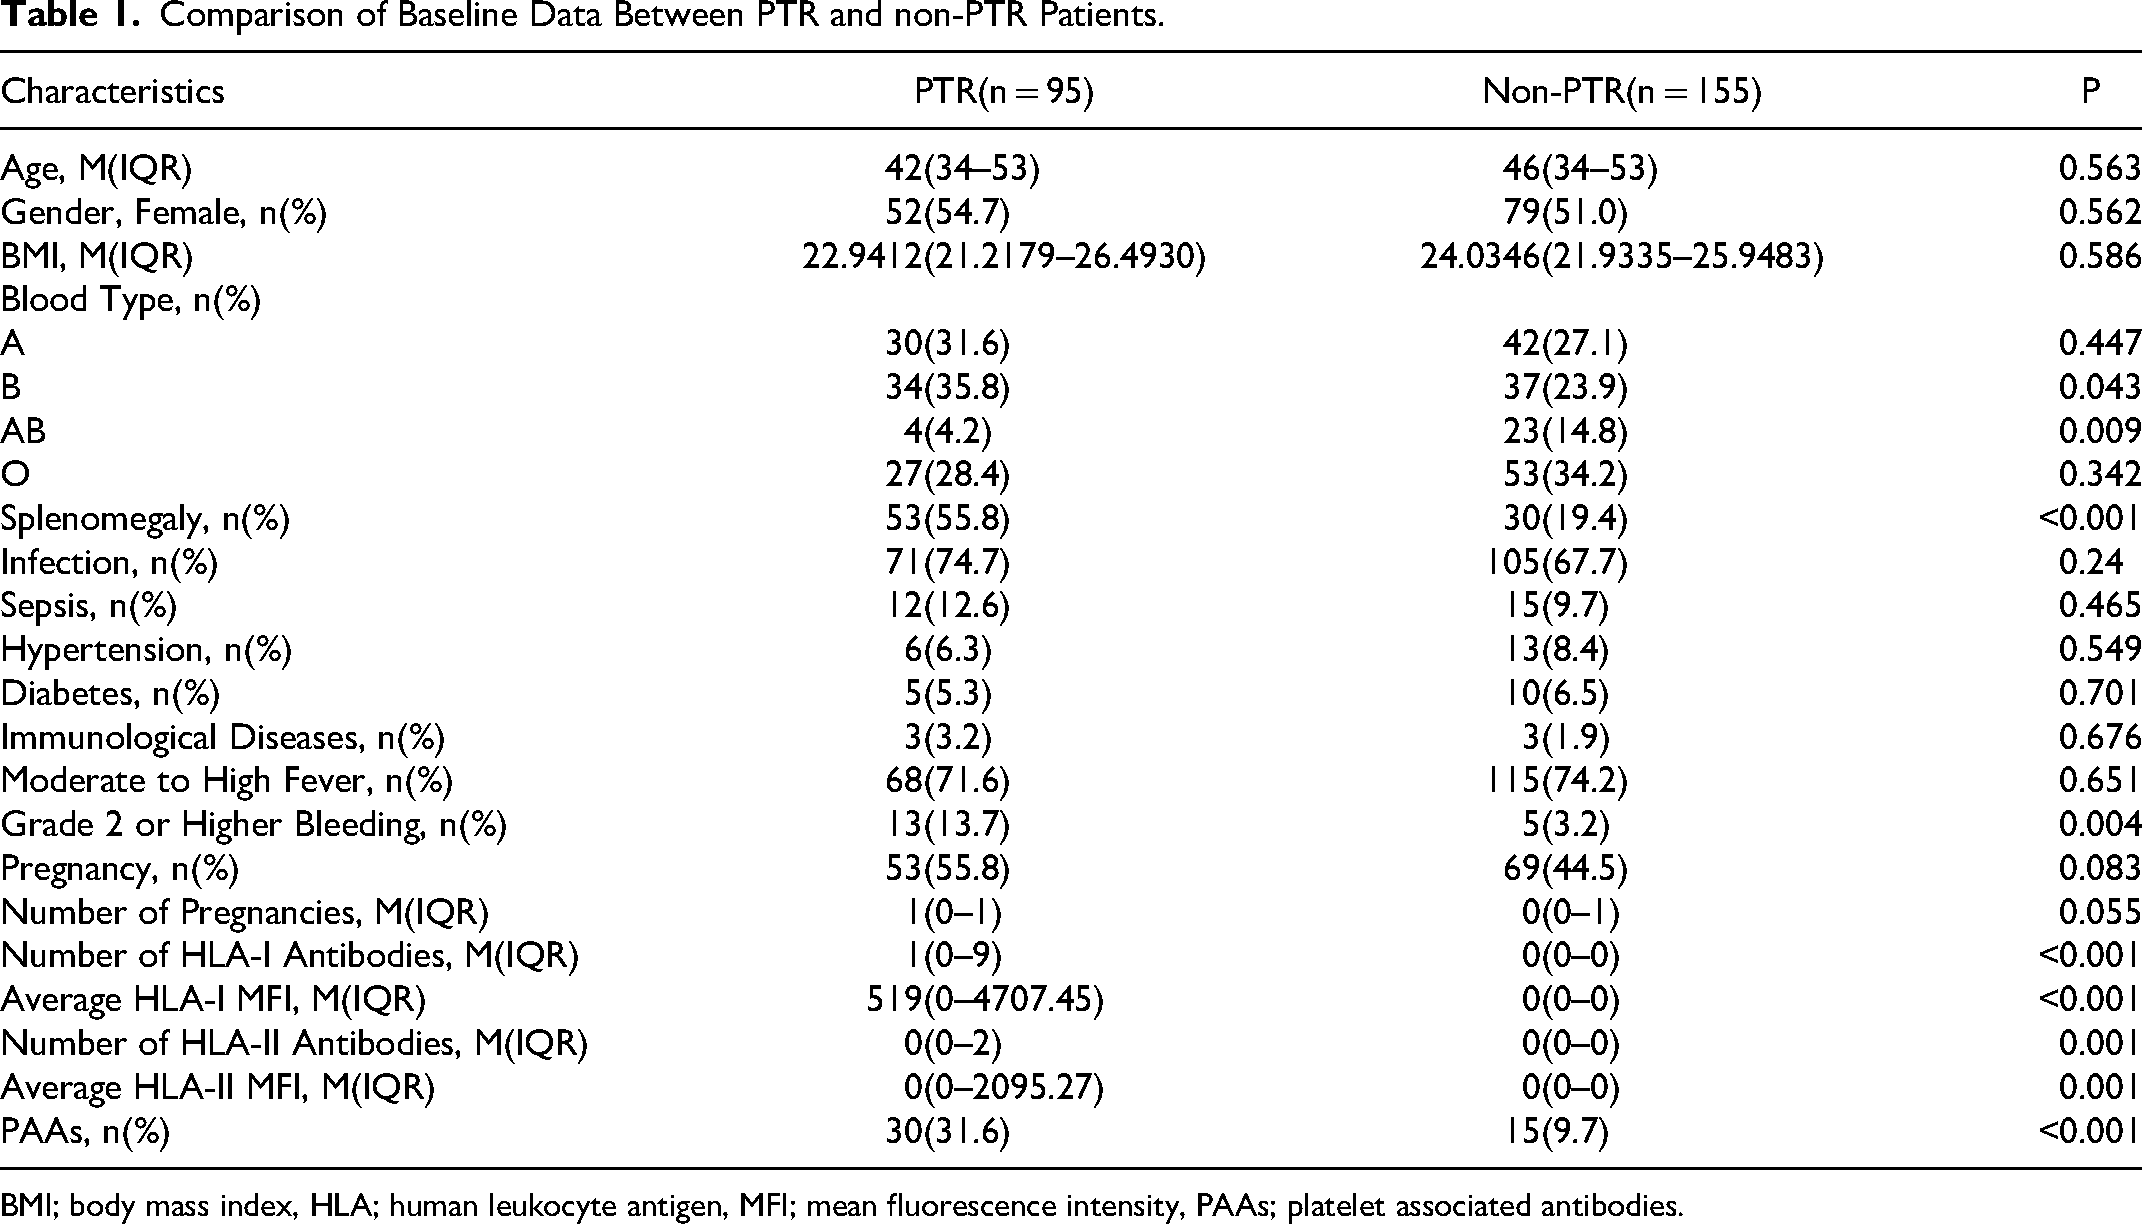
BMI; body mass index, HLA; human leukocyte antigen, MFI; mean fluorescence intensity, PAAs; platelet associated antibodies.
Comparison of Clinical Characteristics
Statistically significant differences were observed between the PTR group and non-PTR group in various initial diagnosis variables, including white blood cell count, hemoglobin level, platelet count at the time of initial diagnosis, the incidence of chromosomal abnormalities, the incidence of KIT mutations, and the incidence of IDH mutations (p < 0.05), as shown in Table 2.
Comparison of Clinical Characteristics Between PTR and non-PTR Patients.
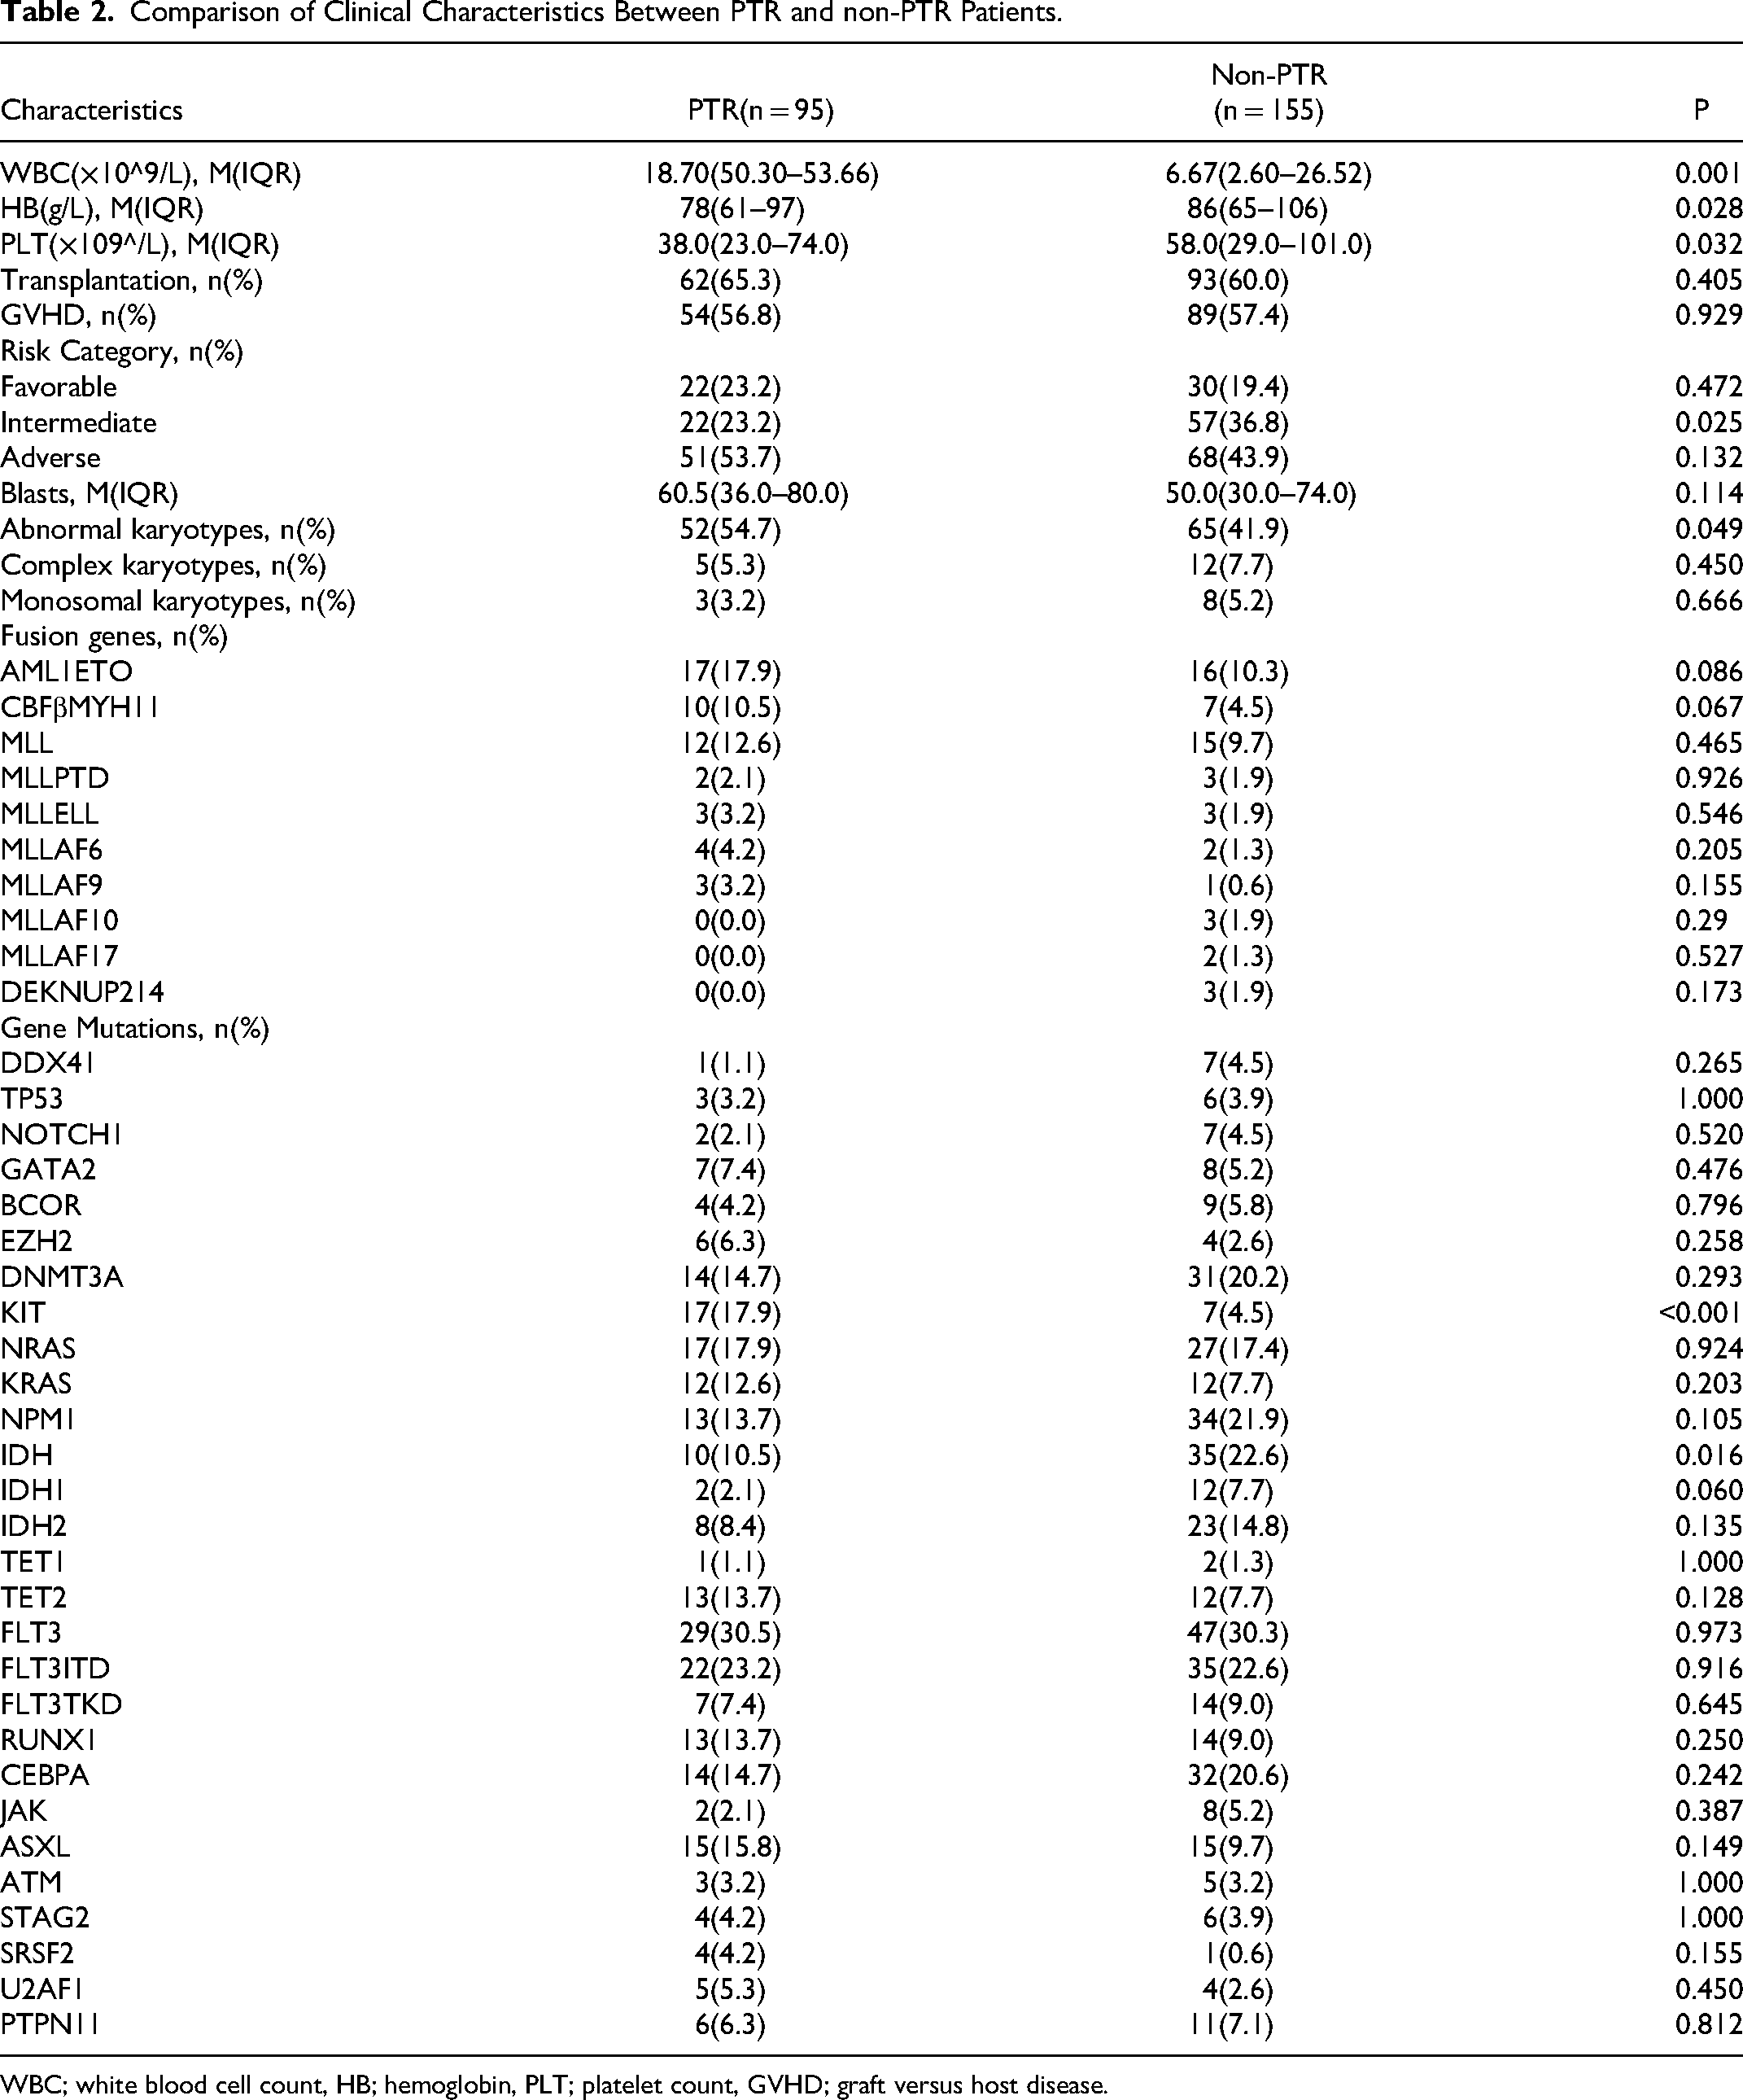
WBC; white blood cell count, HB; hemoglobin, PLT; platelet count, GVHD; graft versus host disease.
The Selection of Independent Variables for the Prediction Model
Table 3 provides the results of the univariate logistic regression analysis of risk factors for the development of PTR in patients with de novo AML in the training group. Based on the statistical significance of variables, a total of 10 predictive factors were selected, including AB blood type, splenomegaly, PAAs, the number of HLA-I antibodies, the average HLA-I MFI, the number of HLA-II antibodies, the average HLA-II MFI, white blood cell count, KIT mutation and IDH mutation. Considering the clinical significance of variables, the variable “number of pregnancies” was also included, resulting in a total of 11 predictive factors for the subsequent screening.
Univariable Logistic Analysis of Risk Factors for PTR in AML Patients.
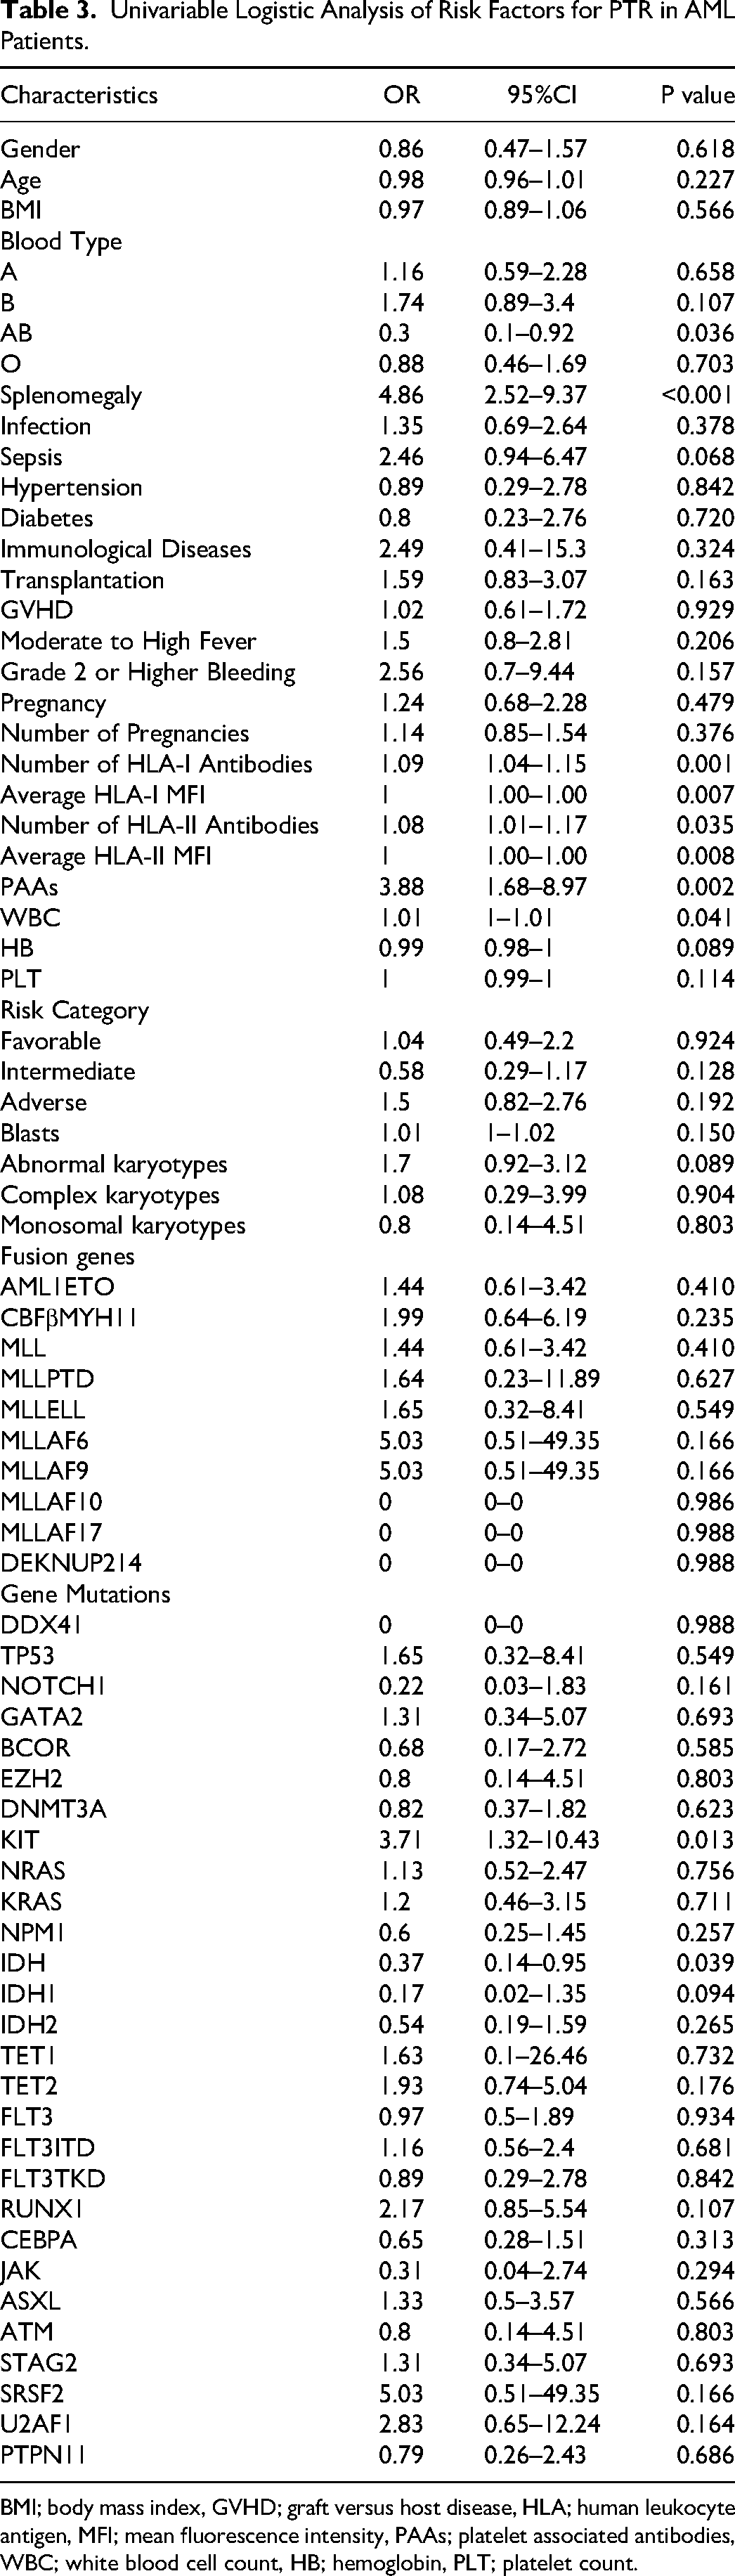
BMI; body mass index, GVHD; graft versus host disease, HLA; human leukocyte antigen, MFI; mean fluorescence intensity, PAAs; platelet associated antibodies, WBC; white blood cell count, HB; hemoglobin, PLT; platelet count.
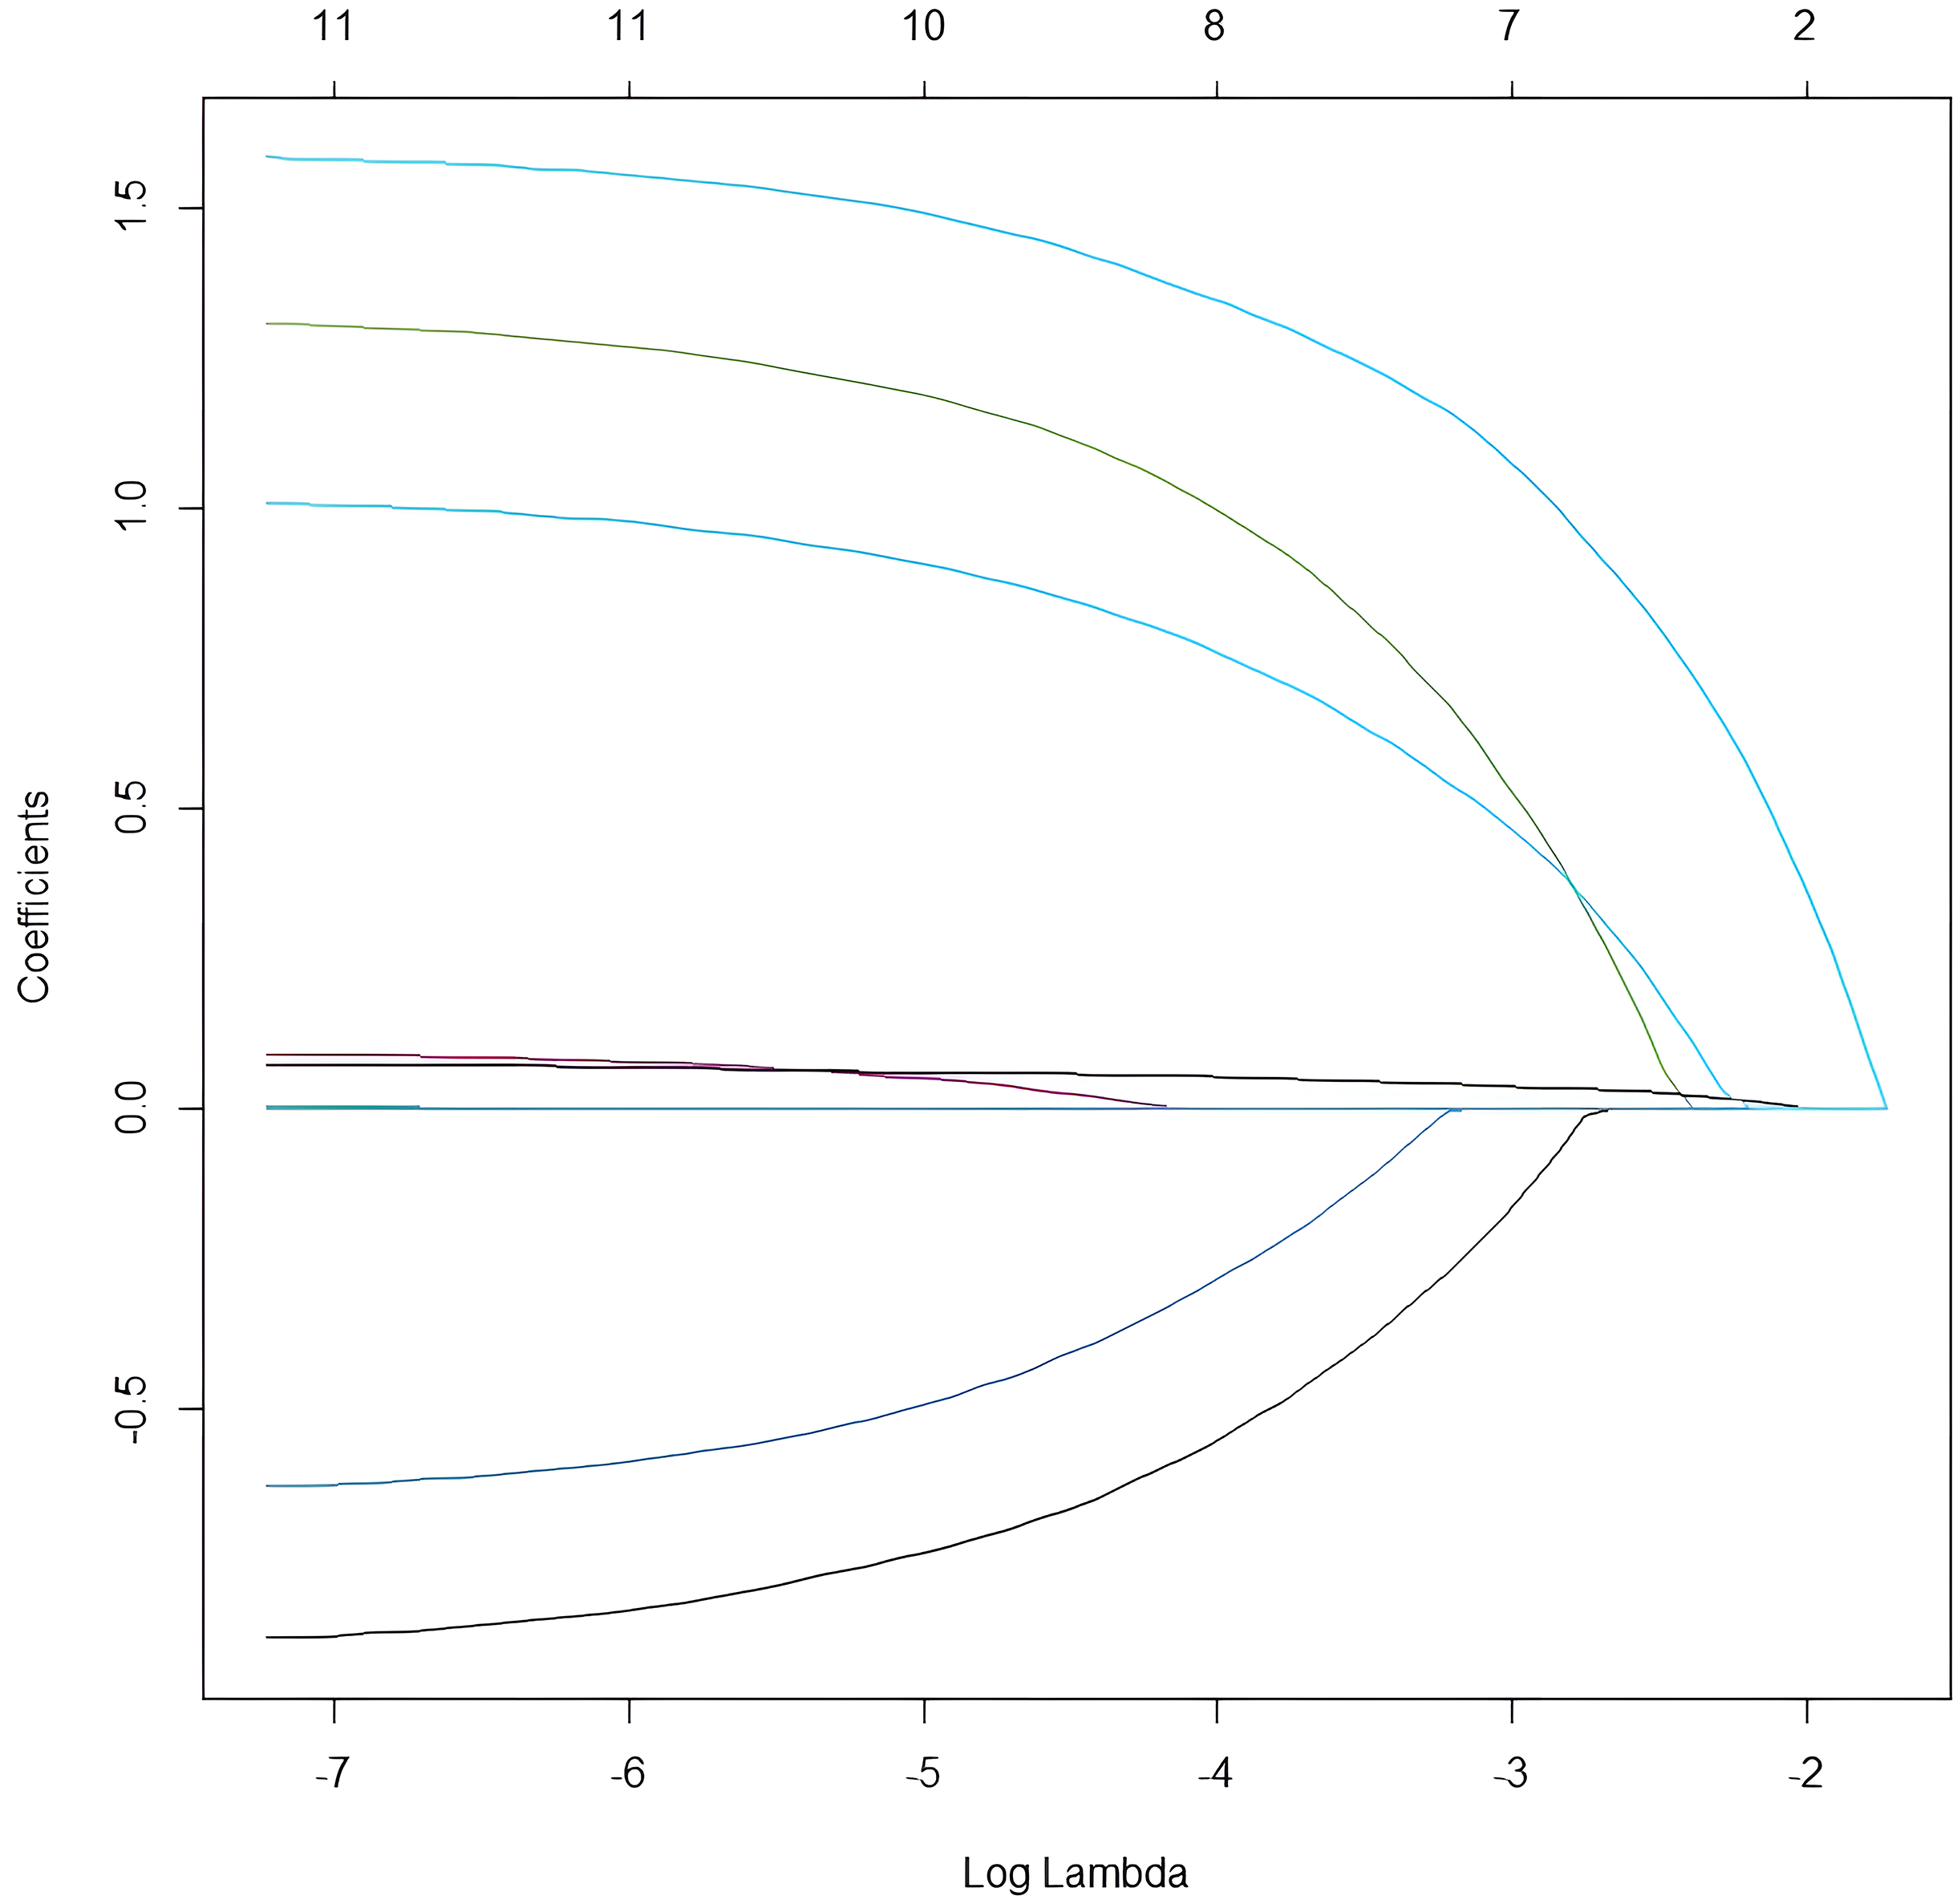
Construction of LASSO-Logistic Regression Prediction Model
The LASSO regression algorithm was applied to the training cohort. As the penalty coefficient lambda (λ) increased, the penalization strength for variable selection escalated, leading the coefficients of non-feature variables to gradually converge to zero, as depicted in Figure 2 The optimal λ value was chosen through cross-validation with 10-fold repetitions, aiming to incorporate the minimal number of variables while ensuring a satisfactory fit, thus obtaining the most streamlined predictive model. In this study, lambda.min was selected as the optimal λ value, as illustrated in Figure 3 The variables selected after LASSO regression comprised AB blood type, initial white blood cell count, KIT mutation, IDH mutation, splenomegaly, the number of HLA-I antibodies, the average HLA-II MFI, and PAAs, totaling 8 variables, as presented in Table 4.
LASSO regression path diagram.
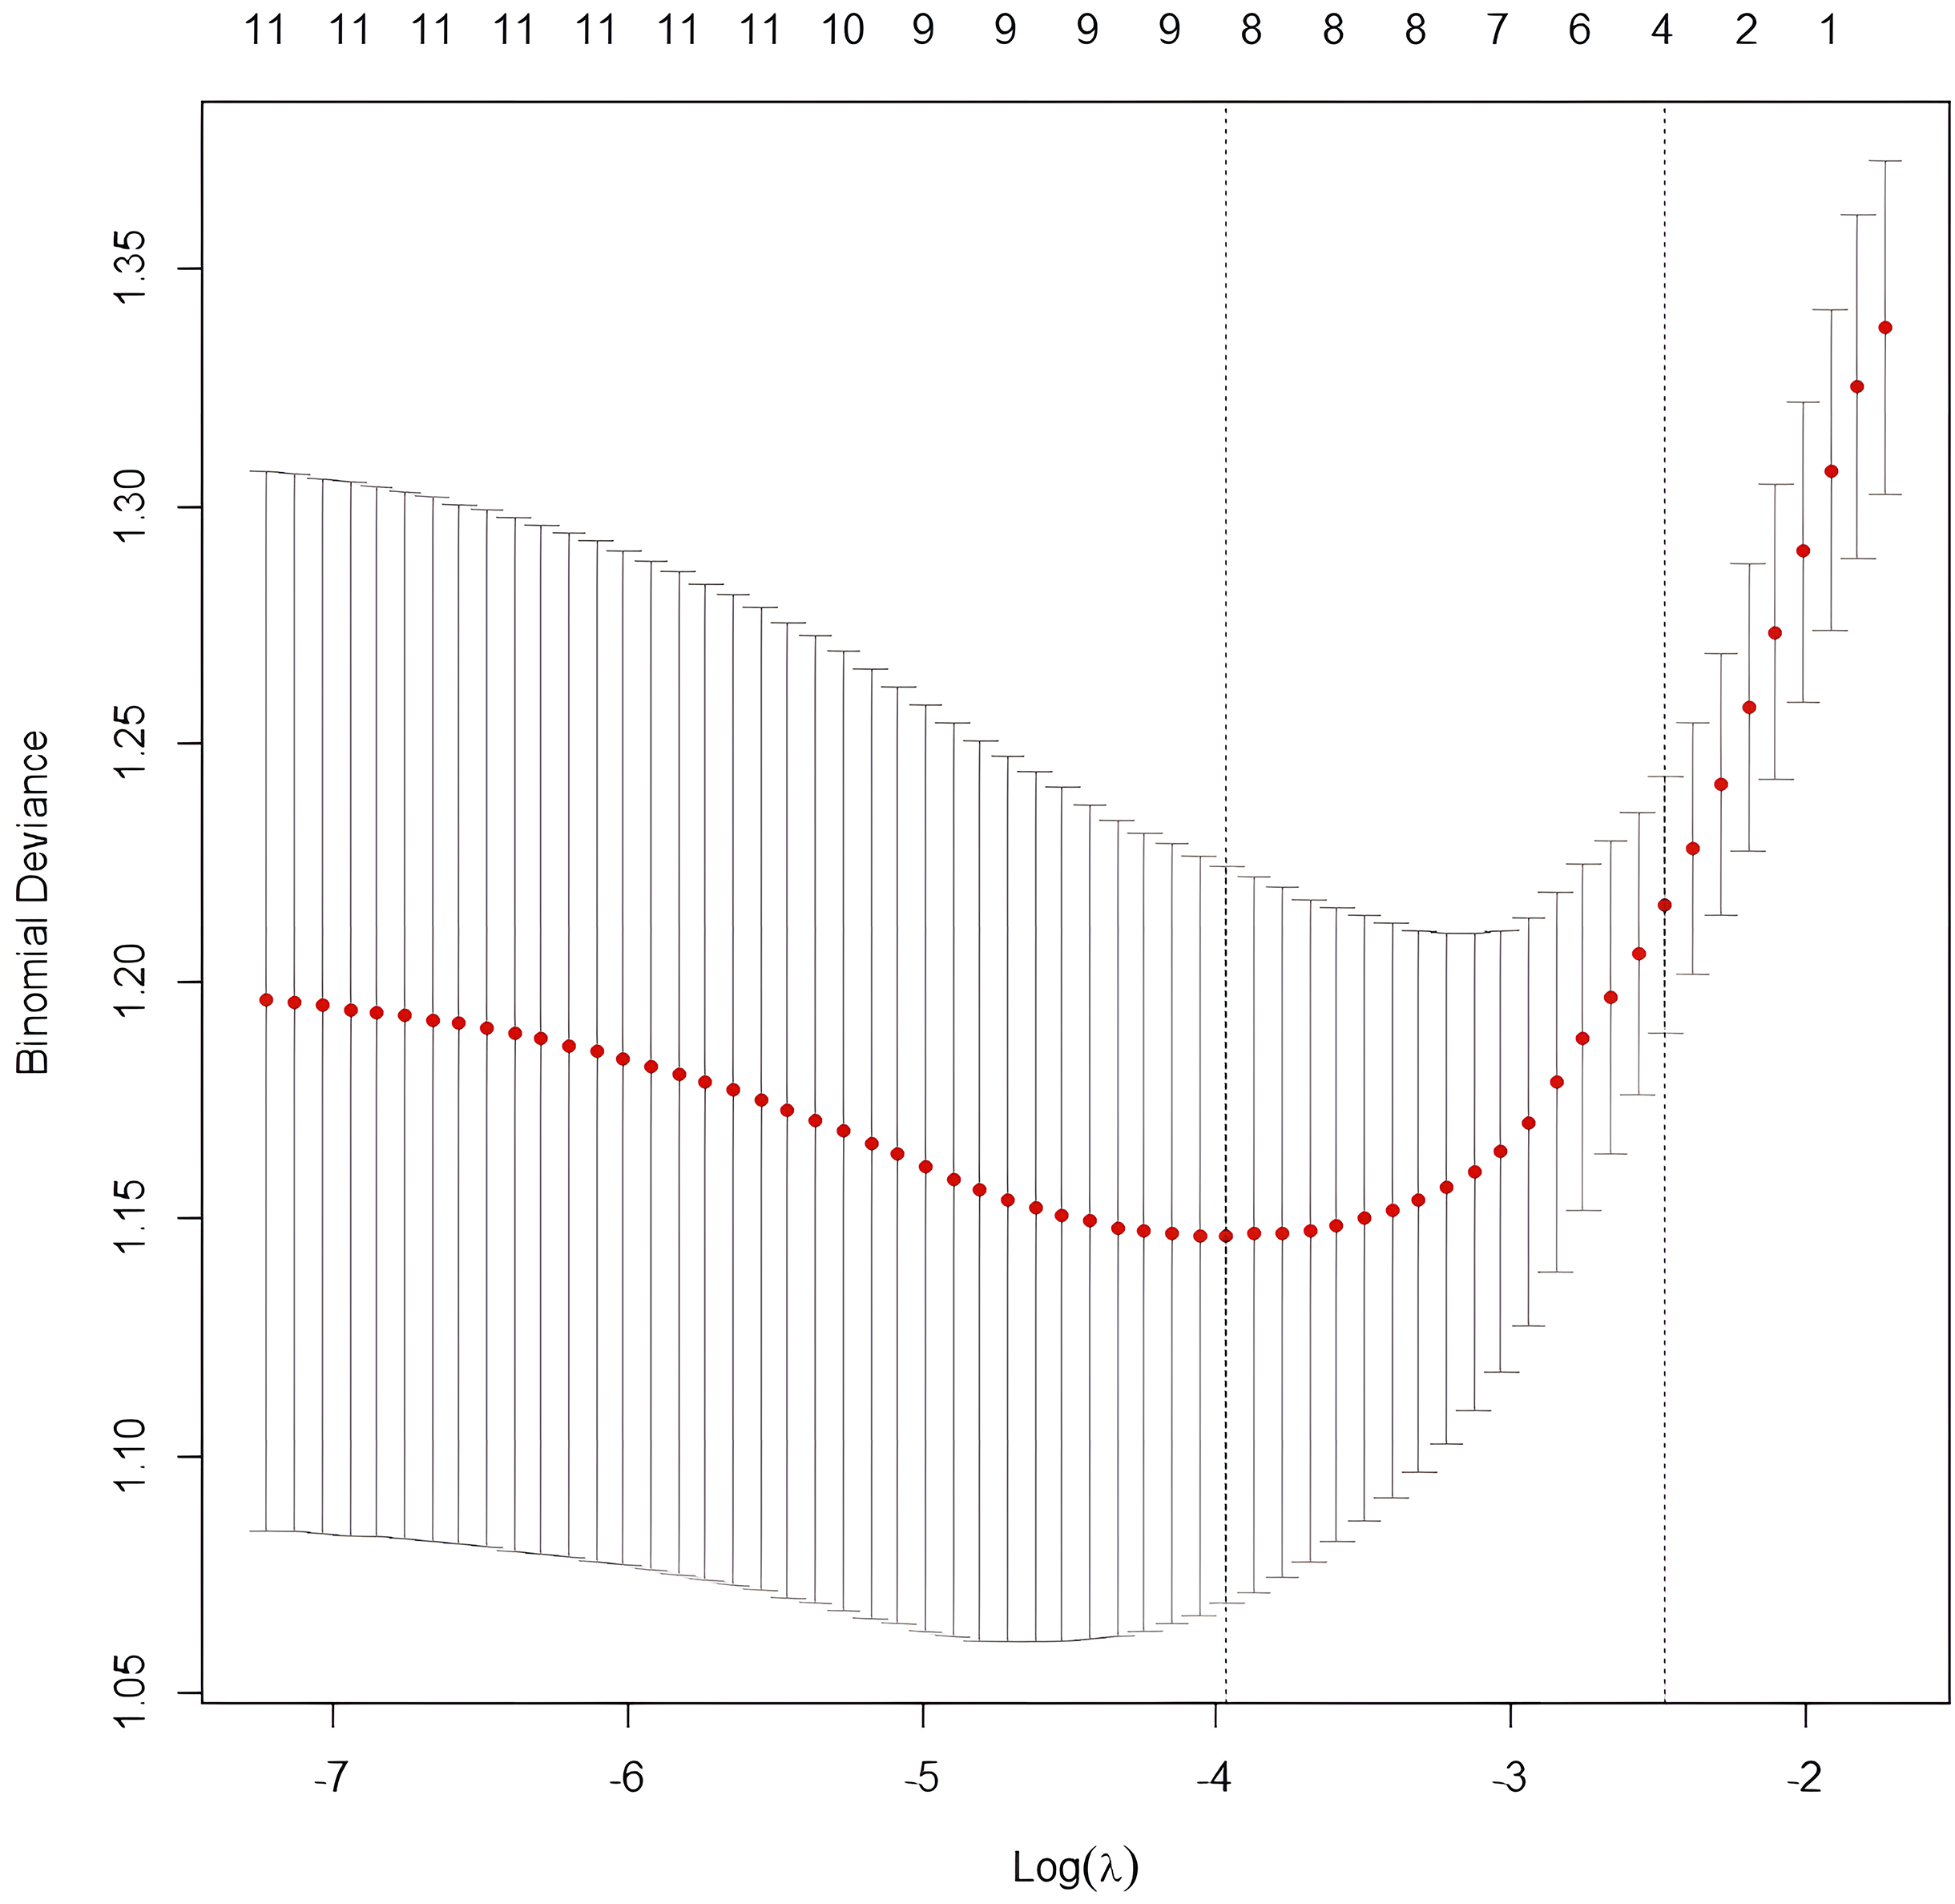
LASSO cross validation diagram.
Coefficients from LASSO Regression Analysis.
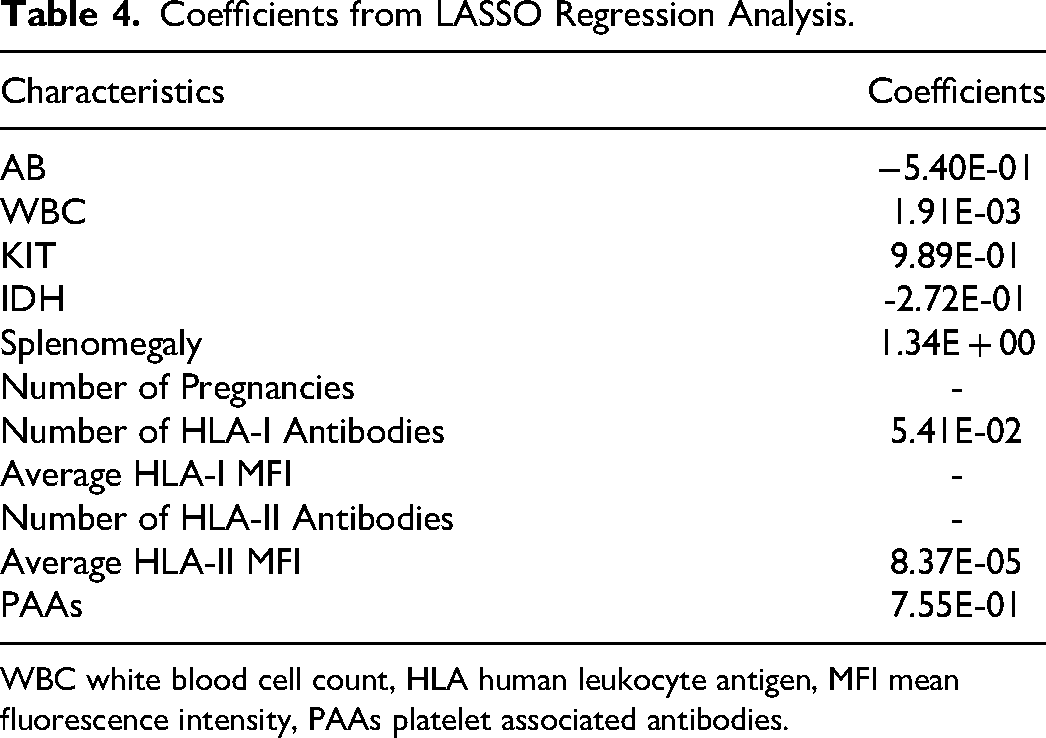
WBC white blood cell count, HLA human leukocyte antigen, MFI mean fluorescence intensity, PAAs platelet associated antibodies.
In order to determine whether the above eight variables are independent risk factors of PTR, the above variables are combined and collinear screening is carried out. The results indicated that the variance inflation factor (VIF) for each variable was <2, indicating low collinearity among the variables and high credibility in including them in the model. Subsequently, a multivariate logistic regression analysis was conducted, revealing a significant association between KIT mutation (OR = 3.906, 95%CI = 1.265–12.058, P = 0.018), number of HLA-I antibodies (OR = 1.097, 95%CI = 1.035–1.162, P = 0.002), PAAs (OR = 3.0419, 95%CI = 1.158–7.987, P = 0.024), splenomegaly (OR = 5.094, 95%CI = 2.482–10.453, P < 0.001), and PTR, as shown in Figure 4.
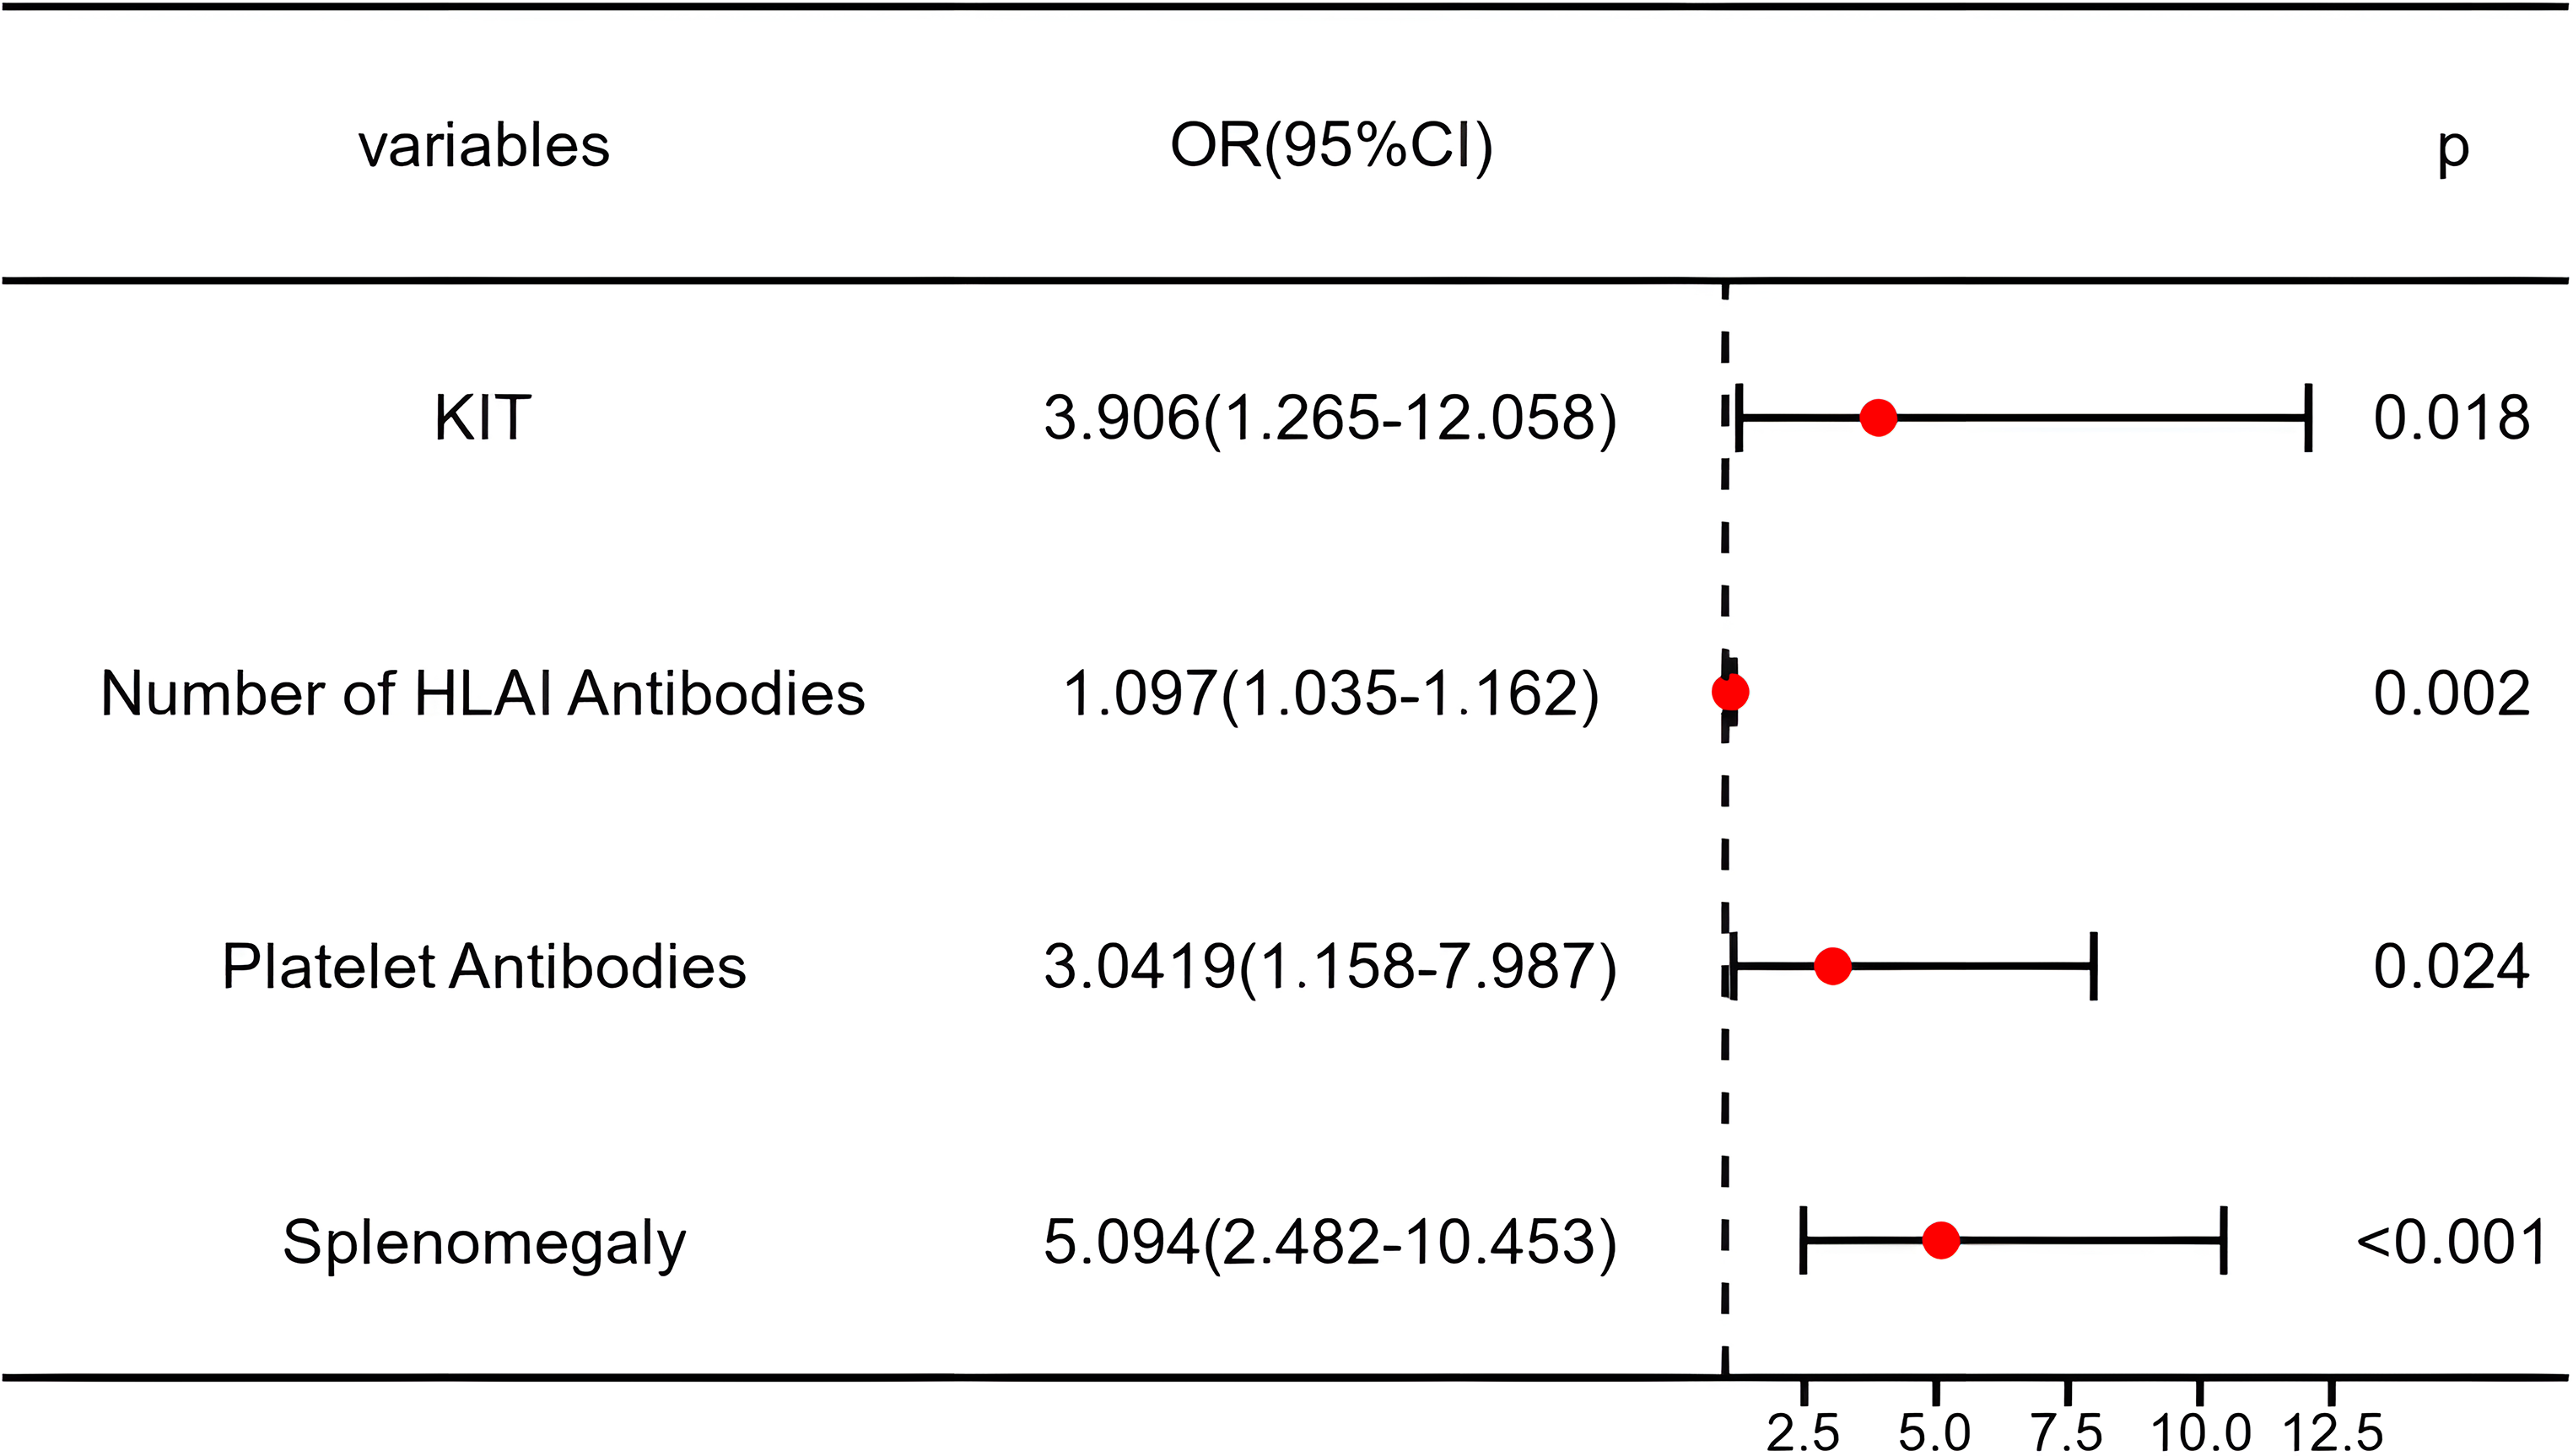
Forest plot of multivariate logistic regression analysis in the training group.
Construction and Validation of Prediction Model
A predictive model for the risk of PTR occurrence in de novo AML patients was developed using the training group, consisting of 70% of all recruited patients (68 cases in the PTR group and 110 cases in the non-PTR group). The formula for calculating the Log (PTR incidence rate) is as follows: Log (PTR incidence rate) = -1.742 + 1.363 × KIT (0 = absent, 1 = present) + 1.628 × Splenomegaly (0 = absent, 1 = present) + 0.093 × Number of HLA-I antibodies + 1.112 × PAAs (0 = negative, 1 = positive). The predictive model is visually presented in the form of a nomogram (Figure 5). The scores for each variable are summed, and a vertical line is drawn on the total score, corresponding to the predicted probability of PTR occurrence in AML patients.
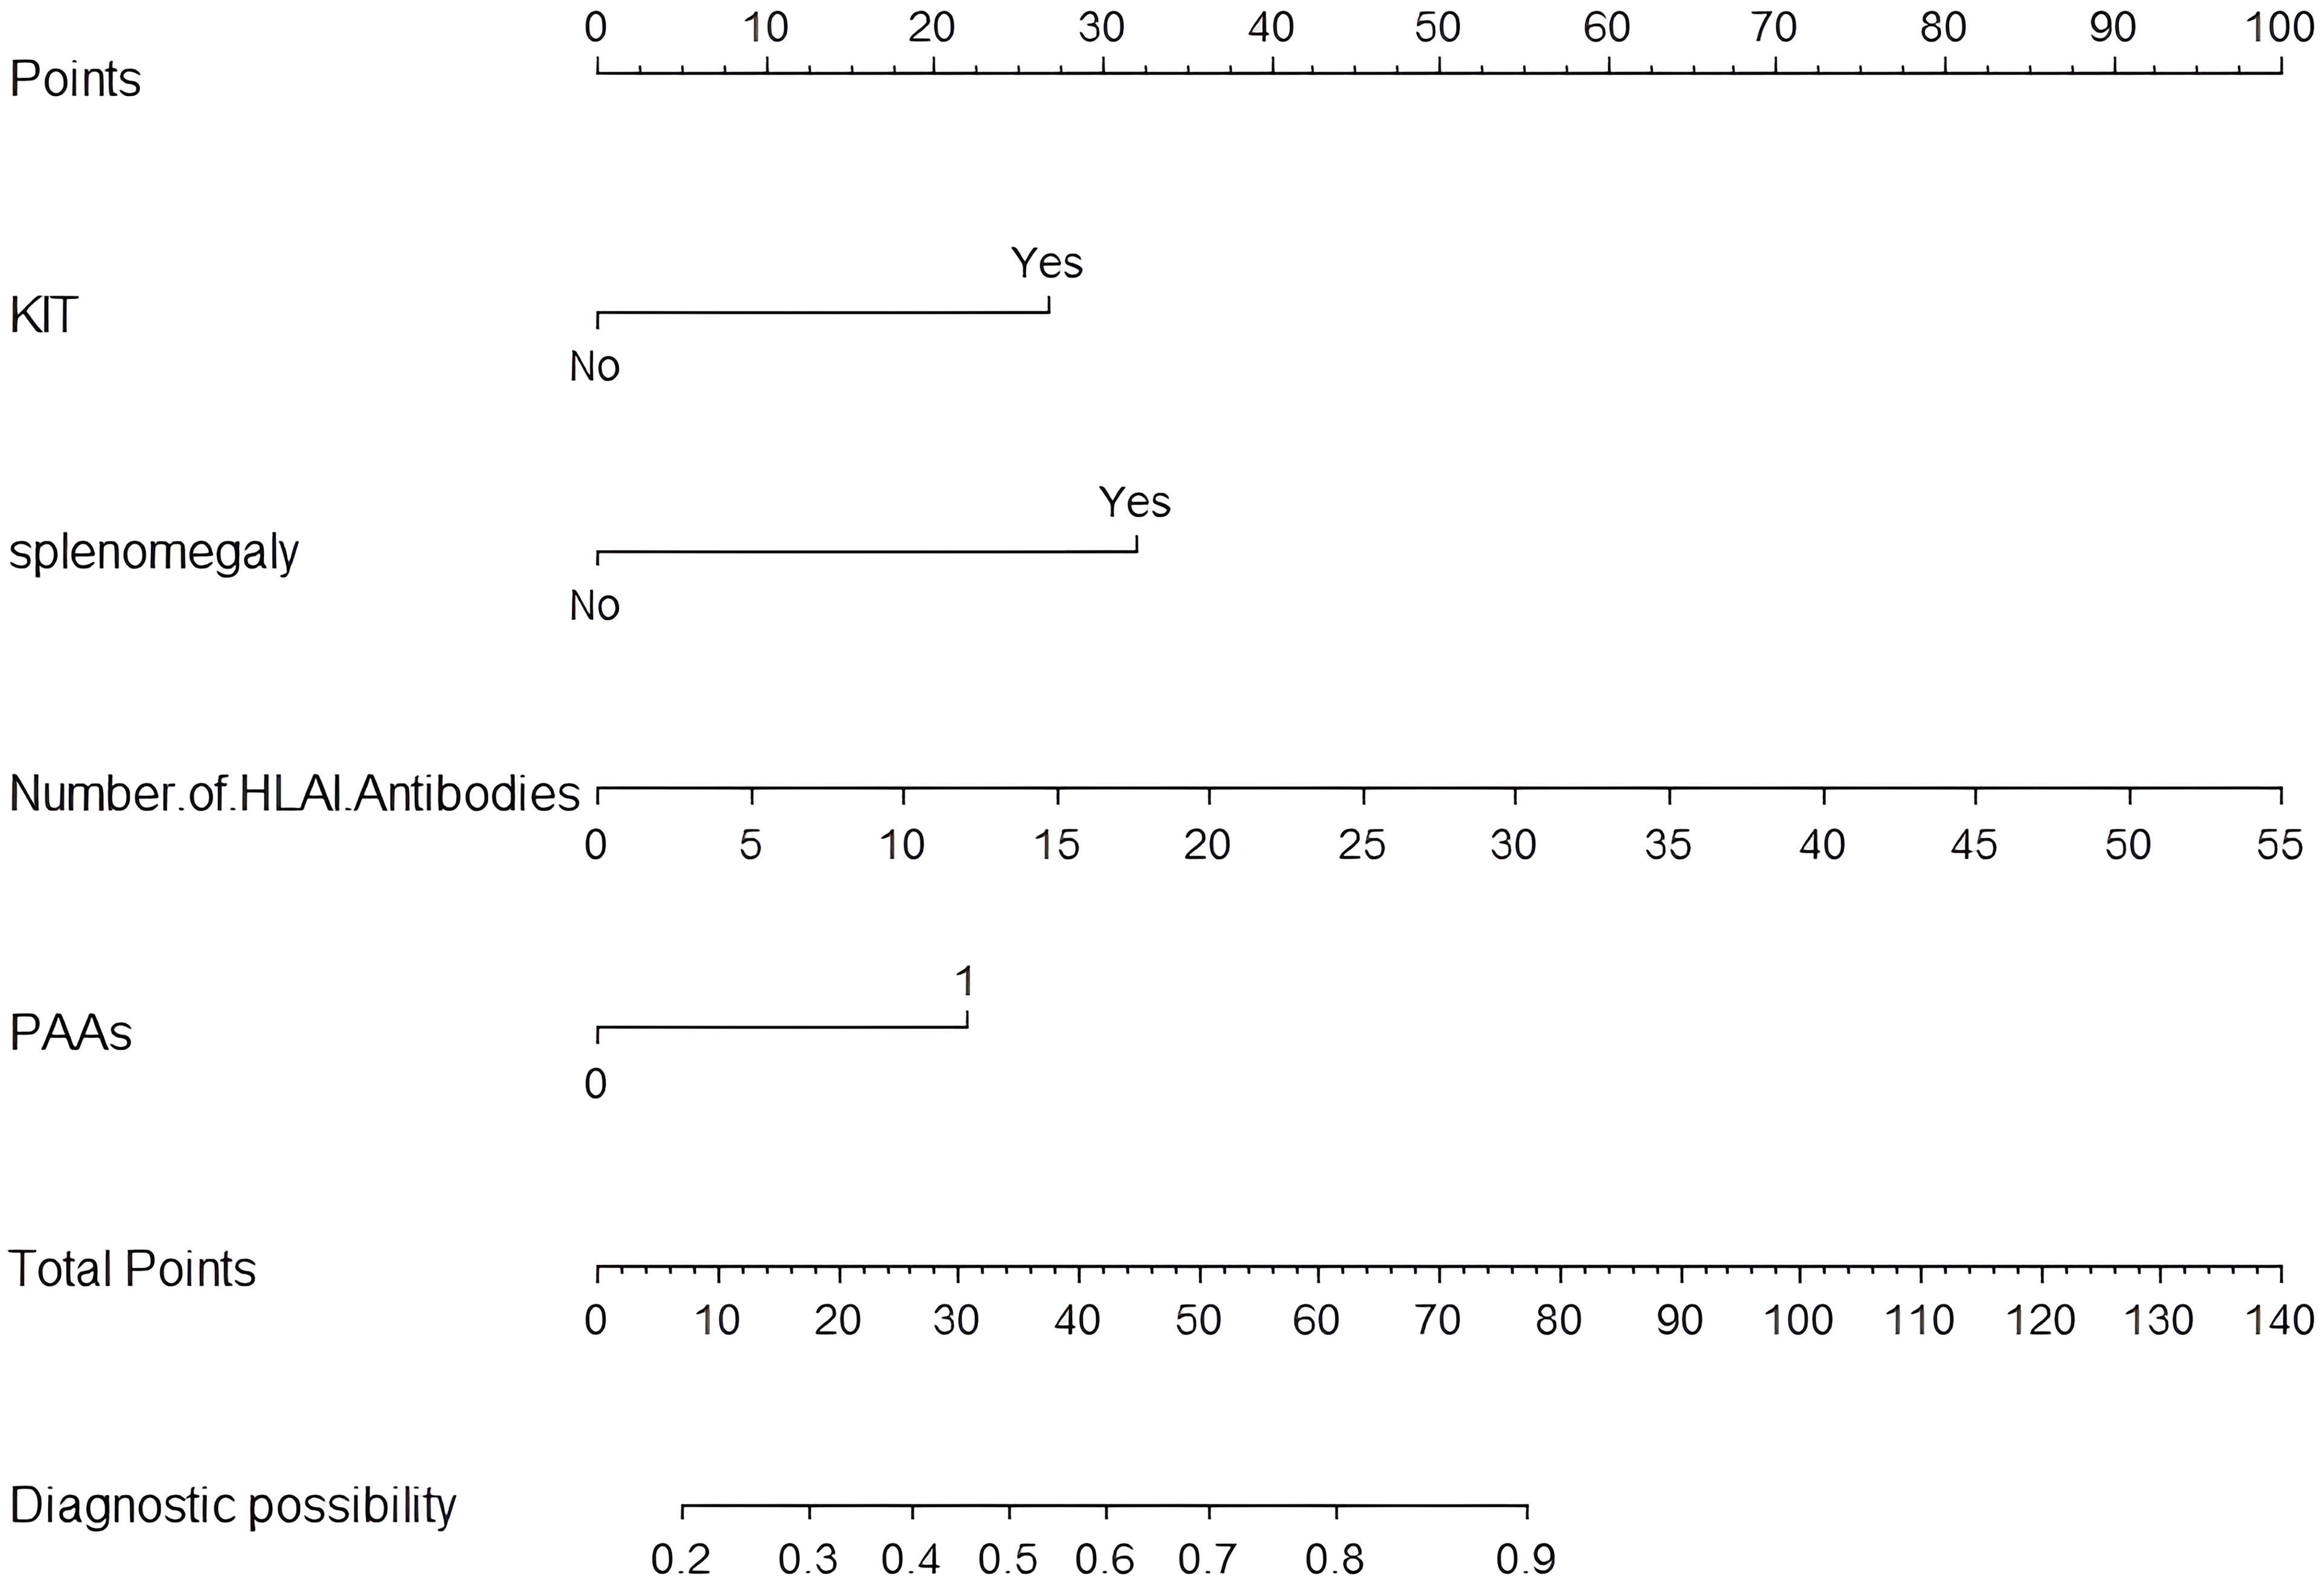
Nomogram prediction model for PTR.
Figure 6 shows that the model had a good predictive ability, with an AUC of 0.806 (95%CI: 0.740–0.871) in the training cohort and 0.868 (95% CI: 0.782–0.954) in the validation cohort. The calibration curve of the model in the training cohort matched the actual curve, as confirmed by the Hosmer-Lemeshow goodness-of-fit test (χ2 = 4.391, p = 0.884, Figure 7). Similarly, in the validation cohort, there was a consistent alignment between the actual and predicted probabilities, and the model passed the HL test (χ2 = 10.424, P = 0.317, Figure 7).

ROC curve of LASSO-logistic regression model in training cohort (a) and validation cohort (b).
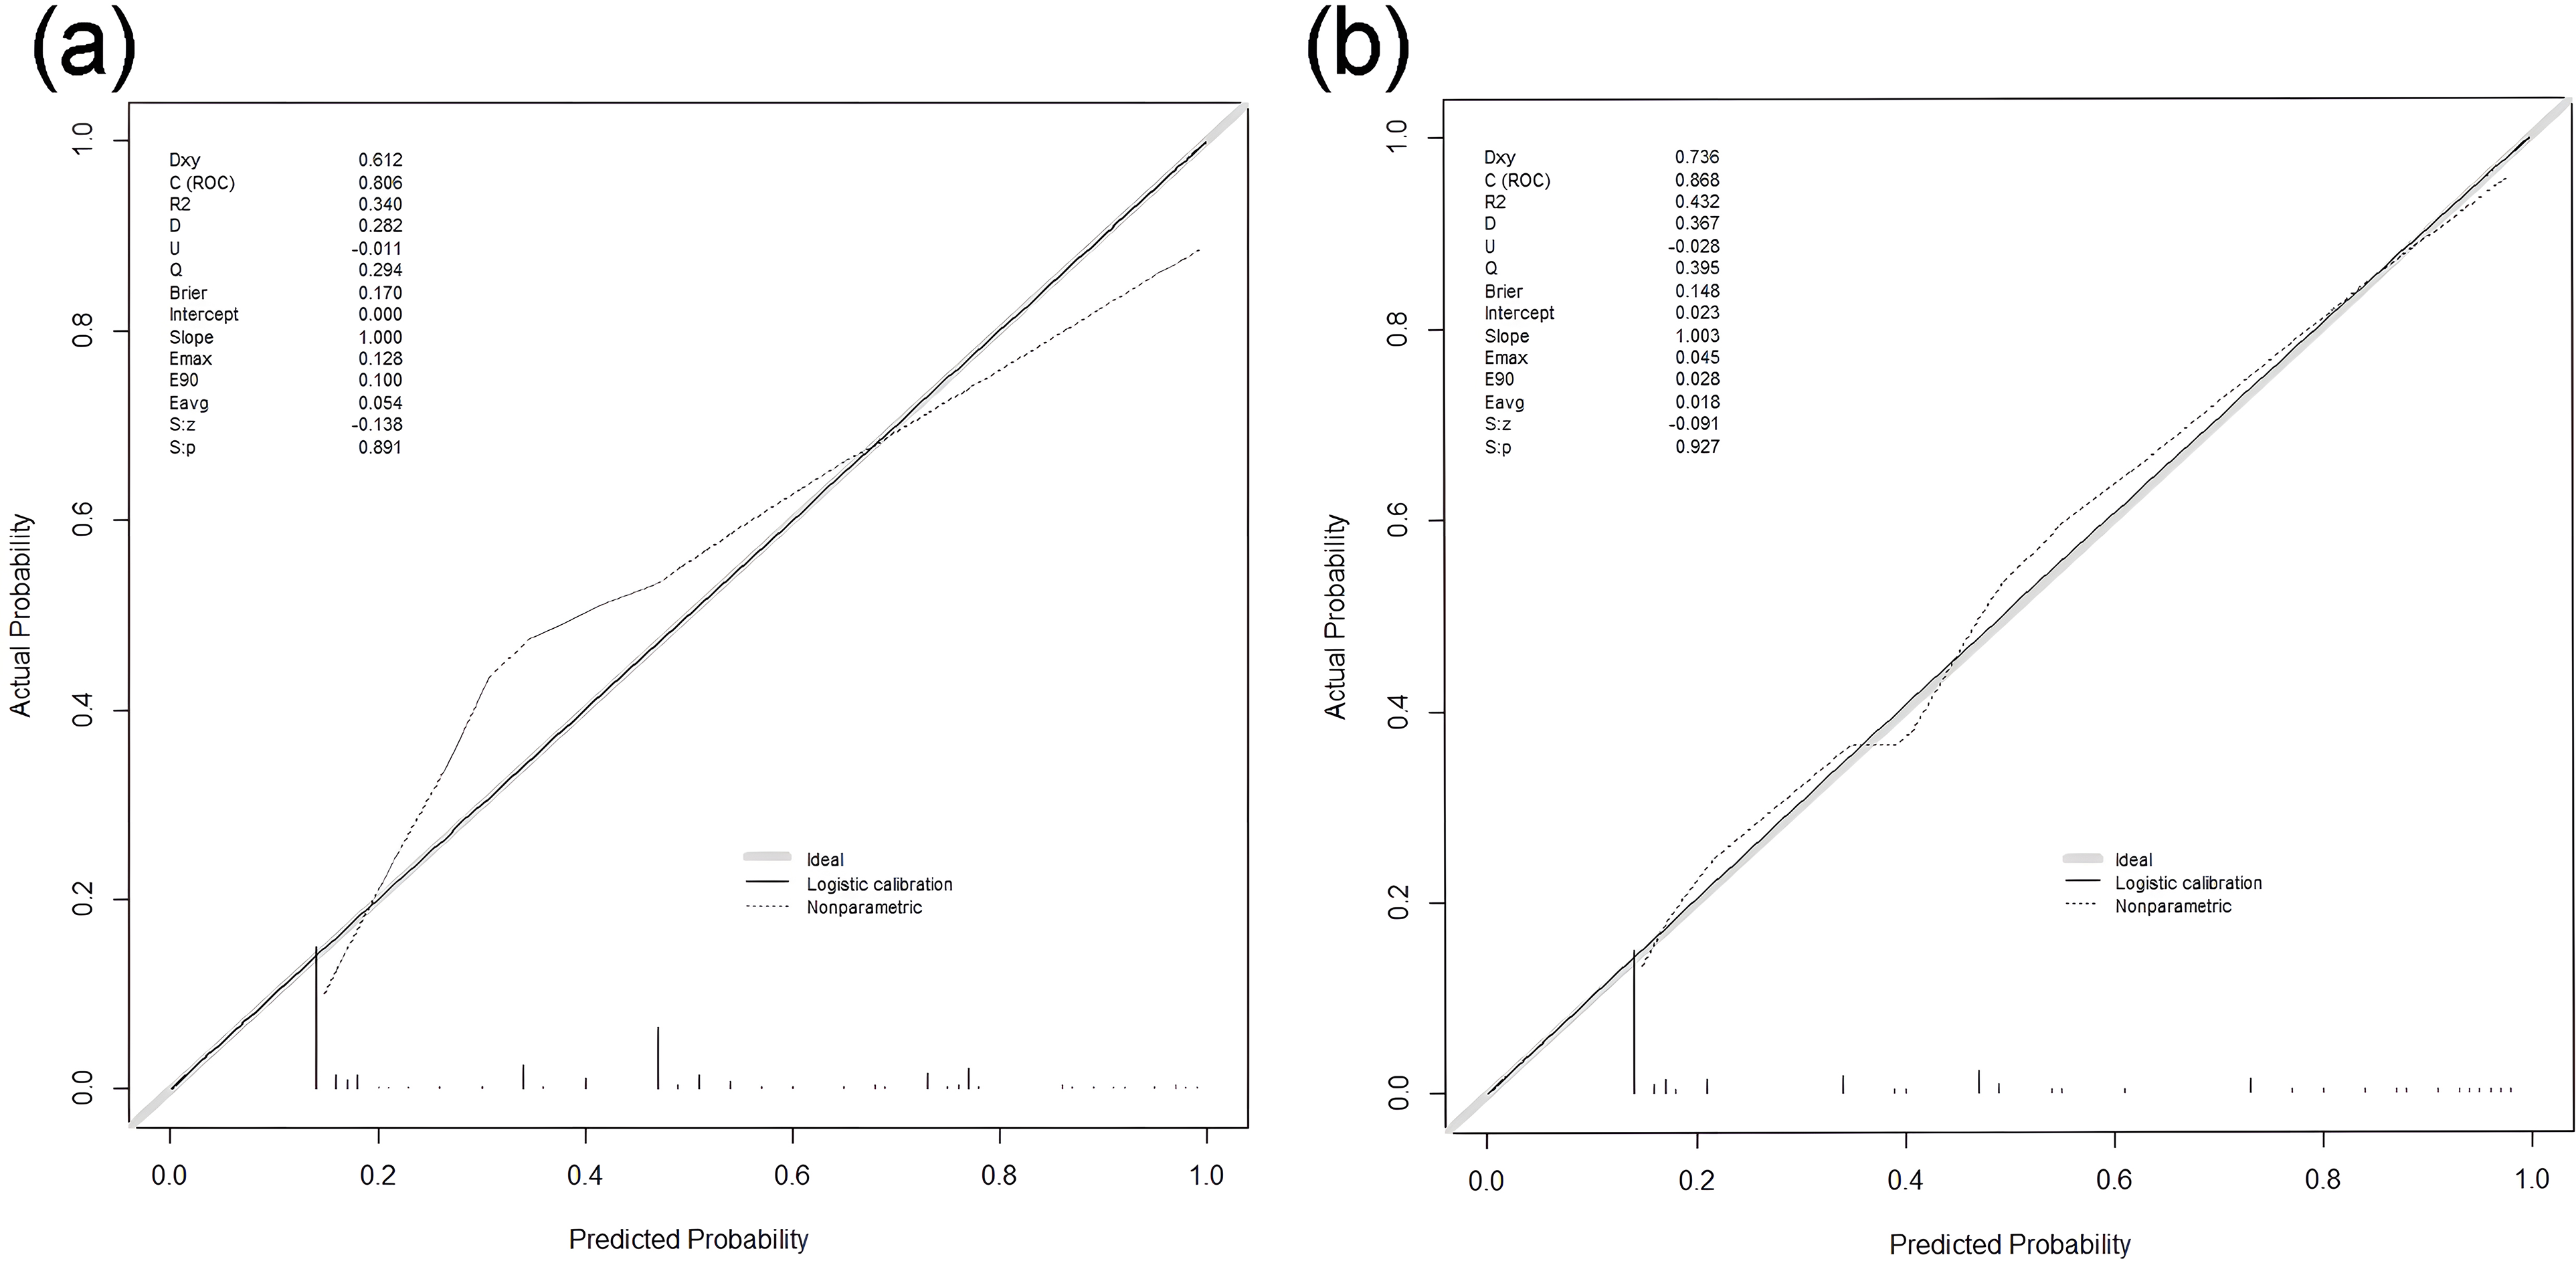
Calibration curve of training cohort (a) and validation cohort (b).
The DCA curve of the nomogram is depicted in Figure 8 The high-risk threshold probability refers to the probability of significant deviation occurring in the predictive model when clinicians use the nomogram for diagnosis and decision-making. In this study, the DCA curve indicates that the nomogram exhibits good clinical decision-making utility.
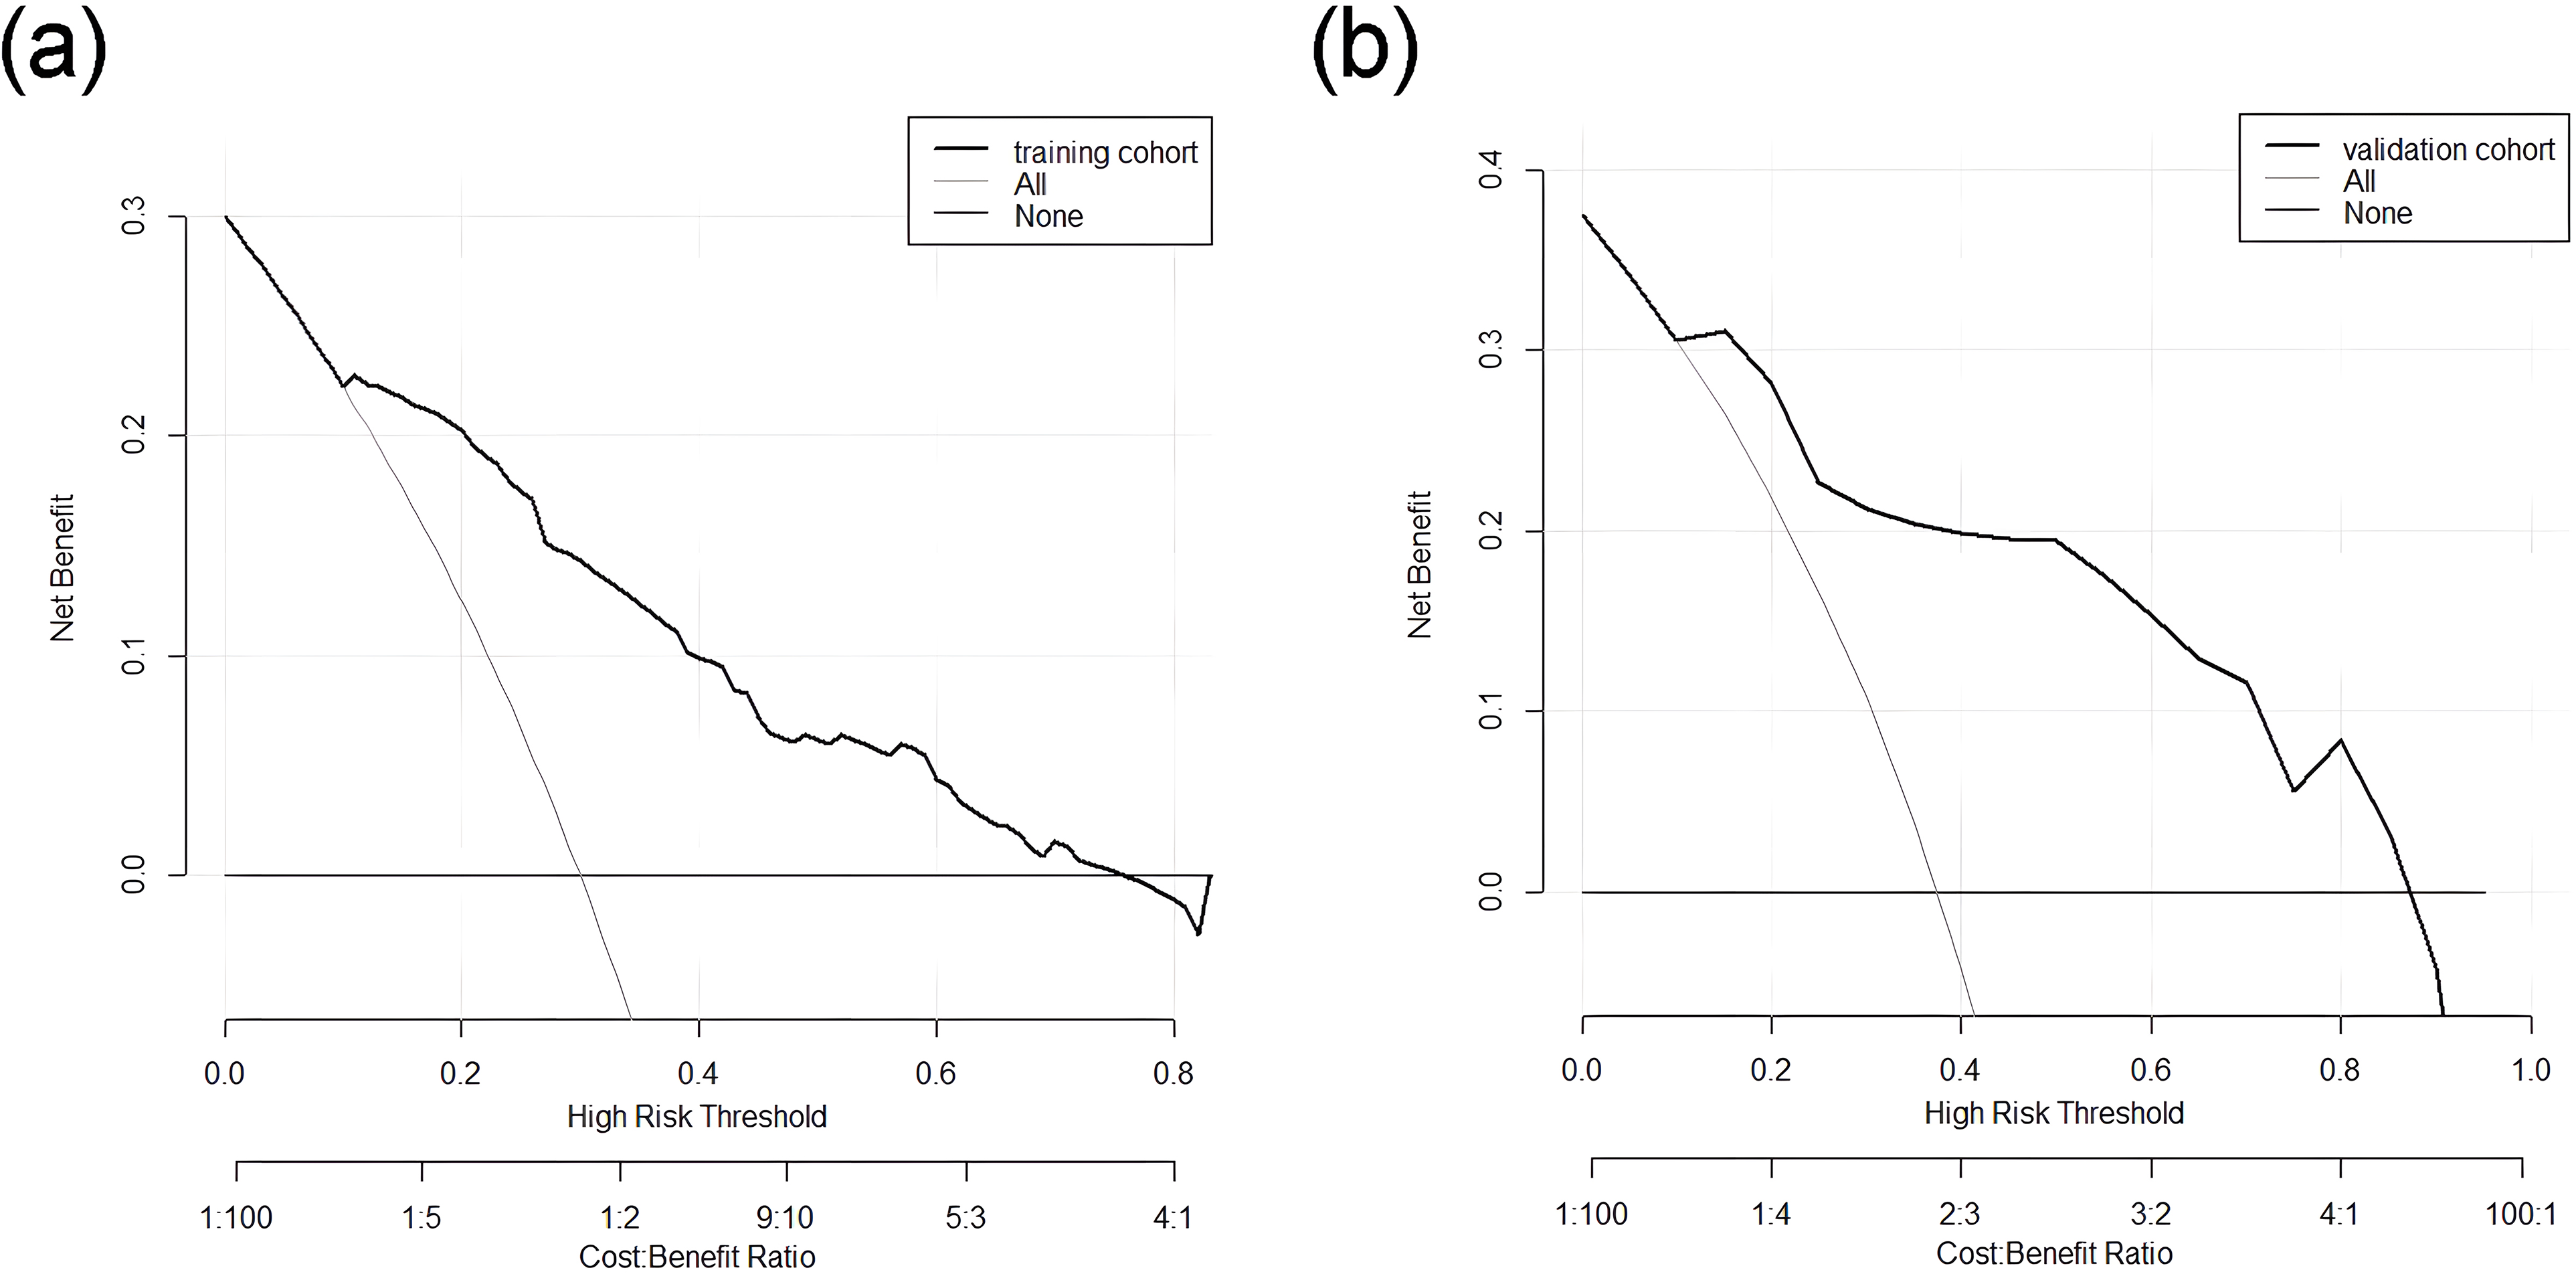
DCA curve of training cohort (a) and validation cohort (b). The horizontal and vertical axes represent the threshold probability and net benefit, respectively. The lines between the horizontal axis and vertical axis display the benefit of different predictive variables.
Discussion
Knowing the variables that can predict the risk of having PTR accurately is essential for preventing PTR. This study identified four independent risk factors associated with PTR, comprising two disease-related factors (KIT mutation and splenomegaly) and two immune-related factors (number of HLA-I antibodies and PAAs). These findings contribute to the development of practical intervention strategies.
KIT is a tyrosine kinase receptor located on the cell surface, and KIT mutations are a major oncogenic driver in AML. 18 Our study underscores the significant association between KIT mutations and an elevated risk of PTR, corroborating findings by Zhou et al 19 The results may provide insight into its effective treatment. Of particular interest is the potential therapeutic avenue offered by the KIT inhibitor avapritinib (AYVAKIT™), renowned for its potent and selective tyrosine kinase inhibitor against platelet-derived growth factor receptor alpha (PDGFRA) and KIT activating loop mutants. 20 Targeting this agent to patients with KIT mutations is expected to reduce the incidence of PTR.
In Aster's pioneering research, 21 51Cr-labeled platelets were transfused into both normal individuals and patients with splenomegaly. A radiation spectrometer was used to conduct a surface radioactive scan of body organs. The results demonstrate that the spleen is a major organ for labeled platelet aggregation, and that platelet consumption can be accelerated in the spleen. Splenomegaly has been shown in several studies to affect post-transfusion platelet increments and to shorten platelet transfusion intervals.22,23
The etiology of PTR is diverse and can be categorized into immunologic and non-immunologic factors. About 10% ∼ 25% of PTR is related to immunologic factors, which is defined as immune platelet transfusion refractoriness (iPTR).24–26 HLA class I antibodies are responsible for the majority of iPTR cases. Antibodies that target abundant HLA class I epitopes in serum react with transfused platelets, resulting in PTR. Previous laboratory studies have indicated that the MFI value of HLA class I antibodies serves as a risk factor for predicting PTR.2,27 In our research, we identified the number of HLA class I antibodies as an independent risk factor for PTR occurrence. Anti-HLA class I antibodies can mediate platelet clearance through deglycosylation, formation of membrane attack complexes, or CD32a receptor platelets activated by antibody binding. 15 In summary, selecting platelets from donors with HLA compatibility, primarily avoiding donor-specific antibodies (DSA), can result in higher post-transfusion platelet count increments for PTR patients. 28
Clinical treatment and preventive platelet transfusion are typically administered to patients with hematological malignancies. During a transfusion, allogeneic platelet antigens enter the body and stimulate the immune system to produce corresponding platelet antibodies. The Fab fragments of these antibodies can activate the complement system, leading to the destruction of platelets. In addition, if patients receive platelet transfusion again, platelet associated antigen antibody reaction will occur, which is more likely to occur PTR. They reduce platelet destruction by blocking antibodies, clearing antibodies, and inhibiting antibody production, respectively. 9
Conclusion
In summary, the occurrence of PTR during hospitalization in AML patients is primarily associated with KIT mutations, concurrent splenomegaly, the number of HLA-I antibodies, and positive platelet antibodies. A nomogram prediction model was successfully constructed using this information. The predictive model demonstrated good discrimination and consistency through validation. Therefore, obtaining information about these risk factors in PTR prediction may assist clinical professionals in taking early measures to reduce the severity and duration of PTR. However, this study has some potential limitations. The prediction model for PTR was constructed at a single hospital, the sample size was small, and the study was retrospective study design, which may affect the accuracy of the model and limit the generalizability of the study results. Further validation through multicenter external studies is needed to confirm the model's robustness.
Footnotes
Acknowledgments
We are grateful to the patients and researchers who participated in this study.
Author Contributions
Ruixue Ma, Xiaowen Tang and Depei Wu proposed the concept of this research and designed the study; Ruixue Ma and Qingya Cui conducted the PTR assessments on the patients; Ruixue Ma and Yunju Ma collected and analyzed the data; Ruixue Ma wrote the manuscript; and all authors provided final approval of the manuscript.
Data Sharing Statement
The datasets are available from the corresponding author on reasonable request.
Ethical Approval
All procedures performed in studies involving human participants were in accordance with the ethical standards of the institutional and/or national research committee and with the 1964 Helsinki declaration and its later amendments or comparable ethical standards. The Ethics Committee of The First Affiliated Hospital of Soochow University reviewed and approved this study.
Declaration of Conflicting Interests
The authors declared no potential conflicts of interest with respect to the research, authorship, and/or publication of this article.
Funding
The authors disclosed receipt of the following financial support for the research, authorship, and/or publication of this article: This work was supported by research grants from National Natural Science Foundation of China (82070162, 82341209), Frontier Clinical Technical Project of Suzhou Science and Technology plan (SKY2022001), Bethune Charitable Foundation (BCF-IBW-XY-20220930-13), Suzhou diagnosis and treatment project of Clinical Key Diseases (LCZX202201), China International Medical Foundation (Z-2018-31-2102-4), Boxi clinical research project of The First Affiliated Hospital of Soochow University (BXLC005), the Priority Academic Program Development of Jiangsu Higher Education Institutions (PAPD).
China International Medical Foundation, Frontier Clinical Technical Project of Suzhou Science and Technology plan, Suzhou diagnosis and treatment project of Clinical Key Diseases, Priority Academic Program Development of Jiangsu Higher Education Institutions, National Natural Science Foundation of China, Boxi clinical research project of The First Affiliated Hospital of Soochow University, Bethune Charitable Foundation (grant number Z-2018-31-2102-4, SKY2022001, LCZX202201, 82070162, 82341209, BXLC005, BCF-IBW-XY-20220930-13).