
Abstract
Venous thromboembolism (VTE) is a common complication in patients with high-grade serous ovarian cancer (HGSOC) after surgery. This study aims to establish a comprehensive risk assessment model to better identify the potential risk of postoperative VTE in HGSOC. Clinical data from 587 HGSOC patients who underwent surgical treatment were retrospectively collected. Univariate and multivariate logistic regression analyses were performed to identify independent factors influencing the occurrence of postoperative VTE in HGSOC. A nomogram model was constructed in the training set and further validated in the verification set. Logistic regression identified age (odds ratio [OR] = 1.063, P = .002), tumor size (OR = 3.815, P < .001), postoperative transfusion (OR = 5.646, P = .001), and postoperative D-dimer (OR = 1.246, P = .003) as independent risk factors for postoperative VTE in HGSOC patients. A nomogram was constructed using these factors. The receiver operating characteristic curve showed an area under the curve (AUC) of 0.840 (95% confidence interval [CI]: 0.782, 0.898) in the training set and 0.793 (95% CI: 0.704, 0.882) in the validation set. The calibration curve demonstrated a good consistency between model predictions and actual results. The decision curve analysis indicated the model benefits at a threshold probability of less than 70%. A nomogram predicting postoperative VTE in HGSOC was established and validated. This model will assist clinicians in the early identification of high-risk patients, enabling the implementation of appropriate preventive measures.
Keywords
Introduction
High-grade serous ovarian cancer (HGSOC) is the most common subtype of ovarian cancer, accounting for approximately 70% of all ovarian cancer cases.1,2 HGSOC progresses rapidly, and patients are often diagnosed at an advanced stage, with surgical intervention being a primary treatment modality for this disease.3,4 However, postoperative complications can significantly impact patient survival and quality of life. Among these complications, venous thromboembolism (VTE) comprising deep vein thrombosis (DVT) and pulmonary embolism (PE) is a prevalent and severe occurrence leading to delayed postoperative recovery, prolonged hospitalization, diminished quality of life, and increased mortality.5–7 Prophylactic anticoagulation can reduce the risk of VTE postoperatively, but concurrently elevates the risk of postoperative hemorrhage.8–10 Both complications significantly affect the prognosis and quality of life. There exists a contradiction between the prevention of VTE through prophylactic anticoagulation and the increased likelihood of hemorrhage. Therefore, an accurate assessment of the risk of VTE post-surgery can aid clinicians in better identifying individuals at high risk and in formulating personalized early prevention strategies.
Currently, several VTE risk assessment models have been extensively researched and applied in clinical practice. The Khorana score is specifically designed for cancer patients undergoing chemotherapy. The score includes factors, such as the site of cancer, platelet count, hemoglobin level, use of erythropoiesis-stimulating agents, and body mass index (BMI). 11 The Vienna Cancer and Thrombosis Study (CATS) model is a clinical prediction tool that was developed to help estimate the risk of VTE in patients with cancer. 12 By combining several clinical factors with laboratory markers, the Vienna CATS model assigns a score that categorizes patients into different risk groups. 13 However, there is currently a lack of risk assessment models specifically tailored for patients with high-grade serous ovarian cancer. Although several VTE prediction models are applicable in assessing the risk of thrombosis following surgeries for malignant tumors, their applicability is limited when dealing with HGSOC, which exhibits distinct biological and clinical tumor characteristics. For instance, HGSOC typically involves peritoneal progress or the ascites, often necessitates extensive debulking surgeries, such as resection of liver lesions and partial intestinal resection, and poses a potential higher risk of VTE. Moreover, some patients with HGSOC undergo specific chemotherapy regimens preoperatively, which carry thrombotic risks different from other cancers. Therefore, there is a pressing need to develop VTE risk prediction models specifically tailored for HGSOC patients.
A nomogram is an advanced predictive tool designed to integrate multiple risk factors into a single risk assessment. 14 This statistical model graphically represents a complex mathematical formula that can predict a specific outcome, such as the occurrence of a disease or the likelihood of a disease-related event. Nomograms are particularly useful in medicine for their ability to provide personalized risk assessments and are being widely utilized in predicting cancer prognosis.15–17 The application in assessing the VTE risk has also been reported across various types of cancer.10,18,19
This study aims to establish a nomogram risk prediction model for postoperative VTE in HGSOC by elucidating relevant clinical factors and risk indicators. This model can guide clinicians in more accurately assessing the postoperative VTE risk for patients, thereby facilitating early identification and prevention of high-risk individuals. By employing personalized care strategies, this nomogram contributes to the improvement of patient prognosis and quality of life and the alleviation of the healthcare burden.
Methods
Study Population
From January 2018 to May 2023, a retrospective collection of demographic and clinical data was conducted on patients with high-grade serous ovarian cancer treated at the Department of Gynecology, The First Affiliated Hospital of Chongqing Medical University. The inclusion criteria for the final analysis were as follows: (1) pathology-confirmed high-grade serous ovarian cancer; (2) undergone surgical treatment; and (3) complete clinical data. The exclusion criteria were as follows: (1) preoperative diagnosis of VTE; (2) non-primary ovarian malignancies; (3) presence of other malignant tumors or severe comorbidities affecting life and health; and (4) incomplete data. The complete flowchart of the study is depicted in Figure 1.
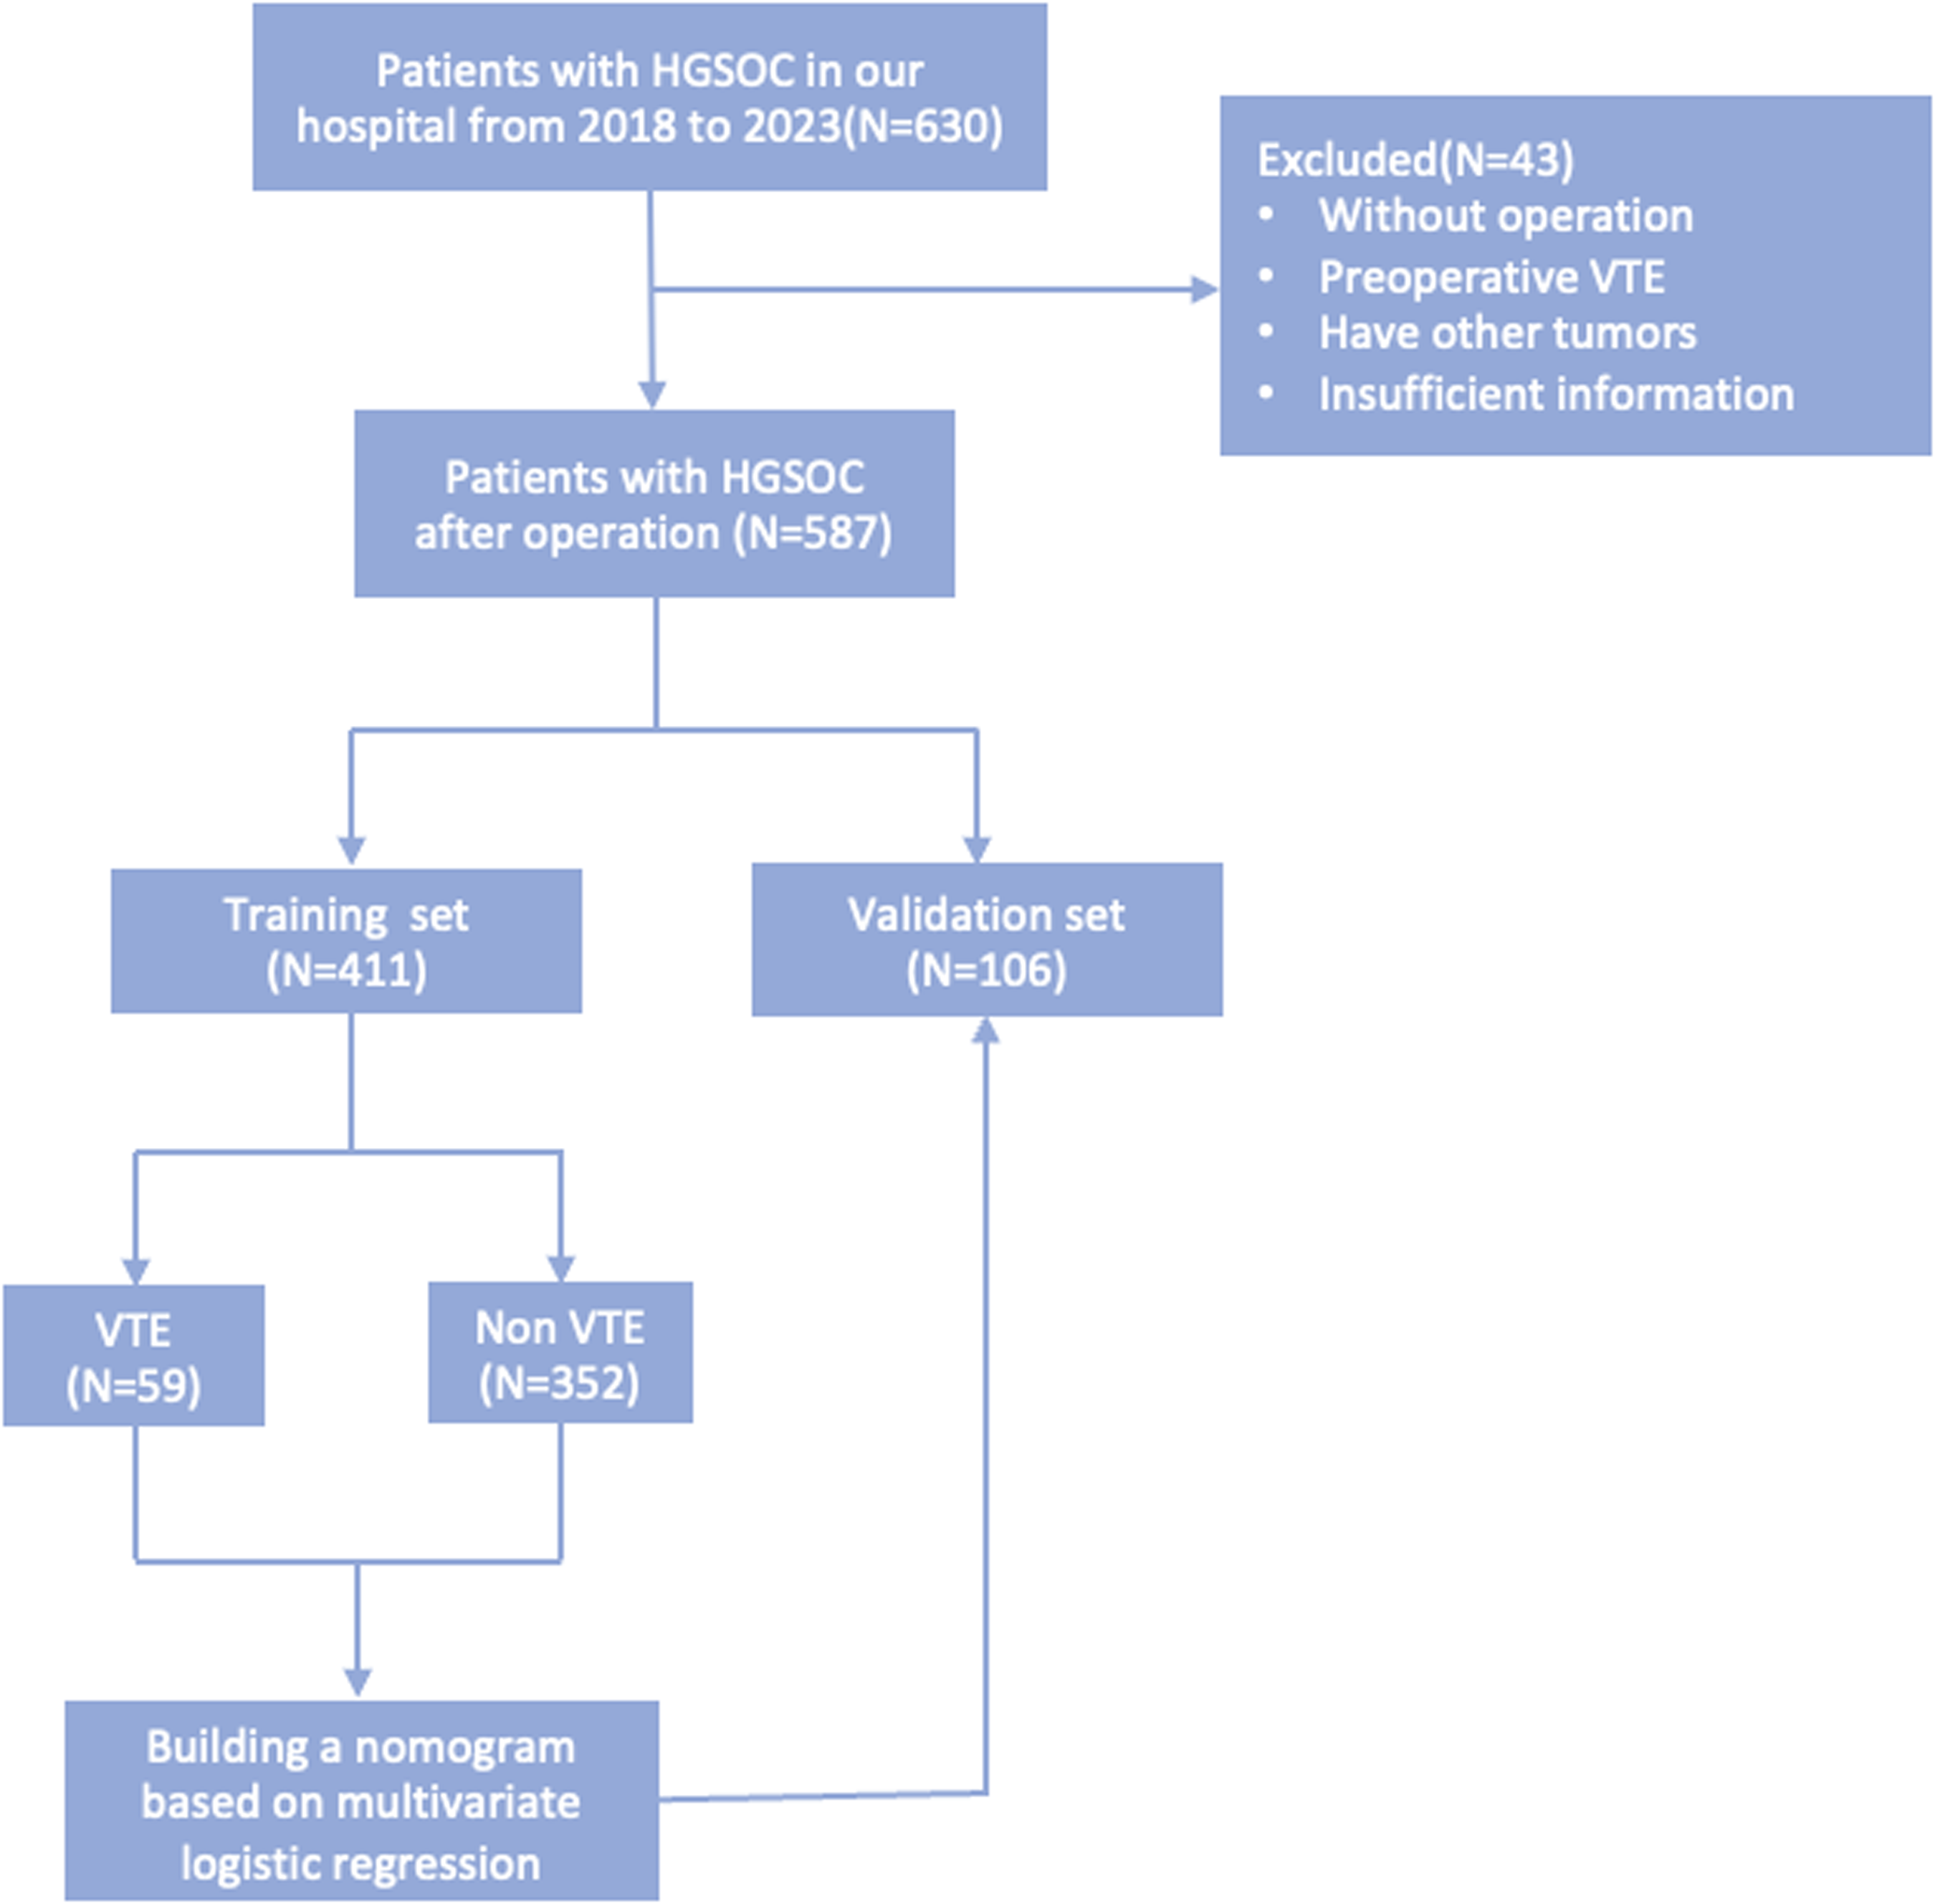
Flow chart of the study design and analysis. *HGSOC: high-grade serous ovarian cancer; VTE: venous thromboembolism.
Venous thromboembolism encompassing DVT and PE was diagnosed based on clinical presentation and Doppler ultrasound for DVT. Women with DVT underwent further confirmation for PE through CT pulmonary angiography (CTPA). PE was diagnosed based on clinical presentation and computed tomography pulmonary angiography. The study received approval from the Ethics Committee of The First Affiliated Hospital of Chongqing Medical University (Ethics Approval No. K2023-292). Informed consent was obtained from all patients.
Data Collection
The demographic and clinical data of enrolled patients were retrieved through our hospital's electronic medical record system. These included the following: (1) baseline data: patient age, BMI, presence of chronic cardiovascular complications, including hypertension, hyperlipidemia, diabetes, and coronary heart disease, and menopausal status at diagnosis; (2) clinical pathology data of the tumor: tumor size (maximum diameter of the ovary tumor specimen), tumor staging, lymph-vascular space invasion (LVSI), and lymph node metastasis; (3) treatment-related data: duration of surgery, surgical method (laparotomy and laparoscopy), intraoperative ascites, intraoperative and postoperative blood transfusion, and neoadjuvant chemotherapy; (4) hematological indicators: blood routine indicators on the first day post-operation, including neutrophil count, lymphocyte count, platelet count (PLT), neutrophil-to-lymphocyte ratio (NLR), and platelet-to-lymphocyte ratio (PLR); and (5) coagulation function indicators: prothrombin time (PT), activated partial thromboplastin time (APTT), thrombin time (TT), fibrinogen (FBG), fibrin degradation products (FDP), and D-dimer.
Statistical Methods
In this study, thrombotic events occurring within 30 days after operation were considered endpoint events. Data were analyzed using SPSS 26.0 and R software. Continuous variables were expressed as mean ± standard deviation or median with interquartile range, and differences were compared using t-tests or rank-sum tests. Categorical variables were presented as frequencies and percentages, and intergroup comparisons were made using the χ2 test.
Univariate logistic regression analysis was employed to identify relevant risk factors for the occurrence of VTE, with variables having P < .05 in the univariate analysis further included in the multivariate logistic regression analysis. In the development of the nomogram, factors with a significance level of P < .05 in the multivariable logistic regression are utilized to construct the model. Based on the regression coefficients derived from the multivariable logistic regression analysis, each variable included in the model is assigned a weighted score ranging from 0 to 100. During the model development process, the bootstrapping method (1000 times) was employed for internal validation and optimization. The risk factor scores were calculated based on the established model to assess the risk of venous thromboembolism for patients.
Subsequently, internal and external model validations were performed in the training and validation groups, respectively. The receiver operating characteristic (ROC) curve for the two groups were plotted, and the area under the curve (AUC) was calculated to evaluate the predictive value of the model for VTE occurrence. The Youden Index (sensitivity + specificity − 1) was used to identify the risk threshold of the model. This threshold divides patients into high-risk and low-risk groups. Accuracy of the model in predicting VTE occurrence was further validated using calibration curve. Decision curve analysis (DCA) was used to assess the clinical benefit of the nomogram. A significance level of P < .05 was considered statistically significant.
Results
Characteristics of Patients
A total of 587 patients with high-grade serous ovarian cancer were finally included in the study. Using a 7:3 ratio, consistent with many other similar studies,10,15,20 the patients were randomly divided into a training group (n = 411) and a validation group (n = 176). In the training group, 59 patients (14.35%) experienced postoperative VTE, while in the validation group, 27 patients (15.34%) had postoperative VTE. The baseline characteristics of the patients in the training and validation groups are presented in Table 1.
Baseline Demographic and Clinical Characteristics of Patients.
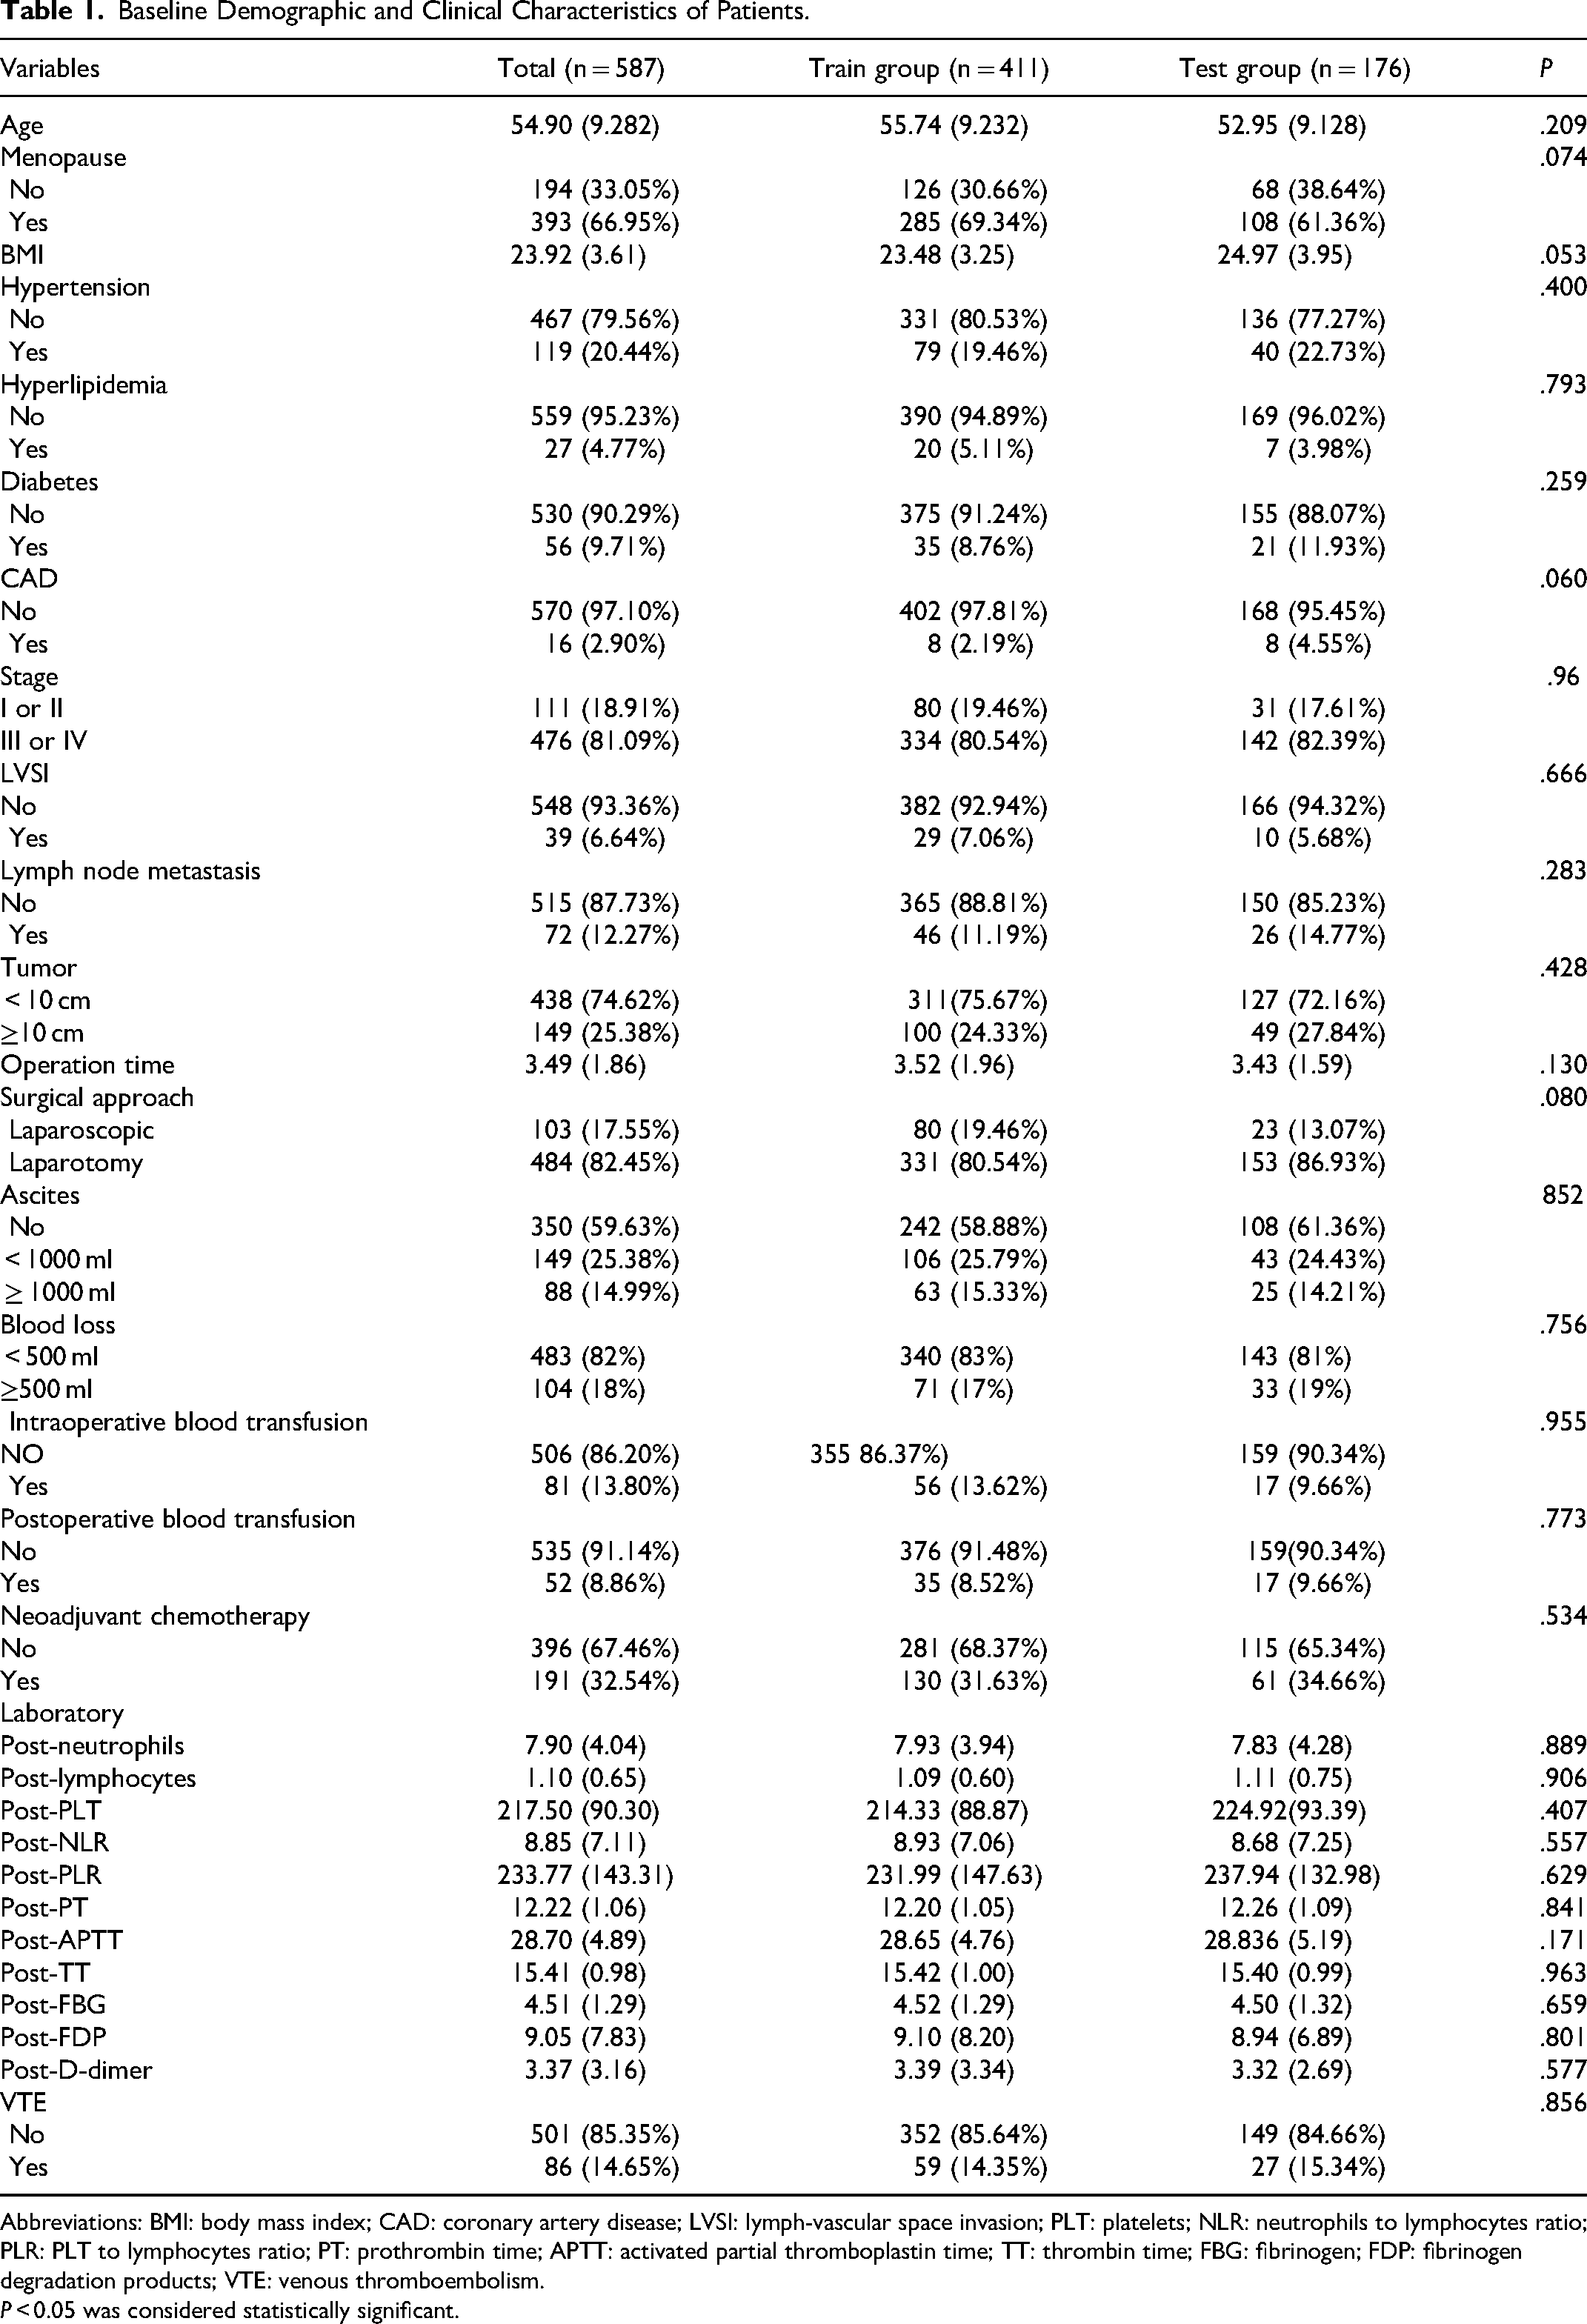
Abbreviations: BMI: body mass index; CAD: coronary artery disease; LVSI: lymph-vascular space invasion; PLT: platelets; NLR: neutrophils to lymphocytes ratio; PLR: PLT to lymphocytes ratio; PT: prothrombin time; APTT: activated partial thromboplastin time; TT: thrombin time; FBG: fibrinogen; FDP: fibrinogen degradation products; VTE: venous thromboembolism.
P < 0.05 was considered statistically significant.
Independent Predictors of Postoperative VTE in HGSOC
Logistic regression univariate analysis was conducted to identify factors that may influence the occurrence of postoperative VTE in HGSOC. Factors with P values < 0.05 included age (odds ratio [OR] = 1.057, P < .001), tumor size (OR = 6.439, P < .001), surgical approach (OR = 0.302, P < .001), ascites (OR = 4.651, P < .001), intraoperative blood transfusion (OR = 2.031, P = .045), postoperative blood transfusion (OR = 6.521, P < .001), PLT (OR = 1.004, P = .012), PLR (OR = 1.003, P = .002), APTT (OR = 1.069, P = .014), FDP (OR = 1.124, P < .001), and D-dimer (OR = 1.399, P < .001). These factors were further included in the logistic regression multivariate analysis. The results showed that age (OR = 1.063, P = .002), tumor size (OR = 3.815, P < .001), postoperative blood transfusion (OR = 5.646, P = .001), and postoperative D-dimer (OR = 1.246, P = 0.003) were independent risk factors for postoperative VTE in patients, as shown in Table 2.
Univariable and Multivariable Logistic Regression Analyses of Factors Associated with VTE.
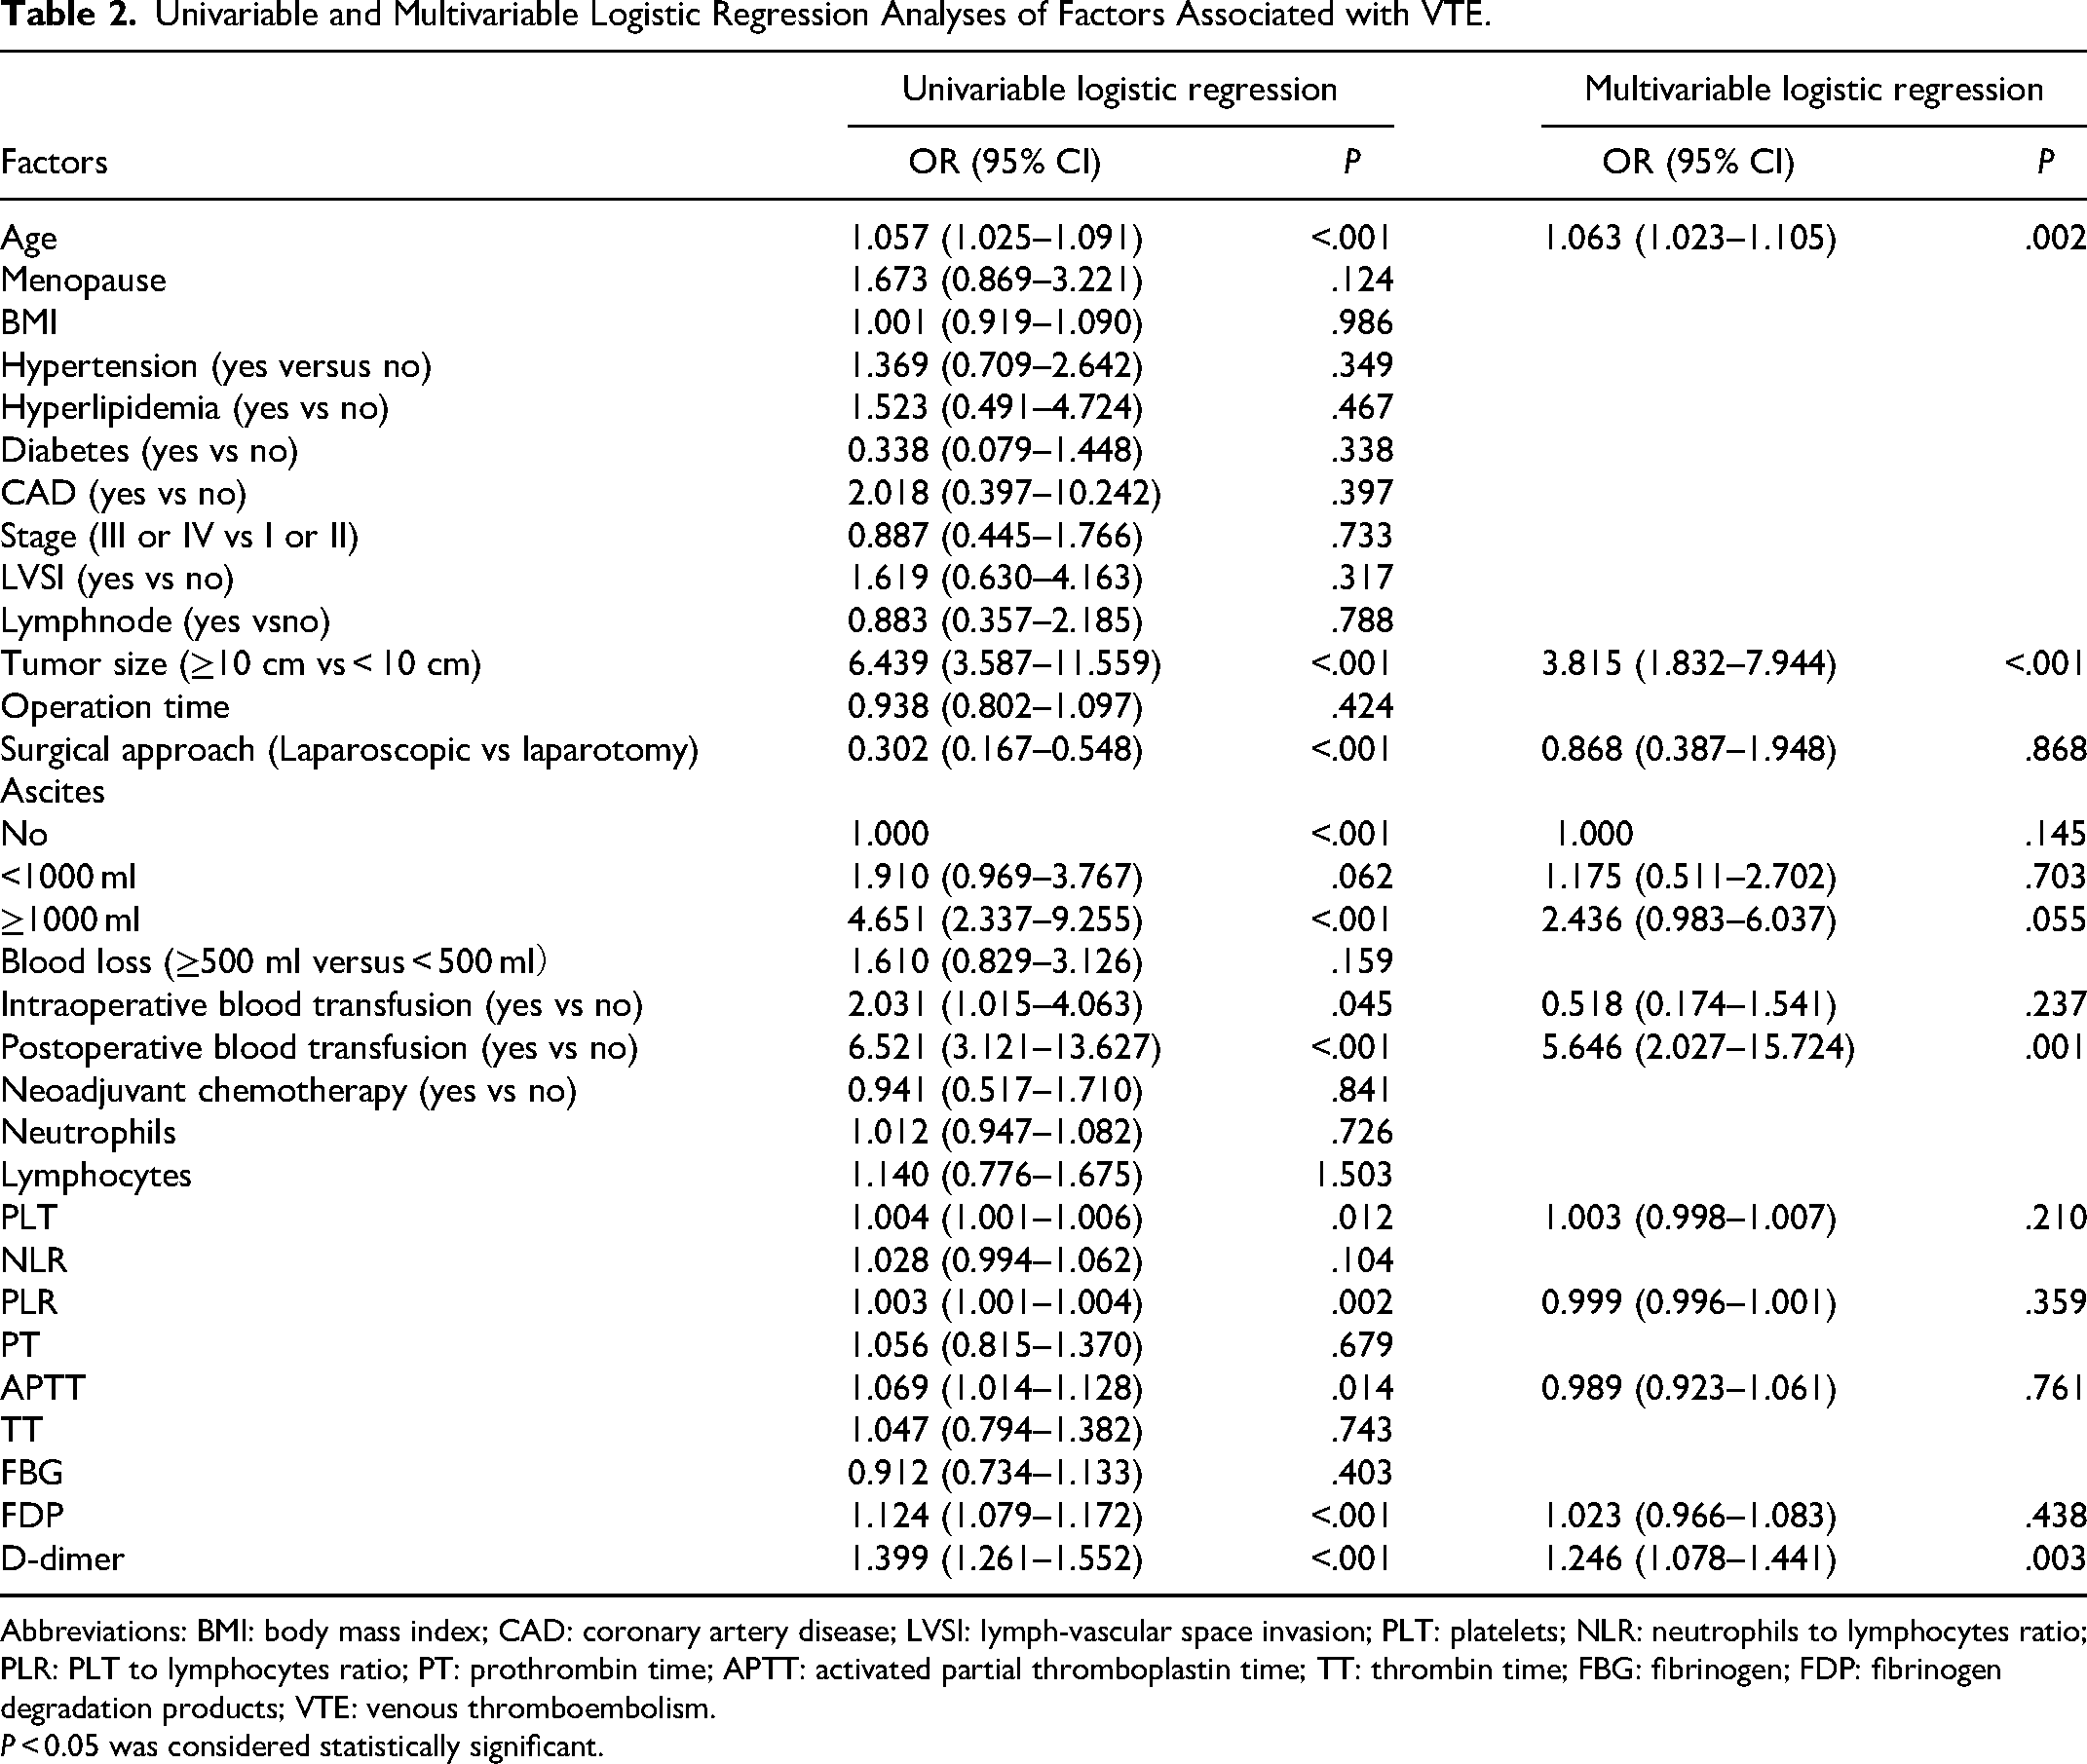
Abbreviations: BMI: body mass index; CAD: coronary artery disease; LVSI: lymph-vascular space invasion; PLT: platelets; NLR: neutrophils to lymphocytes ratio; PLR: PLT to lymphocytes ratio; PT: prothrombin time; APTT: activated partial thromboplastin time; TT: thrombin time; FBG: fibrinogen; FDP: fibrinogen degradation products; VTE: venous thromboembolism.
P < 0.05 was considered statistically significant.
Development of the VTE Prediction Nomogram
The nomogram model for predicting the risk of postoperative VTE in HGSOC is presented in Figure 2. The factors identified in the multivariate logistic regression analysis, including age, tumor size, postoperative blood transfusion, and postoperative D-dimer, were individually listed in the nomogram. The length of each line segment represents the weight of each factor, with the D-dimer having the longest line segment, indicating its highest weight, followed by patient age. Each variable was assigned a score in the model, and the total score, when aligned with the total score scale, provided a more accurate estimate of the probability of postoperative VTE.
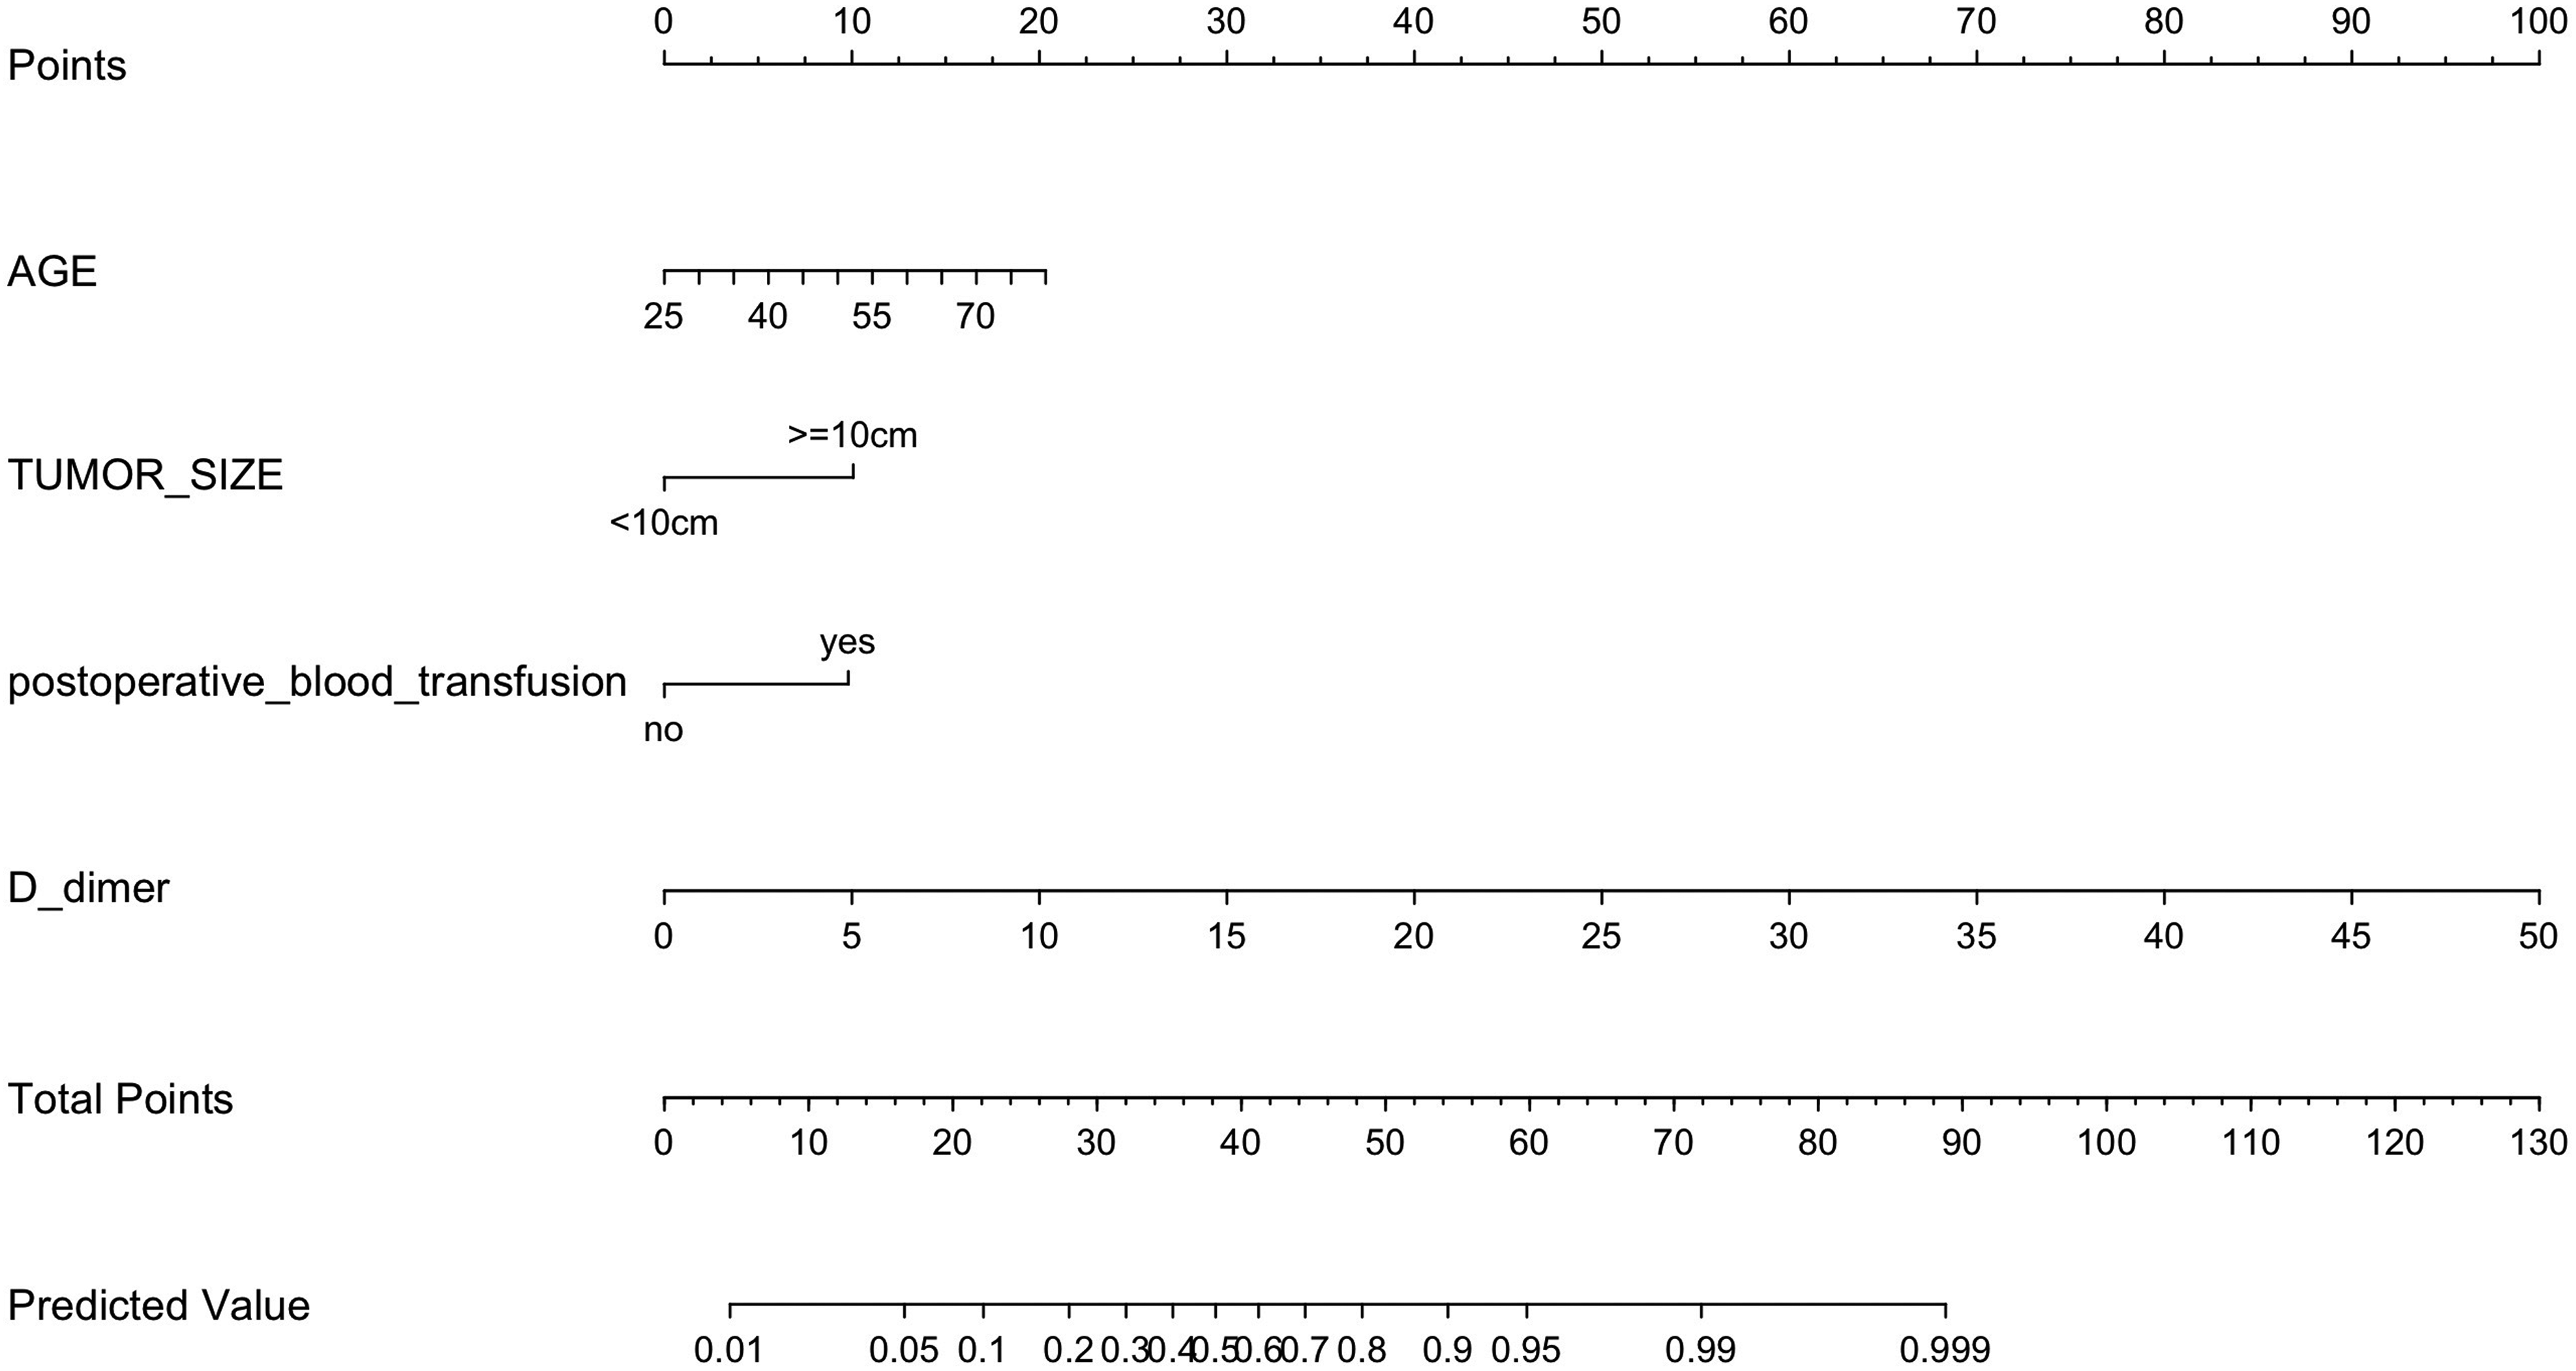
Nomogram model predicting the VTE risk for HGSOC patients after operation. Each variable was assigned a score in the model, and the total score, when aligned with the total score scale, provided a more accurate estimate of the probability of postoperative VTE.
In addition, to facilitate clinicians in predicting the risk of postoperative VTE in HGSOC patients more conveniently, we developed an online application using the R package “shinyPredict” (https://cran.r-project.org/web/packages/shinyPredict/). This web application can be accessed at (https://zhenhuang.shinyapps.io/Zhen_nom/). Upon entering the parameters, users can obtain the probability of VTE occurrence.
Validation, Calibration, and Comparison of the Nomogram
The ROC curves were plotted in both the training and validation sets to assess the model's discriminatory power, with AUC values of 0.840 (95% confidence interval [CI]: 0.782–0.898) and 0.793 (95% CI: 0.704–0.882) respectively, indicating good discriminative ability (see Figure 3A and B). By utilizing the maximum value of the Youden Index, the optimal risk threshold for the model was identified as 0.282 within the training cohort. This threshold corresponds to a sensitivity of 0.926 and a specificity of 0.627. Accordingly, individuals with model-predicted risk probabilities equal to or exceeding the determined threshold are categorized into the high-risk group for VTE occurrence. Conversely, those with model-predicted risk probabilities below the established threshold are assigned to the low-risk group.
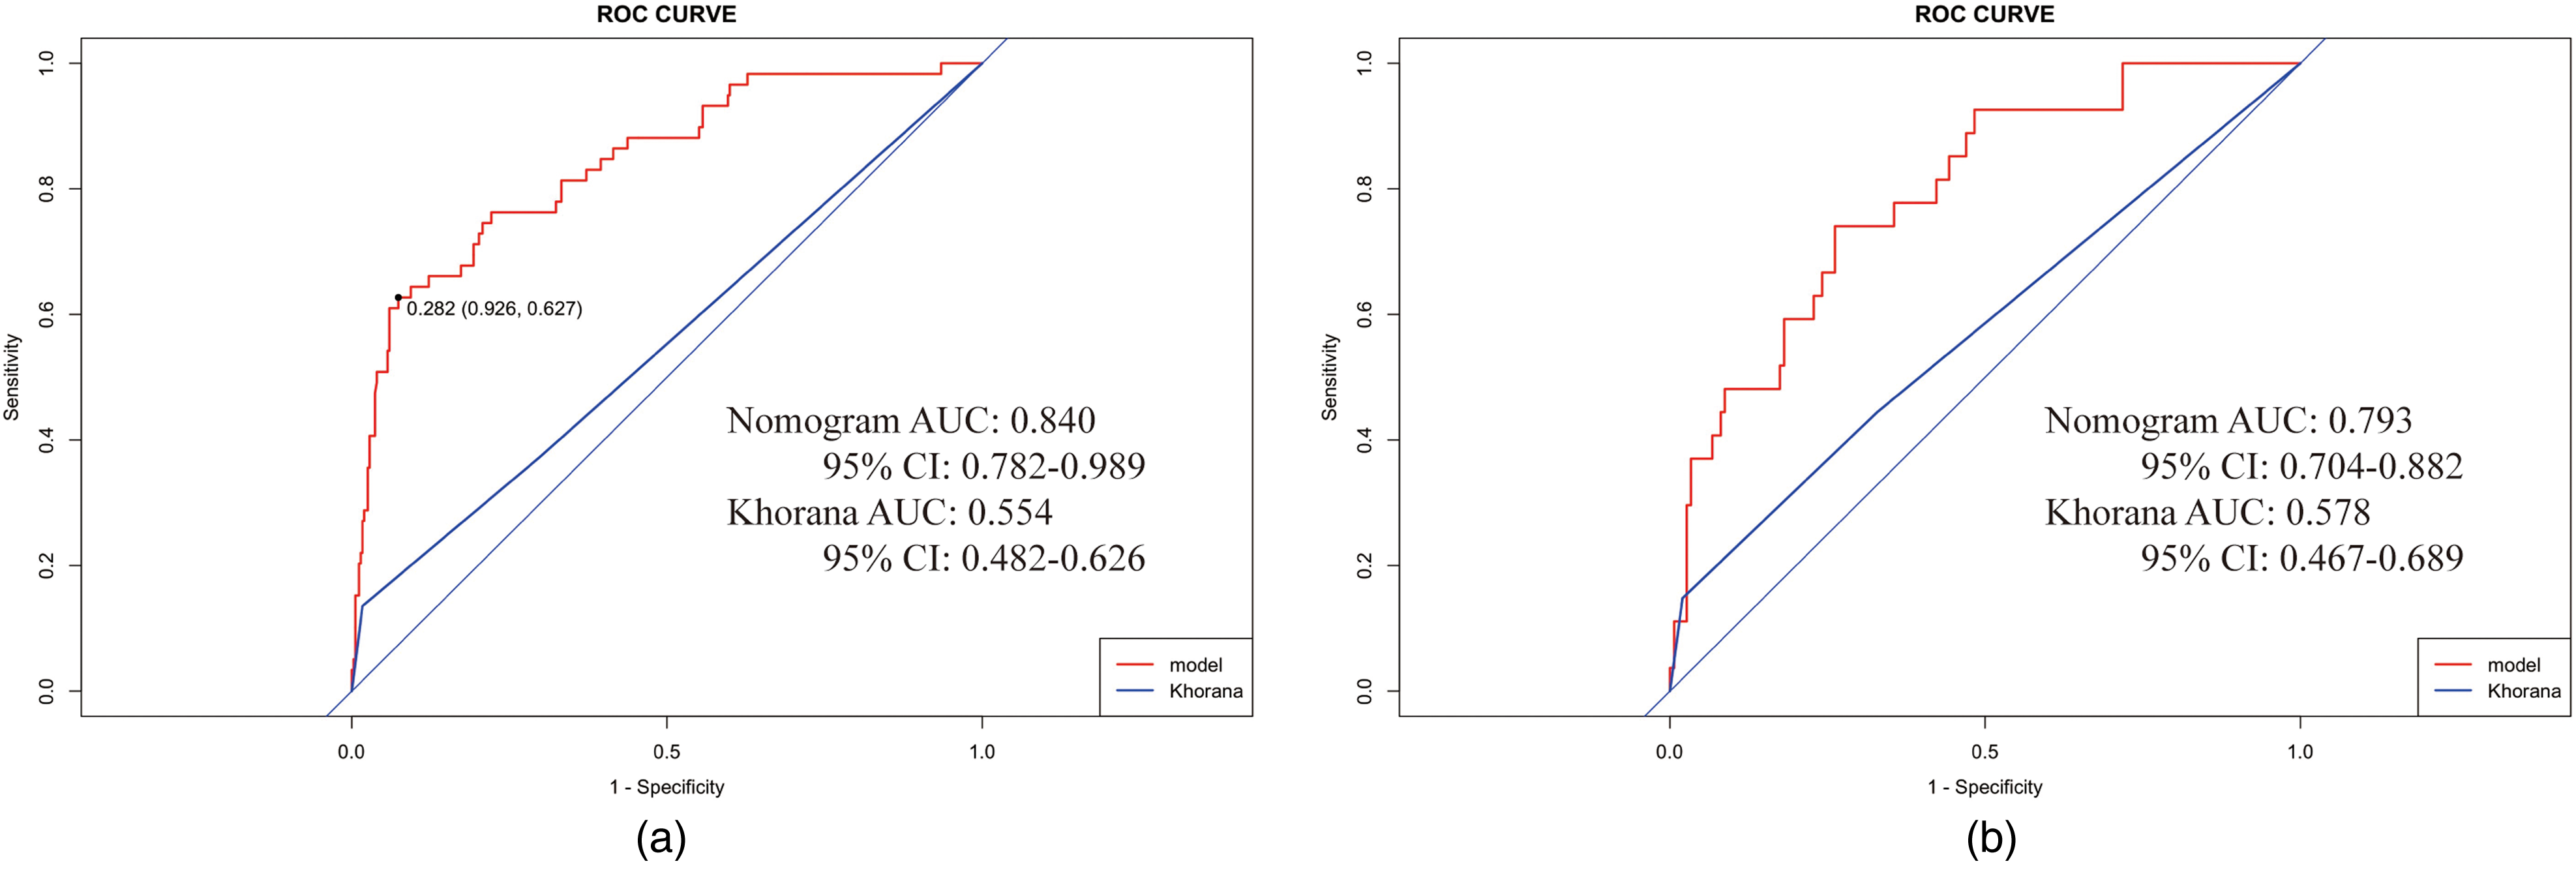
ROC curves of the nomogram and Khorana scores in the train (a) and validation (b) groups. ROC: receiver operating characteristic; AUC: area under the curve; red line: nomogram; and blue line: Khorana score.
Next, the consistency between the probabilities calculated by the model and the actual observed probabilities is assessed. The Hosmer–Lemeshow χ2 statistics of 12.27 (P = 0.14) for the training set and 15.15 (P = 0.06) for the validation set indicated good fitting of the predicted and true curves. The calibration curves illustrated in Figure 4A and B display how well the actual probabilities match the predicted probabilities within the training and validation sets, respectively. The X-axis represents the predicted event rates, while the Y-axis shows the actual observed event rates. The ideal scenario, where predictions perfectly match observations, is depicted by the gray diagonal line. The solid line in the graph represents the consistency between the actual and predicted probabilities within this specific dataset. The dashed line represents the consistency between the actual occurrence probability and the predicted probability using bootstrapping resampling (1000 times). Figure 4 demonstrates that both curves lie close to the diagonal line, indicating that the model is calibrated well.
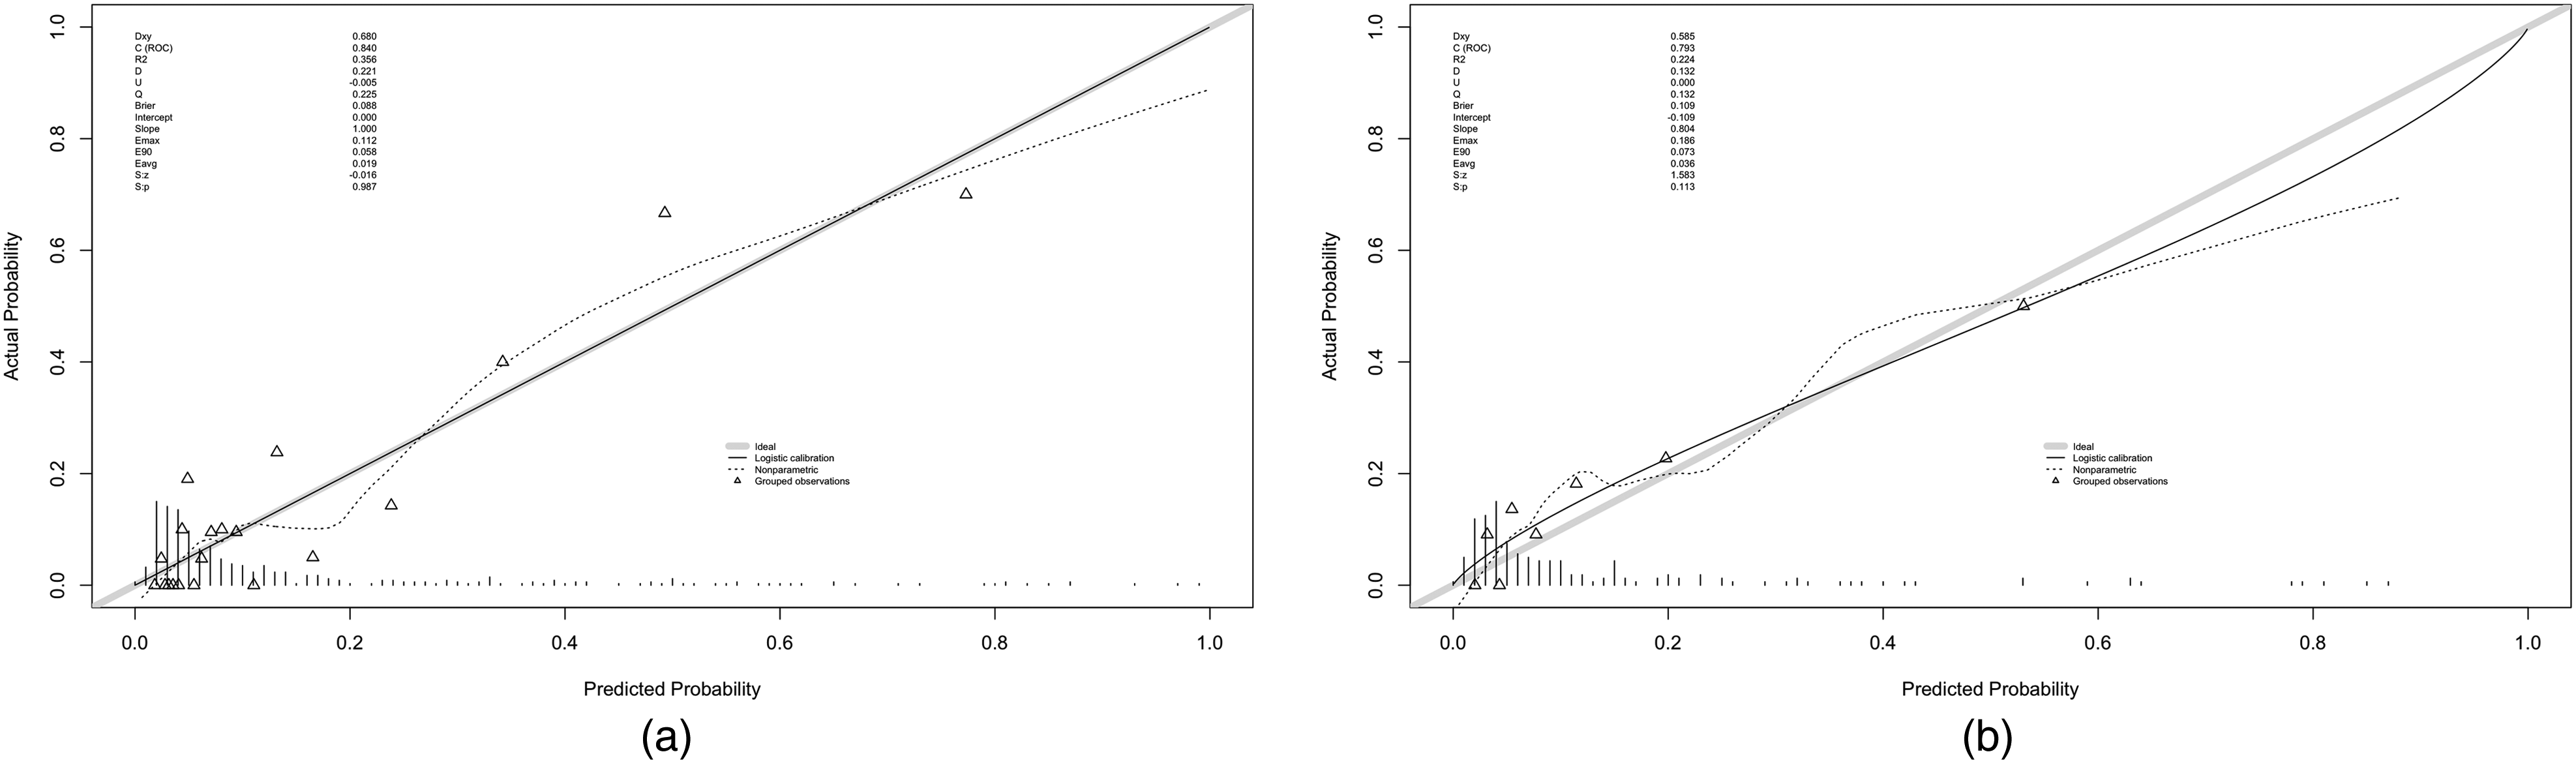
Calibration plots of the nomogram in the train (a) and validation (b) groups. X-axis: predicted event rates; Y-axis: actual observed event rates; gray diagonal line: ideal scenario; solid line: consistency between the actual and predicted probabilities within this specific dataset; and dashed line: consistency between the actual occurrence and predicted probability using bootstrapping resampling (1000 times).
The DCA demonstrated higher net benefits in the threshold probability range of 0%–70% for both the training and validation sets (Figure 5A and B). The horizontal axis of the graph represents probability thresholds, while the vertical axis denotes net benefit. Treatment is administered to patients when the model's predicted probability exceeds the threshold probability, which is the minimal probability at which intervention is deemed beneficial. The net benefit to the patient is calculated as the advantages of treatment minus its disadvantages. The black baseline represented by the horizontal line labeled ‘None’ corresponds to a net benefit of zero, indicating that no treatment is administered to any patient. The gray diagonal line labeled ‘All’ illustrates the net benefit when all patients are treated. The DCA indicated the net benefit derived from treating patients based on the model's predictions. When the threshold probability was less than 70%, utilizing this nomogram to predict the VTE risk and make subsequent treatment decisions yielded a net benefit to the patients.
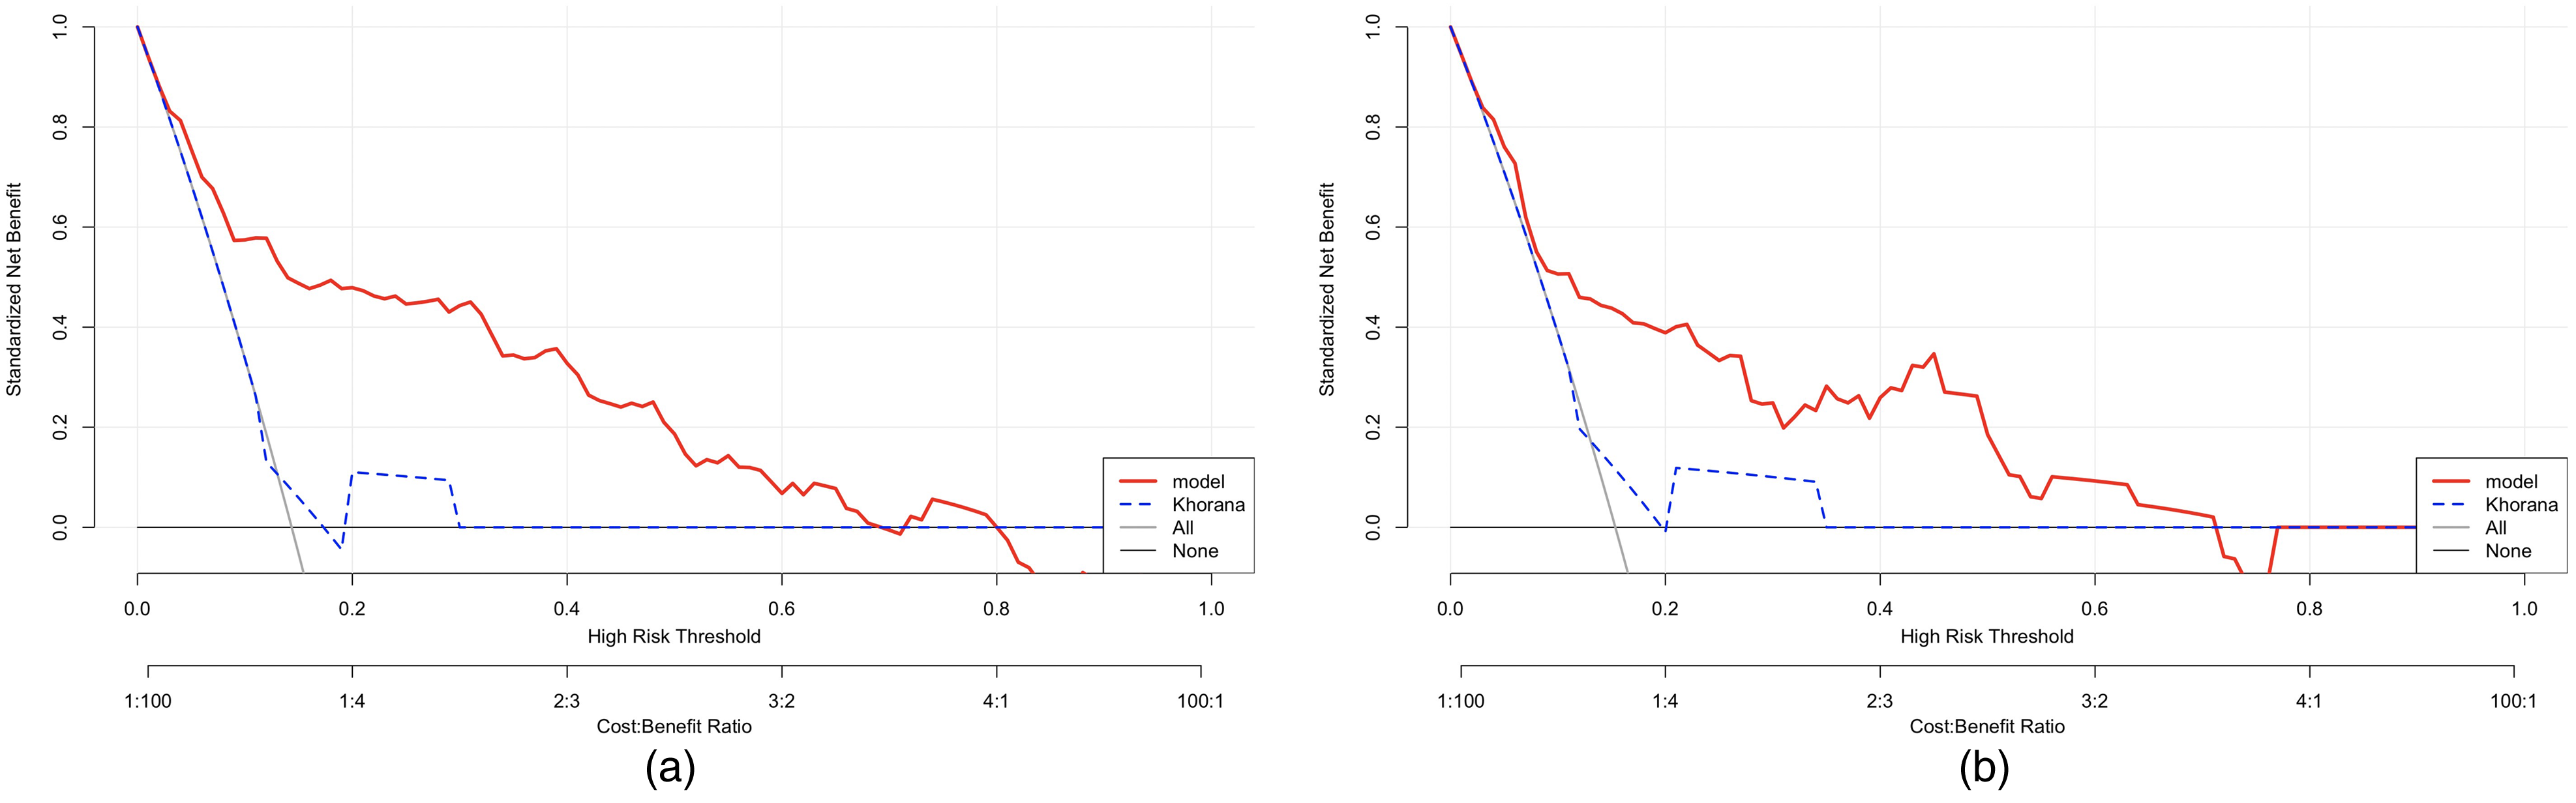
Decision curve analysis (DCA) for assessment of the clinical utility for thromboprophylaxis in the train (a) and validation (b) groups. Horizontal axis: probability thresholds; vertical axis: net benefit; black baseline represented by the horizontal line labeled ‘None’ that corresponds to a net benefit of zero; gray diagonal line labeled ‘All’ illustrates the net benefit when all patients are treated; and DCA: net benefit derived from treating patients based on the model's predictions.
Additionally, we compared our model with the Khorana score (Figure 3), revealing the superior predictive capability of the nomogram model over the Khorana model. In the training group, the AUC of the Khorana model was 0.554 (95% CI: 0.482–0.626, sensitivity 0.983, specificity 0.136), whereas that of the nomogram model was 0.840 (95% CI: 0.782–0.989, sensitivity 0.926, specificity 0.627). In the validation group, the AUC of the Khorana model was 0.578 (95% CI: 0.467–0.689, sensitivity 0.980, specificity 0.148), while that of the nomogram model was 0.793 (95% CI: 0.704–0.882, sensitivity 0.738, specificity 0.741). The DCA also revealed that the nomogram model's curve deviated more significantly from the horizontal black and gray lines compared to the Khorana model's curve, suggesting a greater clinical net benefit for the nomogram (Figure 5).
Discussion
Ovarian cancer is the most lethal among the female reproductive system tumors. 21 Among all types of ovarian cancer, HGSOC is the most common histological subtype, accounting for over 70% of ovarian cancer cases. 22 Once diagnosed, over 75% of HGSOC patients experience widespread metastasis and ascites. 23 Currently, surgery remains as the primary treatment for HGSOC.24,25 However, the occurrence of VTE post-surgery has garnered significant attention. Due to the highly invasive nature of HGSOC and the impact of preoperative neoadjuvant chemotherapy, HGSOC patients face an elevated risk of postoperative VTE.26,27
Multiple predictive models have been developed to assess the risk of VTE in patients with malignant tumors. The Khorana model has been extensively validated and employed in clinical settings, and the Vienna model has been reported as applicable for predicting VTE risk across various malignancies.28,29 However, these models incorporate the location of the malignancy as one of the risk factors, despite the fact that the VTE risk varies considerably across different tumor sites, and the underlying mechanisms differ significantly. The use of such predictive models may obscure the predictive influence of certain risk factors on specific tumors. 18 Consequently, developing different predictive models based on stratified tumor locations may enhance the ability to predict the postoperative VTE risk. Literature on predictive models for postoperative VTE risk specific to colorectal, lung, and breast cancer already exists.18,30 There is a paucity of reports on accurate predictive models for the individual postoperative VTE risk in patients with HGSOC. 31 Therefore, establishing a reliable risk assessment model is crucial in aiding clinicians in timely postoperative preventive measures, significantly impacting patient survival rates and quality of life.
The nomogram prediction model is a common statistical tool that visually illustrates the impact of multiple factors on a specific outcome, enabling personalized and accurate predictions of event probabilities.32,33 Several studies have indicated the utility of nomogram models for assessing the VTE risk.19,32–34 Through an extensive analysis of clinical data, we successfully constructed a risk assessment model that comprehensively considers multiple risk factors for postoperative VTE in HGSOC patients. Initially, during model development, to enhance the model precision, we compiled as many risk factors as possible based on current research findings and clinical guidelines for VTE. We collected patients’ baseline data (ie, age, menopause status, BMI, and complications), clinical pathology data of the tumor (ie, stage, LVSI, lymphnode metastasis, tumor size, and neoadjuvant chemotherapy), treatment-related data (ie, operation time, surgical approach, blood loss, and blood transfusion), and postoperative hematological indicators (ie, neutrophils, lymphocytes, PLT, NLR, PLR, PT, APTT, TT, FBG, FDP, and D-dimer). In addition, considering the practicality of the model, all the risk factors we have collected are readily obtainable in clinical settings, facilitating its adoption in routine clinical practice. We randomly divided the collected data from 587 patients into training and validation sets in a 7:3 ratio. Subsequently, using univariate and multivariate logistic regression, we identified age, tumor size, postoperative transfusion, and postoperative D-dimer levels as independent factors influencing the occurrence of postoperative VTE in HGSOC patients. Although these four indicators have been widely reported to correlate with the occurrence of VTE, their combined value is often overlooked, lacking models that integrate them. Therefore, we further successfully constructed a nomogram model incorporating these four factors.
In clinical, when the prognosis of a disease is poor, and misdiagnosis can lead to severe consequences, yet reliable treatments are available, it may be appropriate to lower the diagnostic threshold to enhance the sensitivity of diagnosis. Conversely, when the prognosis of a disease is relatively favorable, but existing therapeutic approaches are costly and associated with side effects, it may be appropriate to raise the diagnostic threshold to increase specificity. In this study, while prophylactic anticoagulation can effectively reduce the risk of VTE, it also increases the risk of postoperative hemorrhage. 35 Both VTE and bleeding are serious postoperative complications; thus, both sensitivity and specificity are equally important. We have chosen the maximum value of the Youden Index as the optimal threshold to categorize patients into high- and low-VTE risk groups. Through this model, clinicians can identify HGSOC patients with a VTE high risk, thereby aiding in the decision-making process regarding the need for more aggressive prophylactic anticoagulation measures. These measures may include encouraging early ambulation, employing physical preventative measures like thromboembolic deterrent stockings and pneumatic compression therapy, and using anticoagulant medications like low molecular weight heparin. High-risk patients should undergo lower extremity venous ultrasound screening after surgery, thereby allowing timely interventions to prevent more severe consequences (eg, pulmonary embolism from a dislodged deep vein thrombosis).
Patient age is a significant factor in our model. Age is widely recognized as a risk factor for VTE, with studies indicating its association with VTE occurrence in various cancers, such as breast cancer, lung cancer, and gliomas.19,36–38 Older patients are more prone to circulatory system issues, increasing the VTE risk. 39 In our model, we observed a clear correlation between age and VTE, emphasizing the necessity for individualized treatment decisions, especially for older patients.
Another important influencing factor is tumor size. Tumor burden is explicitly correlated with inflammation and coagulation status in the patient's body. 40 Additionally, excessively large tumors may compress the pelvic vascular system, affecting venous return in the pelvis and lower extremities and potentially influencing VTE occurrence. 41 Previous research results also indicated that large tumor volume is a risk factor for postoperative VTE. 42 Our findings demonstrate a positive correlation between intraoperative tumor size and VTE occurrence, providing reference for risk management during tumor treatment.
Our results indicate that postoperative blood transfusion may increase the risk of postoperative VTE in HGSOC patients. This aligns with the consistent findings of previous studies, where perioperative blood transfusion is identified as a risk factor for postoperative VTE.43,44 Blood transfusion may introduce additional physiological and immune reactions, potentially promoting a hypercoagulable state and increasing the risk of VTE.45,46 Our model incorporates this factor, offering a more comprehensive assessment of patient VTE risk. Future research can further explore the specific mechanisms through which transfusion affects VTE occurrence, providing scientifically sound guidance for clinical blood use.
Lastly, we focused on postoperative D-dimer levels. D-dimer is a plasma fibrin degradation product, and its elevated levels are usually associated with activation of intravascular fibrinolysis. 47 Several studies suggested that monitoring D-dimer levels can predict the VTE risk and its recurrence.48,49 Including this factor in our model enhanced sensitivity to postoperative VTE risk in patients.
However, our study has some limitations. First, the data for this study are sourced from a specific medical institution; hence, selection bias may be present, potentially impacting the results. Given the absence of external validation, it remains unclear whether or not our results are applicable to other populations. Therefore, the practicality of the model needs further evaluation in real clinical settings to obtain high-level clinical evidence. Furthermore, the variation in VTE occurrence risk among different ethnicities may limit the generalizability of our study findings to other racial groups. Additionally, due to the constraints of retrospective studies, we were unable to incorporate all data relevant to HGSOC. We anticipate that with advancements in ovarian cancer treatment and genetics, more genetic markers and detailed treatment regimens will be identified and utilized.
Conclusions
In summary, our model incorporating age, post-operative D-dimer, tumor size, and postoperative blood transfusion constructs a risk assessment model for postoperative VTE in HGSOC with good accuracy and interpretability. However, further validation and refinement are required for future work to facilitate the model's application in clinical practice. This effort will robustly support personalized treatment plans for HGSOC patients, minimizing the risk of postoperative VTE.
CRediT Authorship Contribution Statement
HZ contributed to the study design, statistical analyses, and manuscript writing. LL and GZX performed data collection. HZ and LL analyzed and interpreted the data. TLD designed and supervised the research and revised the manuscript. All authors read and approved the final manuscript. All authors contributed to the article and approved the submitted version.
Supplemental Material
sj-docx-1-cat-10.1177_10760296241255958 - Supplemental material for Construction and Validation of a Nomogram to Predict the Postoperative Venous Thromboembolism Risk in Patients with HGSOC
Supplemental material, sj-docx-1-cat-10.1177_10760296241255958 for Construction and Validation of a Nomogram to Predict the Postoperative Venous Thromboembolism Risk in Patients with HGSOC by Zhen Huang, Ling Li, Zhengxin Gong and Liangdan Tang in Clinical and Applied Thrombosis/Hemostasis
Supplemental Material
sj-docx-2-cat-10.1177_10760296241255958 - Supplemental material for Construction and Validation of a Nomogram to Predict the Postoperative Venous Thromboembolism Risk in Patients with HGSOC
Supplemental material, sj-docx-2-cat-10.1177_10760296241255958 for Construction and Validation of a Nomogram to Predict the Postoperative Venous Thromboembolism Risk in Patients with HGSOC by Zhen Huang, Ling Li, Zhengxin Gong and Liangdan Tang in Clinical and Applied Thrombosis/Hemostasis
Supplemental Material
sj-docx-3-cat-10.1177_10760296241255958 - Supplemental material for Construction and Validation of a Nomogram to Predict the Postoperative Venous Thromboembolism Risk in Patients with HGSOC
Supplemental material, sj-docx-3-cat-10.1177_10760296241255958 for Construction and Validation of a Nomogram to Predict the Postoperative Venous Thromboembolism Risk in Patients with HGSOC by Zhen Huang, Ling Li, Zhengxin Gong and Liangdan Tang in Clinical and Applied Thrombosis/Hemostasis
Footnotes
Declaration of Conflicting Interests
The authors declared no potential conflicts of interest with respect to the research, authorship, and/or publication of this article.
Funding
This research was funded by Chongqing Natural Science Foundation Joint Fund for Innovation and Development Project (grant number CBST2023NSCQ-LZX0040) and Natural Science Foundation of Chongqing, General Program (grant number cstc2020jcyj-msxmX0475).
Availability of Data
The clinical datasets generated and analyzed during the current study are available from the corresponding authors upon reasonable request.
Supplemental Material
Supplemental material for this article is available online.
References
Supplementary Material
Please find the following supplemental material available below.
For Open Access articles published under a Creative Commons License, all supplemental material carries the same license as the article it is associated with.
For non-Open Access articles published, all supplemental material carries a non-exclusive license, and permission requests for re-use of supplemental material or any part of supplemental material shall be sent directly to the copyright owner as specified in the copyright notice associated with the article.