
Abstract
Keywords
Introduction
Pulmonary embolism (PE) with high mortality is an important topic in emergency medicine.1,2 Pregnant and postpartum women are in physiological hypercoagulable state, at a high-risk of PE. 3 PE is one of the main causes of pregnancy and maternal death. 4 Accurate diagnosis and proper treatment of PE can bring significant benefits to pregnant women and parturients with low risk of adverse consequences. 5 Therefore, it has become an important medical topic to improve the diagnostic rate of PE, select the most appropriate treatment scheme for patients in time and reduce mortality.
A previous history or family history of PE, immobilisation, surgery and a number of medical and obstetric complications are known to be associated with an increased risk of PE. 6 Abnormal observations, such as a rapid heart rate, rapid respiratory rate, or reduced peripheral oxygen saturation, may be caused by PE, 7 although these may be caused by other pathologies or a normal physiological response to pregnancy. Individual clinical features are unlikely to have sufficient accuracy for diagnosing PE, but could be combined to form a clinical decision rule. 8 This uses a number of clinical features in a structured manner to generate an estimate of the clinical risk of PE or a rule to determine whether or not PE. 9 In the general (nonpregnant) population with suspected PE, Wells's score and revised Geneva score have been developed to estimate the risk of developing PE. 10 These scores have been extensively validated in the general population with a suspected PE, but the differences between the pregnant and nonpregnant populations mean that findings cannot be automatically extrapolated to the pregnant or postpartum population. 11 Cahill et al 12 indicated that low oxygen saturation and chest pain were associated with PE. Deutsch et al 13 also indicated that chest pain association with PE. Bourjeily et al 14 found no association between pleuritic chest pain, dyspnoea, chest pain, haemoptysis, cough, heart rate, systolic blood pressure or respiratory rate, and PE. Two studies 15 have suggested that the modified Wells's score may be useful in pregnant or postpartum women. O’Connor et al 16 reported that a modified Wells's score of ≥6 units (meaning that PE is likely) has an excellent sensitivity and specificity for PE, whereas Cutts et al 15 reported a good sensitivity and a normal specificity for PE.
In summary, due to differences in models, it remains unclear which model should be routinely used to identify at-risk pregnant or postpartum women for PE. Therefore, constructing a numerical model 17 to predict PE may be a solution to the issue. This method will strengthen the effectiveness and objectivity of risk assessment. Thus, this study seeks to develop and validate a numerical model for predicting PE of pregnant and postpartum women.
Materials and Methods
Study Population
Totally 343 subjects suspected of PE at the Obstetrics Department of Affiliated Dongyang Hospital of Wenzhou Medical University from January 2012 to December 2021 were considered in our study. Pregnant women suspected of PE and who underwent computed tomographic pulmonary angiography (CTPA) examination were included in the study. After baseline data clearing and extraction, the medical records were included in statistical analysis. The medical records of subjects were retrospectively collected from our clinical research data platform.
Ethical approval of our retrospective study was obtained by the Medical Ethics Committee of Affiliated Dongyang Hospital of Wenzhou Medical University (No: 2022-YX-069), and the informed consent requirement was waived. Patient records/information were anonymized and deidentified previous to analysis. Our research was conducted on the basis of the Declaration of Helsinki.
Study Outcomes and Data Collection
The diagnostic criteria of PE refer to the guidelines of the European Heart Association. 18 The patients who have undergone CTPA examination are suspected of PE. Determine whether PE has occurred based on the diagnostic conclusion of the radiologist. PE was confirmed by a filling defect of the pulmonary artery system (including subsegment PE) found in CTPA. The past medical history, complications, individual clinical features, and clinic biomarkers data were collected. Our research flow chart is shown in Figure 1.

Flowchart of the processing step for predicting PE. PE, pulmonary embolism.
Statistical Analysis
Statistical analysis was performed with R Studio software for Windows. Continuous variables were expressed as mean ± standard deviation (SD) or medians and interquartile range, compared using the Student's test or the Mann–Whitney U test. Categorical variables as frequency with percentage, were compared using χ² test or Fisher's exact test. All subjects contained 58 variables. To guarantee the reliability of the data, among them 13 indicators with missing values greater than 20% were deleted. Multiple imputation techniques 19 were used to impute the remaining missing values. The least absolute shrinkage and selection operator (LASSO) regression model 20 was performed to solve the collinearity of candidate variables and select the best prediction variable. The statistical variables were presented as odds ratio (OR) and 95% confidence interval (CI). A two-tailed P value less than .05 was considered statistically significant.
Model Development, Validation, and Evaluation
The model for predicting PE was established through the use of multivariable logistic regression analysis, which combined selected predictors from the LASSO analysis. Bootstrap resampling 1000 times 21 was used to verify the model, which was visualized by nomogram. The performance of the model was evaluated in terms of discrimination, calibration, and clinical utility, 22 discrimination was measured using the area under the receiver operating characteristic (ROC) curve (AUC), while the calibration curve analysis was used to assess the consistency between the model's predictions and actual PE occurrences. The clinical utility of the model was determined through decision curve analysis (DCA), which quantified the net benefits at different threshold probabilities.
Results
Characteristics of the Study Population
After eliminating 13 variables with a missing information rate of over 20%, we involved 45 variables with missing data less than 20% in this study (shown in “Supplemental Figure 1”). This study analyzed 343 subjects suspected of PE. Forty-five variables with a range of missing values from 0.00% to 16.62%, and multiple imputation techniques were used to impute the missing data. The results showed that 14.28% of the subjects had PE. Table 1 presents the baseline characteristics of pregnant and postpartum women suspected of PE.
Baseline Characteristics of Subjects.
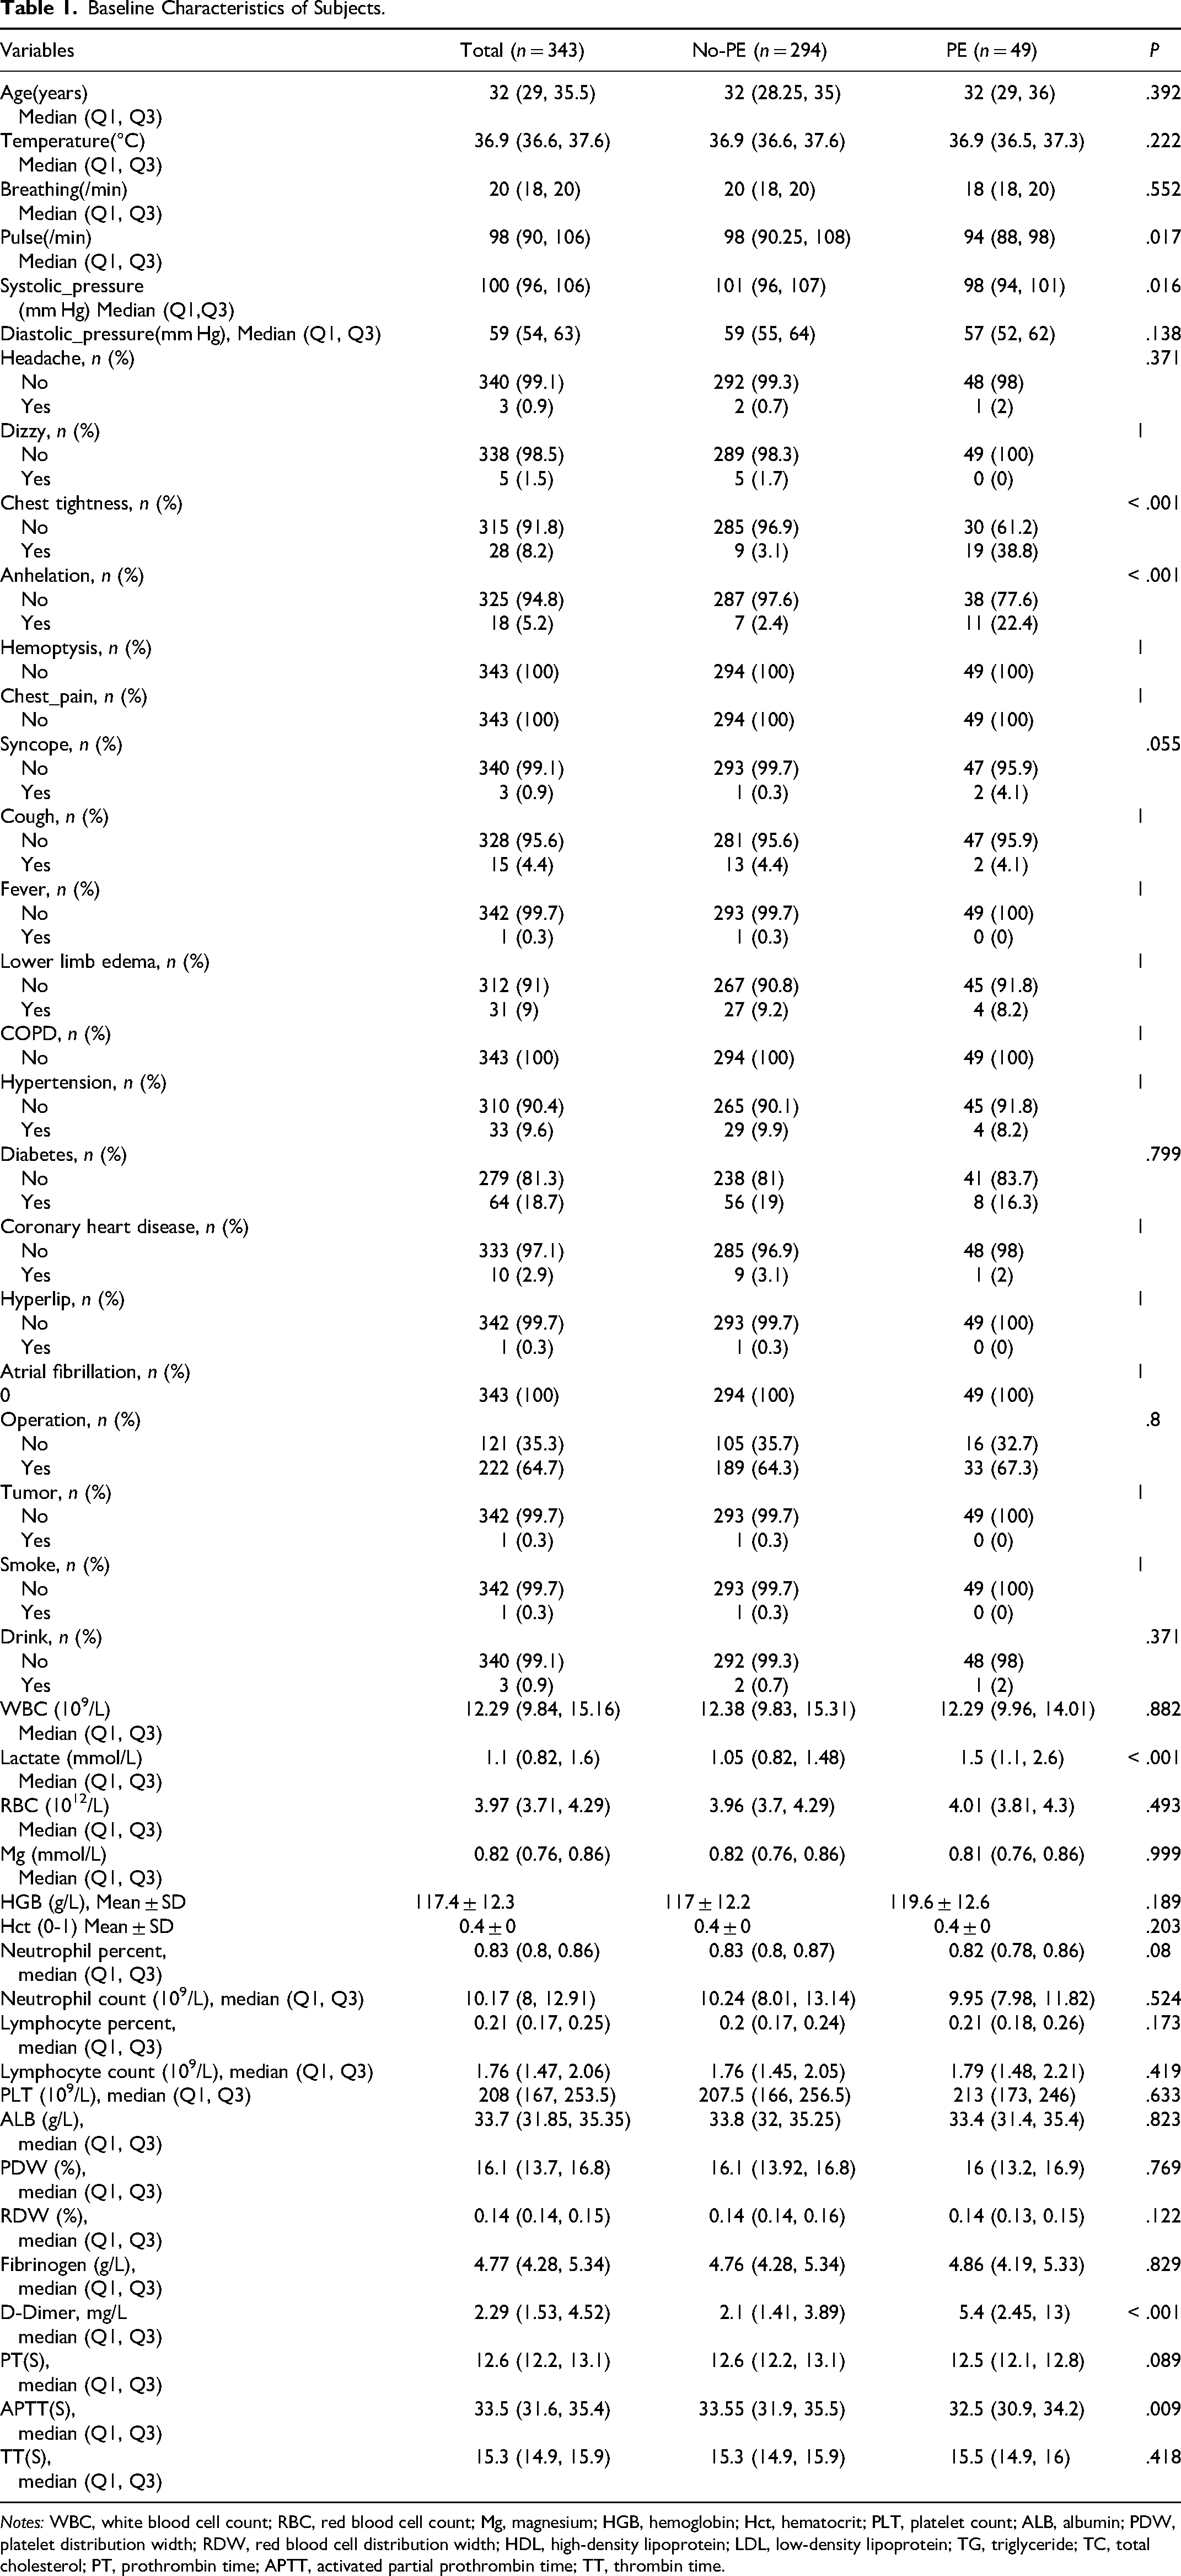
Notes: WBC, white blood cell count; RBC, red blood cell count; Mg, magnesium; HGB, hemoglobin; Hct, hematocrit; PLT, platelet count; ALB, albumin; PDW, platelet distribution width; RDW, red blood cell distribution width; HDL, high-density lipoprotein; LDL, low-density lipoprotein; TG, triglyceride; TC, total cholesterol; PT, prothrombin time; APTT, activated partial prothrombin time; TT, thrombin time.
Selected Predictors
After a thorough analysis, four key predictors were identified from 45 variables using the LASSO regression method (as shown in Figures 2A and 2B). The optimal predictors incorporated chest tightness, anhelation, lactate, and D-dimer. Multivariable logistic regression analysis was performed using the four predictors that were selected from the LASSO regression analysis to create the final model. The results are presented in Table 2.
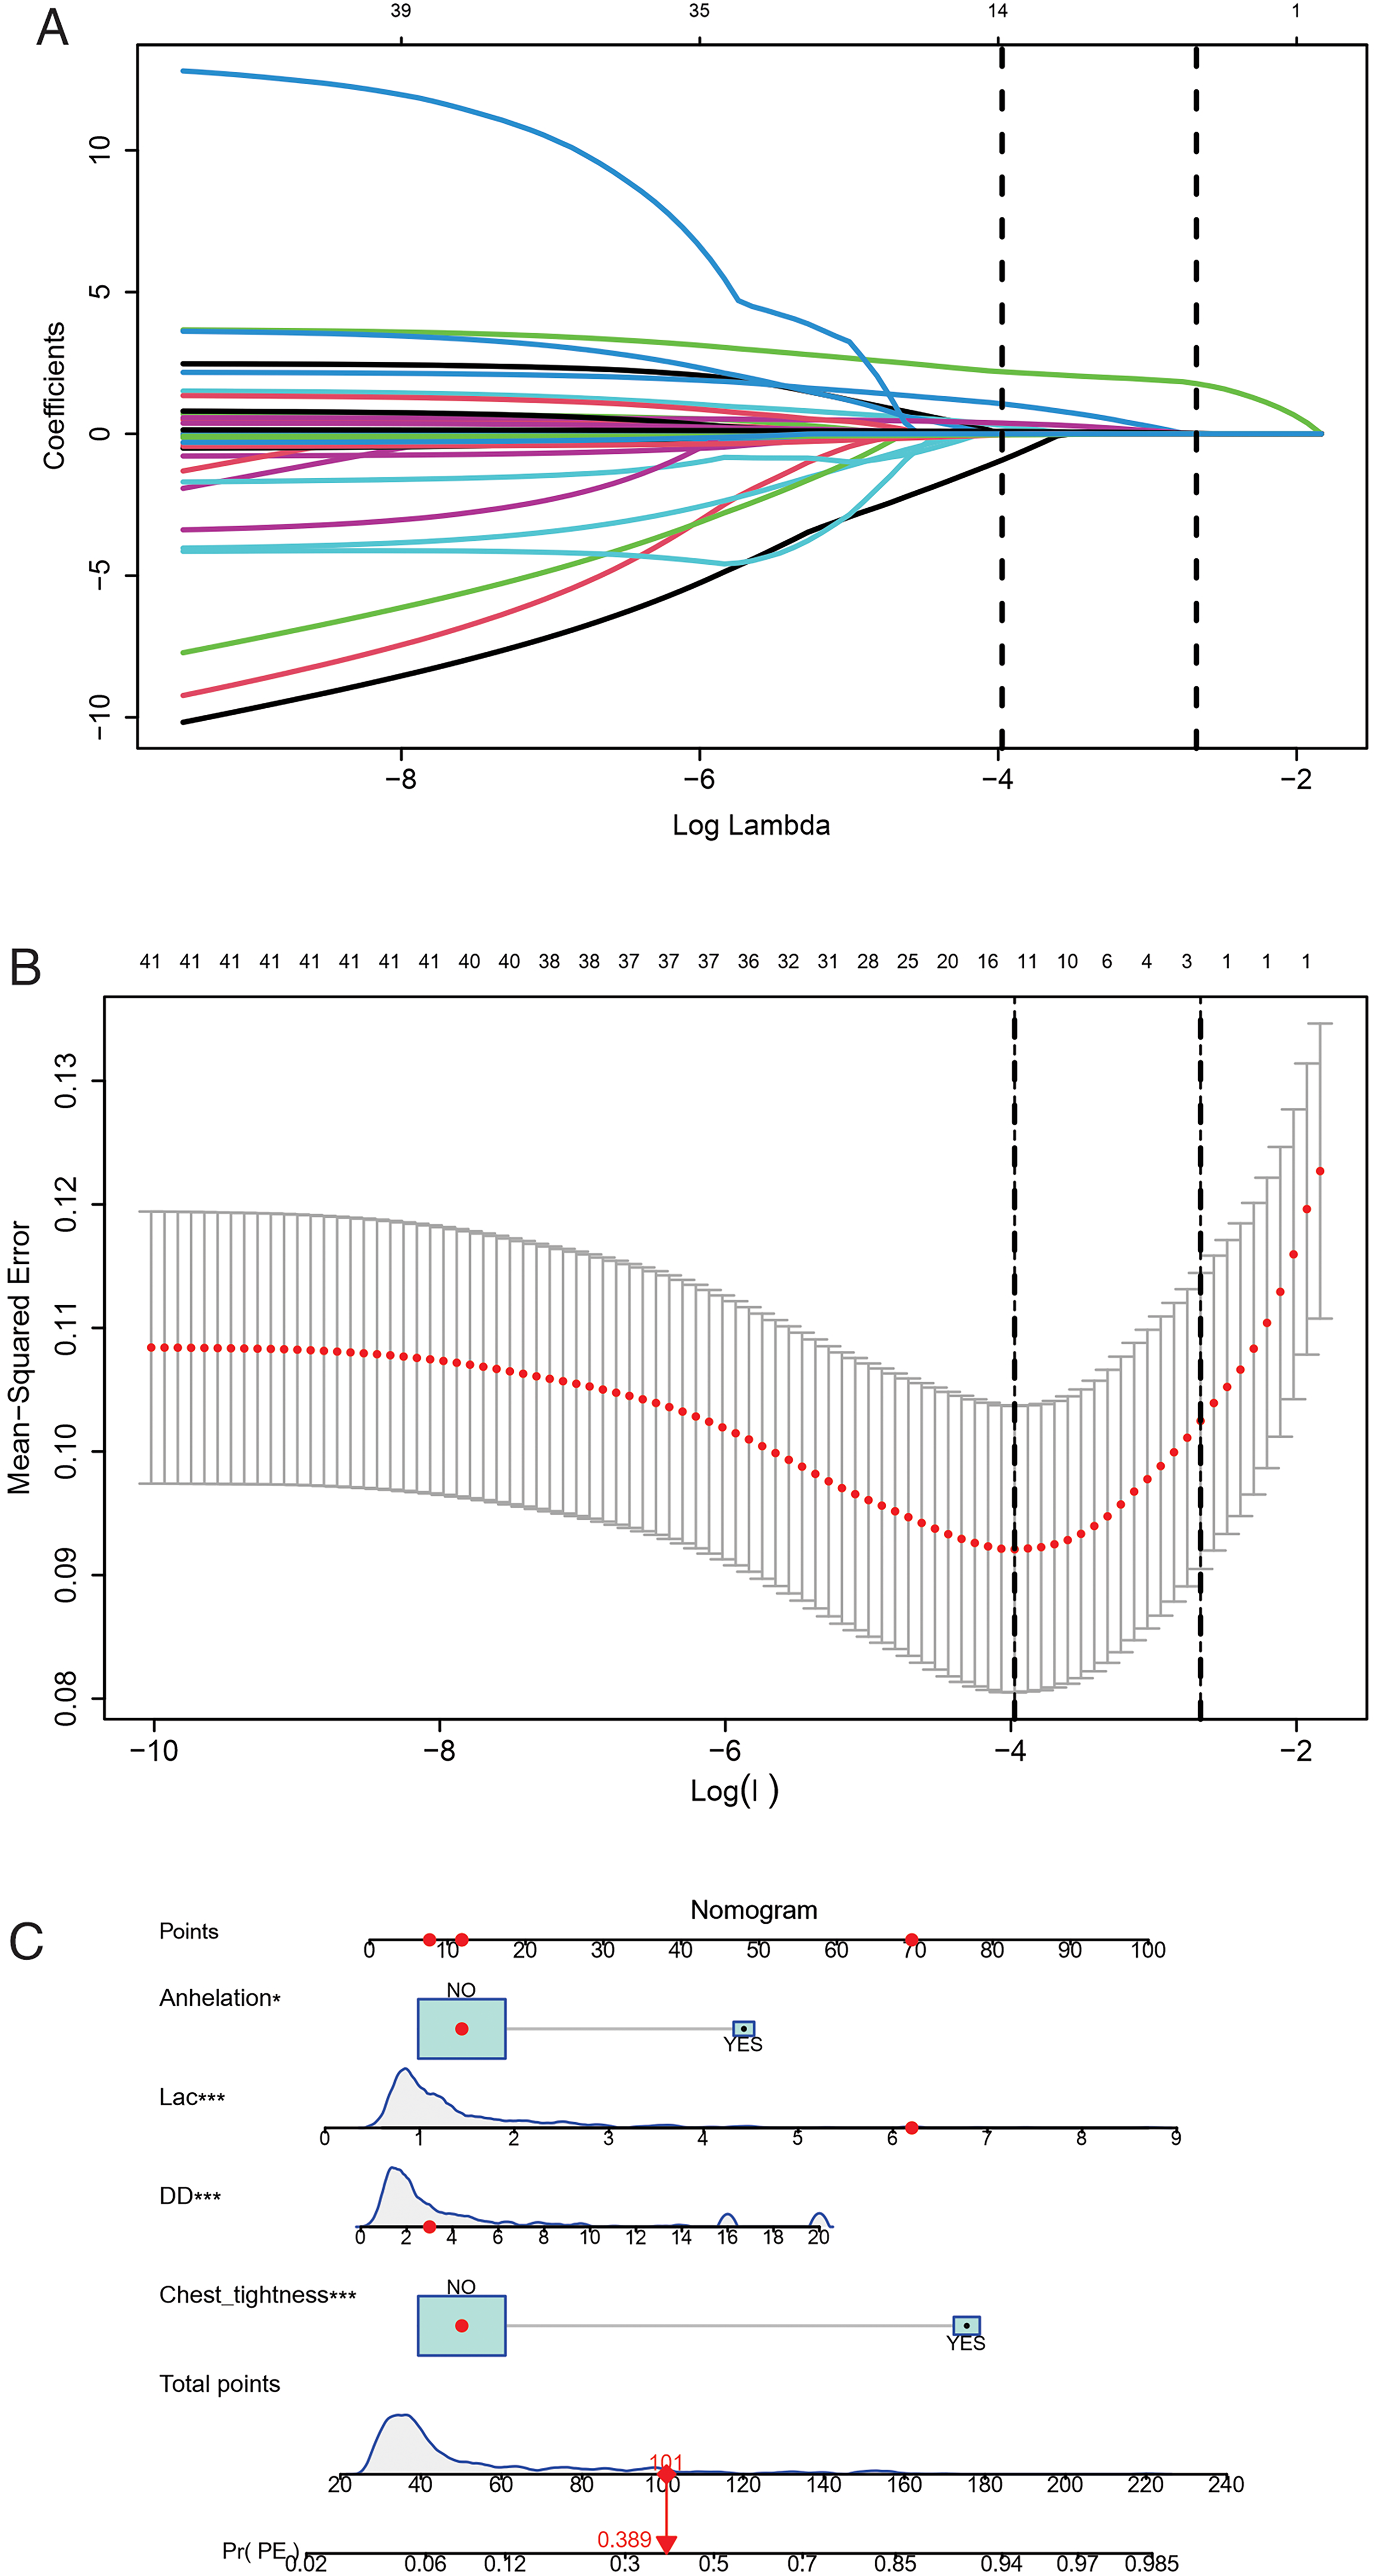
Model establishment and presentation. (A) LASSO coefficient profiles of the clinical features. (B) The optimal penalization coefficient lambda was generated in the LASSO via 10-fold cross-validation. The lambda value of the 1 fold mean square error for the training cohort was given; (C) nomogram based on the combination of four indicators was developed using logistic regression analysis. If a patient with a total score is 101, and then the probability of the PE is 0.389 (red numbers). (DD, D-Dimer; Lac, lactate). LASSO, least absolute shrinkage and selection operator.
Final Model Coefficients.

Construction and Validation of the Model
The predicting model for PE was visualized by nomogram, which was shown in Figure 2C. The ability of the model to distinguish between positive and negative cases, as measured by the AUC, was 0.836 (95% CI [0.770-0.902]), indicating the predictive model can better distinguish PE from non-PE (Figure 3A). The calibration plot (Figure 3B) demonstrates good consistency between PE discriminated by the model and the actual occurrence of PE. The clinical usefulness of the predicting model was evaluated using DCA to determine the net benefit based on threshold probabilities. Results showed that the predicting model had a higher net benefit when predicting PE in pregnant and postpartum women, are presented in Figure 3C.

Model evaluation and validation (A) receiver operating characteristic curve of the model distinguishing PE from non-PE; (B) calibration curve of the model; (C) decision curve of the model. If the risk threshold is less than 50%, the predicting model will obtain more benefit than all treatments (assuming all pregnant and postpartum women were PE) or no treatment (assuming all pregnant and postpartum women were non-PE); (D) comparison of model discrimination ability. (DD, D-Dimer; Lac, lactate).
Comparison of Model Discrimination Ability
The performance of the predicting model was superior to that of D-Dimer, as evidenced by a higher AUC of 0.836 (95% CI [0.770-0.902]) compared to 0.732 (95% CI [0.659-0.806]) for D-Dimer, and higher than that of lactate (0.685, 95% CI [0.600-0.770]). Comparison of the model discrimination ability showed that the nomogram model exhibited good accuracy in clinical outcome prediction when compared with D-Dimer and lactate (Figure 3D).
Discussion
In this research, we constructed and verified a predicting model to identify the probability of PE using a 10-year retrospective analysis in a comprehensive hospital in China. Our novel numerical model incorporated four parameters including chest tightness, anhelation, lactate, and D-dimer. All parameters are readily available clinical features and biomarkers in routine health examinations. Notably, ROC analysis indicated that our model AUC was 0.836 (95% CI [0.770-0.902]) and displayed good discrimination and calibration. The results of the DCA and clinical impact curve indicated that the majority of the threshold probabilities in the model demonstrated favorable net benefits.
Our research discovered that an increase in the incidence of PE was associated with elevated levels of D-dimer (OR 1.12; 95% CI [1.06-1.19]). This result is in accordance with earlier observations,23,24 which showed that high D-dimer level attributable to the possibility of developing PE. In terms of biomarkers, D-dimer is the only biomarker currently used in routine practice to predict PE, but it is unlikely to have adequate specificity in pregnancy at conventional thresholds for positivity. Our model indicated that lactate (OR 1.60; 95% CI [1.24-2.06]) was clinically relevant to the occurrence of PE. Consistent with our result, previous studies 25 have shown elevated lactate was a good predictor for the prognosis of PE. This outcome may be attributed to the correlation between elevated lactate levels and increased formation of prothrombotic fibrin clots and neutrophil extracellular traps in acute PE. 26 Moreover, previous researches have noted that venous lactate improves the prediction of in-hospital adverse outcomes in normotensive PE. 27 Our data also revealed that two clinical symptoms including chest tightness and anhelation, were incorporated into the model to predict PE. Consistent with our result, previous study 28 has shown chest tightness and anhelation were good predictors in model for prognosis of PE. Previous research has demonstrated that having multiple pregnancies and a high body mass index (BMI) are both independent risk factors for developing PE. Other studies 29 have indicated that women who are over the age of 35 years, have a previous history of VTE, preeclampsia, antenatal bleeding, or postnatal bleeding, have a higher probability of developing PE compared to those without these characteristics. A study in postpartum women 30 showed that smoking, varicose veins, comorbidities, preeclampsia, eclampsia, diabetes mellitus, parity, postpartum haemorrhage, caesarean section, stillbirth, postpartum infection, maternal age, BMI, and infant birthweight were predictors of VTE included in a clinical prediction model. Our prediction model does not include those indicators that have been shown to be associated with a higher likelihood of PE in previous studies. There are three potential reasons for this discrepancy: (1) these indicators were not present in our research data platform; (2) indicators with a missing value rate greater than 20% were removed; (3) after analysis, these indicators were not included in the model.
This retrospective study suggested that a nomogram developed with clinical features and biomarkers to generate personalized evaluations of PE in pregnant and postpartum women may distinguish targets at high risk of PE. For example, if a pregnant and postpartum woman without tightness and anhelation, had a lactate level of 6.2 mmol/L, and had a D-dimer level of 3.0 mmol/L, her total score is 101 points, this individual has an estimated 38.9% chance of developing PE. By utilizing this numerical model, healthcare providers can determine if a pregnant or postpartum woman is likely or unlikely to have PE, reducing the need for unnecessary CTPA tests. This model may be helpful for us to identify high-risk patients early, evaluate thrombosis, and implement active and individualized anticoagulation therapy.
This study is subject to certain limitations. In this retrospective study, indicators with missing values exceeding 20% were excluded from the analysis. Moreover, the additional disadvantage of this study was the limited sample of participants and limited by the lack of information on sufficient variables. Additionally, the data were collected as a single-center retrospective study.
In conclusion, we developed a novel numerical model for selecting risk factors for PE in pregnant and postpartum women. Our results may help obstetricians and gynaecologists to develop individualized treatment plans and PE prevention strategies. In the future, large-scale prospective multicenter cohort studies will help to form a better and updated clinical decision-making system.
Supplemental Material
sj-tiff-1-cat-10.1177_10760296231209930 - Supplemental material for Predictive Model for Pulmonary Embolism in Pregnant and Postpartum Women: A 10-Year Retrospective Study
Supplemental material, sj-tiff-1-cat-10.1177_10760296231209930 for Predictive Model for Pulmonary Embolism in Pregnant and Postpartum Women: A 10-Year Retrospective Study by Xu Lili, Du Shunlan and Jin Lixu in Clinical and Applied Thrombosis/Hemostasis
Footnotes
Author Contributions
All the authors contributed to this article and approved the submitted version of the article. X LL and J LX conceived and designed the research strategy. X LL wrote the manuscript text. X LL and D SL collected the clinical data and participated in the writing of the manuscript. J LX contributed to the analysis and interpretation of the data.
Declaration of Conflicting Interests
The author(s) declared no potential conflicts of interest with respect to the research, authorship, and/or publication of this article.
Funding
The author(s) disclosed receipt of the following financial support for the research, authorship, and/or publication of this article: This work was supported by the Wenzhou Science and Technology Foundation (grant number Y20210367).
Supplemental Material
Supplemental material for this article is available online.
References
Supplementary Material
Please find the following supplemental material available below.
For Open Access articles published under a Creative Commons License, all supplemental material carries the same license as the article it is associated with.
For non-Open Access articles published, all supplemental material carries a non-exclusive license, and permission requests for re-use of supplemental material or any part of supplemental material shall be sent directly to the copyright owner as specified in the copyright notice associated with the article.