
Abstract
Validation protocols for the evaluation of coagulometers are needed to help professionals select the most suitable system for their regular laboratory routines. The objective of this study was to show how high standard protocols for the coagulometer validation process can fit into the daily laboratory routine. For this study, 45 healthy individuals and 112 patient samples were analyzed. From the patient samples, 51 were investigated for deep venous thrombosis, 27 for coagulopathy, 19 for antivitamin K therapy, and 15 for hemophilia. For the assessment, the performance of the 3 coagulometers and 1 point-of-care device was considered. One of the coagulometers was a new acquisition evaluated for precision, linearity, throughput, and carryover in the first moment, and the new coagulometer was then compared with the other well-established equipment in the laboratory. In normal plasma, coefficient of variation was ≤1.8% for total precision in screening tests and ≤3.5% for within-run precision in specific assays. For prothrombin time/international normalized ratio, no significant difference was found when comparing methods. Our study showed how to compare the capacity of a reagent in order to discriminate patients with severe hemophilia from patients with moderated hemophilia, and the κ coefficient agreement was 0.669 (95% confidence interval: 0.3-1.0; P < .001).
Introduction
There is an increasing number of new automated coagulometer available. For this reason, a validation protocol for the combination of the equipment and reagents is critical to ensure the quality of laboratory processes. The manufacturer’s information regarding coagulometer characteristics is a guidance for the laboratory professional. 1 However, local validation protocols for the coagulometer are needed to help professionals select the most suitable system for their regular laboratory routine. This validation should be conducted with samples from both healthy individuals and patients in different clinical situations, using parallel methodologies and reference reagents. 1 –3 Some important points to consider are knowing how to select the coagulometer, how to plan and understand the steps of the validation, and how to adapt the requirements of the validation protocol for the routine assays in the laboratory. Validation processes are the only tool able to demonstrate whether the chosen coagulometer and reagents are adequate and reliable. 4,5 There is little practical information on how a hemostasis laboratory can evaluate a coagulometer during an initial purchase or in the need of a replacement. In this study, 3 coagulometers and 1 point of care were evaluated in parallel to demonstrate how the coagulometer evaluation should be performed and how the available guidelines and scientific studies contributed to validation process.
Methods
Study Design
Three coagulometers and 1 point-of-care equipment were use in this study to demonstrate how to perform a coagulometer validation. One of them, Q Smart system compact equipment (low median port), was selected as a new coagulometer to replace the 2 other systems (median high port) and compared with point-of-care equipment. The performance evaluation of the Q Smart system included an analytical assessment (reference range determination, precision, linearity, throughput, and carryover) as well as a comparison with the 3 other equipment (Bland-Altman analysis, sensitivity, and specificity). The assays were selected to represent an evaluation of all types of hematology–hemostasis laboratory methods, such as clotting, chromogenic, and immunoturbidimetric.
Guidelines Needed for Coagulometer Validation
The use of guidelines to proceed the best evaluation in this setting is mandatory. The mean needed protocols are (1) Protocol for the Evaluation, Validation and Implementation of Coagulometers; Approved Guideline (H57-A) 2008; (2) Evaluation of Precision Performance of Quantitative Measurement Methods; Approved Guideline (EP5-A2). 2005; and (3) Evaluation of the Linearity of Quantitative Measurement Procedures: a Statistical Approach; Approved Guideline (EP5-A2). 2003. All of these guidelines are from the Clinical and Laboratory Standards Institute (CLSI). 6,7,8
Human Plasma Samples
Blood samples from healthy individuals, consecutive outpatients, antivitamin K (AVK)-anticoagulated patients in therapeutic range, patients with hemophilia A, patients with deep venous thrombosis (DVT), and patients under coagulopathies and thrombosis investigation were collected in 0.109 M sodium citrate tubes as recommended by the CLSI H21A5. 9 Samples were fractionated by centrifugation at 2500g for 10 minutes at room temperature. Blood processing was completed within 2 hours from extraction. Plasma fractions were stored at −80°C until the assay was performed.
Reagents and Equipment
The Q Smart system (Diagnostic Grifols, Barcelona, Spain) comprises the Q Smart analyzer and the following DG reagents (Diagnostic Grifols) for each test: DG-PT RecombiLIQ for prothrombin time (PT), DG-APTT Synth for activated partial thromboplastin time (APTT), DG-TT L Human for thrombin time (TT), DG-APTT Synth/DG-FVIII for FVIII, DG-Latex DDimer for
Analytical Assessments
Reference range
In order to verify the normal ranges informed by the company, 20 samples from healthy individuals for PT, APTT, and TT screening test were evaluated, and the normal distribution between results was calculated using Shapiro-Wilk test, mean ± 2 standard deviations (SDs).
Precision analysis
The total precision (reproducibility) analysis was also based on the CLSI EP-5A protocol and was assessed using newly reconstituted lyophilized normal (DG-C1) and abnormal (diluted; DG-C2) commercial plasmas for screening tests, PT, APTT, and TT. The analyses were carried out in 4 runs (intra-routine) on 10 different days (inter-routine), with each run consisting of 2 replicates of the 2 different levels (normal and abnormal).
Linearity analysis
Three different methods of equipment measurement (FVIII,
Throughput
The throughput rate was calculated based on the number of samples processed during half an hour, and the results were reported as the total number of test performed per hour, evaluated using different test profiles: PT and PT + APTT. Additionally, the time to report the first result of each test profile was measured.
Carryover
The carryover was assessed by measuring the sequence A1-A2-B1-B2-B3 in duplicate, where A were heparinized samples (A code) with final concentration of heparin 1 IU/mL, whereas B was a plasma sample with normal results for APTT. The analyses were performed 5 times, and the median was used to calculate the carryover according to the validated formula proposed by Broughton 10 as follows: Carryover, % = 100 × (B1 − B3)/(A2 − B3). No carryover is considered at a value <5%. 1,10
Method Comparison Study
The screening assays PT, APTT, and TT were performed in a routine assay with a number of 69 consecutive outpatients and evaluated with the comparison system according to Bland-Altman analysis. The international normalized ratio (INR) of PT test was performed in samples from AVK patients (n = 19) within the normal dose range, and the results obtained in the Q Smart were compared according to the instrument used (ACL TOP 500 and point-of-care device: CoaguChek XS) and the therapeutic range (INR < 2.0, INR: 2.0-3.0, and INR: 3.0-4.0). The FVIII clotting factor assay comparison was performed on samples from patients presenting different coagulopathies profiles (hemophilia A, thrombotic antiphospholipid syndrome [APS], and patients under investigation). In hemophilia A samples (n = 15), the ability of the Q Smart and the comparison analyzer to distinguish and classify patients according to severity (severe, moderate, and mild) was evaluated, as well as the coefficient of agreement between both systems. Samples from patients under bleeding investigation (n = 27) and thrombotic APS (n = 9) were used to assess the quality of the FVIII assay through the analysis of parallelism curves on specific software of Q Smart in comparison with a reference system (ACL TOP 500, coagulometer). The purpose of this analysis was to evaluate whether the fit curve from patients presented the same fit curve from standard plasma (in other words, whether both curves were parallel; Figure 1). In general, the parameters used for evaluation when the samples and standard curve present a parallelism curve are sample regression, slope ratio, and coefficient of variation (%) between 3 different dilutions from the same sample. Three different dilutions with buffer were carried out for each sample: 1/2, 1/4, and 1/8. The factor assays were then tested automatically using both equipment parts. The analyses are based on checking whether times obtained from each patient plasma dilution are parallel with the standard plasma curve. The analyses are carried out automatically by the software from each coagulometer. The

Example of parallelism analysis available on Grifols software for factor assays.
Statistical Analysis
The data sets are expressed as mean with SD when data were normally distributed and median value with range when the normal distribution was not available. In the method comparison study, the Spearman coefficient of rank correlation, concordance kappa coefficient, and the bias analyses evaluated according to Bland and Altman were used to test the clinical agreement between methods. Statistical analysis was performed using the GraphPad Prism, version 5, for Windows (GraphPad Software Inc, La Jolla, California). P < .05 was considered statistically significant.
Results
Analytical Assessment
The reference range determined for PT, TT, and APTT with 20 healthy donor samples and the mean normal PT and SD for APTT and TT ratio are shown in Table 1. The coefficient of variation(CV%) of total precision for each screening test ranged from 0.8% for APTT in intra-routine normal plasma to 3.2% for TT in inter-routine abnormal plasma. Details are shown in Table 2. The within-run precision for specific assays presented values with a CV% range from 0.1% to 3.5% for FVIII, 0.1% to 0.9% for
Reference Ranges for Screening Tests.

Abbreviations: APTT, activated partial thromboplastin time; CI, confidence interval; PT, prothrombin time; SD, standard deviation; TT, thrombin time.
Total Precision on Q Smart Analyzer for Screening Tests Expressed as Coefficient of Variation (CV%) Assessed Using Reconstituted Lyophilized Normal Plasma and Abnormal (Diluted) Plasma (N = 15).

Abbreviations: APTT, activated partial thromboplastin time; PT/INR, prothrombin time/international normalized ratio; TT, thrombin time.
Method Comparison Study
Prothrombin time, APTT, and TT tests
Bland-Altman results of the PT, APTT, and TT tests obtained on consecutive outpatients using the Q Smart and the comparative system (ACL TOP 500) are shown in Figure 2. In the PT plot, 3 of 67 data points exceeded the lower limit of agreement; in the APTT plot, 2 of 69 data points exceeded the limits of agreement: 1 exceeded the upper limit and the other the lower limit; and in the TT plot, 4 of 63 data points exceeded the lower limit. The PT/INR results obtained on samples from the 19 patients with AVK oral anticoagulation with 2 different systems, laboratory coagulometers (Q Smart and ACL TOP 500) and the POC point-of-care device (CoaguChek XS), are shown in Figure 3, according to the therapeutic range used. The main indications for anticoagulation of patients were prophylaxis of venous thromboembolic events, atrial fibrillation, and prosthetic heart valves. There were 4 patients with INR from POC with <2.0, 9 patients with INR from POC with 2.0 to 3.0, and 7 patients with INR from POC 3.0 to 4.0. No significant differences were observed between the test results within a determined therapeutic range when performed by different analyzers.

Performance comparison according to Bland-Altman between the test results obtained on the Q Smart analyzer and ACL TOP 500 for prothrombin time (PT), activated partial thromboplastin time (APTT), and thrombin time (TT).

Evaluation of antivitamin K anticoagulation samples for prothrombin time (PT) tested by Q Smart analyzer and ACL TOP 500 (coagulometers) and CoaguChek XS (point of care). Results are expressed in mean ± standard deviation (SD) of international normalized ratio (INR) with n = 4 for INR< 2.0, n = 9 for INR between 2.0 and 3.0, and n = 7 for INR between 3.0 and 4.0.
FVIII assay
Parallelism curve analysis for the evaluation and classification of samples from 15 patients with hemophilia A using the FVIII test with both systems is shown in Table 3. The kappa coefficient agreement was 0.669 (95% confidence interval [CI]: 0.3-1.0; P < .001); 3 patients with moderate hemophilia presented results close to borderline (5 UI/dL). All patients classified as severe and mild hemophilia were aligned between systems. The 9 patients under thrombosis investigation were evaluated to test the reproducibility with high levels of protein. All results presented values higher than the normal level in both systems. In order to improve the quality of FVIII assay analyses, 27 patients under coagulopathy investigation were evaluated with parallelism curve analysis. Q Smart software and IL software showed concordance with 22 of 27 samples. Of 5, 4 nonconcordant results were abnormal (nonparallel) for Grifols software and normal (parallel) for IL software, whereas 1 sample was normal for Q Smart software and abnormal for IL software. All these 5 nonconcordant results showed variation in the dilutions, which were not linked with unspecific antibodies.
Factor VIII Determination Comparison Using One-Stage Method.a
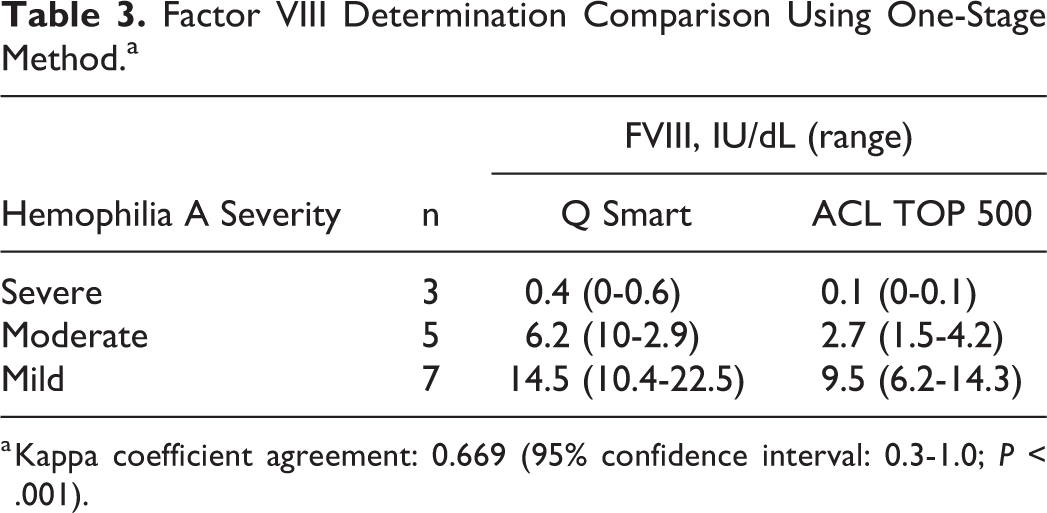
a Kappa coefficient agreement: 0.669 (95% confidence interval: 0.3-1.0; P < .001).
d -dimer assay
Significant differences between systems were found in

Comparison of

Sensitivity and specificity of
AT assay
The AT results obtained using the Q Smart and BCS XP systems were compared, and a significant correlation was observed in samples from healthy individuals (r = 0.7165; P < .0001).
Discussion
According to the local validation protocol used in this study, all characteristics related to the equipment and reagent met the requirements. In general, results of 3% for screening tests and 5% for specific assays in a total precision evaluation are considered acceptable according to the recommendations for hemostasis laboratories.
1
In our study, the precision values met these targets. In addition, good linearity and low CV% between the calibration curves were also observed, and no carryover was found.
1,10
The analytical performance of Q Smart, the new one, was comparable with that of other analyzers.
4,11
In this study, we were able to evaluate patients undergoing AVK therapy with 3 different systems: 2 automated coagulometers and 1 point-of-care device. Regarding the PT/INR and the recombinant thromboplastin reagent, no significant differences were found when comparing Q Smart with either ACL TOP using ISI reagent at approximately 1.0 or with point-of-care CoaguChek XS. All therapeutic ranges were evaluated and were found to be satisfactory; however, studies have shown a general agreement along therapeutic ranges between 2 and 3 INR and discrepancies for results higher than 3.0.
12
–14
In this study, patients with INR value that were in therapeutic range obtained with the point-of-care device showed the same therapeutic range values for both Grifols and Instrumentation Laboratory systems. Regarding the tests used for thrombosis investigation, concordance between methods in
Footnotes
Acknowledgments
The authors would like to thank Diagnostic Grifols for reagent donations.
Declaration of Conflicting Interests
The author(s) declared no potential conflicts of interest with respect to the research, authorship, and/or publication of this article.
Funding
The author(s) received no financial support for the research, authorship, and/or publication of this article.