
Abstract
Hyperglycemia alone may not explain the increased risk of cardiovascular diseases (CVDs) in patients with type 1 diabetes (T1D) compared with type 2. This study emphases on the evaluation of some platelet activity markers in patients with T1D, with relevance to some metabolic disorders as hyperlipidemia and hyperglycemia. This study was performed on 35 patients with T1D and 20 healthy controls. All participants were subjected to full history taking, clinical examination and assay of glycated hemoglobin (HbA1c), and lipid profile. The expression of CD62P and CD36 on platelets and the frequency of platelet–monocyte, and platelet–neutrophil aggregates were assessed by flow cytometry. Patients showed significantly higher expression of CD62P and CD36 than the control group. Platelets aggregates with monocytes were also higher among patients than the control group. Levels of CD36+ platelets, CD62P+ platelets, and platelet–monocyte aggregates revealed significant correlations with the levels of HbA1c, total cholesterol, low-density lipoprotein, and triglycerides. Hyperlipidemia and hyperglycemia accompanying T1D have a stimulatory effect on platelet activation which probably makes those patients vulnerable to CVD than nondiabetics.
Introduction
Diabetes is a metabolic disorder characterized by chronic hyperglycemia and blood lipid and protein disorders with several complications causing morbidity and mortality. 1 Diabetes and uncontrolled hyperglycemia are well-recognized risk factors for the development of atherosclerotic cardiovascular diseases (CVDs). 2 In addition, diabetic patients have poorer prognosis when they experience ischemic vascular disease than nondiabetics and with more postprocedural complications and lower infarct-free survival. 3 Moreover, diabetic patients die mostly from vascular complications. 4
Blood platelets play a key role in the maintenance of normal hemostasis and abnormalities of platelet function may cause hemostatic disorders and atherosclerosis. 5 Diabetic patients have dysfunctional coagulation owing to hyperactive platelets with exaggerated adhesion, aggregation, and thrombin generation. 6 This greater platelet reactivity may be attributable to some metabolic abnormalities as hyperglycemia and hyperlipidemia, insulin resistance, accompanying conditions as oxidative stress, inflammation, and endothelial dysfunction. 7
On activation of platelets, certain membrane receptors such as CD62P (P-selectin) are upregulated to enable them bind to circulating leukocytes. 8 This binding initiates the rapid formation of platelet–leukocyte aggregates. 9 Other adhesion molecules such as CD36 (also known as fatty acid translocase) have also been reported to be involved in platelet aggregation, adhesion to collagen, uptake of oxidized low-density lipoprotein cholesterol (LDL) in vitro, and regulation of angiogenesis. 10
Despite the extremely improved insulin therapy regimens over the last decades, patients with type 1 diabetes (T1D) have around a 10-fold age-accustomed increased risk of CVD, even higher than those with type 2 diabetes (T2D). 11,12 This proposes that hyperglycemia alone may not explain this increased CVD risk. 13 Unlike patients with T2D, who are known to have persistently elevated platelet reactivity and a depressed inhibitory response to aspirin, clinical studies regarding the potential mechanisms of CVD in patients with T1D remains underrepresented, 14,15 and with highly conflicting results. 16 –22 This, in turn, stands as an obstacle to proper care and treatment of patients with T1D. 13
Thereby, this study emphases on the evaluation of some platelet activity markers (platelet expression of CD62P and CD36, platelet–monocyte, and platelet–neutrophil aggregates) in patients with T1D, particularly with relevance to some metabolic disorders as hyperlipidemia and hyperglycemia.
Methods
This is a case–control study performed on 35 young diabetic patients attending the Pediatric Clinical Endocrinology Unit, Children Hospital, Faculty of Medicine, Assiut University from April 2017 to May 2018. All had T1D as defined in accordance with the criteria of the American Diabetes Association 23 and were taking insulin treatment. Mean diabetes duration was defined on the basis of the first injection of insulin. None of the patients was having a concurrent disease, active infection, or previously diagnosed as T2D or taking low-dose aspirin. Twenty age and sex matching healthy children were also studied. Informed consent was obtained from the guardians of each participant participating in the study. The study was approved by the institutional review board of Assiut University according to the Declaration of Helsinki.
All participants were subjected to full history taking and clinical examination. Complete blood cell count was done using the Ruby Cell Dyn fully automated blood counters (American, serial number:36026BG). Assay of hemoglobin 1 and glycated hemoglobin (HbA1c) was performed using Hitachi autoanalyzer (Roch, Germany) by turbidimetric inhibition immunoassay. Lipid profile (total cholesterol, high-density lipoprotein cholesterol [HDL], LDL, and triglycerides levels) was measured by means of Cobas Integra 400, automated chemistry analyzer (Roche Diagnostics, Gmbh, Mannheim, Germany, S.n.:500558). The flow cytometry (FACSCalibur; Becton Dickinson, San Jose, California) was used to evaluate platelet activation by measuring the expression of CD62P and CD36 on platelets and assessing the frequency of platelet–monocyte and platelet–neutrophil aggregates. Blood was withdrawn without stasis to avoid platelet activation.
Flow Cytometric Detection of Activated Platelets
Fifty microliters of blood sample, collected using blood collection tubes containing sodium citrate, was incubated with 5 µL of peridinium–chlorophyll-protein (Per-CP)-conjugated anti-CD41, fluorescein isothiocyanate (FITC)-conjugated anti CD36, and phycoerythrin (PE)-conjugated anti CD62P (Becton Dickinson Biosciences, San Jose, California), at room temperature in the dark for 15 minutes. Red blood cell lysis was done. After washing, the cells were resuspended in phosphate-buffered saline (PBS) and analyzed by FACSCalibur flow cytometry with CellQuest software (Becton Dickinson Biosciences). Antihuman immunoglobulin G (IgG) was used as an isotype-matched negative control with each sample. Identification of platelets (R1) according to their forward scatter and side scatter characteristics was done. Then the expression of CD41 was determined to confirm the platelet gate. Then the expressions of CD62P and CD36 were detected on the CD41+ platelets. The levels of CD62P and CD36 were expressed as percentages of total platelets, Figure 1.
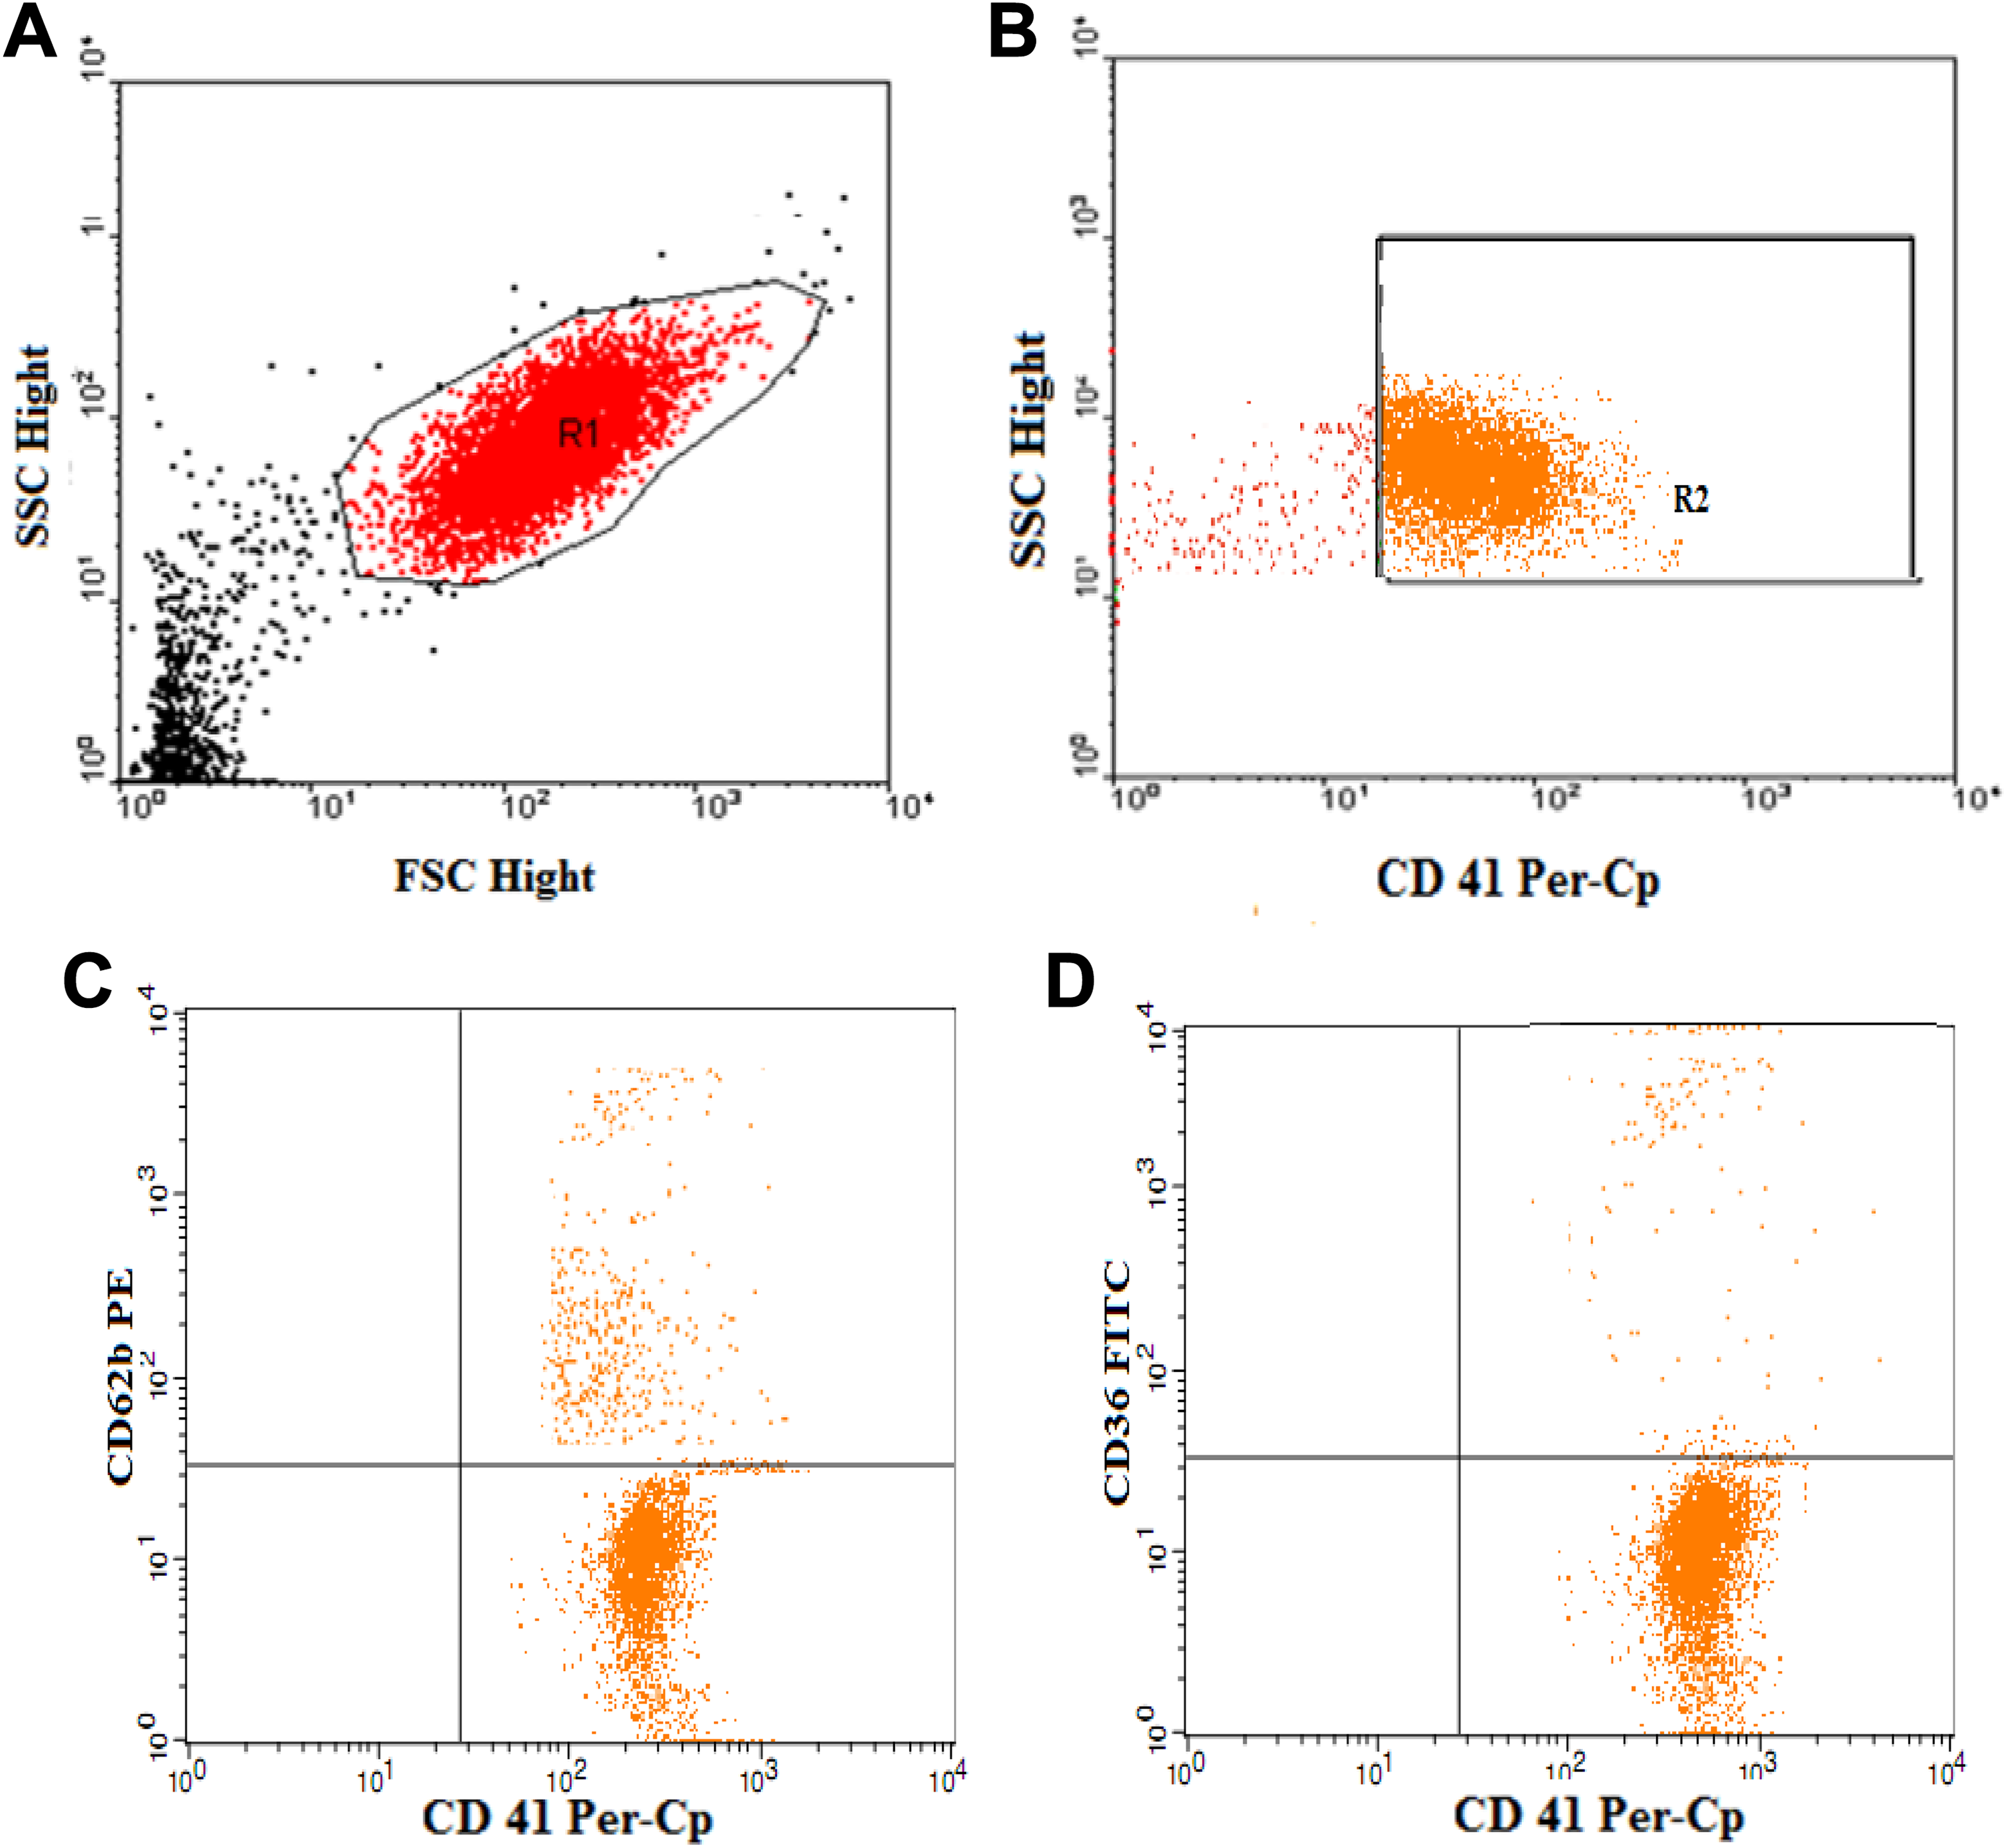
Flow cytometric detection of activated platelets. A, Identification of platelets (R1) according to their forward scatter and side scatter characteristic. B, The expression of CD41 was determined to confirm platelet gate. C and D, Then the expressions of CD62P and CD36 were assessed on the CD41+ population.
Flow Cytometric Detection of PLAs
To detect platelet–leukocytes aggregates, 50 µL of blood sample was diluted with 450 µL PBS/EDTA/albumin buffer. One hundred microliters of this diluted whole blood was incubated at room temperature with 10 µL of Per-CP-conjugated anti CD42b, FITC-conjugated anti CD16, and PE-conjugated anti CD14 (Becton Dickinson Biosciences). Then the samples were fixed with 500 µL of 1% paraformaldehyde in distilled water. Red blood cell lysis and washing were done. The cells were resuspended in PBS and analyzed by FACSCalibur flow cytometry with CellQuest software (Becton Dickinson Biosciences). Antihuman IgG was used as an isotype-matched negative control for each sample. A scatter plot of forward versus side scatter was used to identify the subpopulations of leukocytes. The CD14 was used to confirm the monocytes gate and CD16 was used to confirm the neutrophil gate. Then the expressions of CD42b on the monocytes and neutrophils populations were detected. The levels of monocyte–platelet aggregates and neutrophil–platelet aggregates were detected as percentages of total monocytes, and neutrophils, respectively, Figure 2.
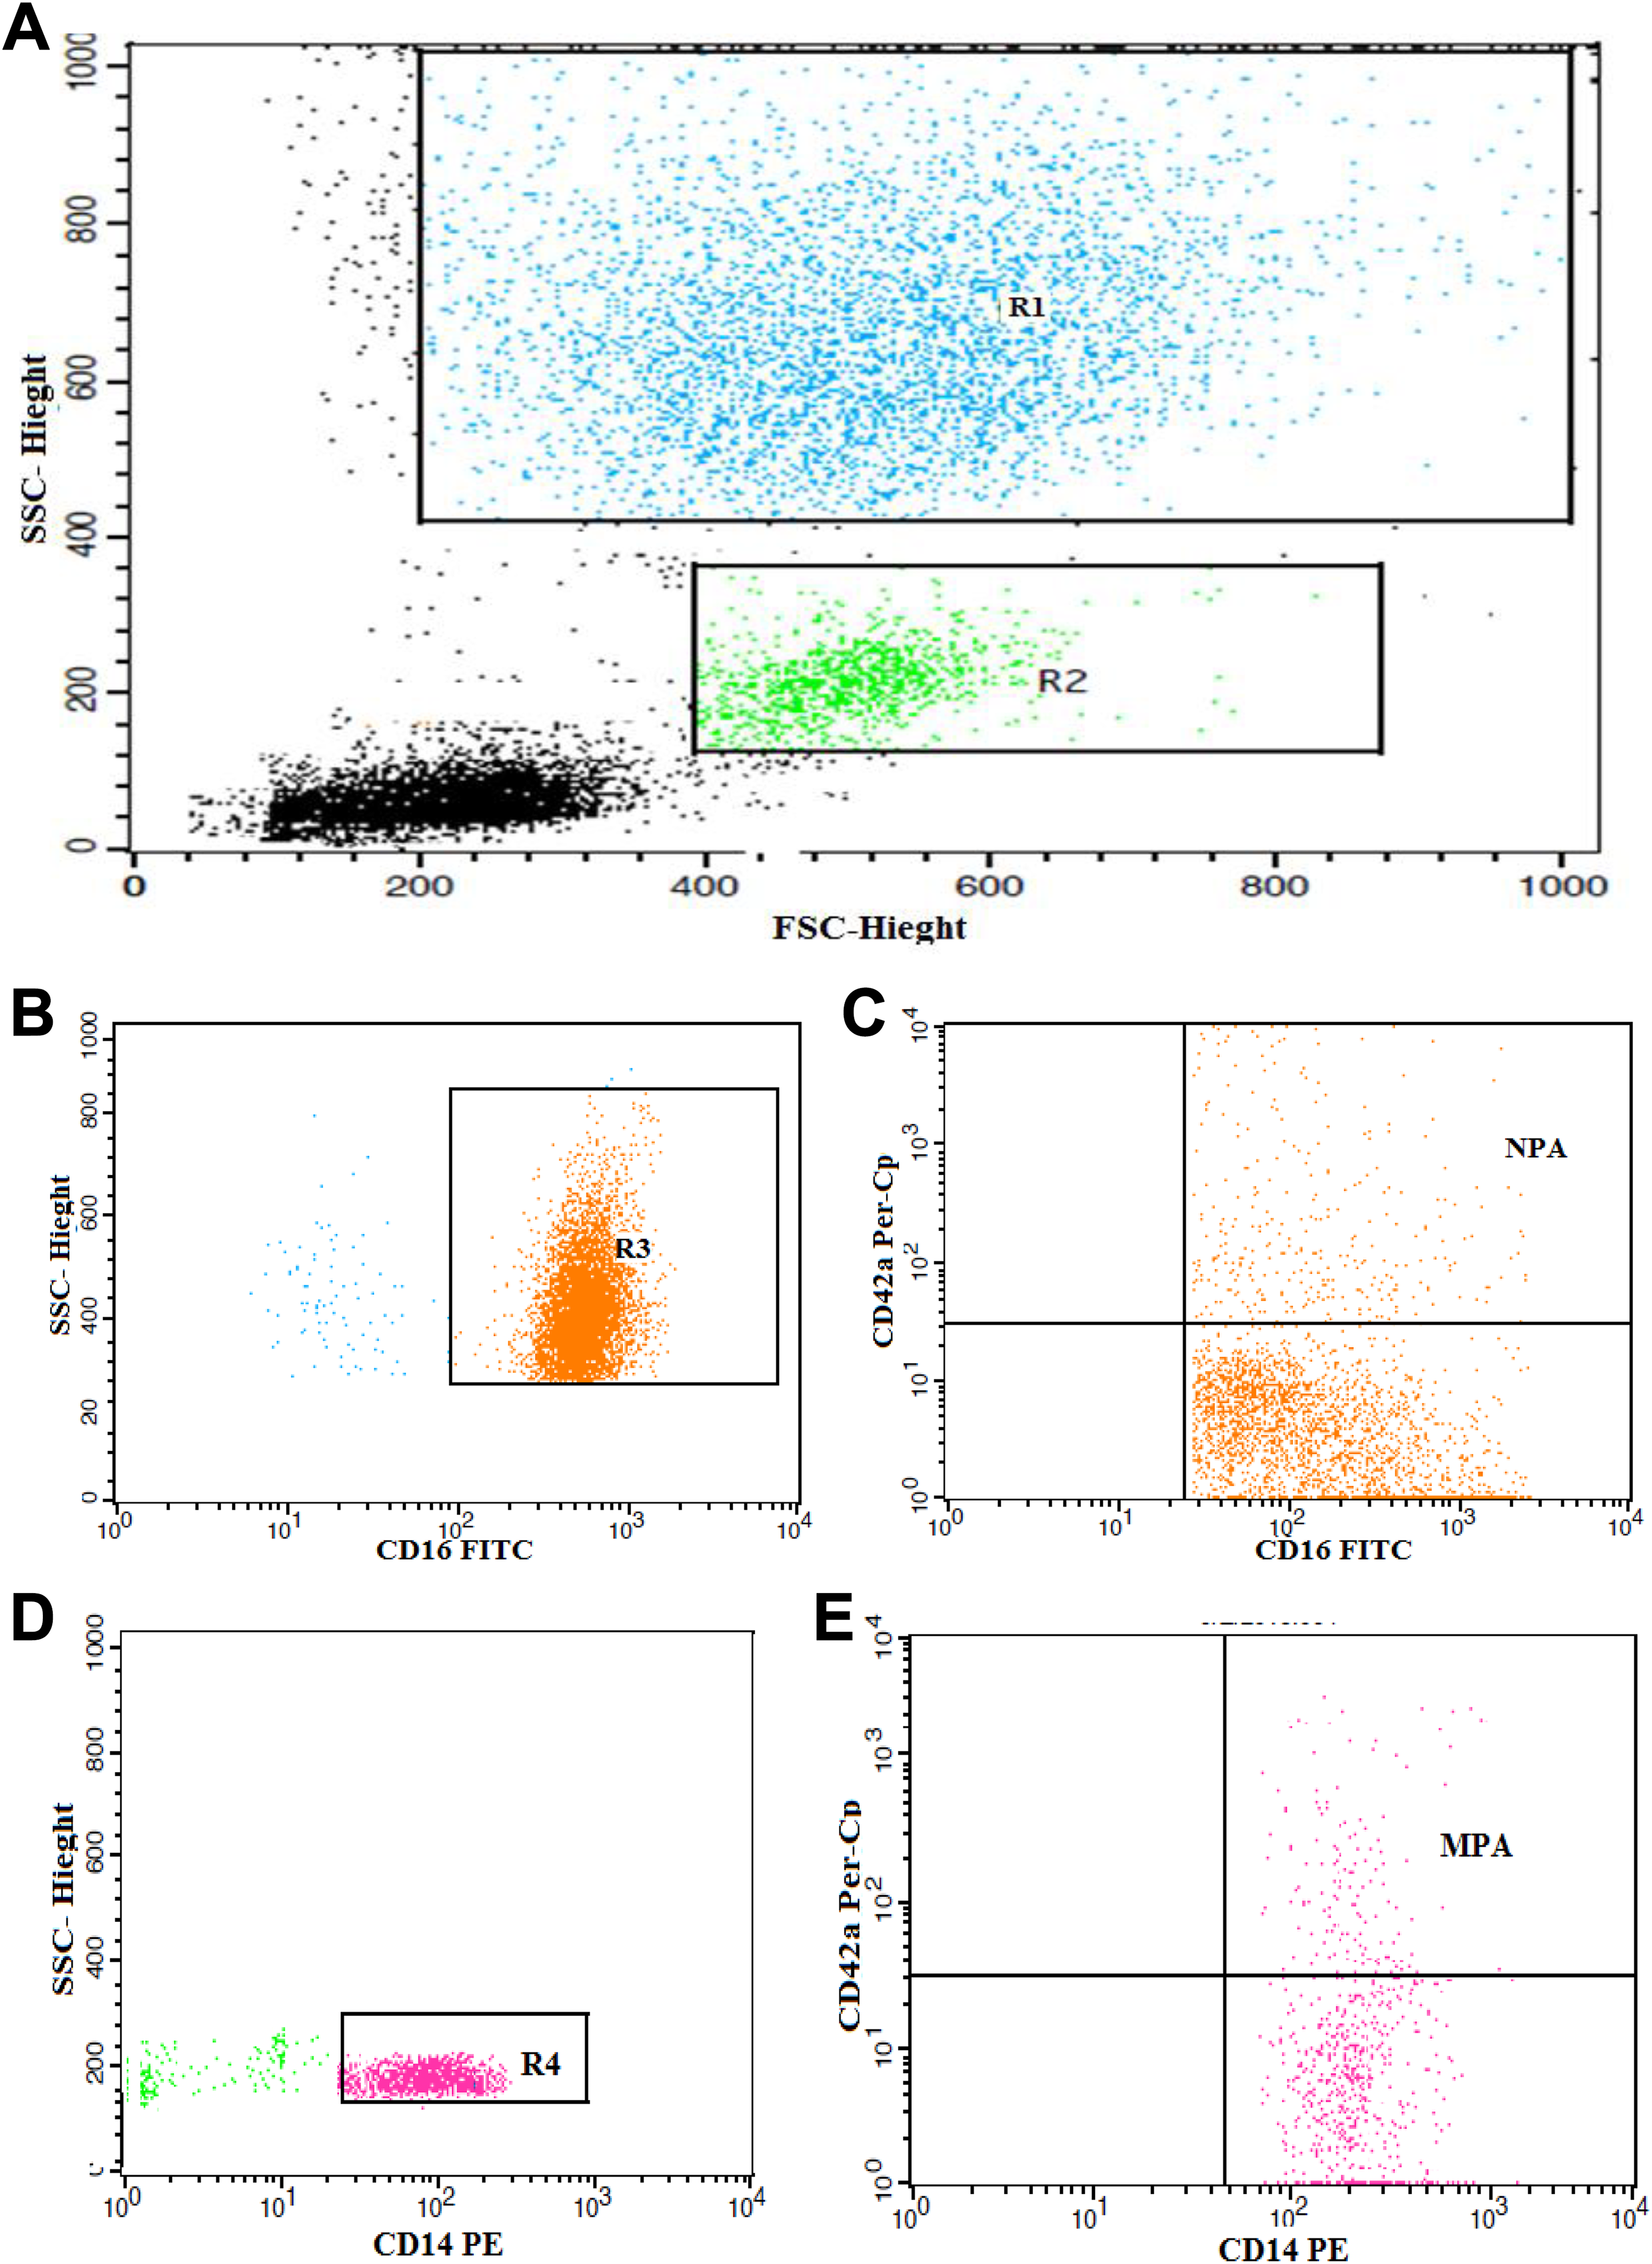
Flow cytometric detection of leukocytes platelet aggregates. A, A scatter plot of forward versus side scatter was used to identify the subpopulations of leukocytes. B and C, CD16 was used to confirm neutrophil. Then the expression of CD42b on the neutrophils populations to detect neutrophil–platelet aggregates. D and E, CD14 was used to confirm monocytes gates. Then the expression of CD42b on the monocytes to detect neutrophil–platelet aggregates and monocyte –platelet aggregates.
Statistical Analysis
Statistical analysis was carried out using the Statistical Package for Social Sciences, version 16.0 (SPSS Inc., Chicago, USA). Results were demonstrated as mean (standard deviation). Statistical significant differences between the groups were determined by χ2 test for categorical variables. For continuous variables, Student t test was used. Associations between the variables were explored using the Pearson correlation coefficient. A P value of less than .05 was considered significant.
Results
Characteristics of Study Participants
The demographic characteristics and laboratory findings of the study participants are shown in Table 1. Patients with T1D had significantly higher HbA1c, total cholesterol, LDL, and triglycerides compared with the healthy controls. Also, lower level of hemoglobin was detected in patients than the controls.
The Demographic Characteristics and Some Laboratory Findings of the Patients With T1D and Controls.a
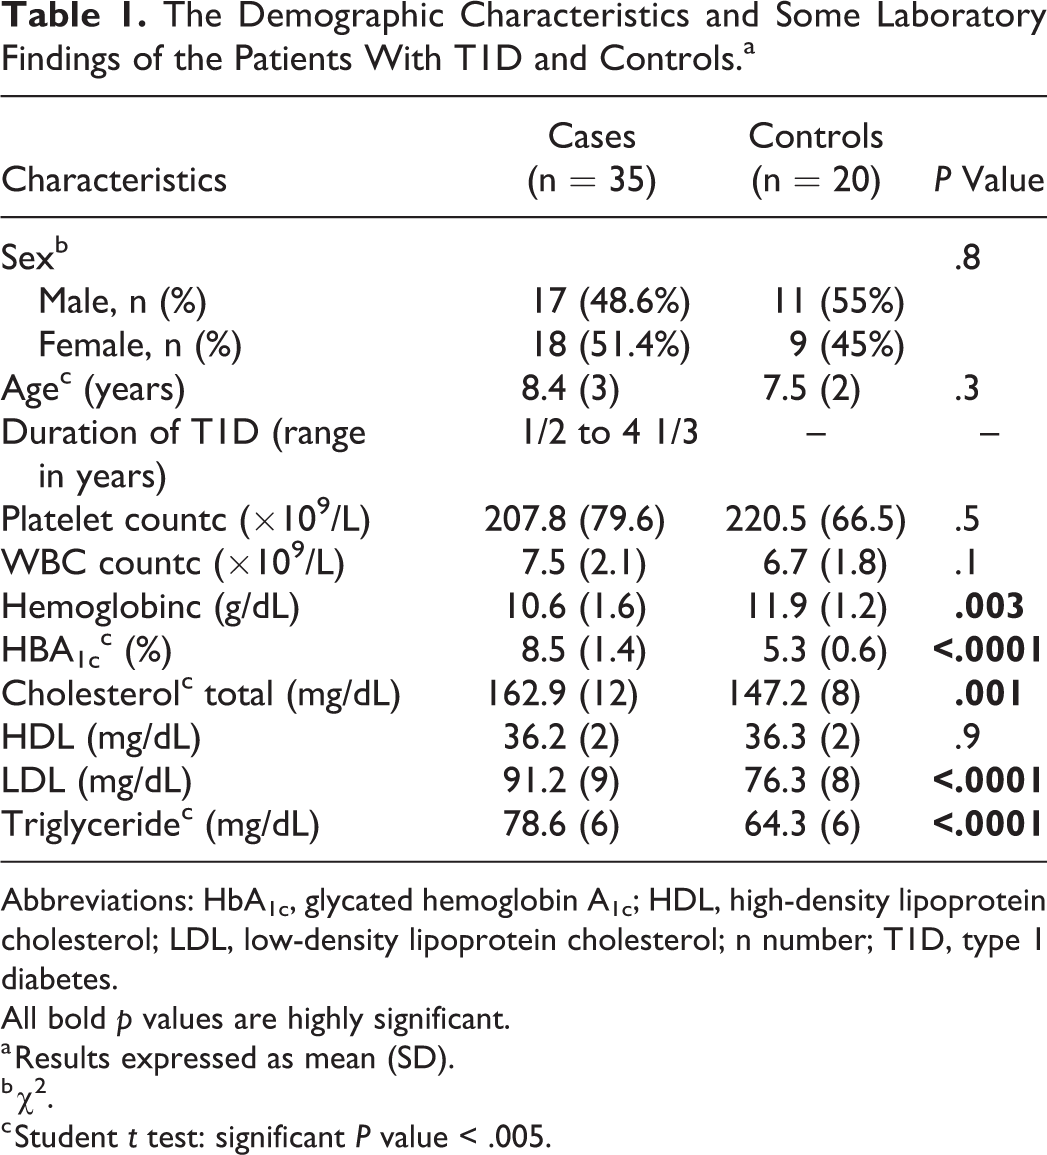
Abbreviations: HbA1c, glycated hemoglobin A1c; HDL, high-density lipoprotein cholesterol; LDL, low-density lipoprotein cholesterol; n number; T1D, type 1 diabetes.
All bold p values are highly significant.
a Results expressed as mean (SD).
b χ2.
c Student t test: significant P value < .005.
In the clinical examination of our cases, we detected complications in 11 children with history of T1D more than 5 years, 4 of them had renal impairment with impaired renal function, 3 children developed hypertension, 2 had cerebrovascular stroke affecting the right side with left-sided hemiplegia, and 2 had peripheral polyneuropathy. All these cases with complications were not on regular insulin therapy and with higher HbA1c levels.
Impact of T1D on Platelet Activation
Patients with T1D showed significantly higher expression of platelet activation markers, CD62P (42% [12%]) and CD36 (24% [4%]) than the control group (19 [7] and 12 [6], respectively), (P value <.0001). Moreover, platelet aggregates with monocytes were significantly higher among patients than the control group (42 [14] vs 20 [8]; P value <.0001). However, there is no significant difference in platelet–neutrophil aggregates between patients and controls. Results are summarized in Table 2.
Comparison Between the Percentages of Activated Platelets and Platelet Aggregates With Monocytes and Neutrophils in Patients With T1D and Controls.a,b
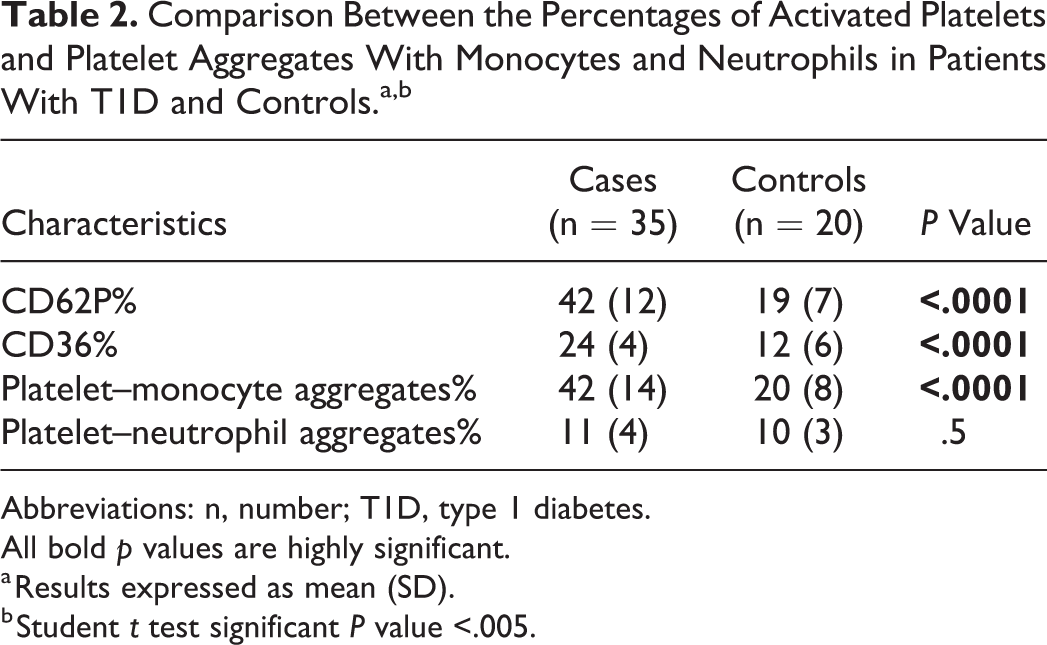
Abbreviations: n, number; T1D, type 1 diabetes.
All bold p values are highly significant.
a Results expressed as mean (SD).
b Student t test significant P value <.005.
Correlations Between the Markers of Platelet Activation, Platelet–Monocyte, and Neutrophil Aggregation and With Some Clinical and Laboratory Data
The mean percentage of CD62P+ platelets showed moderate correlation with the levels of HbA1c (r = 0.6) followed by total cholesterol and triglycerides (r = 0.5), then LDL (r = 0.4). Meanwhile, strongest correlation of the percentage of CD36+ platelets was detected with triglycerides (r = 0.7) then with HbA1c, total cholesterol (r = 0.6) and LDL (r = 0.5). Platelet–monocyte aggregates displayed its highest correlation with HbA1c (r =0.7) followed by triglycerides (r = 0.5) then total cholesterol and LDL (r = 0.4, 0.3, respectively).There is no significant correlation between any of the studied parameters and duration of diabetes. Results are illustrated in Table 3 and Figures 3 to 5.
Correlations Between the Markers of Platelet Activation, Platelet–Monocyte, and Neutrophil Aggregation and With Some Clinical and Laboratory Data.a
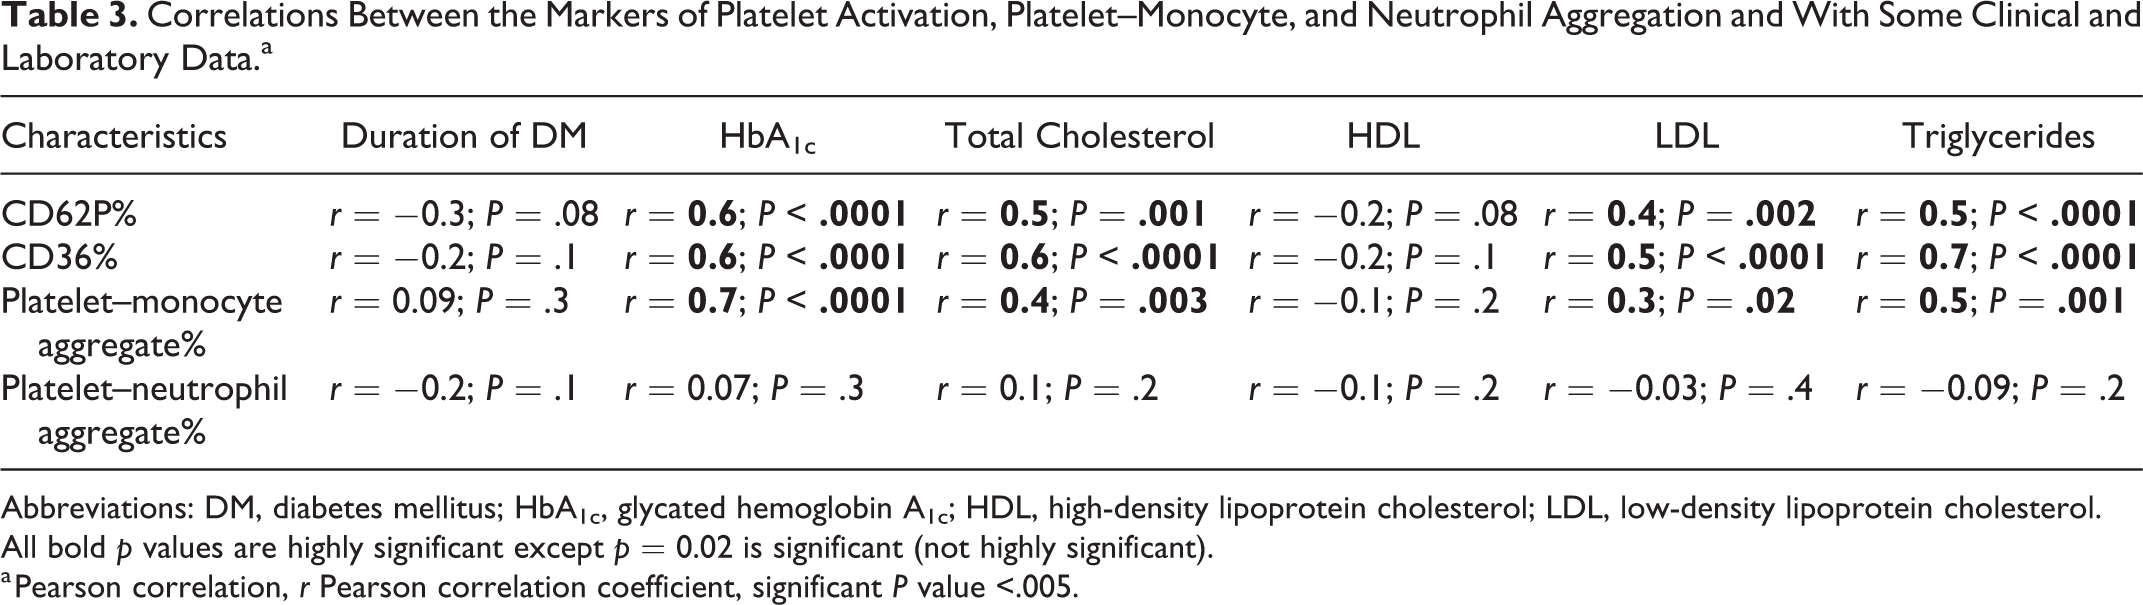
Abbreviations: DM, diabetes mellitus; HbA1c, glycated hemoglobin A1c; HDL, high-density lipoprotein cholesterol; LDL, low-density lipoprotein cholesterol.
All bold p values are highly significant except p = 0.02 is significant (not highly significant).
a Pearson correlation, r Pearson correlation coefficient, significant P value <.005.
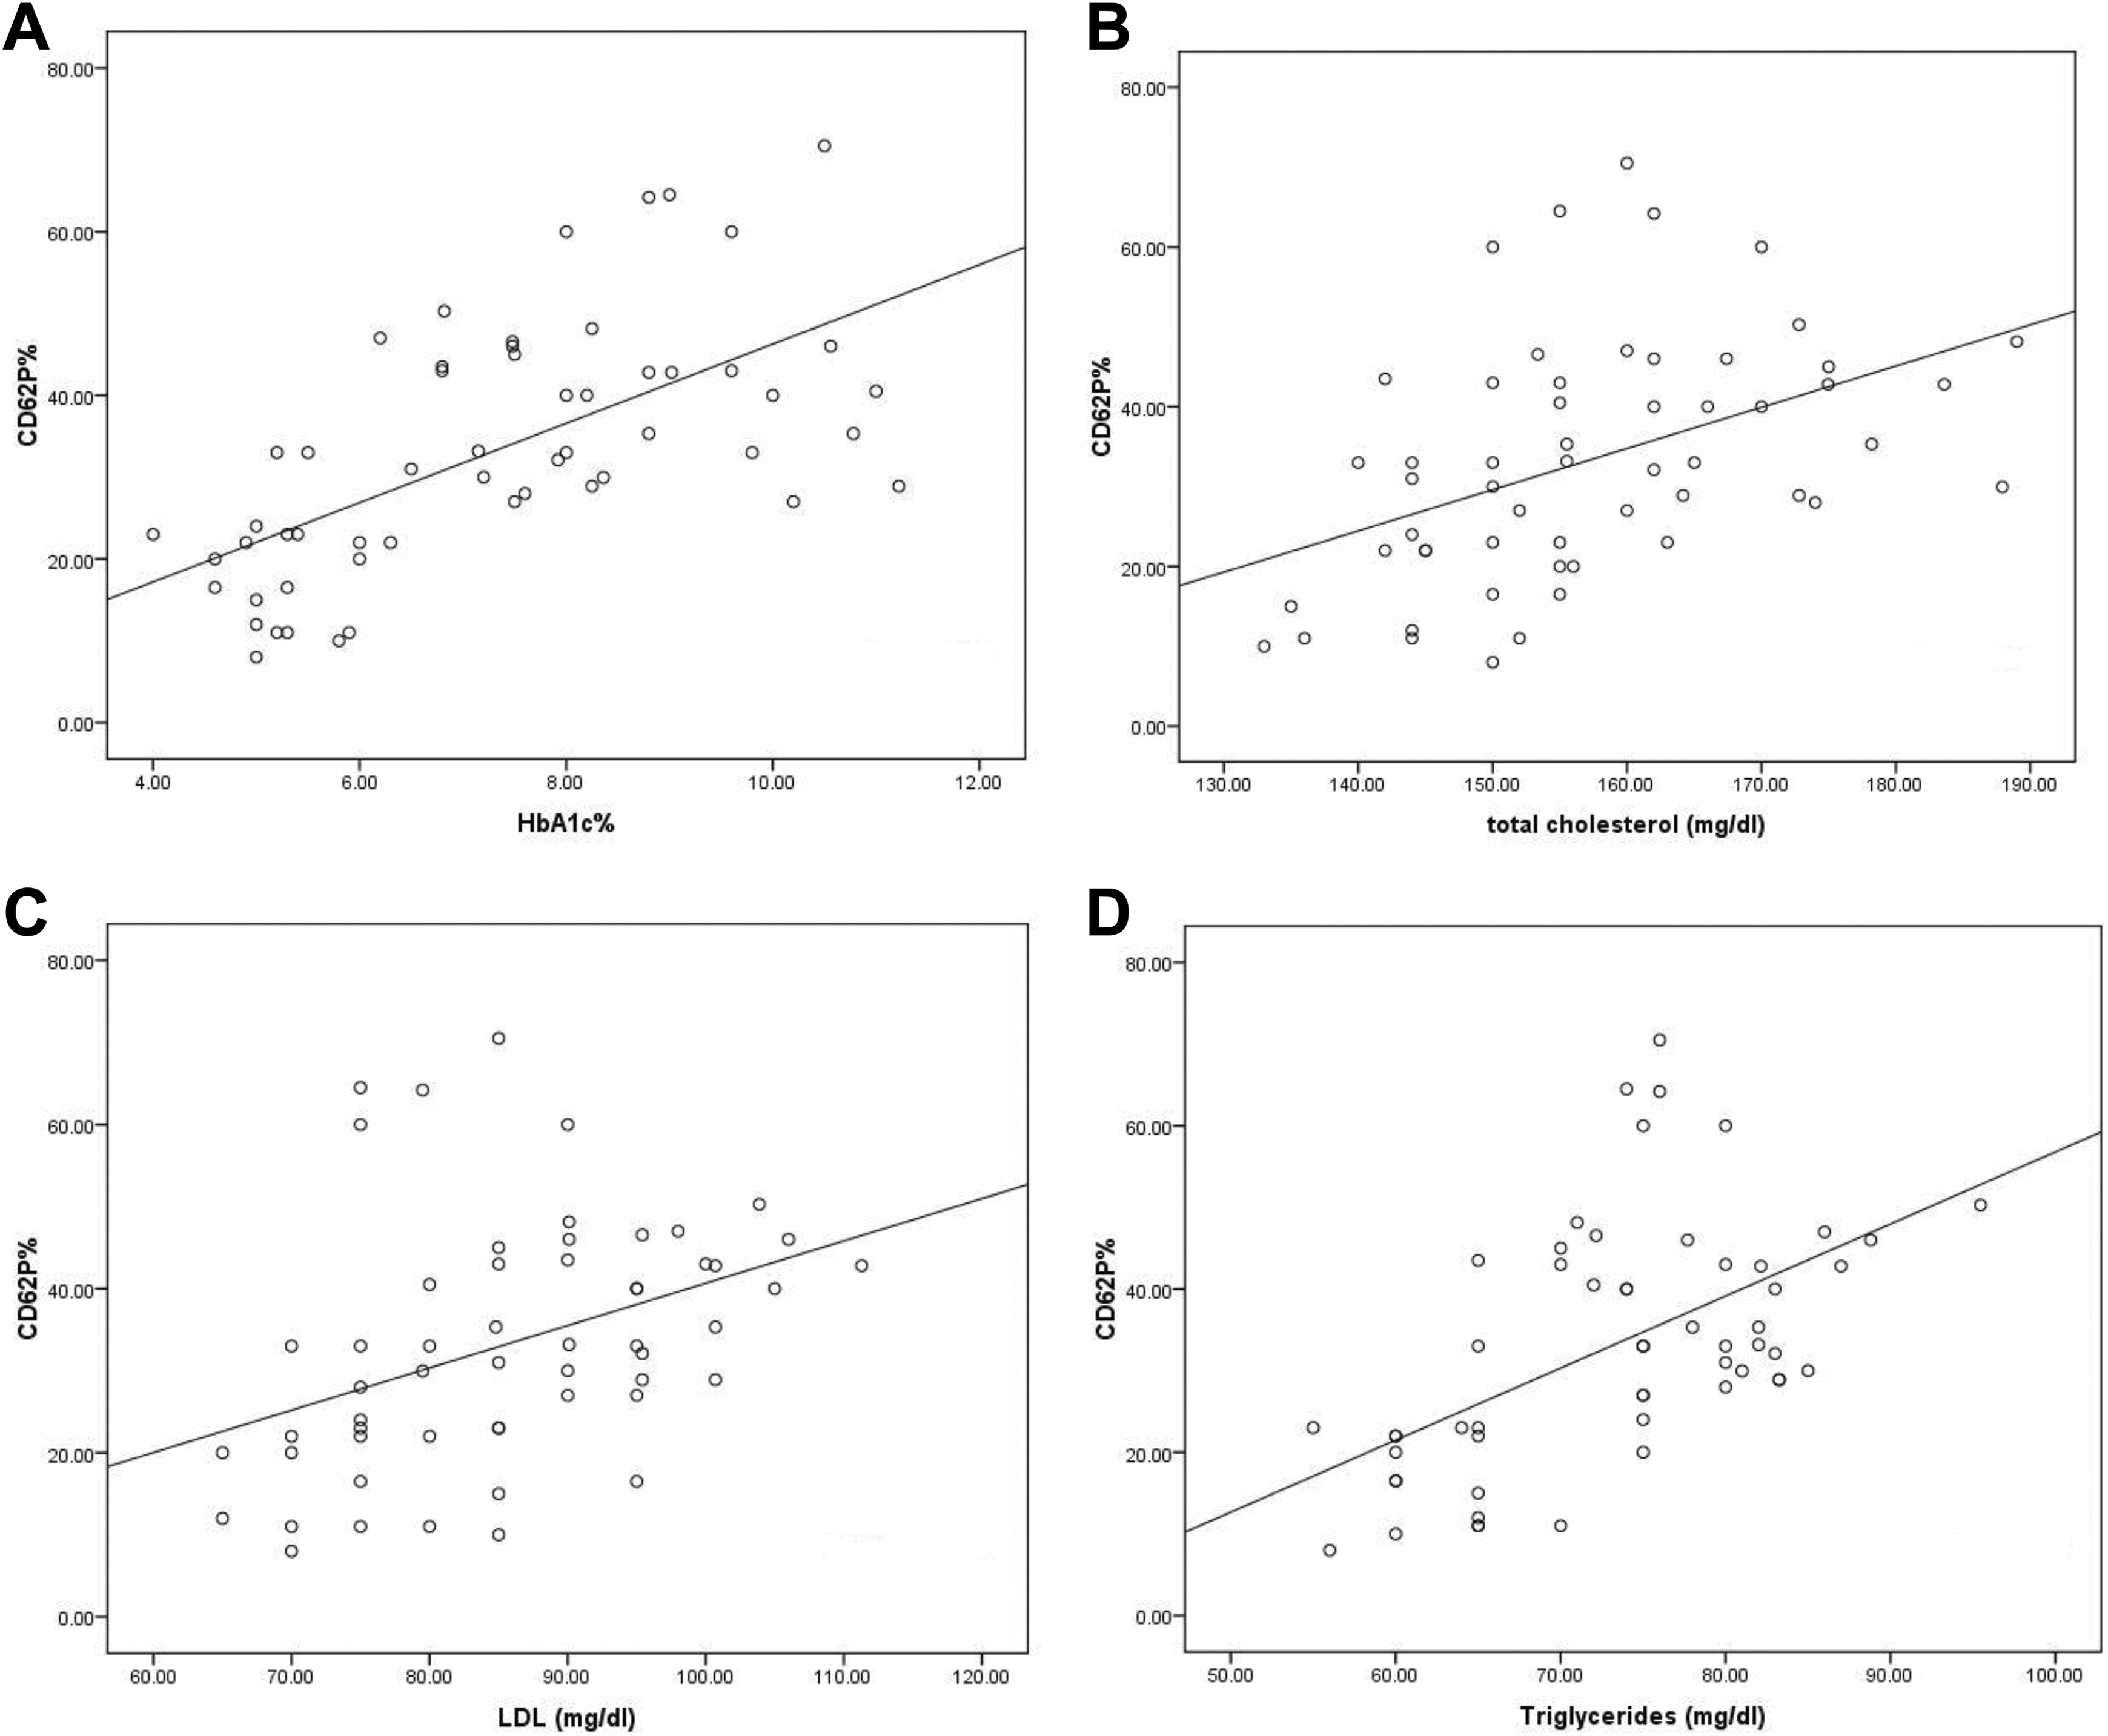
Correlations between CD62P+ platelets and levels of hemoglobin A1c (A), total cholesterol (B), low-density lipoprotein (LDL; C), and triglycerides (D).
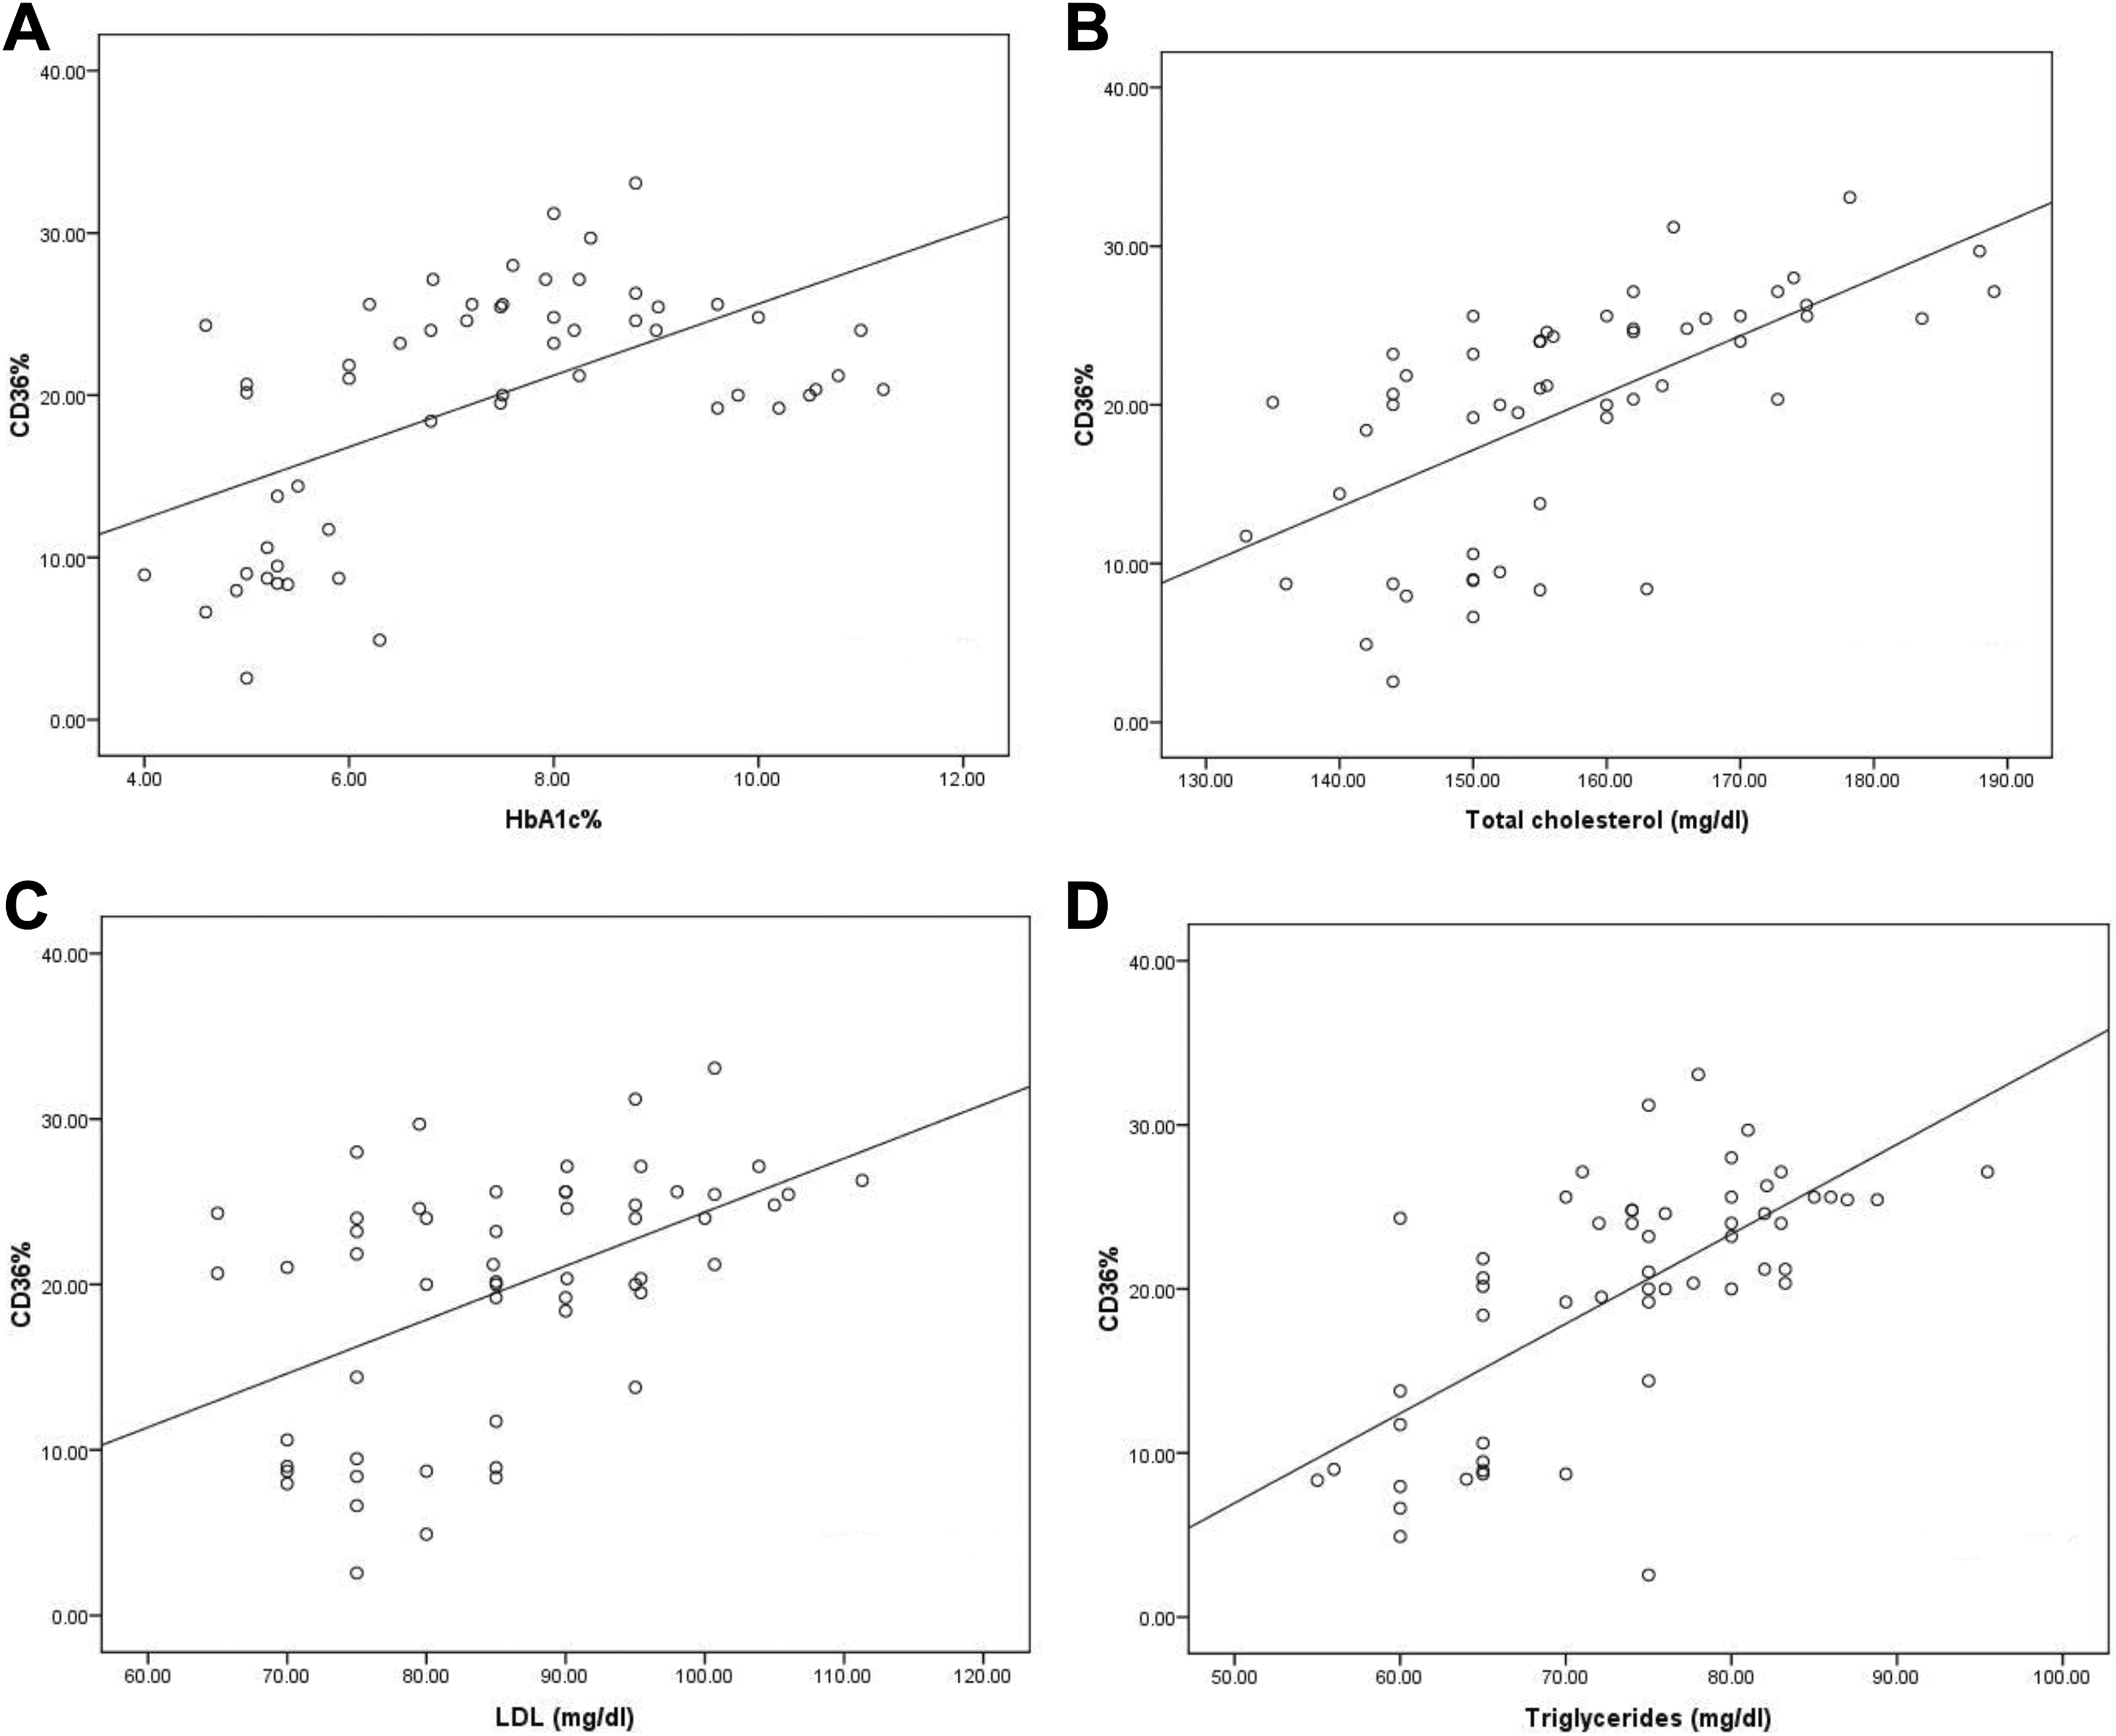
Correlations between CD36+ platelets and levels of hemoglobin A1c (A), total cholesterol (B), low-density lipoprotein (LDL; C), and triglycerides (D).
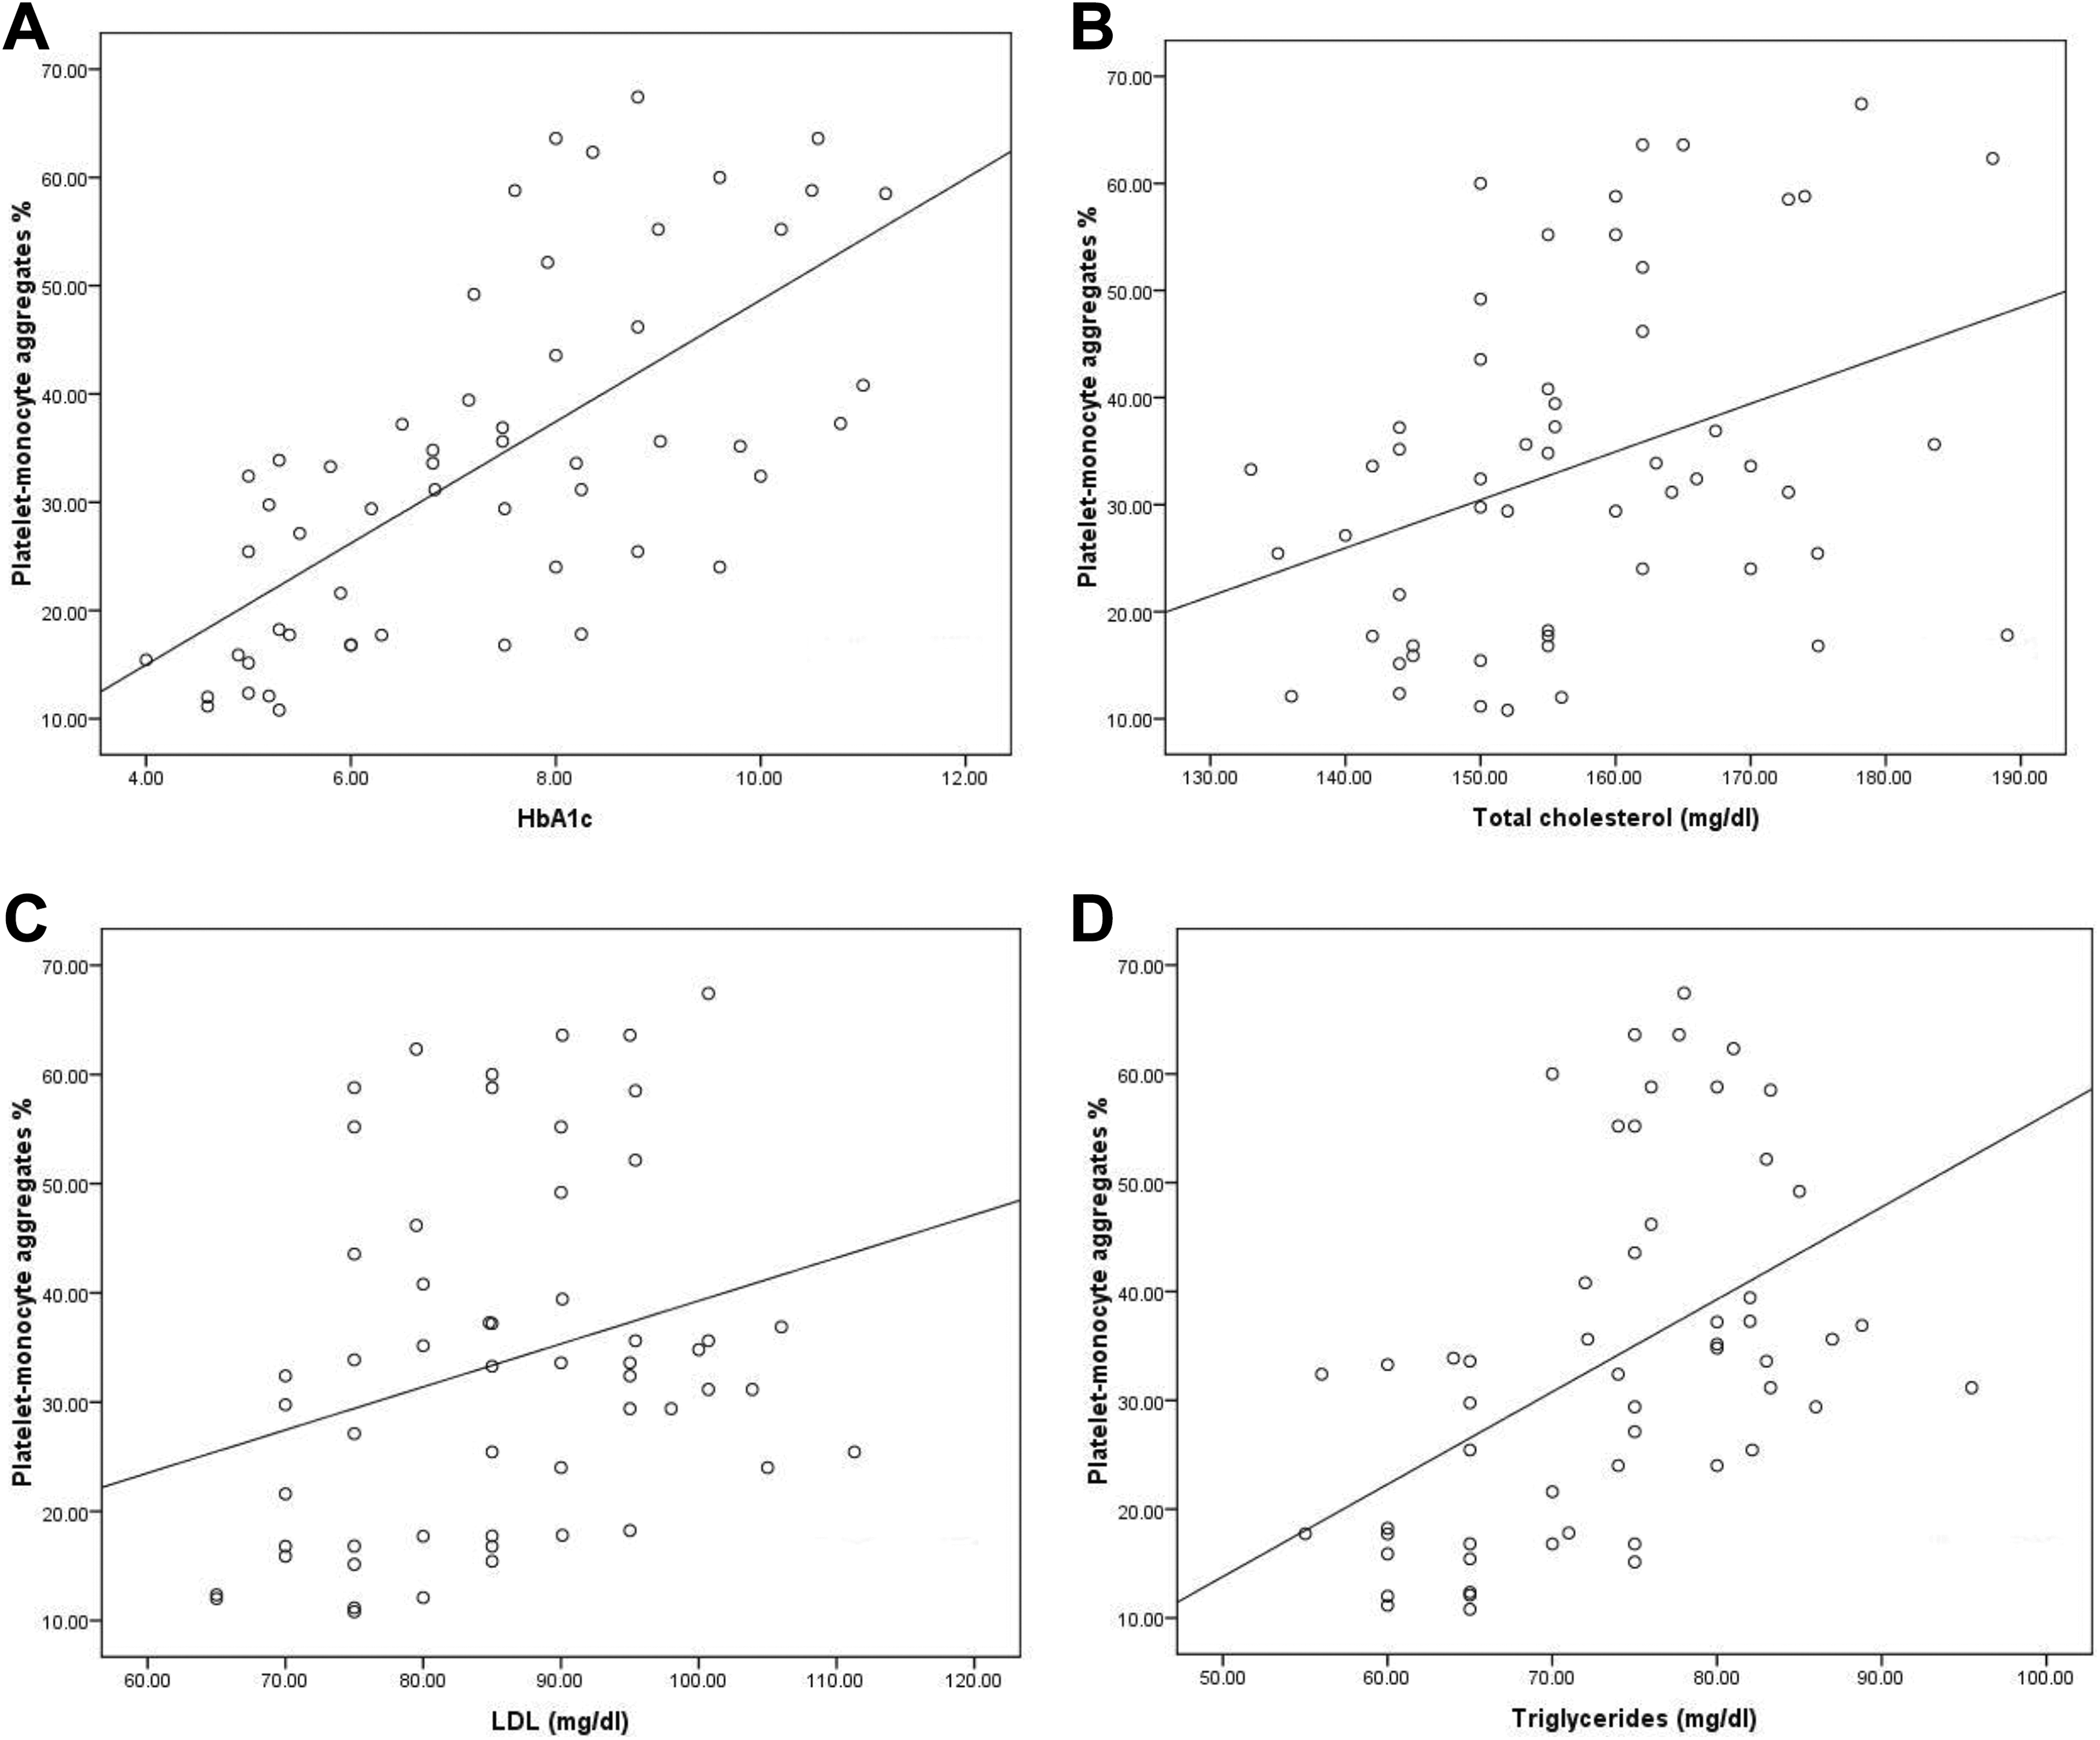
Correlations between platelet–monocyte aggregates and levels of hemoglobin A1c (A), total cholesterol (B), low-density lipoprotein (LDL; C), and triglycerides (D).
Correlations Among the Mean Percentages of Platelets Expressing CD62P, CD36, Platelet–Monocyte, and Platelet–Neutrophil Aggregates
As shown in Figure 6, CD36+ platelets revealed moderate correlations with both CD62P+ platelets and platelet–monocyte aggregates (r = 0.6, 0.5, respectively). Moreover, CD62P+ platelets and platelet–monocyte aggregates displayed moderate correlation (r = 0.4).
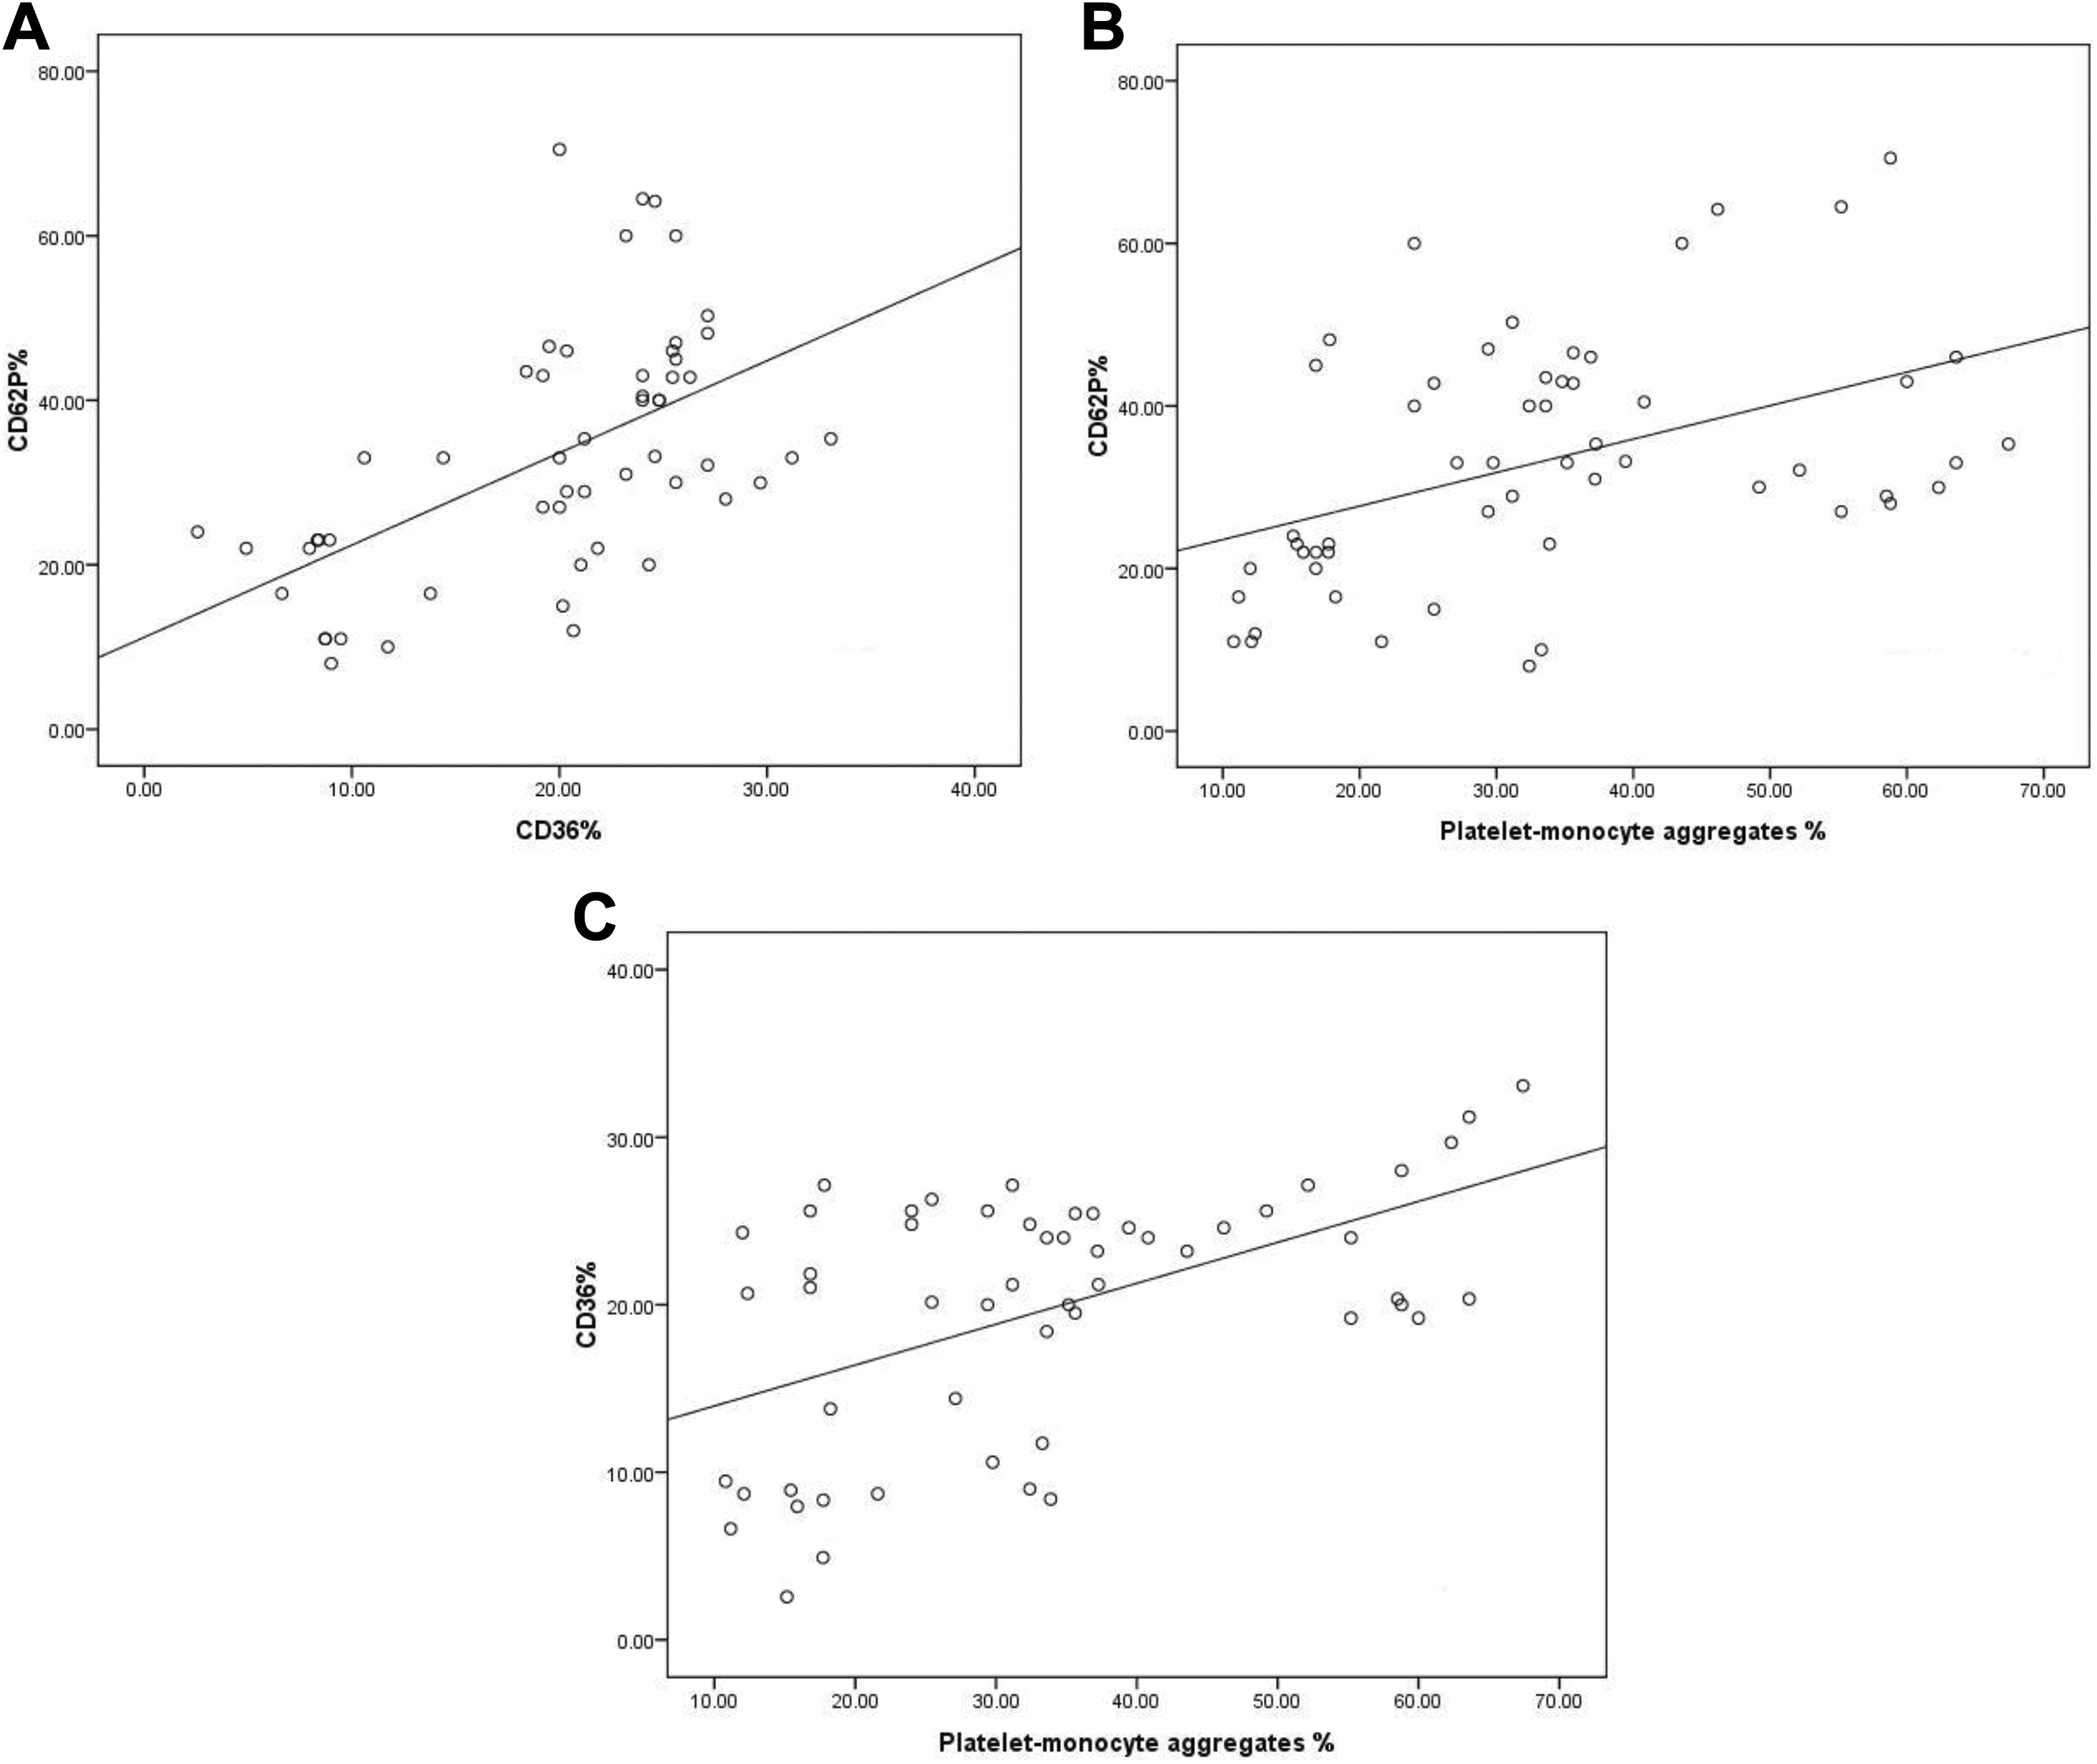
Correlations between CD62P+ platelets and both CD36+ platelets (A) and platelet–monocyte aggregates (B) and between CD36+ platelets and platelet–monocyte aggregates (C).
Discussion
Hyperglycemia and hyperlipidemia are important risk factors for the development of CVD in diabetic patients. Patients with T2D have elevated platelet reactivity 14,15 that has been suggested to contribute to the pathogenesis of atherosclerosis and acute atherothrombotic disorders such as myocardial infarction and stroke. 24
In our patients with T1D, higher level of HbA1c was observed compared with healthy controls. This was accompanied by hyperlipidemia, specifically higher levels of cholesterol, LDL, and triglycerides than healthy controls.
Our findings agree with previous reports of elevated levels of CD62P+ platelets and platelet–monocytes aggregates in patients with T1D. 18,19 P-selectin was reported earlier to enable platelet binding to leukocytes preferentially monocytes, initiating thereby the formation of platelet–monocyte aggregates 8,9 which may contribute to the proinflammatory and prothrombotic state as well as the accelerated atherogenesis associated with this disorder. 19 This explains the correlation found in our patients between both CD62P+ platelets and platelet–monocyte aggregates levels. It also supports the finding of significant difference in the level of platelet–monocyte aggregates, but not the platelet–neutrophil aggregates, between patients and control.
Little is known about CD36 platelet expression in patients with T1D. Higher level of CD36+ platelets was found in our patients compared with controls. A previous study concluded that overexpression of this receptor could be one of the mechanisms enhancing atherosclerosis development in patients with T2D evidenced by the direct association between this pathology and the expression of this receptor. 25 Moreover, some studies have shown that it could be used as a potential marker of CVD 26,27 and its level correlates with the development of diabetic microvascular complications, especially nephropathy. 28
Furthermore, the levels of CD36+, CD62P+ platelets, and platelet–monocyte aggregates revealed significant correlations with the level of HbA1c. Also, moderate correlations were detectable between CD36+ platelets and both platelet–monocyte aggregates and CD62P+ platelets. Overall, our findings together with the previous studies may support the potential role of CD36 in platelet-mediated vascular disorders in T1D.
Additionally, each of CD36+, CD62P+ platelets, and platelet–monocyte aggregates showed significant correlations with the levels of total cholesterol, LDL, and triglycerides. These correlations with lipids were stronger with CD36+ platelets than the other 2 activation markers. This is supported by the fact that CD36 has a number of putative ligands including oxidized LDL and fatty acids. 29 It was also reported to be highly induced in T2D and this induction is accompanied by an increase in free fatty acid uptake by the cells. 30 Similarly, a link was observed in earlier studies between increased LDL concentration and P-selectin. 31,32
On the other hand, studies of HDL effects on platelet function have been inconsistent, with some reports showing inhibition 33,34 and others showing activation. 35 In our patients, none of the 3 tested platelet activation markers showed significant correlations with HDL level. This may be because of the relatively low affinity of platelets for HDL or the capability of HDL particles to “carry” a wide array of bioactive molecules. 36,37
In conclusion, the upregulation of platelet activation markers and platelet–monocyte aggregates in patients with T1D may indicate that hyperlipidemia and hyperglycemia accompanying T1D have a stimulatory effect on platelet activation which probably makes those patients vulnerable to CVD than nondiabetics.
Footnotes
Authors’ Note
The limitation of the study was to some extent the small sample size. Another limitation was that platelet function was not assessed.
Declaration of Conflicting Interests
The author(s) declared no potential conflicts of interest with respect to the research, authorship, and/or publication of this article.
Funding
The author(s) received no financial support for the research, authorship, and/or publication of this article.