
Abstract
Based on the premise that the capacity of plasma to generate thrombin in vitro is a comprehensive and precise functional test of the clotting system, we designed a cross-sectional, single-center study involving 83 patients with rare bleeding disorders (RBDs) to compare the usefulness of the thrombin generation (TG) assay versus conventional tests including prothrombin time (PT) and activated partial thromboplastin time (aPTT) in predicting bleeding risk in patients with RBD in southern Iran. The TG parameters consisted of endogenous thrombin potential, lag time, peak, time to peak (ttPeak), and start tail. The area under the receiver–operating characteristic (ROC) curve showed statistically significant associations between bleeding risk and lag time, ttPeak, and start tail. We determined cutoff values for these 3 TG parameters and obtained a negative predictive value of 86% to 90% in patients with RBD who had a bleeding score (BS) ≤13. The ROC curves for the association of PT and aPTT with BS did not indicate any significant association. Correlation analysis supported the results of ROC curve analysis, only lag time, ttPeak, and start tail showed significant positive correlations with BS (P < .05). Disease severity based on plasma factor activity was significantly associated with prolonged lag time and ttPeak and with prolonged PT (P <.05). We suggest that TG assay is a potentially more useful tool for predicting the bleeding risk in patients with RBD. However, the small sample size in different RBD subgroups precluded subgroup analysis. Prospective multicenter studies with larger numbers of patients are therefore advisable.
Introduction
Hemophilia A and B and von Willebrand disease account for 95% to 97% of all bleeding disorders, and the other 3% to 5% are represented by the less common inherited rare bleeding disorders (RBDs) that include deficiencies in fibrinogen (FI), prothrombin (FII), factor V (FV), combined factor V and VIII (FV & VIII), factor VII (FVII), factor X (FX), factor XI (FXI), and factor XIII (FXIII). 1 Because these disorders are rare, the type and severity of symptoms and the management of bleeding episodes are not well established. Hence, a deeper knowledge of RBD and their pathogenesis is important to develop new prophylactic and therapeutic protocols. Coagulation screening tests such as activated partial thromboplastin time (aPTT), prothrombin time (PT), and thrombin time are inadequate to characterize anticoagulant factors and are not accurate enough to define the clinical severity of these disorders.2,3 Clinical experience has shown that the relationship between bleeding tendency and the results of conventional coagulation screening tests or plasma levels of deficient factor can vary markedly in these patients. 4
Measuring overall hemostasis instead of isolated factor activity is the basis of new attempts to characterize this complex system based on the generation of thrombin, the key enzyme in blood coagulation, rather than the close-angle view of regular screening tests. Thrombin generation (TG) is an indicator of the overall efficacy of hemostasis, and a relationship has been found between TG test and the severity of clinical bleeding tendency. 5 Research demonstrated that the risk of severe bleeding due to various abnormalities in plasma coagulation proteins was invariably accompanied by aberrant TG. These observations, although sparse and isolated, demonstrate that TG is potentially useful as a general coagulation test and suggest that detailed studies of TG patterns in different inherited bleeding disorders are worthwhile, since these analyses may result in better indicators to assess the severity of bleeding tendency. If the TG assay can firmly predict bleeding risk, it would be useful both in clinical decision making and in guiding the appropriate use of factor concentrate applications that can improve the cost-effectiveness of the management of patients with RBD. 6
In this study, we aimed to compare TG parameters in patients with RBD and healthy individuals. In addition, we wished to compare the correlation of TG parameters and conventional tests such as PT and aPTT with bleeding score (BS) and disease severity (based on residual coagulant activity of the deficient factor) as markers of disease phenotype in patients with RBD.
Methods
This cross-sectional study was conducted at Shiraz Hemophilia Center in southern Iran from January to December, 2011. Sample size calculation was based on the results of a pilot study of 20 patients with RBD, which yielded a correlation coefficient of about 0.3 for most TG parameters with BS. Considering α = 0.05 and for an 80% power level, sample size was calculated as 84 patients with RBD in the case group. All participating patients had been registered at Shiraz Hemophilia Center since 2006. One patient declined to participate and was excluded from the study. Our case group therefore consisted of 83 patients. Thirty-eight sex- and age-matched healthy individuals were selected from the same center as controls. Informed consent was obtained from all the participants or their parents (patients and controls). The study protocol was approved by the ethics committee of Shiraz University of Medical Sciences.
Phenotype of RBD
Disease severity and BS have been considered markers of RBD phenotype. Disease severity was defined here on the basis of residual coagulant activity of the deficient factor (severe <1%, moderate from 1% to 5%, and mild >5% and <50%).1,2 The BS was determined by collecting detailed information on the clinical history and bleeding manifestations with a specifically tailored BS questionnaire based on the instrument used by Tosetto et al. 7 These data were used to draw a BS profile by summing the severity of all reported bleeding symptoms. For each symptom, a score of 0 or 1 was assigned to different characteristics (eg, presence, frequency, and magnitude). Considering a prevalence of 1% for mild bleeding disorders in the general population, a BS of 0 to 3 was considered normal, with a very high negative predictive value (NPV). 8
Laboratory Evaluation
Coagulation Screening Tests
Reagents were from Instrumentation Laboratory (IL; Milan, Italy) and assays were performed on an ACL-9000 automated coagulometer (IL). Bleeding time was measured with the Ivy method and platelet counts were obtained with a Sysmex KX-21 apparatus (TOA System, Tokyo, Japan).
Specific Coagulation Assays
For functional activity-coagulation assays, the activity values of FII, FV, FVII, FVIII, FXI, and FX were measured in factor-deficient plasma (HemosIL Kit, IL) with a 1-stage method based on PT and aPTT. Factor XIII was screened with a clot solubility test with 5 mol/L urea or monochloroacetic acid. Clots from patients with less than 1% FXIII activity were considered soluble.
Qualitative determinations of FI were based on the Clauss method in human citrated plasma in an IL hemostasis system. An excess of thrombin was used to convert FI to fibrin in diluted plasma. At high thrombin and low FI concentrations, the rate of reaction indicates FI concentration.
For antigen assays, factor antigen levels were measured with enzyme immunoassays based on monoclonal or polyclonal antibodies against specific factors (Zymutest Fibrinogen ELISA, Hyphen-BioMed, Paris, France)
Thrombin Generation Assay
Blood was collected prospectively for this study by venipuncture into 0.105 mol/L trisodium citrate (ratio 9:1). Platelet-poor plasma (PPP) was prepared by centrifugation and was snap-frozen with liquid nitrogen and kept at –80°C up to 2 weeks until testing. The TG curve was plotted with a Fluoroskan Ascent Microplate Fluorometer (Thermo Scientific, Vantaa, Finland) and Thrombinoscope software (Thrombinoscope BV, Maastricht, the Netherlands), using a reagent with low PPP. Thrombin was measured with a fluorometer. A fluorogenic substrate was used in which the signal was not impaired by turbidity and measurements were not disturbed by clotting or platelets. The analytical program calculated all parameters in the thrombogram and expressed the results as the nanomolar amount of thrombin per time unit. The thrombogram comprised lag time (the moment at which thrombin formation starts, equivalent for practical purposes to clotting time), peak height (representing the maximal velocity of net thrombin production and reflecting maximal prothrombinase activity), time to peak (ttPeak) in minutes (time elapsed to maximal thrombin production), endogenous thrombin potential (ETP), area under the thrombogram (representing the total amount of substrate if available that can potentially be converted by thrombin), and start tail (the time when TG ends). 9
Statistical Analysis
The data were analyzed with Statistical Package for the Social Sciences version 17 software (SPSS, Chicago, Illinois). The distribution of quantitative variables including PT, aPTT, and BS was determined with the Shapiro-Wilk test. Because BS, PT, aPTT, and TG parameters were not normally distributed among patients, we used nonparametric tests for all related statistical analysis.
Quantitative variables are reported as the mean, median, and range. The TG parameters were compared between patients and healthy controls with the Mann-Whitney test. Comparisons of TG parameters between the groups were also illustrated in box and whisker plots.
Correlations between quantitative variables were calculated with Spearman correlation test. The Kruskal-Wallis test was used to compare quantitative variables among different groups.
To compare the ability of TG assays versus conventional tests (PT and aPTT) to predict the risk of bleeding, we generated areas under the receiver–operating characteristic (ROC) curve for both TG parameters and conventional tests for different BS values to establish cutoff values and estimate sensitivity, specificity, positive predictive value (PPV), and NPV. P values less than .05 (2-tailed) were considered statistically significant.
Results
The demographic characteristics and laboratory data of the study population are presented in Table 1. Of the 83 patients with RBD, 30% had FVII deficiency and 43.4% of the participants were male. Severe disease was observed in 45.8%, moderate disease in 27.7%, and mild disease in 26.5% of the patients. All patients had normal bleeding time.
Characteristics and Laboratory Data of Patients With Rare Bleeding Disorders.a
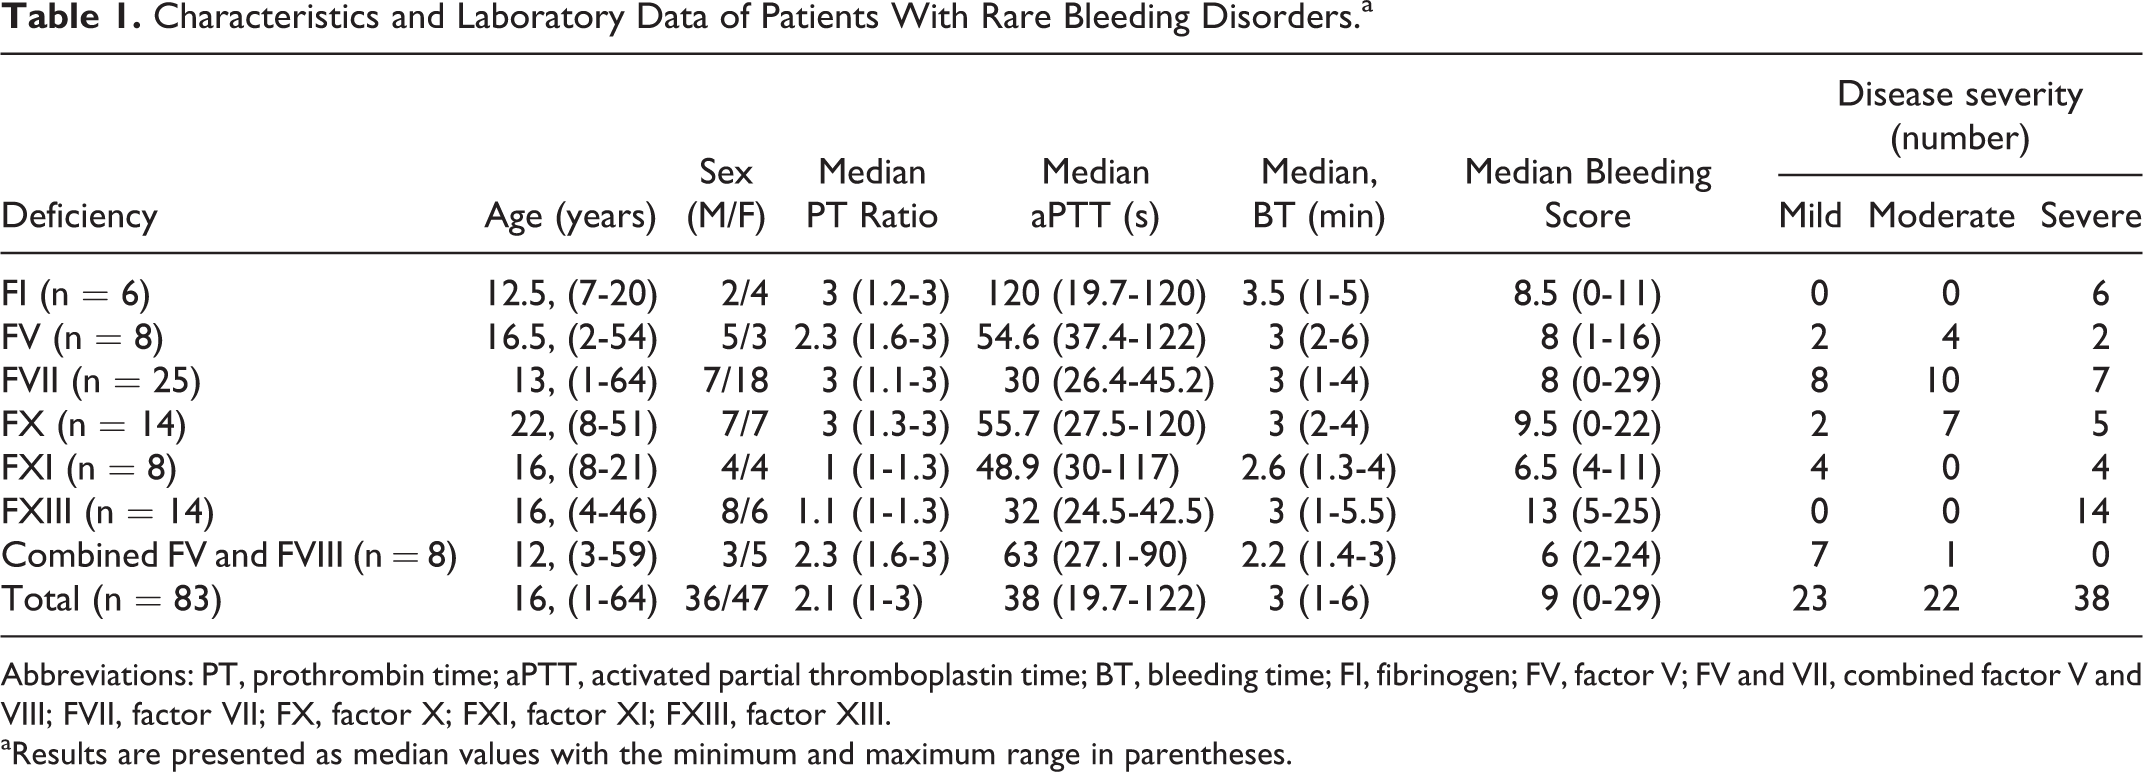
Abbreviations: PT, prothrombin time; aPTT, activated partial thromboplastin time; BT, bleeding time; FI, fibrinogen; FV, factor V; FV and VII, combined factor V and VIII; FVII, factor VII; FX, factor X; FXI, factor XI; FXIII, factor XIII.
aResults are presented as median values with the minimum and maximum range in parentheses.
A detailed description of the TG data from the 38 healthy individuals in the control population is given in Table 2.
Normal Ranges for Thrombin Generation Assays Determined From 38 Healthy Controls.
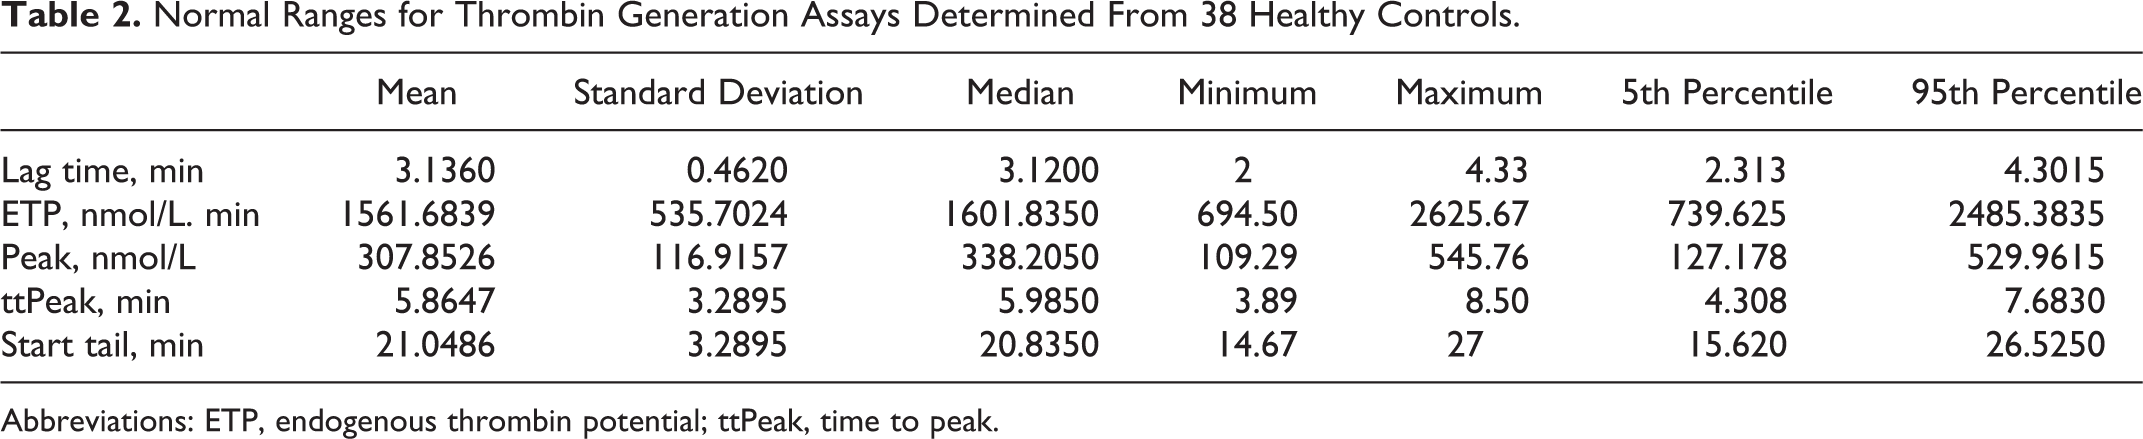
Abbreviations: ETP, endogenous thrombin potential; ttPeak, time to peak.
Figure 1 compares the TG parameters between patients with RBD and healthy individuals. Median ETP, lag time, peak, and ttPeak differed significantly between patients and healthy participants (P < .05).
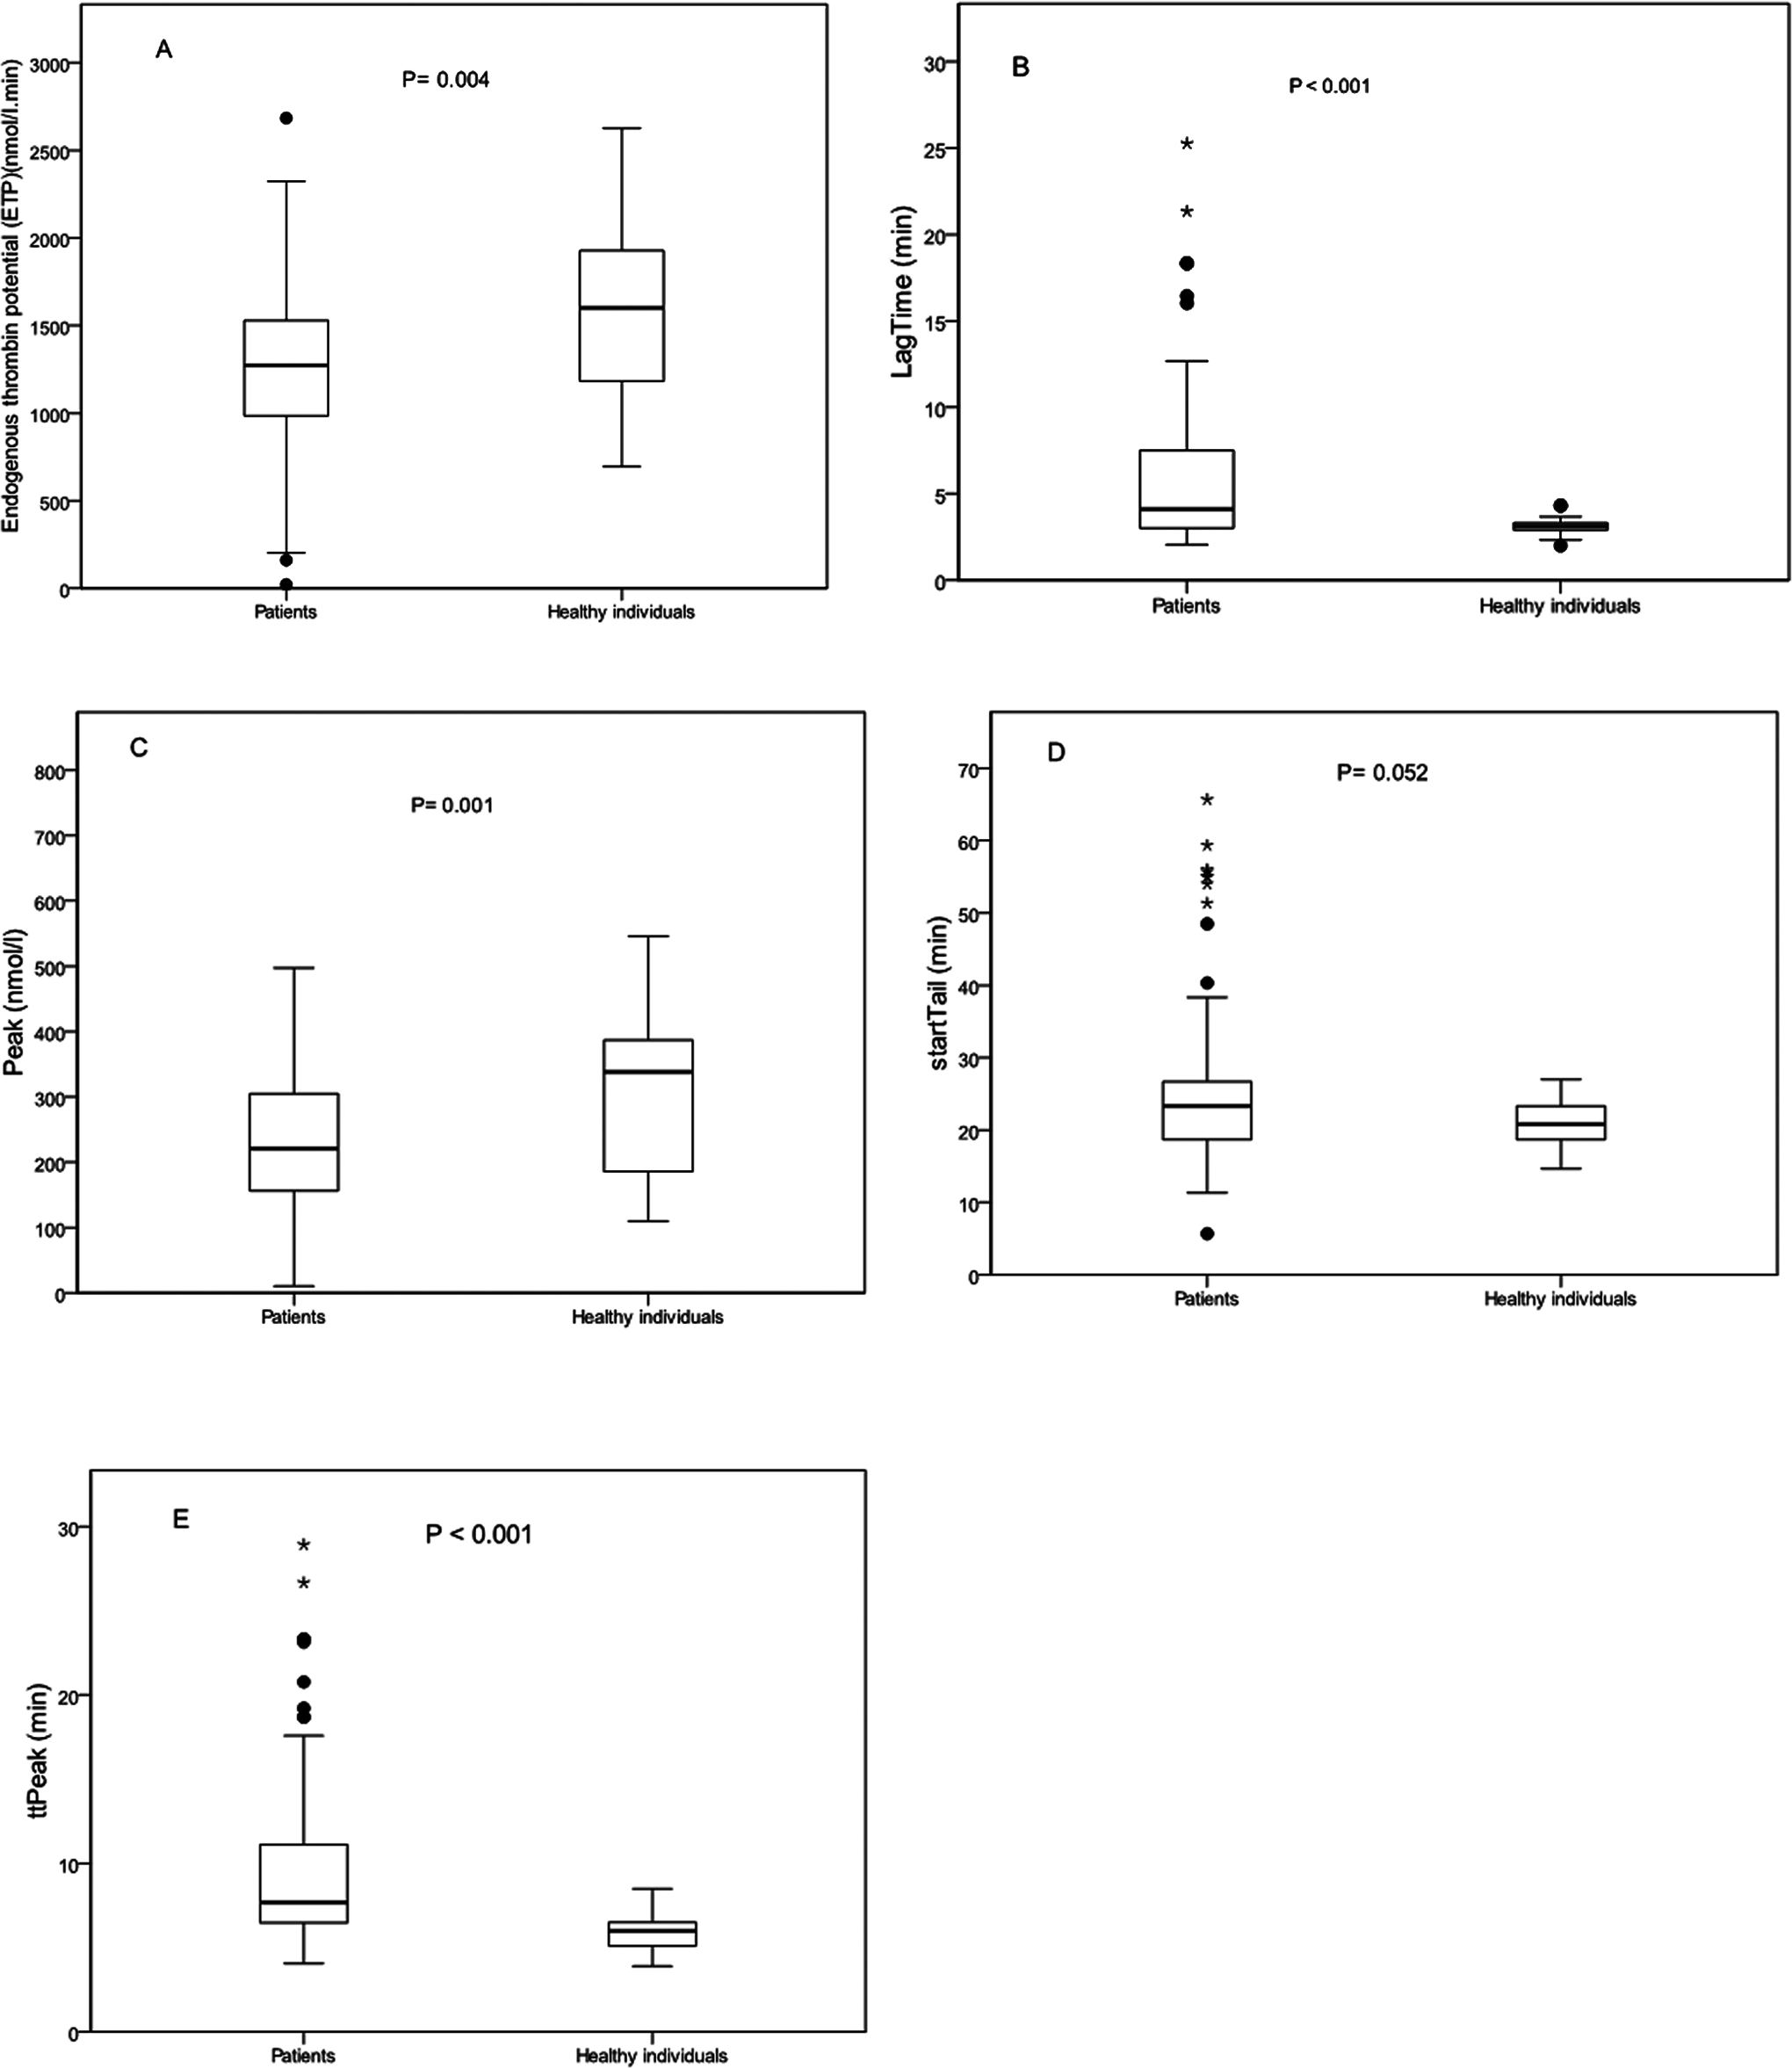
Box and whisker plots summarizing the values for endogenous thrombin potential (ETP), peak height, lag time, time to peak (ttPeak), and start tail in 83 patients with bleeding disorders compared to 38 healthy individuals (A, B, C, D, E) in thrombin generation assays. The line within the box is the median value and the lower and upper bars are the minimum and maximum values, respectively. The bottom line of the box is the 25th percentile, and the top line is the 75th percentile. Dots represent outliers that indicate values less than 1.5 times the lower quartile or more than 1.5 times of upper quartile.
Figure 2 compares the TG parameters in subgroups with different types of RBD and healthy controls. Statistically significant differences were observed for ETP in FI, FVII, and FX deficiencies, lag time in FV, FVII, FX, and FV & VIII deficiencies, and peak in FI, FVII, and FX deficiencies. In patients with FXI deficiency, the difference approached significance (P = .052). Significant differences were also found for ttPeak in FV, FVII, FX, FXI, and FV & VIII deficiencies and start tail in FVII, FX and FXIII deficiencies.
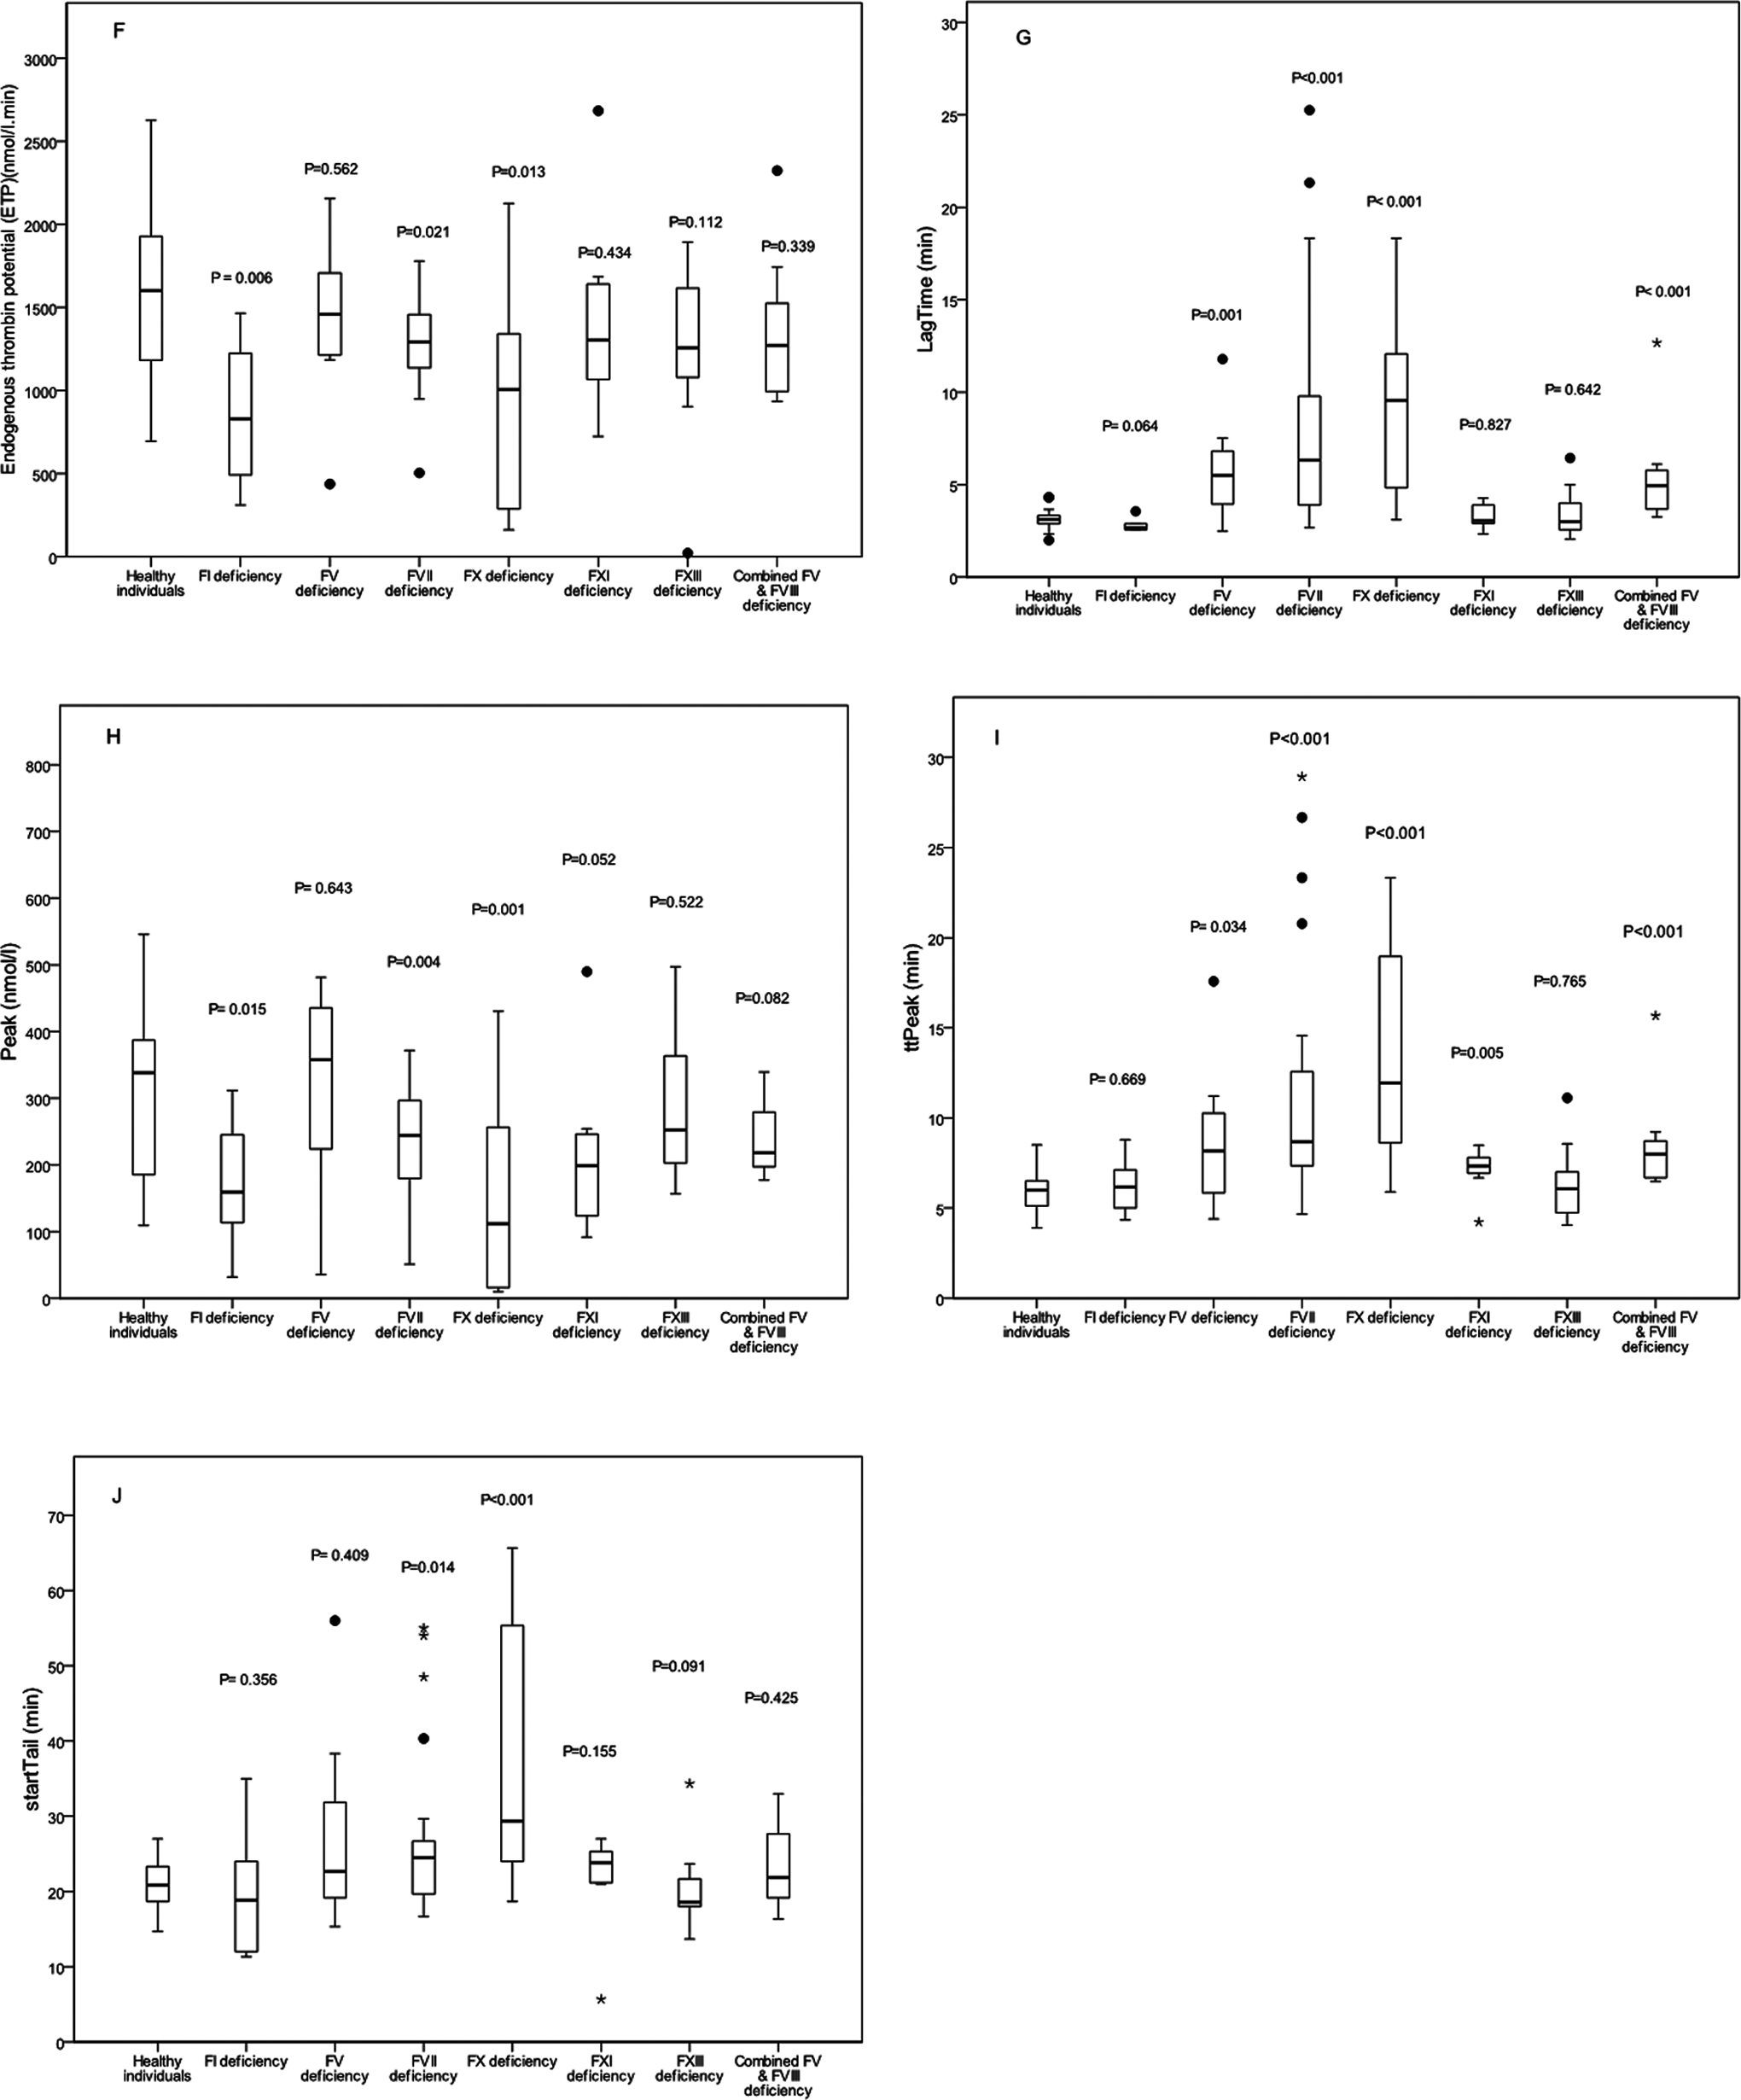
Box and whisker plots summarizing the values for endogenous thrombin potential (ETP), peak height, lag time, time to peak (ttPeak), and start tail in 83 patients with bleeding disorders with respect to the type of factor deficiency compared to 38 healthy individuals (F, G, H, I, J) in thrombin generation assays. P values are for the specific parameter in each type of bleeding disorder with the same parameter in healthy controls.
Mean BS for the entire sample was 9.77 ± 6.63 (median = 9 and range: 0-29). The BS correlated significantly with disease severity among patients with mild, moderate, and severe RBD (median: 5, 8.5, and 11, respectively, P < .0001). Based on these significant correlations, ROC curves for the TG parameters were generated with 3 levels of BS (5, 8.5, and 11) as well as BS = 13 to evaluate how well these tests predicted the risk of bleeding in patients with RBD. This analysis was also done for PT and aPTT as conventional coagulation tests.
Table 3 summarizes the ROC curve information, cutoff values, sensitivity, specificity, PPV, and NPV of TG assay for the risk of bleeding in patients with RBD. The TG parameters that yielded statistically significant results were lag time, ttPeak, and start tail. The results of ROC curve analysis for BS ≤5 were not statistically significant for any of the TG parameters (not shown).
Receiver–Operating Characteristic Curve Information, Sensitivity, Specificity, PPV, and NPV of Thrombin Generation Assay for Risk of Bleeding in Patients With Rare Bleeding Disorders.a
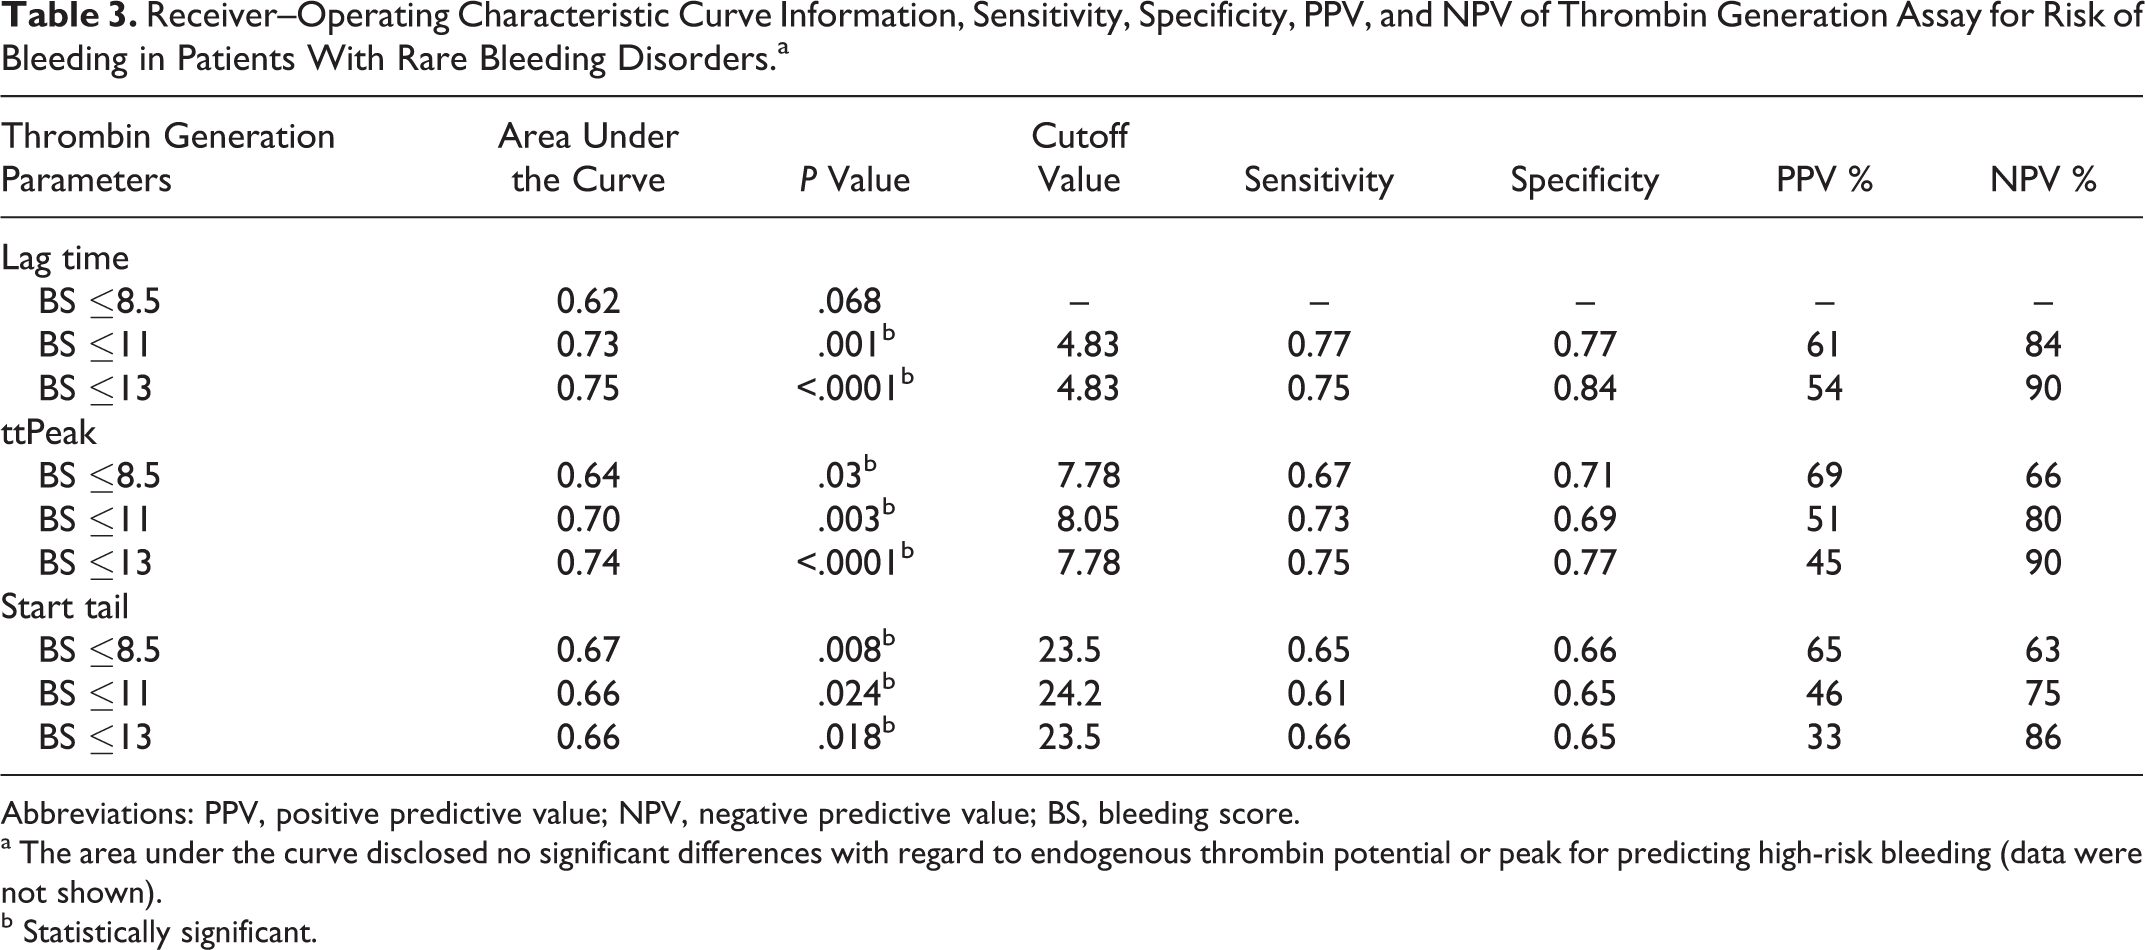
Abbreviations: PPV, positive predictive value; NPV, negative predictive value; BS, bleeding score.
a The area under the curve disclosed no significant differences with regard to endogenous thrombin potential or peak for predicting high-risk bleeding (data were not shown).
b Statistically significant.
The results of ROC curve analysis for the risk of bleeding were not significant with regard to PT and aPTT at different levels of BS (P > .05), and these parameters did not correlate significantly with BS. In contrast, the TG parameters lag time, ttPeak, and start tail showed modest although statistically significant positive correlations (r s < 0.3, P < .05) with BS (Table 4).
Correlation of TG Assay Parameters, PT, and PTT With Bleeding Score in Patients With Rare Bleeding Disorders.
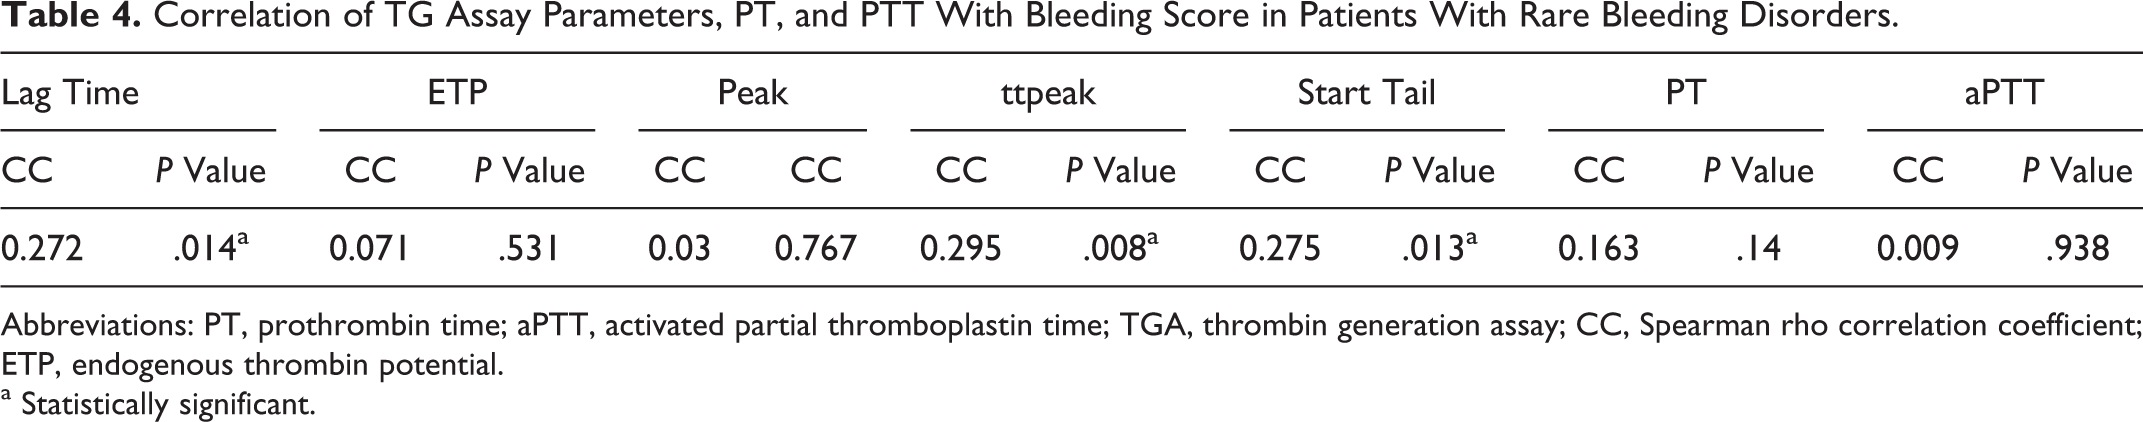
Abbreviations: PT, prothrombin time; aPTT, activated partial thromboplastin time; TGA, thrombin generation assay; CC, Spearman rho correlation coefficient; ETP, endogenous thrombin potential.
a Statistically significant.
We also evaluated the relationship between disease severity (based on residual coagulant activity of the deficient factor) and TG parameters in all RBD except FI and FXIII deficiencies, for which this classification was unavailable. Patients with severe disease had a significantly higher lag time (P = .002) and ttPeak (P = .013). Only PT but not aPTT showed a statistically significant correlation with disease severity (P < .0001).
Discussion
Based on the premise that the capacity of plasma to generate thrombin in vitro is a comprehensive and precise functional test of the clotting system, we designed a cross-sectional, single-center study to compare the results of TG assays in patients with RBD and healthy individuals and to determine which of the 2 diagnostic methods (TG assay vs conventional tests) correlates better with RBD phenotype (based on disease severity and BS) in southern Iran.
As expected, we found statistically significant differences in most TG parameters between patients with RBD and healthy individuals. However, this pattern was not observed in different subgroups of RBD, probably because of the small number of patients in each subgroup. A study by Al Dieri et al concluded that bleeding tendency becomes prominent when ETP falls by more than 20% of its normal value, although these authors obtained no evidence of a relationship between thrombin formation and hemostasis responses because of the low number of patients in their analysis. 5 Matsumoto et al studied patients with severe FVIII deficiency and concluded that TG is useful for monitoring coagulation function. 10 In one study of TG assays to monitor hemophilia therapy, Váradi et al showed that different doses of factor were able to normalize TG output. 11
Our literature search for earlier studies with the BS questionnaire 7 did not identify any precise correlations between BS and the risk of bleeding in patients with RBD. However, Tosetto et al evaluated the clinical usefulness of this tool to detect mild bleeding disorders in the general population and concluded that assuming a prevalence rate of 1%, the NPV of BS ≤ 3 as the cutoff value for a normal score was 99.2%. 8 As mentioned previously, disease severity and BS were significantly associated and we considered these 2 variables as determinants of the bleeding risk in patients. In this report, we considered the median BS for each level of disease severity (mild, moderate and severe) as well as BS = 13, to evaluate how well TG assay versus conventional tests can predict the risk of bleeding in patients with RBD. Based on the ROC curve analysis, we obtained NPVs of 86% to 90% for BS ≤13 and NPVs of 75% to 84% for BS ≤11, for 3 parameters of the TG assay (lag time, ttPeak, and start tail). However, the area under the curve for PT and aPTT was not significantly associated with different levels of BS.
Earlier studies of the clinical relevance of TG found diminishing TG output in different bleeding and thrombotic disorders, factor deficiencies, and thrombasthenias and also reported a relationship between ETP and bleeding symptoms.12,13 Our results identified significant positive correlations between bleeding tendency and lag time, ttPeak, and start tail in RBD. Similarly, Beltrán-Miranda et al reported a shorter lag time in patients with mild hemophilia A, although the association was not statistically significant. However, they detected a significant correlation between bleeding tendency and ETP in their study population. 14 In a retrospective study of RBD and TG, Geffen et al found prolonged lag time only in patients with FVII deficiency and reduced peak height in RBD, which was lower in major bleeders than minor bleeders. 15 On the other hand, the correlations between conventional tests and bleeding tendency were not statistically significant in the present study.
Our results supported previous reports that TG assay is a potentially useful tool to detect a higher risk of bleeding in patients with bleeding disorders.14,16,17,18 Nevertheless, it should be kept in mind that the results of TG assay are highly dependent on the methodology, and may be strongly influenced by large interlaboratory variability. Prospective multicenter studies with a standardized methodology are therefore needed.19,20
With regard to the association of disease severity based on plasma factor levels with TG assay and conventional test findings, we found significant associations for lag time and ttPeak. Beltrán-Miranda et al reported significant associations between increased ETP and peak with FVIII level in patients with hemophilia A. 14
Taken together, the results of our study suggest that TG assay is a more useful tool than PT or aPTT to evaluate the risk of bleeding in patients with RBD. Additional prospective multicenter studies will be needed with larger number of patients and a standardized methodology to verify our findings.
Footnotes
Acknowledgments
We thank Zohre Zahedi for support with patient data collection and Javad Gerdabi for laboratory data collection. We also thank Shiraz University of Medical Sciences for financial support. We thank Shirin Parand at the Hematology Research Center for help with manuscript preparation and K. Shashok (AuthorAID in the Eastern Mediterranean) for improving the use of English in the manuscript. We thank the Center for Development of Clinical Studies of Nemazee Hospital for statistical assistance.
Authors’ Note
This manuscript is based on work done in partial fulfillment of the requirements for the PhD degree awarded to Omid Reza Zekavat through project no. 5430. Omid Reza Zekavat contributed to the writing and data collection. Sezaneh Haghpanah contributed to drafting and writing the manuscript and the statistical analysis. Javad Dehghani, Abdolreza Afrasiabi, and Flora Peyvandi contributed to data collection. Mehran Karimi contributed to the study design, concept, and editing of the manuscript.
Declaration of Conflicting Interests
The author(s) declared no potential conflicts of interest with respect to the research, authorship, and/or publication of this article.
Funding
The author(s) received financial support for the research, authorship from Shiraz University of Medical Sciences, and/or publication of this article.