
Abstract
Keywords
Introduction
Targeting a higher hemoglobin level with erythropoiesis-stimulating agents (ESAs) has been demonstrated to result in higher mortality and adverse cardiovascular outcomes in both dialysis and nondialysis chronic kidney disease (CKD) patients.1,2 The Food and Drug administration (FDA) has updated the epoetin-alfa’s label.3,4 Secondary analyses of these trials suggest that ESA hyporesponsive patients seem to be at particularly high risk of adverse outcomes.5,6 In one study, the Correction of Hemoglobin and Outcomes in Renal Insufficiency (CHOIR) study, exposure to high epoetin-alfa dose when targeting a higher hemoglobin level was associated with worse outcomes. 2 A secondary analysis on the same cohort (CHOIR) suggested that a high dose of epoetin is associated with an increased risk of death, congestive heart failure–related hospitalization, stroke or myocardial infarction independent of targeted hematocrit (Hct). 5 Possible explanations include increased inflammation, platelet activation with a prothrombotic state, and endothelial cell activation. While the role of platelets in cardiovascular mortality in patients on high-dose ESAs was recently suggested, we have previously observed that anemia of CKD is associated with upregulation of tumor necrosis factor-α (TNF-α), and possibly interleukin (IL)-6 and IL-8 along with increased levels of these proinflammatory cytokines in patients treated with epoetin.7,8 Others have postulated heightened prothrombotic tendency due to higher hemoglobin levels, as well as the off target effects of ESAs on platelets and endothelial cells.7,9,10
Platelet activation has been shown to play an important role in atherosclerosis. 11 Several studies suggest increased levels of circulating activated platelets suggested by P-Sel, circulating microparticles (CMPs), and CD40 ligand (CD40L) levels in patients with acute coronary syndrome or myocardial ischemia.12–14 P-selectin ([Psel] or GMP-140, PADGEM, CD62P), a member of the selectin family, produced in the α-granule membrane of platelets, is an important marker of platelet activation, mediating inflammatory cell–endothelial adhesion, leading to atherosclerosis.15–17 Moreover, increased levels of soluble Psel (sPsel) is associated with progressive thickening of the arteries and predicts future cardiovascular events.18–21 Other biomarkers studied in relation to platelet activation include CD40L levels and CMPs. More recent data implicate the CD40-CD40L system in the pathogenesis and prognosis of atherothrombotic complications in cardiovascular disease (CVD).22,23 CD40L can induce endothelial cells to produce several components of an inflammatory response initiating the process of atherosclerosis. 24 Circulating microparticles are vesicular particles, which are presumably released with the activation of platelets. The membranes of microparticles are rich in glycoproteins Ib, IIb, and IIIa as well as Psel and thrombospondin. 25 These microparticles have been shown to accelerate thrombin generation. 26 Elevated levels of microparticles have been detected in patients with unstable angina, myocardial infarction, transient ischemic attacks. 27
The levels of platelet activation markers have not been extensively explored in patients with CKD, especially in patients on ESA. Based on limited data from nondialysis CKD and dialysis patients, these markers have been shown to predict increased risk of atherothrombotic events.28–31 In this study, we hypothesized that ESA exposure could be associated with platelet activation in anemic patients with CKD and that this could be the basis for heightened cardiovascular risk in these patients. We tested our hypothesis by examining markers of platelet activation, Psel, CD40L, and CMP in ESA-treated and ESA-naïve anemic patients with CKD.
Methods
Patient Cohort
The Brigham CKD cohort is a prospective observational cohort, established in 2004, designed to study the influence of specific modifiable factors on the risk of progression of CKD and the risk of CVD in patients with CKD. Inclusion criteria include patients aged ≥18 years and CKD defined as glomerular filtration rate (GFR) <60mL/min per 1.73m 2 or GFR ≥60 mL/min per 1.73m 2 with albuminuria. None of the patients were receiving dialysis. Estimated GFR (eGFR) was calculated by the Modification of Diet in Renal Disease (MDRD) II equation (eGFR [mL/min per 1.73 m 2 ] = 186 × [Cr (mg/dL)]−1.154 × [age]−0.203 × [1.21 if the patient is black] × [0.74 if the patient is a female]). Exclusion criteria included unwillingness to provide informed consent, patients who were hospitalized or had a thrombotic event or cardiovascular event 1 month prior to enrollment, institutionalized patients (nursing home resident, skilled nursing facility resident, prisoner), those with a life expectancy ≤6 months, known HIV patient, an active malignant neoplastic disease other than localized nonmelanoma skin cancer, patient’s on immunotherapy or immunosuppressive treatment for a primary or secondary renal disease, a previous diagnosis of multiple myeloma, and those patients enrolled in an intervention study. Accordingly, 100 patients out of 142, who had blood samples, were included for the analysis. The study was approved by the institutional review board at Partners Healthcare and an informed consent was taken from each patient. Treatment with ESAs and the dose utilized was ascertained by review of the longitudinal medical record, direct contact with the patient, and reviewing the pharmacy. The ESAs were administered within 1 month before the blood draw. A dose conversion of 300 U for each µg of darbepoetin alfa was used. 7
Biochemical Analysis
Citrated plasma, stored at −80°C until analysis, was used for sP-Selectin and CD 40 L analysis. The assay for sP-Selectin and CD40L employed the quantitative colorimetric sandwich immunosorbent assay technique (enzyme-linked immunosorbent assay [ELISA]; R&D Systems, Minneapolis, Minnesota). Briefly, a monoclonal antibody specific for sP-Selectin or CD40L was pre-coated onto a microplate. Standards and samples were pipetted into the wells, together with a polyclonal antibody specific for sP-Selectin or CD40L conjugated to horseradish peroxidase. After removal of unbound conjugated antibody, a substrate was added and color developed is proportional to the analyte concentration. The concentration of Psel was expressed in ng/mL. Grossly hemolyzed samples were not considered suitable for this assay. Citrated human plasma was used for estimation of CMP. In brief, the diluted assayed plasma sample, supplemented with calcium, factor Xa, and thrombin inhibitors, was introduced into one of the microplate wells coated with streptavidine and biotinylated annexin V, then incubated (zymuphen MP activity; Aniara corporation, Mason, Ohio). Following a washing step, the factor Xa-Va mixture containing calcium and purified prothrombin were introduced. When present in the tested sample, microparticles bind to annexin V and expose their phospholipids surface, thus allowing to FXa-FVa, in the presence of calcium, to activate prothrombin into thrombin. The phospholipids concentration is then the limiting factor. There is a direct relationship between the phospholipid concentration and the amount of thrombin generation, which is measured via its specific activity on the thrombin substrate. The reaction is stopped with 2% citric acid and absorbance is measured at 405 nm (A405).
For the simultaneous quantification of the inflammatory markers, such as IL-6, IL-8, TNF-α, and IL-10, multiplex human CVDs (HCVDs) biomarkers panels 1 and 3 were used (HCVD1-67AK-4Plex, HCVD3-67CK-6Plex; Linco Inc, part of Millipore, Massachusetts, and United States). The details of the analysis are described elsewhere. 7 All examined analytes were tested individually and in combination to ensure that there were no cross-reactions. The detailed methodology has been described elsewhere. C-reactive protein in blood was determined by a highly sensitive (hs) latex-based immunoassay (Dade Behring, Newark, Delaware) in collaboration with Paul Ridker/Nader Rifai laboratories at the Children’s hospital, Harvard Medical School, Boston. 32 The investigators were blinded to clinical characteristics of the patients being studied.
Statistical Analysis
Continuous data were analyzed with independent sample student t test and categorical data were analyzed with chi-square statistic in the analysis of demographic characteristics. The levels of Psel, CD40L, and CMP deviated from normal distribution and hence the median and interquartile range was used to represent the data. We used Mann-Whitney U test to compare between 2 non-normally distributed variables, while we used Kruskal-Wallis H test if more than 2 variables were present. Spearman correlation coefficients were calculated for pairs of continuous variables. Statistical analysis for increase in Psel levels was done by multiple linear regression after log-transforming Psel. The covariates for linear regression were age, GFR, hemoglobin, platelet count, dose of ESAs, and hypertension. All the covariates were continuous variables except for hypertension. A P value less than .05 was considered significant. SPSS version 15 (SPSS Inc, Chicago, Illinois) was used to analyze the data.
Results
Patient Characteristics by CKD-Associated Anemia
The baseline characteristics of the CKD cohort are presented in Table 1 . The mean age of patients in the cohort was 58.9 ± 16.8 years. Thirty percent of these patients were diabetic and 72% were hypertensive. Anemia was defined by modified World Health Organization (WHO) criteria as less than 12 g/dL in women and less than 13 g/dL in men or treatment with ESAs. 5 Of the 100 patients analyzed, 50 patients were anemic by the modified WHO criteria. These patients also had a significantly reduced eGFR calculated using the MDRD II equation and were predominantly stage 3 and stage 4 CKD (eGFR 15-60 mL/min); 53.8% patients had elevated Psel levels (normal <38.5 ng/mL), 98.8% of the patients had elevated CD 40 ligand levels (normal <137.8 ng/mL), and 96.3% had elevated levels of CMPs (normal levels <13.7 MP/nmol/L). Of the ESA-treated patients, 57% (N = 13) were on epoetin-alfa (median dose of 10 000 U/week) and 43% (N = 10) were on darbepoetin (median dose of 7000 U/week; a conversion of 300 U for each µg of darbepoetin alfa was done). 5 The mean duration of ESA therapy was 6.6 ± 2.5 month and the mean ESA dose was 112 ± 24 U/ week per kg.
Baseline Characteristics of Patients in the Brigham CKD Cohort a
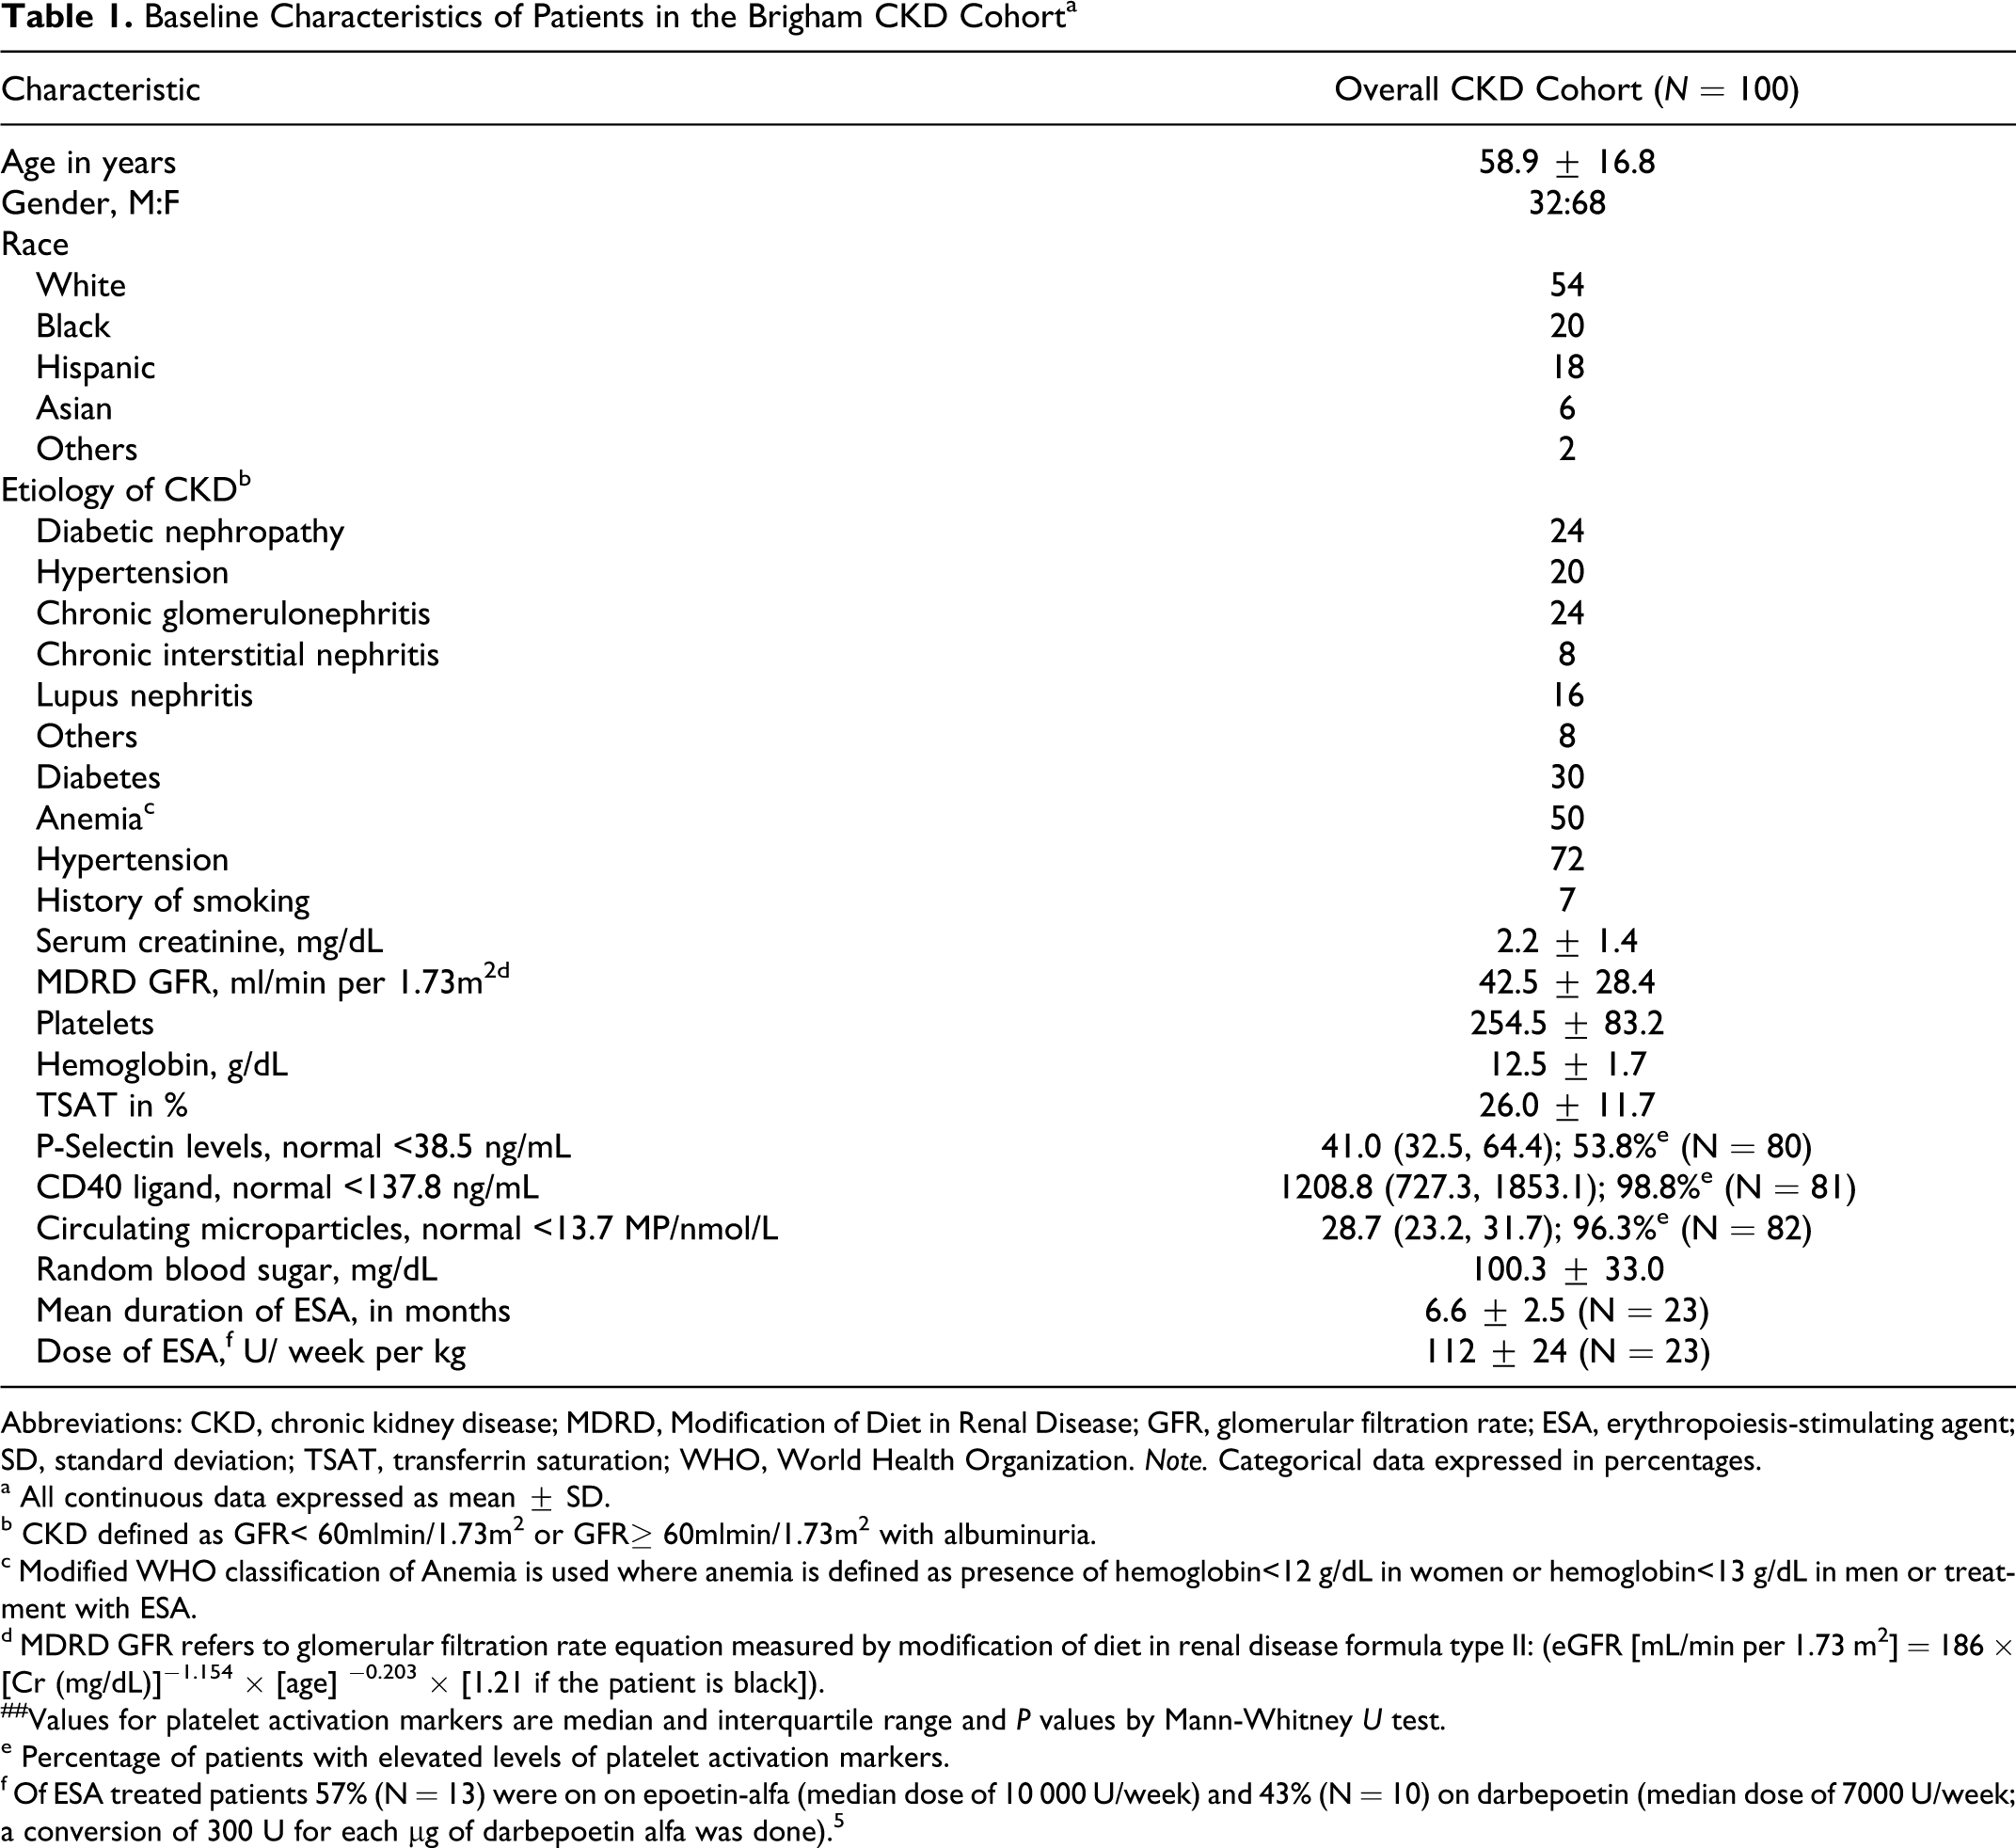
Abbreviations: CKD, chronic kidney disease; MDRD, Modification of Diet in Renal Disease; GFR, glomerular filtration rate; ESA, erythropoiesis-stimulating agent; SD, standard deviation; TSAT, transferrin saturation; WHO, World Health Organization. Note. Categorical data expressed in percentages.
a All continuous data expressed as mean ± SD.
b CKD defined as GFR< 60mlmin/1.73m2 or GFR≥ 60mlmin/1.73m2 with albuminuria.
c Modified WHO classification of Anemia is used where anemia is defined as presence of hemoglobin<12 g/dL in women or hemoglobin<13 g/dL in men or treatment with ESA.
d MDRD GFR refers to glomerular filtration rate equation measured by modification of diet in renal disease formula type II: (eGFR [mL/min per 1.73 m2] = 186 × [Cr (mg/dL)]−1.154 × [age] −0.203 × [1.21 if the patient is black]).
##Values for platelet activation markers are median and interquartile range and P values by Mann-Whitney U test.
e
f Of ESA treated patients 57% (N = 13) were on on epoetin-alfa (median dose of 10 000 U/week) and 43% (N = 10) on darbepoetin (median dose of 7000 U/week; a conversion of 300 U for each µg of darbepoetin alfa was done).5
Levels of Platelet Activation Markers in Anemic Patients After Sensitivity Analysis
Since there are different classifications for anemia, and definitions may be viewed as relatively arbitrary, we performed 3 sensitivity analyses for different hemoglobin levels (Table 2 ). The first sensitivity analysis was performed by strictly classifying patients based on the WHO criteria with or without including treatment with epoetin as a cause of anemia (WHO definition of anemia is ≤13 g/dL for adult male and ≤12 g/dL an adult female): 50 patients were classified as anemic. The levels of Psel, CMP, and CD40L were not significantly different (all Ps >.05). However, the absolute platelet count was significantly lower in anemic patients on ESA (P = .009). The second sensitivity analysis was performed based on the National Kidney Foundation (NKF) criteria for anemia (anemia is <13.5 g/dL for an adult male and <12 g/dL for an adult female): 42 patients were classified as anemic. The levels of the platelet activation markers did not differ between anemic, nonanemic, and anemic on ESAs, while there was a trend for lower platelet levels (.05) in anemic patients on ESAs. In the third sensitivity analysis, we used lower hemoglobin values to describe anemia, defining CKD anemia for both males and females as ≤12g/dL. The levels of platelets and platelet activation markers did not differ between the groups.
Platelet Activation Markers by Anemia and Treatment With ESAs: Sensitivity Analysis a
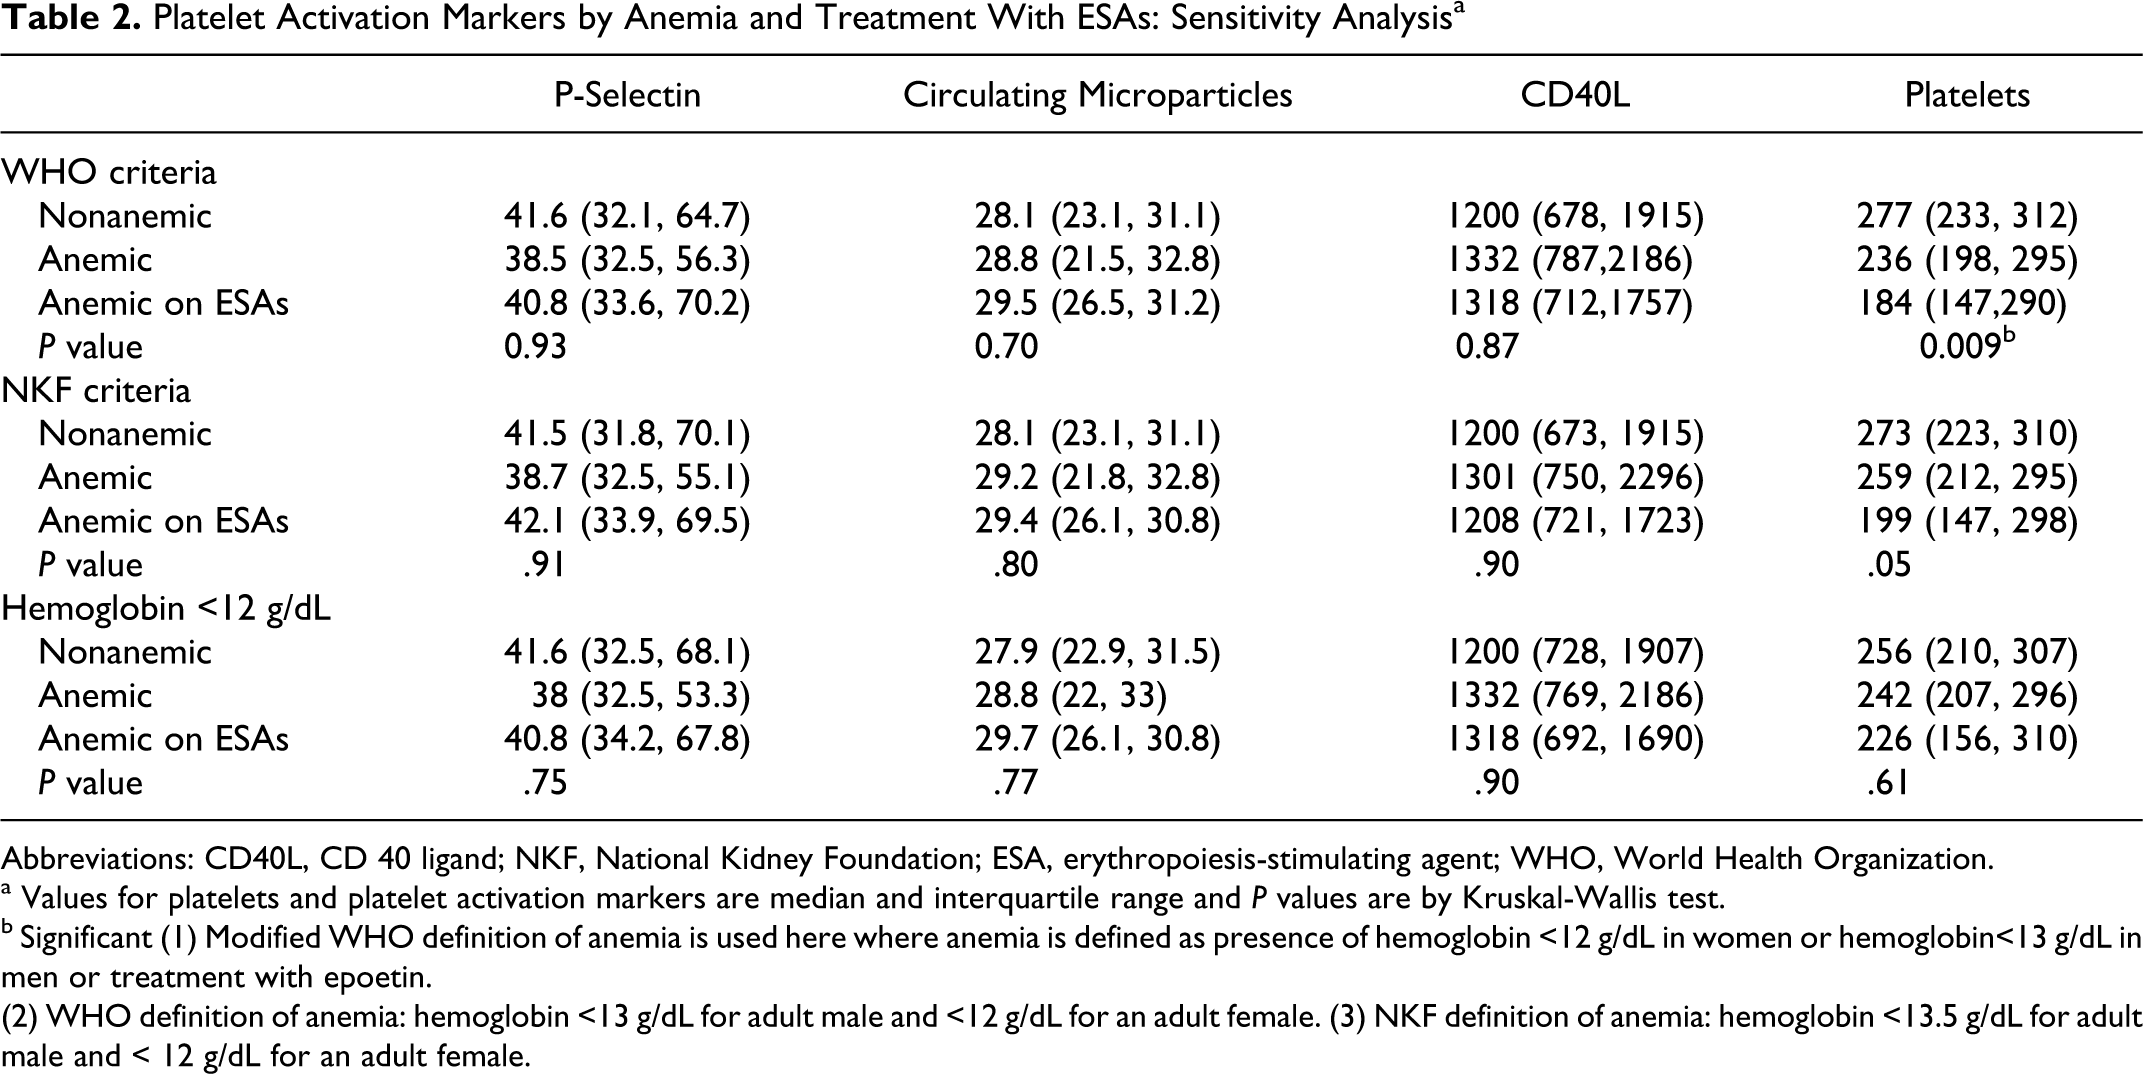
Abbreviations: CD40L, CD 40 ligand; NKF, National Kidney Foundation; ESA, erythropoiesis-stimulating agent; WHO, World Health Organization.
a Values for platelets and platelet activation markers are median and interquartile range and P values are by Kruskal-Wallis test.
b Significant (1) Modified WHO definition of anemia is used here where anemia is defined as presence of hemoglobin <12 g/dL in women or hemoglobin<13 g/dL in men or treatment with epoetin.
(2) WHO definition of anemia: hemoglobin <13 g/dL for adult male and <12 g/dL for an adult female. (3) NKF definition of anemia: hemoglobin <13.5 g/dL for adult male and < 12 g/dL for an adult female.
To understand the patterns of the platelet activation in patients with CKD, we performed Spearman rank correlation analyses, testing the correlation between the markers of platelet activation and other inflammatory markers and characteristics in the overall cohort (Table 3 ). P-selectin was positively correlated with CMP (Spearman correlation coefficient (rs ) = .41, P < .001) and CD40L levels (rs = .41, P < .001). However, Psel did not correlate with hemoglobin and inflammatory markers including albumin, ferritin, platelet count, C-reactive protein (CRP), and cytokines. As well, CMP did not demonstrate correlation with any of the inflammatory markers. The CD40L levels were positively correlated with CRP (rs = .30, P = .009).
Spearman Rank Correlation Coefficients Between the Markers of Platelet Activation and Other Inflammatory Markers and Characteristics in the Overall Cohort
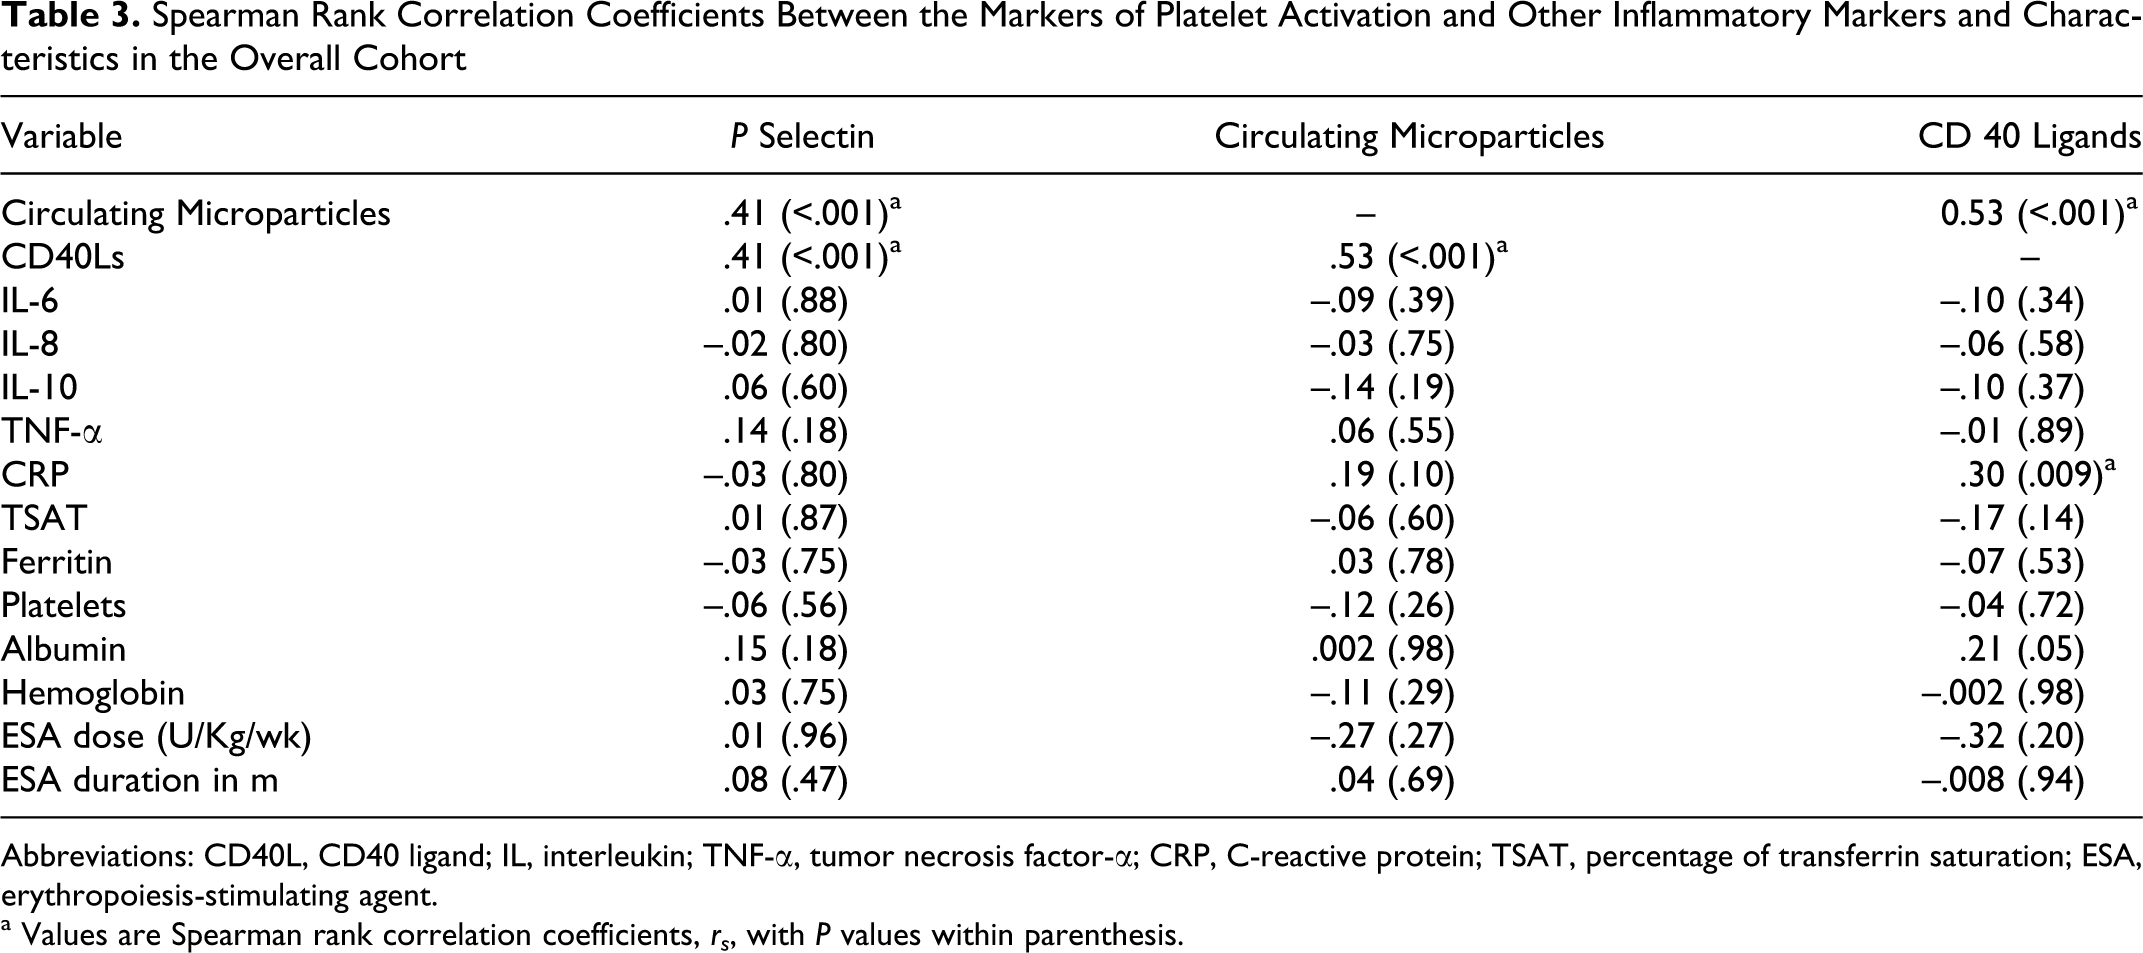
Abbreviations: CD40L, CD40 ligand; IL, interleukin; TNF-α, tumor necrosis factor-α; CRP, C-reactive protein; TSAT, percentage of transferrin saturation; ESA, erythropoiesis-stimulating agent.
a Values are Spearman rank correlation coefficients, rs , with P values within parenthesis.
We examined the association between Psel and other markers of platelet activation as well as biomarkers of inflammation, ESA dose, and duration of ESAs in individual subgroups after stratifying by anemia and treatment with ESAs (Table 4 ). Psel was positively correlated with CMP and CD40L in ESA-naïve anemic patients (rs = .69, P < .001 and rs = .56, P = .004, respectively) and nonanemic patients (rs = .52, P = .001, rs = −.50, P = .001, respectively), but not in patients on ESA treatment (rs = −.29, P = .24, rs = −.01, P = .96, respectively). P-selectin did not correlate with other inflammatory markers such as albumin, ferritin, total platelet count, or cytokines such as IL-6, IL-8, TNF-α and CRP levels, ESA dose, and duration of ESA treatment. We further analyzed correlation coefficients between markers of platelet activation and hemoglobin in different subgroups (Table 5 ). Higher hemoglobin levels positively correlated with Psel levels in patients on ESA treatment (rs = .50, P = .03), but not in ESA-naïve anemic patients (rs = −.16, P < .40) and nonanemic patients (rs = .03, P < .83). Hemoglobin was not associated with the other markers of platelet activation in any of the subgroups, although a trend for reduced levels of CMP with hemoglobin levels was observed in patients on ESA treatment (rs = −.31, P = .18).
Spearman Rank Correlation Coefficients Between P-Selectin Levels and Markers of Platelet Activation and Other Inflammatory Markers in the Nonanemic Patients, ESA-Naïve Anemic Patients and Patients on ESA
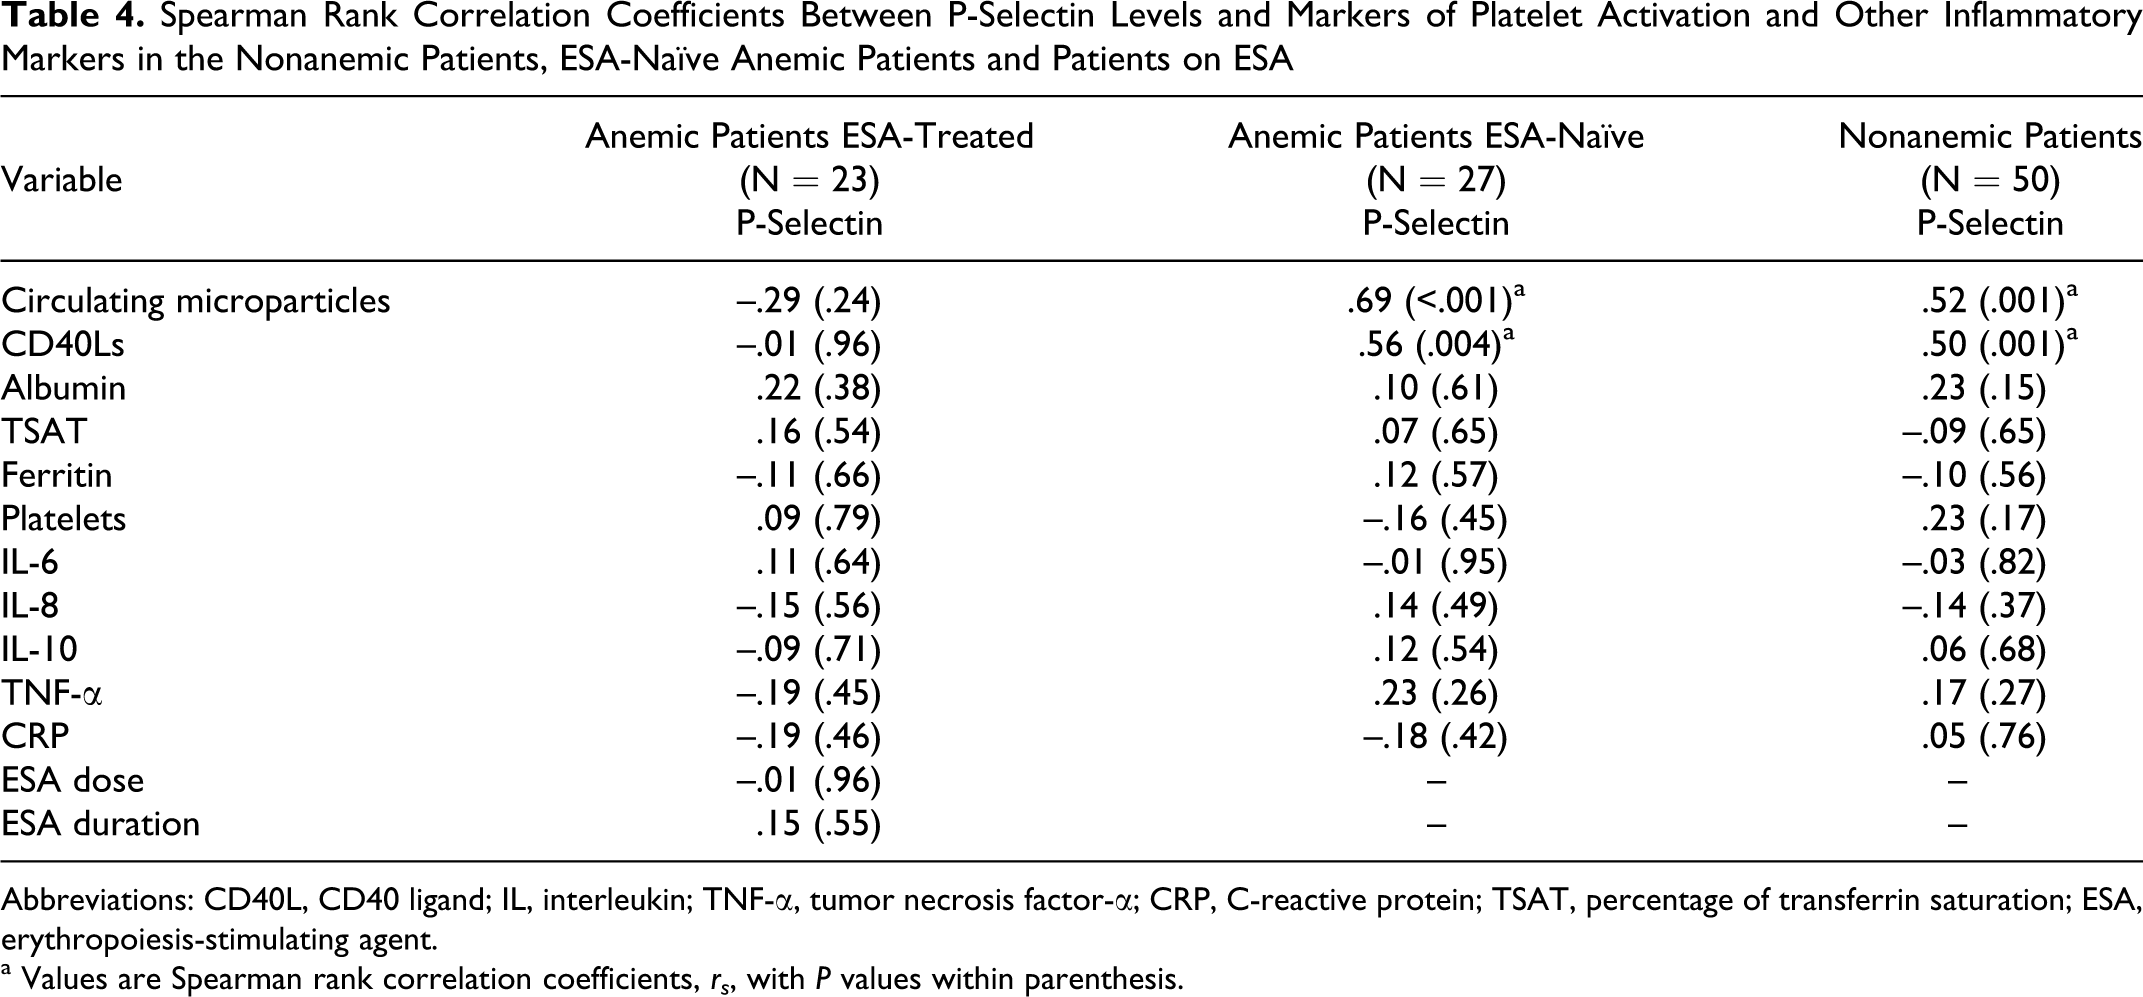
Abbreviations: CD40L, CD40 ligand; IL, interleukin; TNF-α, tumor necrosis factor-α; CRP, C-reactive protein; TSAT, percentage of transferrin saturation; ESA, erythropoiesis-stimulating agent.
a Values are Spearman rank correlation coefficients, rs , with P values within parenthesis.
Spearman Rank Correlation Coefficients Between Hemoglobin Levels and Markers of Platelet Activation in Nonanemic Patients, ESA-Naïve Anemic Patients and Patients on ESA a
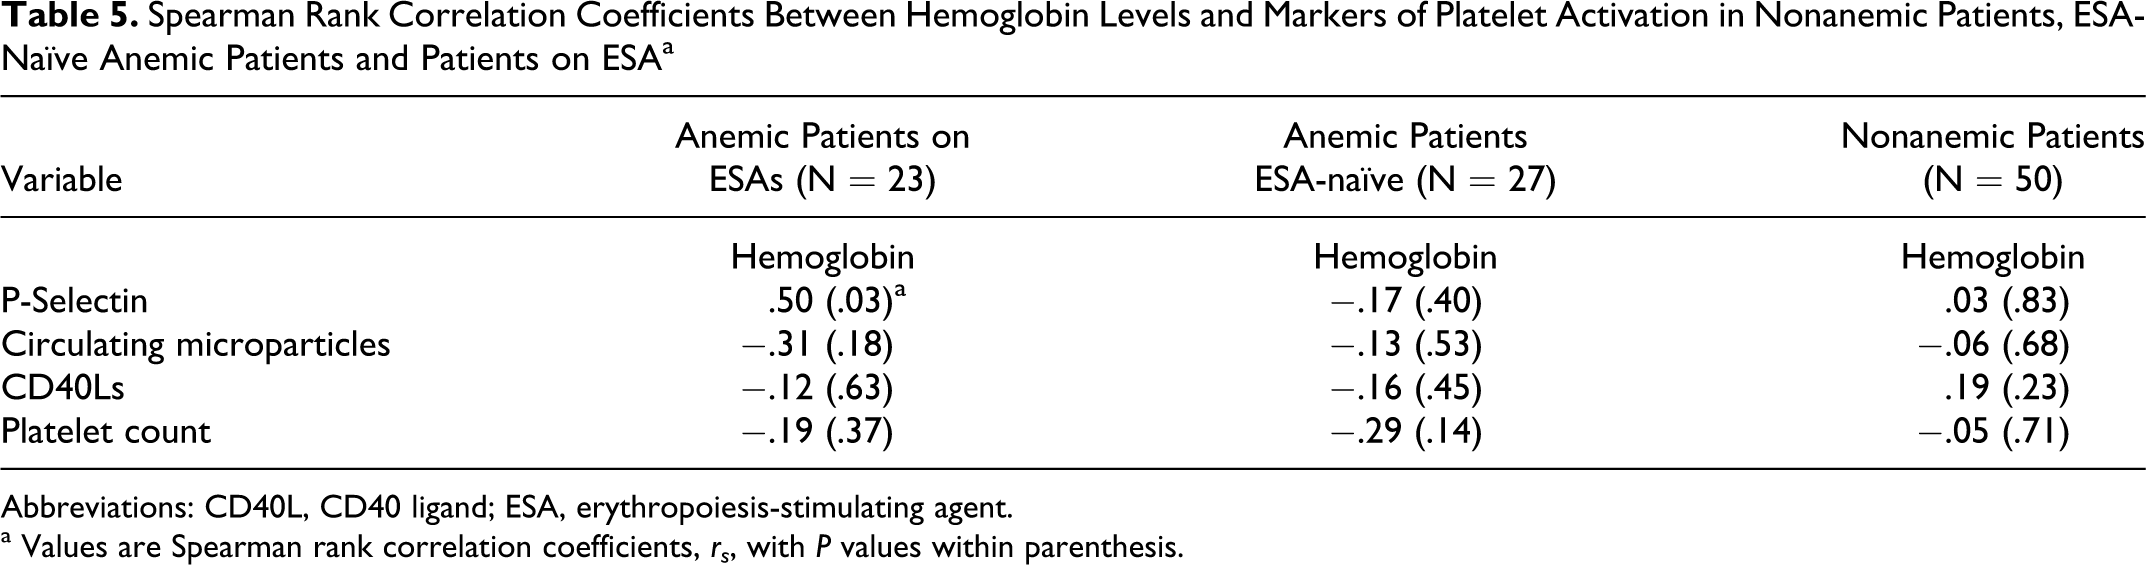
Abbreviations: CD40L, CD40 ligand; ESA, erythropoiesis-stimulating agent.
a Values are Spearman rank correlation coefficients, rs , with P values within parenthesis.
Results of stepwise multiple linear regression with 6 independent variables and log-transformed Psel levels as dependent variable is shown in Table 6 (R 2 = .558). Of the independent variables, such as hemoglobin, age, platelet count, MDRD GFR, dose of ESA, and hypertension, only hemoglobin was a significant predictor of log Psel levels (P = .01). There was a trend for an association between log Psel levels and hypertension (P = .07). (The variables are listed in the order in which they entered the regression analysis.) To further understand the potential relationship between Psel levels and hemoglobin in the cohort, a scatter plot with regression lines for each group, epoetin treated, epo-naïve anemic, and nonanemic was drawn (Figure 1 ). The scatter plot diagram demonstrated the association between Psel and hemoglobin, specific to epoetin-treated patients.
Factors Associated With Change in Log P-Selectin Levels in CKD Patients on ESA (R2 = .558)
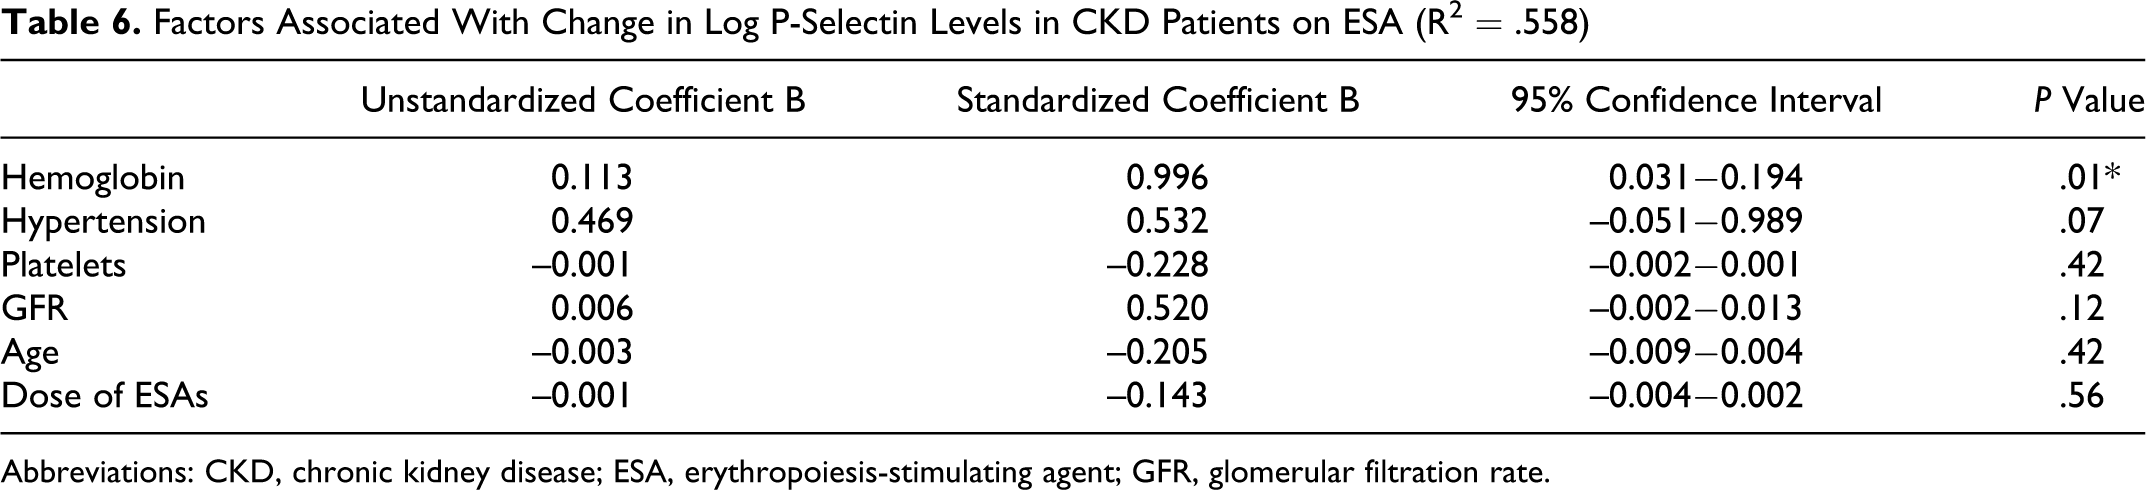
Abbreviations: CKD, chronic kidney disease; ESA, erythropoiesis-stimulating agent; GFR, glomerular filtration rate.
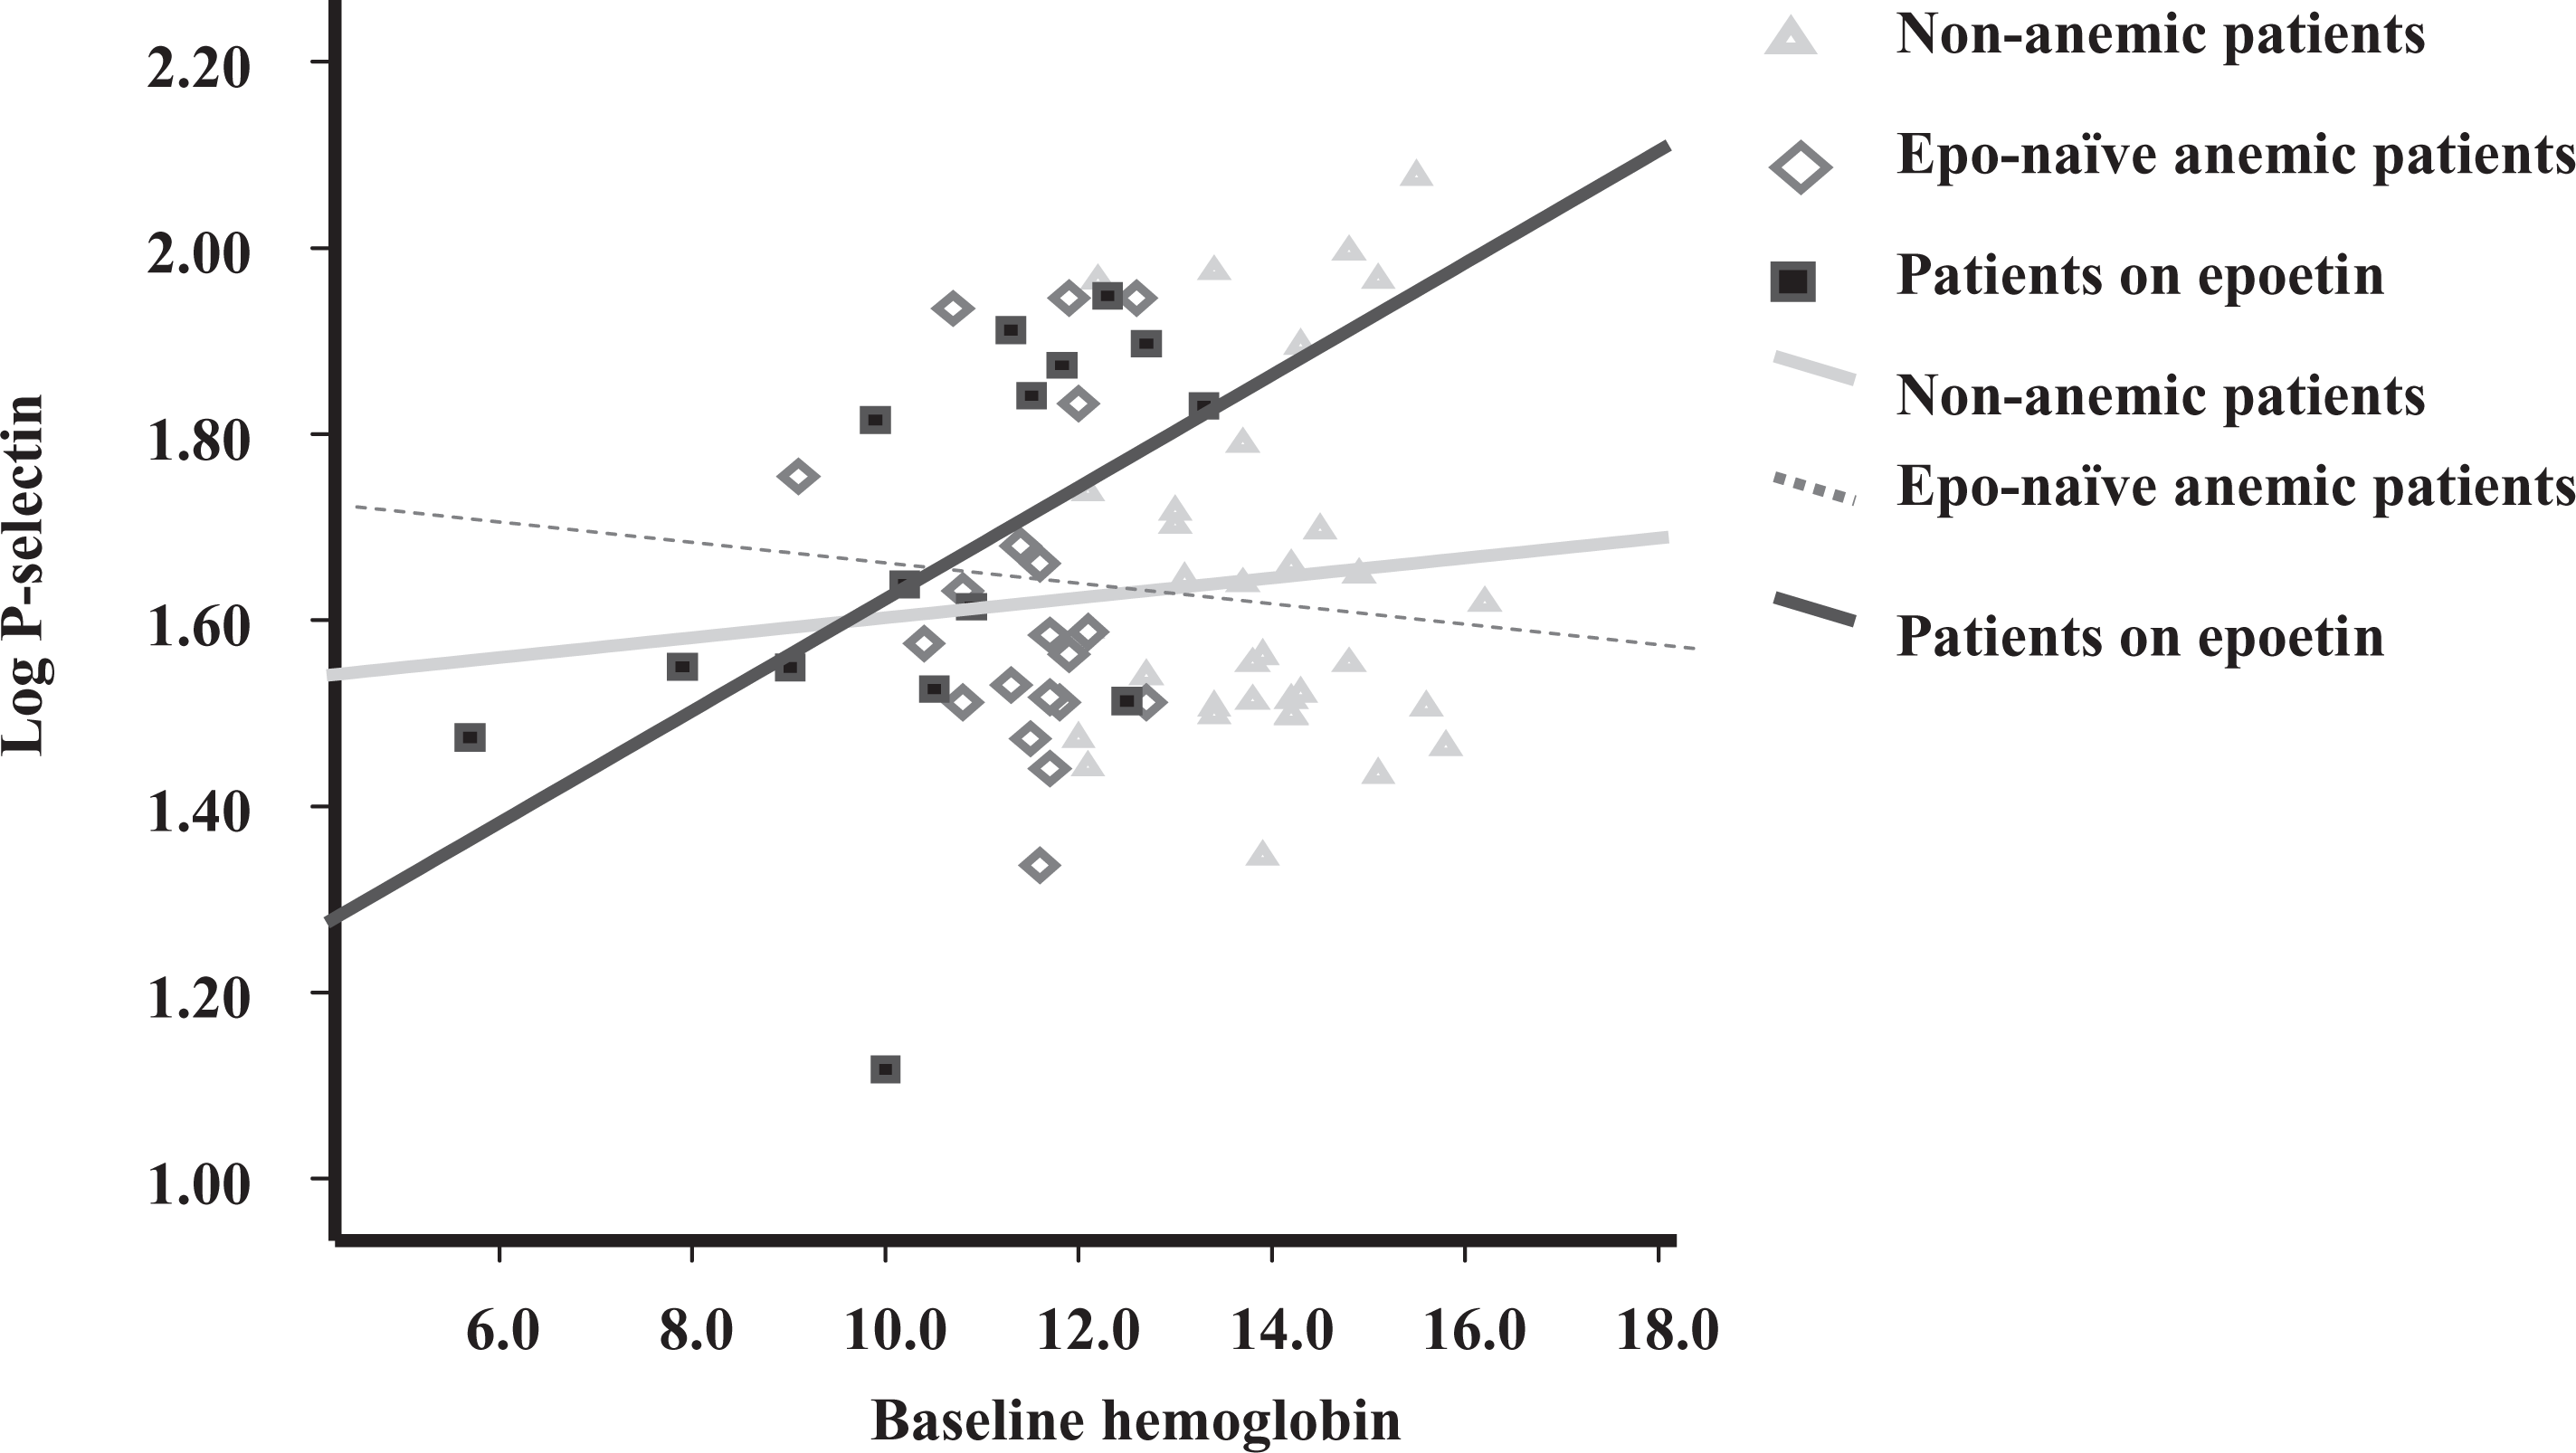
Scatter plot with regression line of mean hemoglobin with mean log Psel levels. Psel, P-selectin.
Discussion
The main findings in this study were that there was a significant increase in some markers of platelet activation in patients with nondialysis CKD. Further, higher hemoglobin levels were associated with increased Psel levels in patients on ESA treatment, but not in ESA-naïve CKD patients, suggesting a potential influence of ESAs in platelet activation when targeted for higher hemoglobin levels. Multivariate linear regression analysis adjusted for age, GFR, ESA dose, and platelet count demonstrated an association between increased Psel levels and hemoglobin levels and a trend for hypertension in patients on ESAs. These observations support the hypothesis that ESA exposure is associated with platelet activation, as assessed by Psel as well as other markers.
Platelet Activity and CKD
The Psel, CMP, and CD40L are markers of platelet activation that are strongly associated with cardiovascular mortality. These markers were elevated in our CKD cohort. Increased platelet activity in patients with CKD has been reported before.30,33,35 However, in these studies it is unclear whether elevated levels of cytokines in patients with CKD results from increased production or reflects reduced clearance because of renal impairment. However, there is limited information on the effect of hemoglobin and/or ESA treatment on platelet activation in patients with CKD. We have demonstrated an association between Psel and increased hemoglobin levels in anemic nondialysis patients on ESAs. The contribution of red blood cells (RBCs) to hemostatic function is poorly defined and frequently underestimated. But there have been published reports that they may activate platelets.36,37 It is speculated that red cells marginalize platelets within the blood vessel, and this rheological effect ensures platelets have access to damaged endothelium. The optimal Hct for RBCs to activate platelets is unclear. 38 However, reductions in Hct have been clearly shown to prolonged bleeding times (BTs). 39 Santos et al 37 suggested that RBCs are prothrombotic and that they enhance platelet production of thromboxane A2. Red blood cells are also known to enhance thrombin generation and to modulate the biochemical and functional responsiveness of activated platelets, though these observations have been made in the context of coagulopathy of massive transfusion and not in patients with CKD. 40 Escolar and associates reported that transfusion of 2 to 3 units of RBCs to 6 patients with a mean Hct of 23% and a mean BT of 12 minutes increased the mean Hct to 30% and reduced the mean BT to 8.6 minutes, with no change in the platelet count. In these patients after the RBC transfusions, improvement in the interaction of the platelets with the subendothelium was observed. 41 However, we found increase in P-Sel with hemoglobin exclusively in patients on ESA but not in ESA-naïve patients.
Platelet Activity and Hemoglobin Levels in Patients on ESAs
This association between ESA exposure and elevated Psel levels in nondialysis CKD patient is supported by evidence from previous studies. While we found a strong correlation between hemoglobin levels and Psel levels (Spearman rank correlation coefficient of .50; P = .03) in patients on ESAs, an earlier study has suggested increased platelet activation in dialysis patients on ESAs compared to ESA-naïve patients independent of hemoglobin levels. 42 However, the effect of dialysis membrane and modality on platelet activation was not evaluated. 43 The ESAs have been implicated in raising Psel in both healthy patients without kidney disease and in patients with CKD on dialysis.42,44 Our results support a potential role for ESAs in platelet activation in vivo and may provide some support for a platelet activation hypothesis. 45 Another important finding from our study was that there was no correlation between Psel, CMP, and CD40L levels in patients on ESAs, in contrast to ESA-naïve patients. Poor correlation between Psel and CD40Ls has been described in patients with and without coronary artery disease. 23 Indeed, this disconnect may suggest differential effects of ESAs on the pathways related to platelet activation markers. We also did not observe a significant association between the hemoglobin level and CMP in patients on ESAs and perhaps a negative trend. This was an unexpected observation since Ando et al demonstrated a significant elevation in platelet-derived microparticles (PMPs) levels in patients on ESAs. 30 However, Ando et al studied the effect of ESAs in both dialysis and nondialysis population unlike our exclusive nondialysis CKD patient cohort. Further, the dose of ESA was significantly higher in their study compared to that used in our study patients (148.9 ± 80 vs 112 ± 24 U/kg per week). As well, Ando et al did not explore a relationship with hemoglobin levels. Since microparticles originate from membrane shedding, and from apoptosis, it is possible that the antiapoptotic property of ESAs prevents formation of microparticles from platelets and endothelial cells, overwhelming the platelet-activating effect at higher hemoglobin levels. 46 This observation, if confirmed, suggests that CMP may not be a useful marker of platelet activation in patients on ESAs, or in patients on any antiapoptotic drugs. Indeed, more specific assays to evaluate platelet microparticle levels are available. Finally, earlier we reported an association between inflammation and anemia and exposure to ESAs and also endothelial activation and anemia.7,47 It can be hypothesized that anemia-associated endothelial damage and presence of inflammatory milieu can enhance platelet–endothelial interaction, leading to platelet activation while targeting higher Hcts with ESAs. This could perhaps explain cardiovascular events and thrombotic diathesis observed in patients achieving higher Hct with ESAs in both children and adults.2,48–50
Erythropoiesis-Stimulating Agent Platelet Activity or Count
A recent study suggested heightened platelet count in patients with higher doses of ESAs targeted for higher hemoglobin as a cause for increased mortality. 8 However, in our study we found relatively lower platelet count in patients on ESAs compared to ESA-naïve anemic or nonanemic patients. This could reflect concurrent inflammation confounding the assessment of platelet count in patients on ESAs. Studies also suggest that heightened platelet activity and platelet count may not always be a concurrent phenomenon. 51 Since platelet activity and not platelet count has been shown to impact cardiovascular outcomes and thrombotic diathesis, our emphasis on platelet activation markers could be considered appropriate.
The study had several strengths and limitations. While this study explored multiple markers of platelet activation in patients with CKD, the sample size was limited (n = 50 with only 23 patients on ESA), Furthermore, our study is observational in design, and we studied prevalent patients. However, our observation that hemoglobin is an independent predictor of Psel in patients on ESAs is hypothesis generating. The issue of confounding by indication also requires us to be cautious in the interpretation of the data; indeed, our observation on associations between platelet activation and ESAs requires further exploration and confirmation by longitudinal prospective studies. Finally we combined patients who were on either epoetin-alfa or darbepoetin and were unable to comment upon whether these drugs have differential effects. Since both drugs have similar biological effects, albeit with different pharamokinetic and pharmacodynamic characteristics, we assume that effects on platelet activation will be similar.
Conclusion
Our data show heightened platelet activation in anemic CKD patients receiving ESAs. Platelet activation may be important in inducing an atherothrombotic milieu in these patients that may be of pathophysiological importance. A potentially complex interplay between platelet activation, kidney function, and targeting higher hemoglobin with ESA treatment exist. An association between Psel and hemoglobin levels in anemic CKD patients on ESAs, but not in ESA-naïve anemic CKD patients was observed, raising a possible explanation for why ESA therapy may be associated with cardiovascular mortality under certain circumstances.
Footnotes
Authors’ Note
The authors Youssef M. K. Farag and Sai Ram Keithy-Reddy contributed equally to this paper.
Declaration of Conflicting Interests
The author(s) declared the following potential conflicts of interest with respect to the research, authorship, and/or publication of this article: Sai Ram Keithi-Reddy is currently a full-time employee of Amgen and holds stock in the company. This work was done when he was at Brigham and Women's Hospital.
Funding
The author(s) received no financial support for the research, authorship, and/or publication of this article.