
Abstract
Objectives: To investigate the effect of tissue factor pathway inhibitor-2 (TFPI-2) expression on biological behavior of BeWo and JEG-3 cell lines. Material and Methods: The expression of TFPI-2 in BeWo and JEG-3 cells was upregulated by pEGFP-N3-TFPI-2 and downregulated by small interference RNA transfection, confirmed by Western blotting assay and real-time polymerase chain reaction (RT-PCR). Boyden chamber, Cell Counting Kit-8 (CCK-8), and Hoechst 33258/terminal deoxynucleotidyltransferase-mediated UTP end labeling (TUNEL) assays were used for migration, invasion, and proliferation/apoptosis analysis, respectively. Results: In Western blotting and RT-PCR assay, protein and messenger RNA (mRNA) expression of TFPI-2 in transfected BeWo and JEG-3 cells were confirmed. Expression of TFPI-2 inhibited BeWo and downregulated JEG-3 cell migration, invasion, proliferation, and induced apoptosis (P < .05) in Boyden chamber, CCK-8, Hoechst 33258, and TUNEL detection, respectively. Conclusions: TFPI-2 expression caused invasion and proliferation impair and induced apoptosis in TFPI-2 regulated BeWo and JEG-3 cells. It provides a clue for potential role of TFPI-2 in trophoblast.
Keywords
Introduction
Tissue factor pathway inhibitor-2 (TFPI-2), produced abundantly in placenta together with its partial reserves in liver, muscle, heart, and kidney, 1,2 is a 32-kD Kunitz-type serine protease inhibitor. 3 A few studies have currently reported that it may be involved in coagulation pathway and cell pathology. 4–9 It not only participates in the regulation of extrinsic pathway of blood coagulation, 9,10 by inhibiting factor Xa and thrombin, 11–13 but also has effects on cell pathology mainly through inhibiting activation of matrix metallopeptidase-3 (MMP-3), MMP-9 in mitogen-activated protein kinase (MAPK) pathway and Ras system, 14 or regulating extracellular matrix (ECM) degradation and remodeling. 10
Moreover, our previous study demonstrated a gradually elevated level of TFPI-2 in maternal plasma and a dramatic decrease to nearly a nonpregnant level after delivery and a significantly increased expression in placenta in preeclampsia, indicating placenta as a main site of high level of TFPI-2 production in maternal circulation and potential role of TFPI-2 in preeclampsia pathogenesis, respectively. 15 In addition, there is growing evidence showing that TFPI-2 is related to impaired angiogenesis and dysfunctional implantation mediated by enhanced proteolysis and ECM. 14,16 However, further evidence is still needed to elucidate the definitive biological role of TFPI-2 in trophoblast.
Although human cancer cell lines have by nature impaired proliferation, BeWo and JEG-3 cells were chosen for the exploration of function of TFPI-2 in trophoblast cells as in previous researches, 17–21 considering that isolated trophoblast cells in normal placenta were technical-requiring and time-consuming. 22,23 In this study, transfection of BeWo and JEG-3 in an unstimulated state was applied for covering different levels of TFPI-2 expression to avoid the possible inference or bias caused by TNF-α and phorbol 12-myristate 13-acetate, despite significant stimulation of TFPI-2 expression reported in Iochmann et al’s research. 23
Hence, in this study, we have estimated the cell biological changes, including migration, invasion, and growth, in TFPI-2 upregulated and downregulated BeWo and JEG-3 cells. Therefore, we attempted to further explore the role of TFPI-2 in trophoblast biology in vitro for analyzing its possible effects on physiological and pathological pregnancy.
Material and Methods
Cells and Cell Culture
The choriocarcinoma cell lines BeWo and JEG-3 were obtained from American Type Culture Collection (ATCC, Manassas, Virginia). BeWo was cultured in ATCC-formulated F-12K medium No. 30-2004 with 10% fetal bovine serum (FBS) and JEG-3 in RPMI-1640 medium (Life Technologies, Cergy Pontoise, France) with 10% FBS at 37°C in a humidified atmosphere of 5% CO2 and 95% air. The medium was renewed 3 to 4 times every week and subcultured every 4 to 6 days by trypsinization according to ATCC protocol.
Construction of TFPI-2 Expression Vector, RNA Interference, and Transfection
A complementary DNA (cDNA) fragment encoding the whole coding region of human TFPI-2 cDNA (GenBank accession no. D29992) was isolated from a human placenta cDNA library (The Chemo-Sero-therapeutic Research Institute, Japan) by polymerase chain reaction (PCR) confirmed by a double-strand DNA sequencing of the plasmid. The fragment of TFPI-2 cDNA is inserted into Xho I- and Not I-digested pEGFP-N3 vector and was named as pEGFP-N3-TFPI-2 (Bioscience Clontech, Palo Alto, CA, No. U57609; Table 1). Three small interference RNAs (siRNA), siRNA1, siRNA2, and siRNA3, were bought from Shanghai Pufei Biotech (Shanghai, China) for targeting different coding regions of TFPI-2 (Table 1). Also, siRNA-NC was included as a negative control.
pEGFP-N3-TFPI-2, siRNA1, siRNA2, and siRNA3 were taken as experimental groups; the blank, pEGFP-vector, and siRNA_NC group were taken as control groups. Cells were harvested with 0.25% trypsin and seeded at a concentration of 5 × 10⁴ cells per well in 6-well or 24-well plate 24 hours before transfection. When the cells reached nearly 80% to 90% and 50% to 60% confluence, TFPI-2 expression vector and siRNA were added, respectively. Lipofectamine transfection reagent (Gibco Company, Grand Island, New York) and lipofectactamine-2000 (Invitrogen, Carlsbad, California) were used for transfection according to the manufacturer’s protocol. After 6 hours incubation, the above medium was replaced with F-12 medium with 10% FBS. Plates were incubated for 2 days in TFPI-2 expression vector groups and 3 days in siRNA groups. The transfected cells were washed with phosphate-buffered saline for 3 minutes twice.
Western Blotting Analysis
Cells were collected in a sodium dodecylsulphate (SDS) buffer containing β-mercaptoethanol, boiled for 10 minutes, separated on 12% SDS-polyacrylamide gel electrophoresis, electroblotted onto nitrocellulose membranes, and blocked with 5% nonfat dry milk in 10 mmol/L Tris-HCl, 150 mmol/L NaCl, pH 7.4, and 0.1% Tween-20 (tris-buffered saline Tween-20 [TBST]) for 1 hour at room temperature. Then, the membranes were incubated overnight with anti-TFPI-2 antibody (Key Laboratory of Molecular Medicine, Ministry of Education, China), 24,25 diluted 1:5000 in TBST on ice, while glyceraldehyde-3-phosphate dehydrogenase (GAPDH) 1:10 000 is used as control. Conjugated anti-rabbit secondary antibody 1:10 000 (BD Pharmingen, San Diego, California) was added for 1 hour incubation at room temperature. The immunoreactivity was visualized by ECL Western blotting system (Amersham Pharmacia Biotech, USA). Each experiment was repeated 3 times.
Real-Time Polymerase Chain Reaction
Total RNA was extracted from the cells using AxyPrep Multisource Total RNA Miniprep Kit (Axygen, AP-MN-MS-RNA-50, CA, USA). The obtained RNA was used for reverse transcription and PCR with QIAGEN OneStep Real-Time (RT)-PCR Kit (QIAGEN, 210210, CA, USA). The cycling conditions were 72°C for 5 minutes, followed by 30 cycles at 72°C for 60 seconds, at 60°C for 15 seconds, and at 72°C for 1 minute, and a final extension of 72°C for 5 minutes. One fourth (5 µL) of the each reaction was separated on a 3% agarose gel and visualized by ethidium bromide staining. Each experiment was repeated 3 times.
Cell Migration and Invasion Assays
Boyden chamber was used for cell migration analysis. Sterile 8-µm pore size polycarbonate filters (BD Pharmingen) were hydrated with 150 µL serum-free medium at room temperature overnight before use. The lower compartment of a 24-well plate was filled with 600 µL of F-12 medium supplemented with 10% FBS and the upper compartment was added with 300 µL serum-free F-12 medium containing 5 × 10⁴ cells/mL. The plate was incubated at 37°C in a humidified atmosphere of 5% CO2 and 95% air for 12 hours. The filters were removed and stained with 0.1% crystal violet. After cells on the upper side of the filter were removed gently with a cotton swab, cell numbers were counted in 5 separate fields under a light microscopy at ×200 magnification. Data were presented as mean ± standard deviation (SD) and each experiment was repeated 3 times with each treatment given in triplicate.
Sterile 8-µm pore size polycarbonate filters (BD Pharmingen) were coated with 6 µg/mL Matrigel (Becton Dickinson, Stockholm, Sweden) and hydrated with 150 µL serum-free medium at 37°C in a humidified atmosphere of 5% CO2 and 95% air overnight. Further suspension, incubation, staining, and data analysis were done as mentioned above in Cell Migration and Invasion Assays section.
Cell Viability Assay
Preincubate a 96-well plate at 37°C in a humidified atmosphere of 5% CO2 and 95% air for 24 hours. A 100-µL cell suspension (5 × 10⁴ cells/mL), harvested at 0, 24, 48, 72, and 96 hours after valid tranfection, was seeded to each well of the plate, and the plate was incubated for 4 hours at 37°C. Each well was added with 10 µL Cell Counting Kit-8 (CCK-8; Dojindu) solution and incubated for 90 minutes at 37°C. The absorbance at 450 nm was measured using a microplate reader. Data were presented as mean ± SD for each experimental condition. Each experiment was repeated 3 times with each treatment given in triplicate.
Cell Apoptosis Assay
Terminal deoxynucleotidyltransferase-mediated UTP end labeling (TUNEL) and Hoechst staining were performed for cell apoptosis assay. Nuclear fragmentation was determined in fixed cells by incubating in TUNEL staining (Beyotime, One Step TUNEL Apoptosis Assay Kit C1086) or Hoechst 33258 (Beyotime, China, Hoechst Staining Kit C0003) according to manufacturer’s protocol. Cell number of TUNEL positive or Hoechst staining positive was counted in 10 separate fields under a light microscopy at ×200 magnification. Data were calculated as mean ± SD and presented as apoptosis index (AI) and TUNEL positive (%) for each experimental condition. AI = Hoechst staining positive cell number; TUNEL positive (%) = TUNEL positive cell number/cell number × 100. Each experiment was repeated 3 times with each treatment given in triplicate.
Statistical Analysis
Statistical analysis was carried out by Student t test for normally distributed data or Kruskal-Wallis one-way analysis of variance for nonparametric test. Statistical significance was accepted at P < .05. Statistic analyses were performed using the package SPSS (Statistical Analysis System, Chicago, Illinois, version 15.0 for Windows).
Results
Transient Expression of TFPI-2 in BeWo and JEG-3 Cell Lines
After transfected with established pEGFP-vector or siRNA, both protein and messenger RNA (mRNA) expressions of TFPI-2 in BeWo and JEG-3 cells were confirmed by Western blotting analysis and RT-PCR, respectively. Normalized by GAPDH with molecular mass of 34 kDa, stronger TFPI-2 protein expression with more apparent 32 kDa band was detected in pEGFP-N3-TFPI-2 group than in pEGFP-N3-vector group, while less apparent band was detected in siRNA1-3 group than in siRNA_NC group. Western blotting analysis showed that TFPI-2 protein expression of TFPI-2 was obviously raised in pEGFP-N3-vector group and inhibited in siRNA1-3 group in BeWo and JEG-3 cell lines (Figure 1A, B).
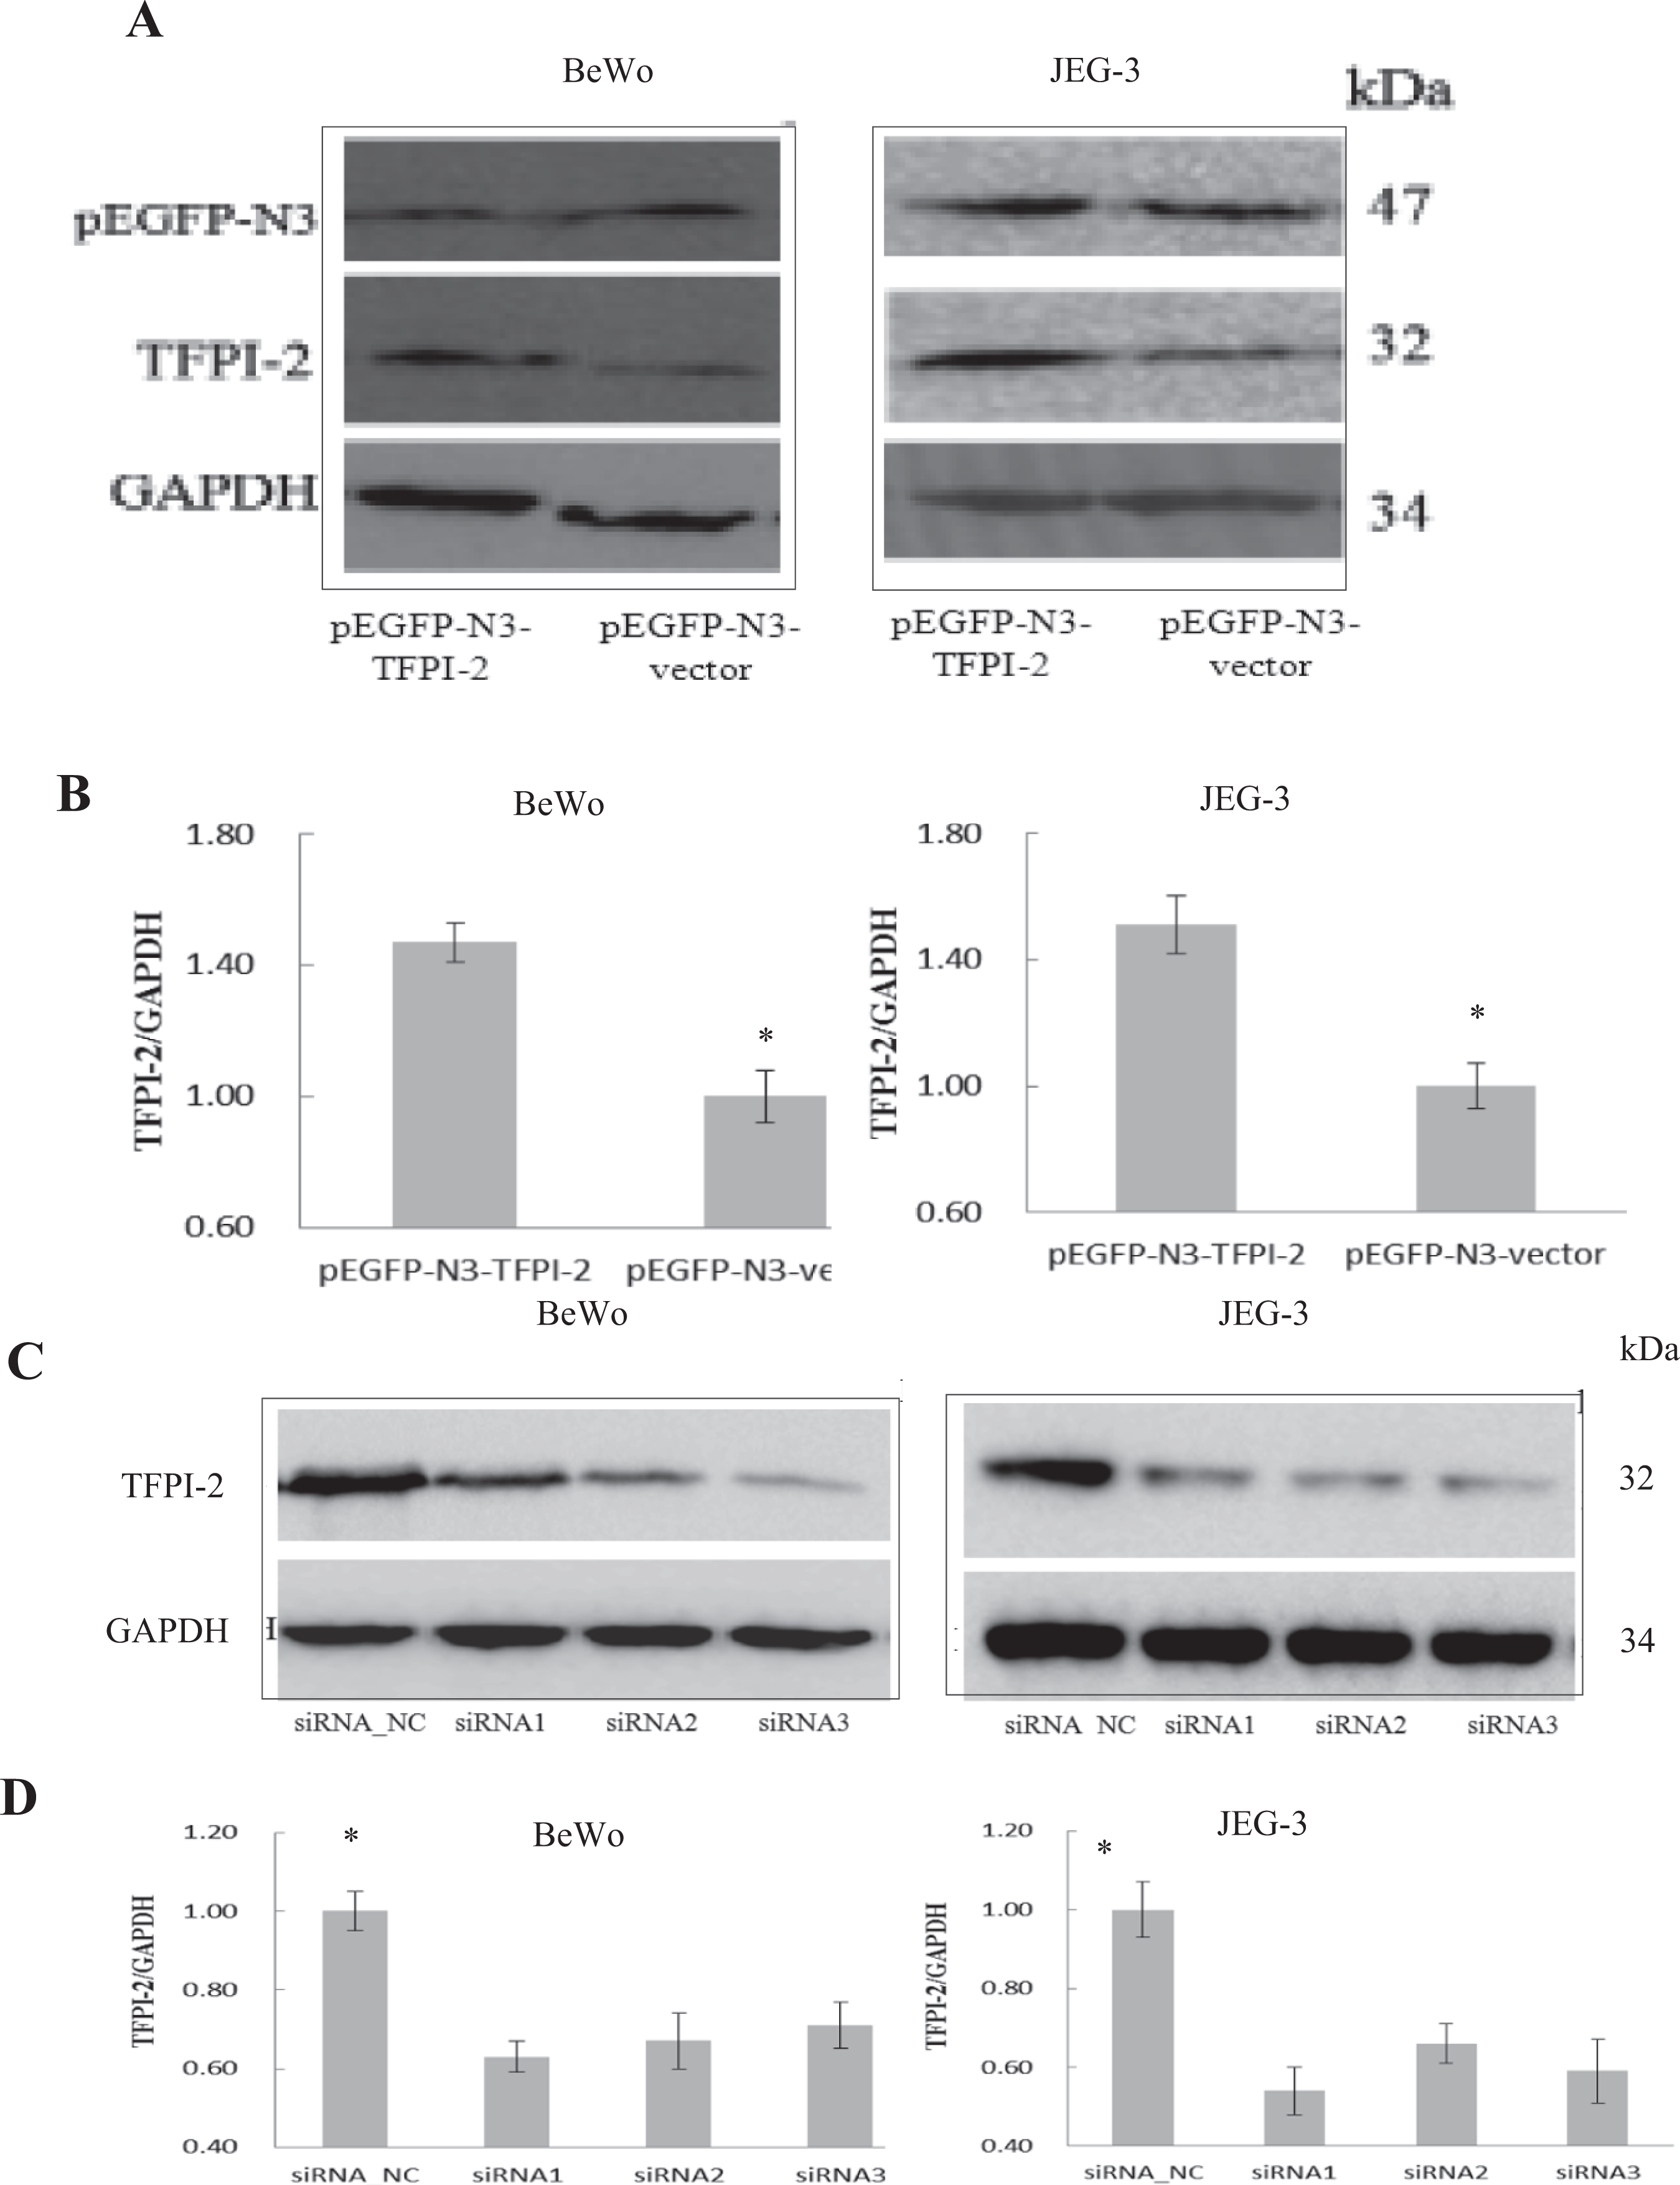
A, Comparison of protein expression of elevated TFPI-2 level detected by Western blotting among BeWo and JEG-3 cell groups. B, Comparison of mRNA expression of elevated TFPI-2 level detected by Western blotting among BeWo and JEG-3 cell groups. C, Comparison of protein expression of decreased TFPI-2 level detected by Western blotting among BeWo and JEG-3 cell groups. D, Comparison of protein expression of decreased TFPI-2 level detected by Western blotting among BeWo and JEG-3 cell groups. Data were shown as means ± SD in each group. *P < .05 when compared with pEGFP-N3-vector or siRNA_NC group. TFPI-2 indicates tissue factor pathway inhibitor 2; SD, standard deviation.
In RT-PCR, pEGFP-N3-TFPI-2 group showed nearly 1.5-fold increase of TFPI-2 mRNA level as normalized by GAPDH level when compared with that of pEGFP-N3-vector group (P < .05) in BeWo and JEG-3 cells, while siRNA1-3 group showed mRNA expression of 40% to 60% reduction compared with that of siRNA_NC (P < .05), indicating that transcriptional expression of TFPI-2 was significantly increased in pEGFP-N3-vector group and decreased in siRNA1-3 group (P < .05, Figure 1C, D). There was no significant difference in protein and mRNA expressions between pEGFP-N3-vector and siRNA_NC group of BeWo and JEG-3 cells (P > .05).
Effects of TFPI-2 Expression on BeWo and JEG-3 Cell Migration and Invasiveness
Our data showed that TFPI-2 expression inversely correlated with migration and invasion abilities of BeWo cell. Less BeWo cells migrated through the membrane in pEGFP-N3-TFPI-2 group than those in blank or pEGFP-N3-vector group, 48 hours after transfection, while more BeWo cells migrated through the membrane in siRNA1, siRNA2, and siRNA3 groups than that in blank or siRNA_NC group, 72 hours after transfection (Figure 2 ). As expected, with a Matrigel-coated membrane, BeWo cells invaded less through the membrane in pEGFP-N3-TFPI-2 group than in blank or pEGFP-N3-vector group, 48 hours after transfection, and significantly invaded more in siRNA1, siRNA2 and siRNA3 groups than in blank or siRNA_NC group, 72 hours after transfection (P < .05).
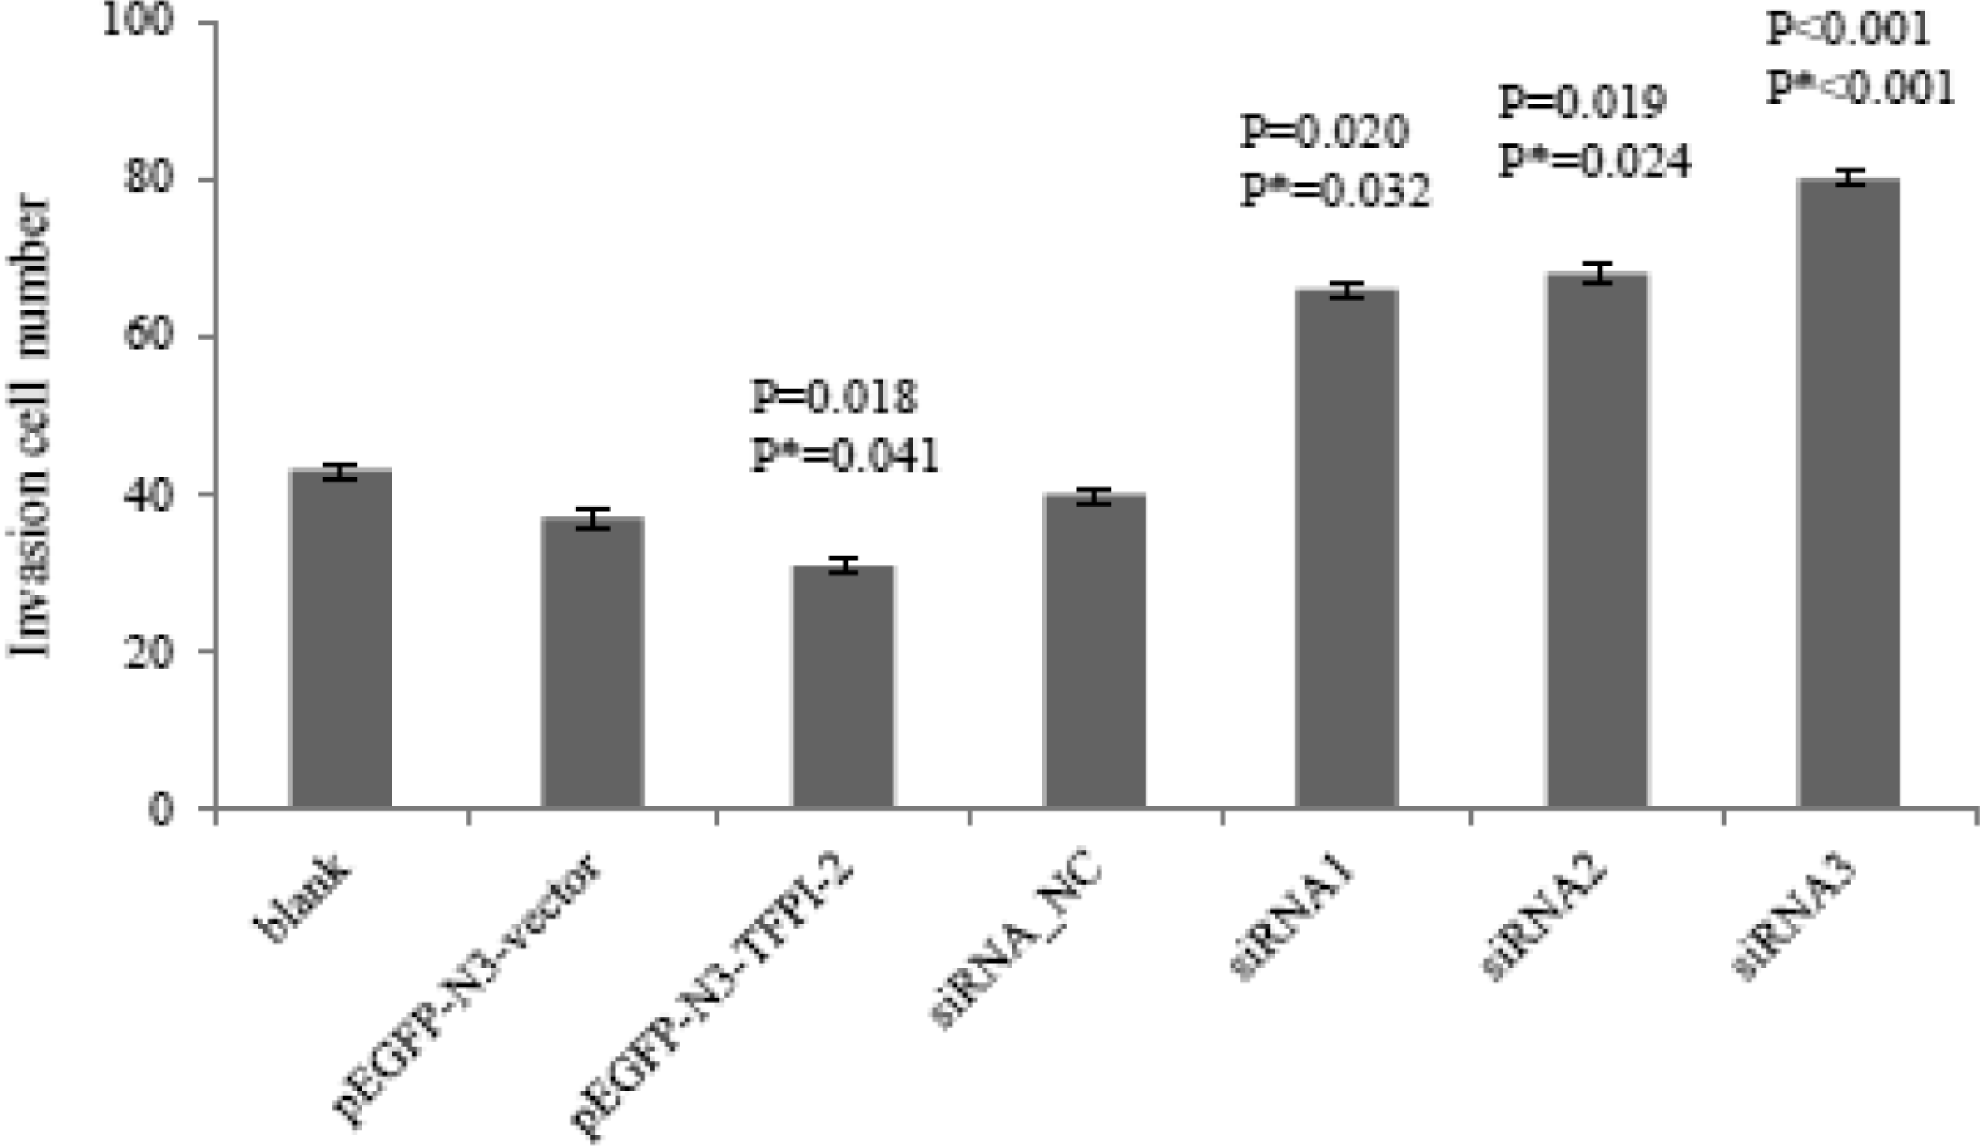
The comparison of migration among regulated BeWo cell groups. Data were shown as means ± SD in each group. P means comparison with blank group, and P * means comparison with pEGFP-N3-vector or siRNA_NC group. SD indicates standard deviation.
Also, TFPI-2 expression inhibited downregulated JEG-3 cell invasion. More JEG-3 cells invaded in siRNA2 (24 ± 3, P = .004, P = .030) and siRNA3 (23 ± 5, P = .015, P = .041) groups than those in blank (16 ± 2) or siRNA_NC group (18 ± 2), 72 hours after transfection.
In addition, there was no significant difference in JEG-3 cell migration and invasion among pEGFP-N3-vector, pEGFP-N3-TFPI-2, siRNA_NC, siRNA1, and blank group or in BeWo cell migration and invasion among pEGFP-N3-vector, siRNA_NC, and blank group (P > .05)
Effects of TFPI-2 Expression on BeWo and JEG-3 Cell Viability
CCK-8 assay indicated that TFPI-2 expression possibly inhibited BeWo and JEG-3 cell viability. BeWo and JEG-3 cell viability underwent lowest optical density (OD) value 2 days after transfection among different detection points. During 4 to 8 days, it was lower in pEGFP-N3-TFPI-2 group, while it was significantly higher in siRNA1, siRNA2, and siRNA3 groups (Table 2 ). Similar results were also showed in downregulated JEG-3 cell, OD values in siRNA1, siRNA2, and siRNA3 groups were elevated compared with those in siRNA_NC group after 2, 4, 6, and 8 days transfection (Table 3). In addition, there was no significant difference in upregulated JEG-3 cells (P > .05).
Primer Sequences Used in Real-Time Polymerase Chain Reaction
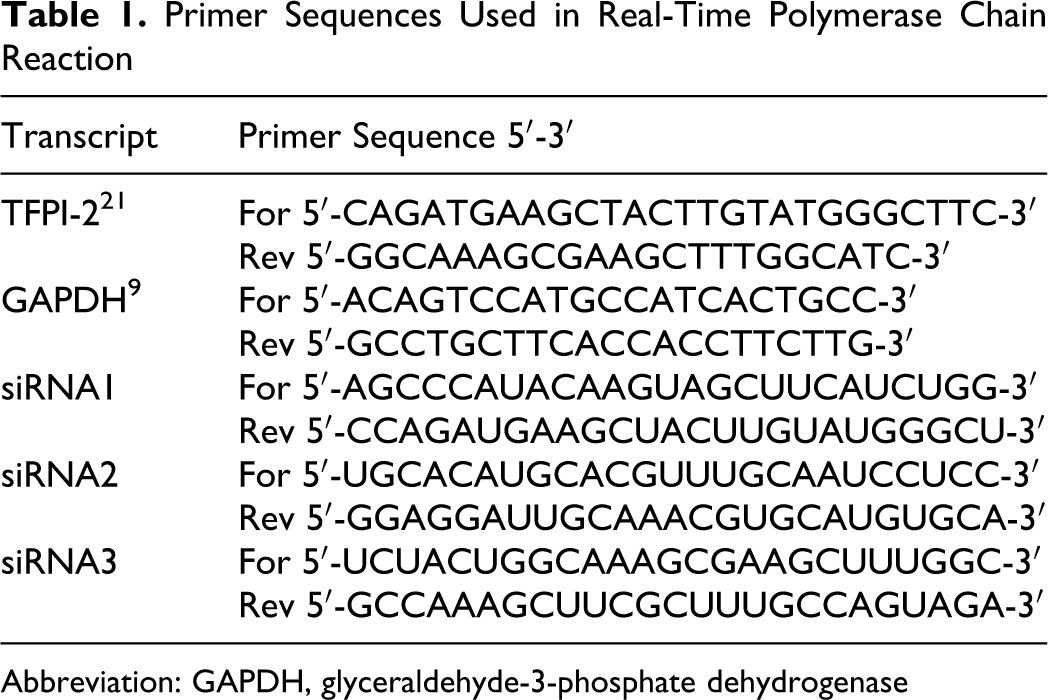
Abbreviation: GAPDH, glyceraldehyde-3-phosphate dehydrogenase
OD Value/Cell Viability of Transfected BeWo Cells
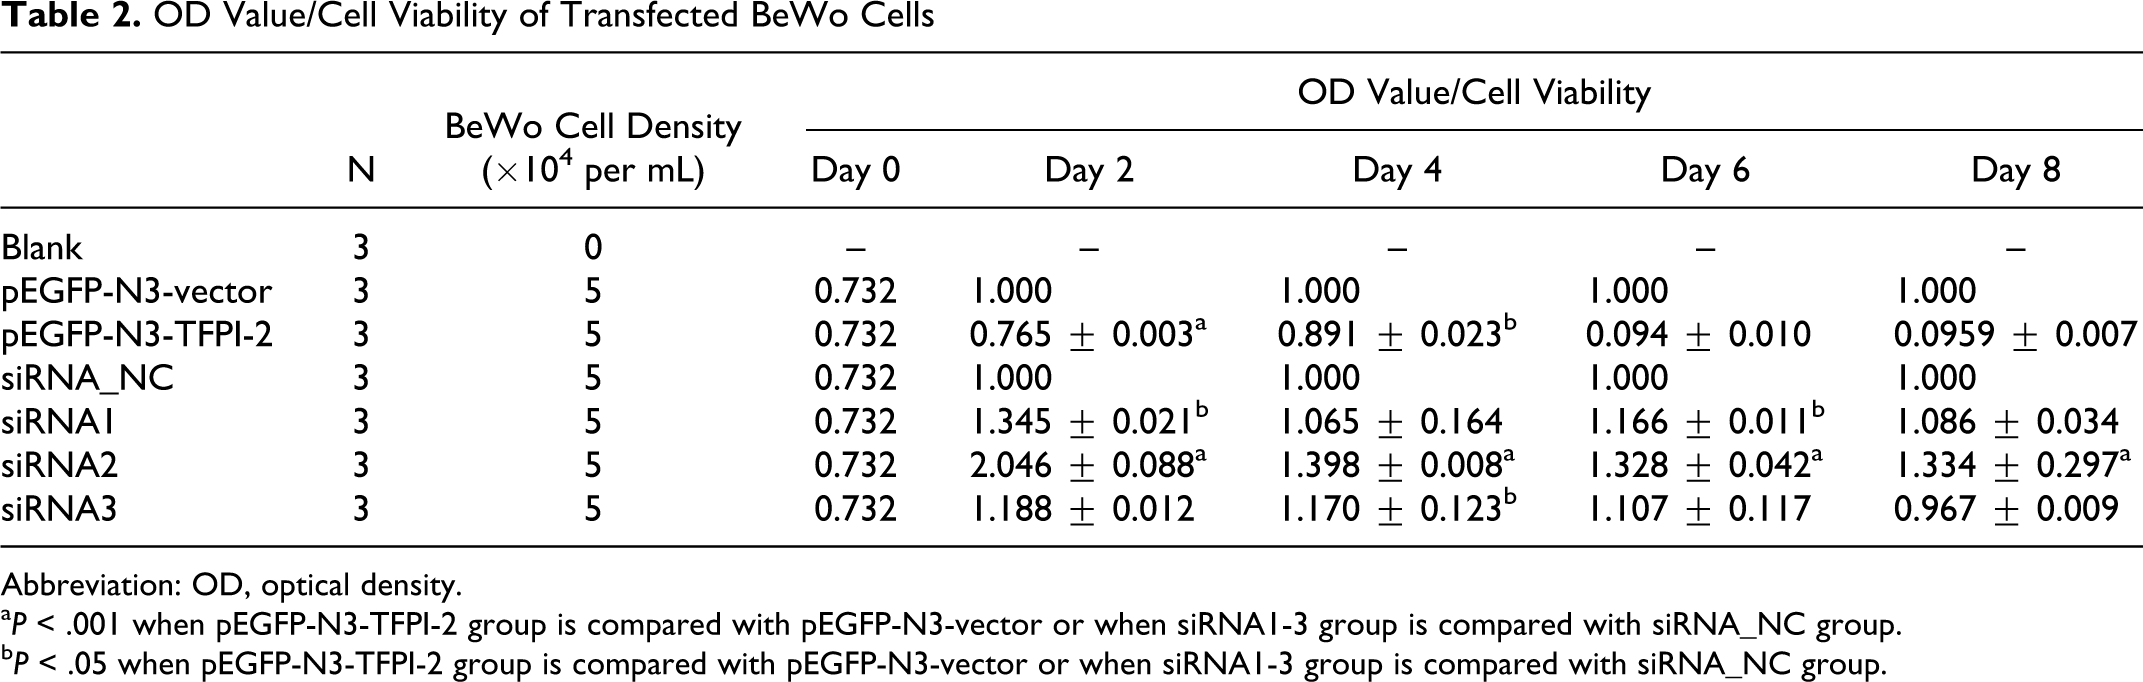
Abbreviation: OD, optical density.
a P < .001 when pEGFP-N3-TFPI-2 group is compared with pEGFP-N3-vector or when siRNA1-3 group is compared with siRNA_NC group.
b P < .05 when pEGFP-N3-TFPI-2 group is compared with pEGFP-N3-vector or when siRNA1-3 group is compared with siRNA_NC group.
OD Value Ratio with Control Group in JEG-3 Cells
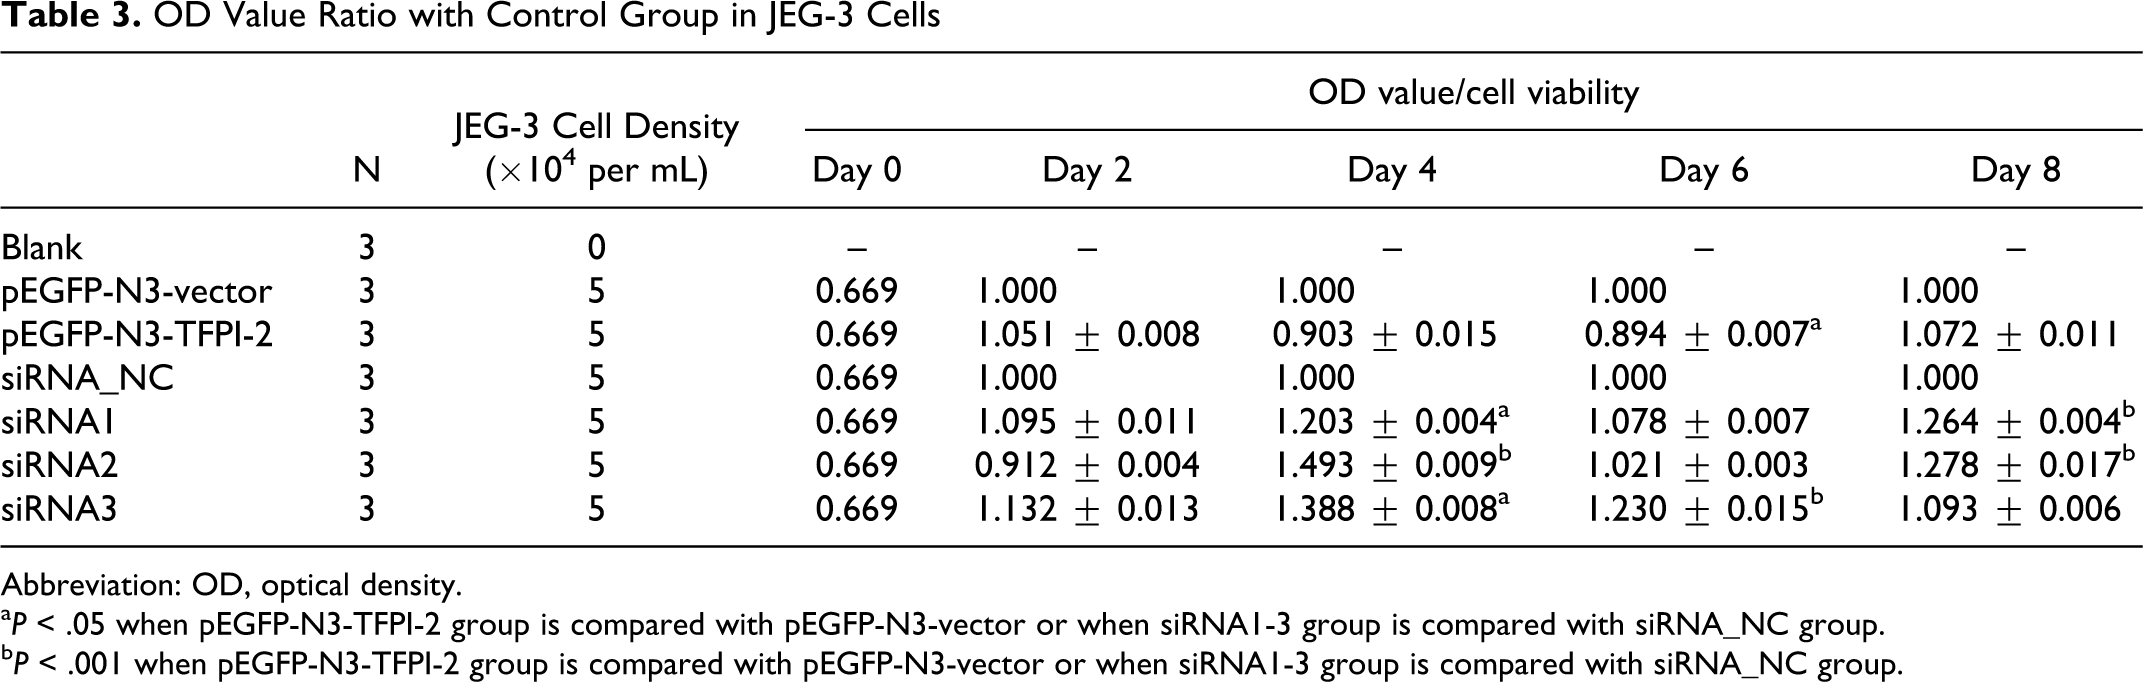
Abbreviation: OD, optical density.
a P < .05 when pEGFP-N3-TFPI-2 group is compared with pEGFP-N3-vector or when siRNA1-3 group is compared with siRNA_NC group.
b P < .001 when pEGFP-N3-TFPI-2 group is compared with pEGFP-N3-vector or when siRNA1-3 group is compared with siRNA_NC group.
Effects of TFPI-2 Expression on BeWo and JEG-3 Cell Apoptosis
Hoechst 33258 and TUNEL assays showed that it is probable that TFPI-2 expression induced the apoptosis of BeWo cell and downregulated JEG-3 cell. Hoechst-positive cells seemed more in pEGFP-N3-TFPI-2 group than those in pEGFP-N3-vector or blank group; in TUNEL assay, more TUNEL-positive cells were estimated in pEGFP-N3-TFPI-2 group compared with pEGFP-N3-vector or blank group (Figure 3A). No significant difference was found in upregulated JEG-3 cells (P > .05).
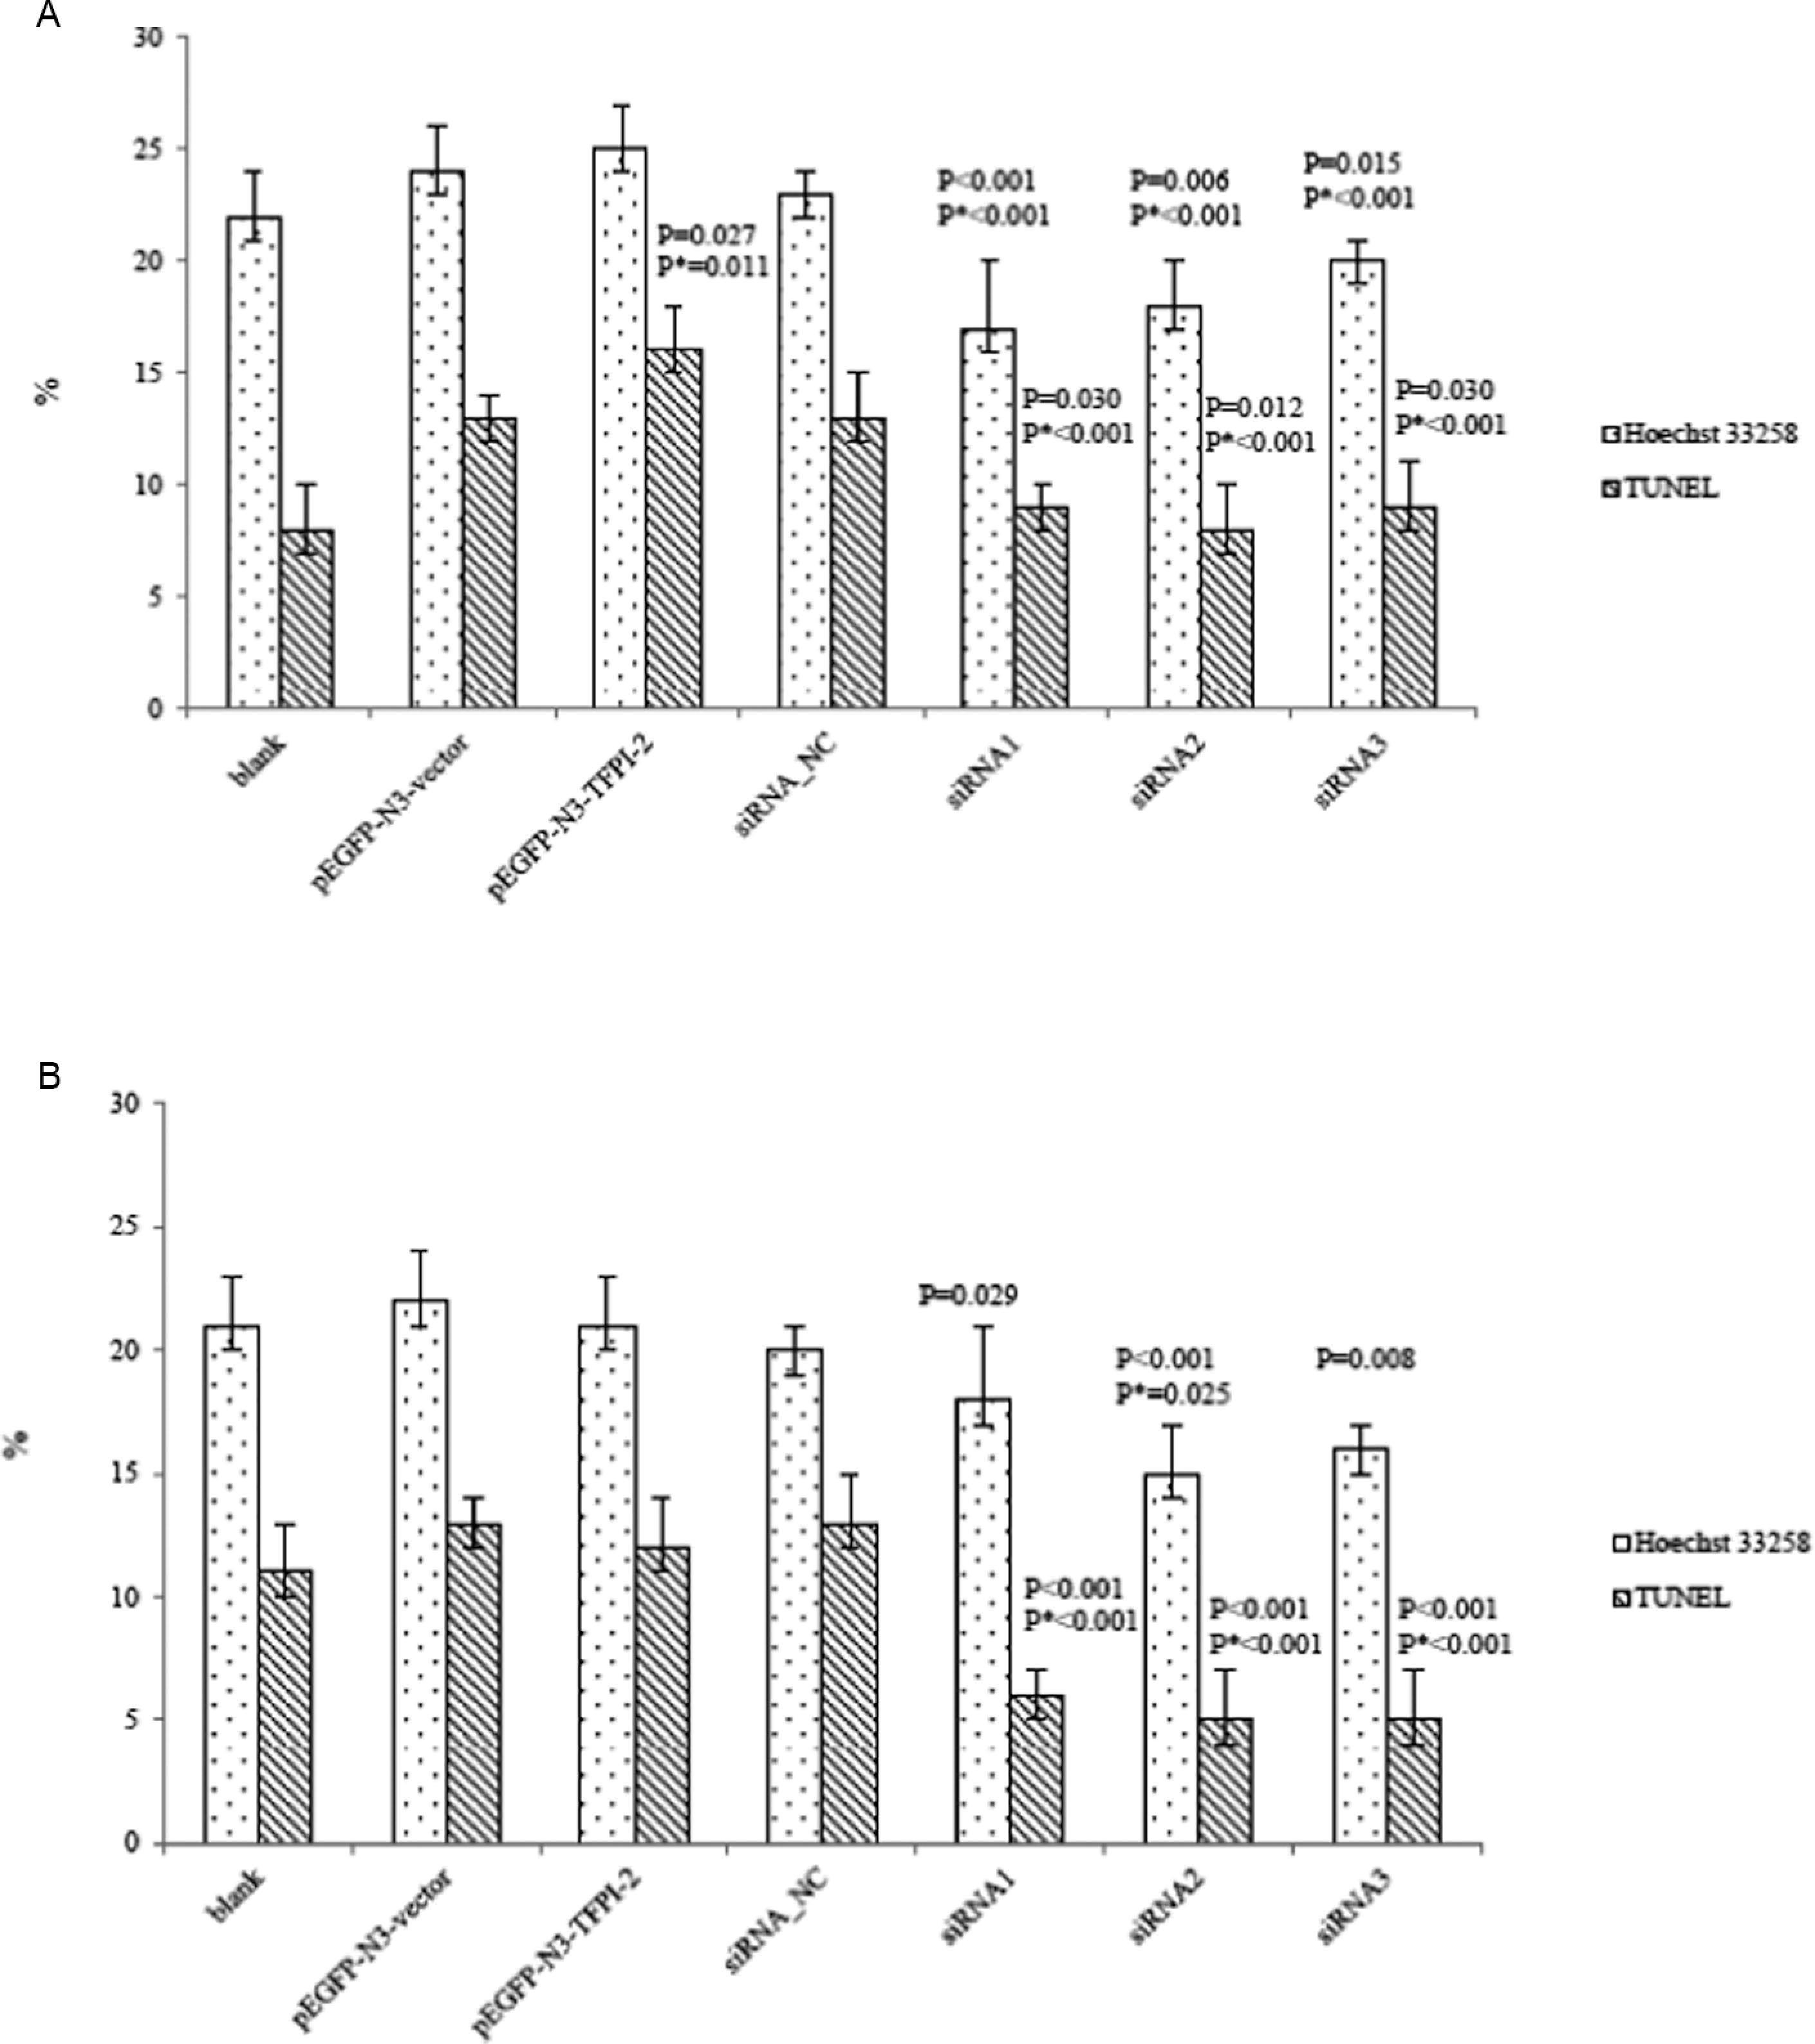
AI and TUNEL positive rate (%) of transfected cells. A, In BeWo cell. B, In JEG-3 cell. P means comparison with blank group and P* means comparison with pEGFP-N3-vector or siRNA_NC group. TUNEL indicates terminal deoxynucleotidyltransferase-mediated UTP end labeling; AI, apoptosis index.
Also, less Hoechst-positive cells in siRNA1, siRNA2, and siRNA3 groups than in siRNA_NC or blank group in BeWo cells, while there was significantly less TUNEL-positive cells in siRNA1, siRNA2, and siRNA3 groups than that in siRNA_NC or blank group (Figure 3A). Similarly, it existed less Hoechst-positive cells and TUNEL-positive cells in downregulated JEG-3 cells (P < .05, Figure 3B).
There was no significant difference in BeWo or JEG-3 cell apoptosis among pEGFP-N3-vector, siRNA_NC, and blank groups neither in Hoechst 33258 or TUNEL assays (P > .05).
Discussion
To the best of our knowledge, our study first comprehensively reported that TFPI-2 expression caused invasion and proliferation impair, induced apoptosis, and hardly interacted with differentiation in TFPI-2 upregulated/downregulated BeWo cell and downregulated JEG-3 cell in vitro, providing a possible clue to elucidate physiological role of TFPI-2 in normal pregnancy maintenance and explain its definitive function in pathological pregnancy.
First, a significant suppression in cellular migration and invasion was showed in upregulated BeWo cell, and vice versa in siRNA transfected BeWo and JEG-3 cells. Coinciding with our results, there were several studies demonstrating that the expression of TFPI-2 inhibited the invasion and metastasis of lung, esophagus, pancreatic cancer, and melanoma, correlating with its disorder processes, 26–28 which is contrary to that in liver cancer. 29 Besides, a paradoxical expression was found in TFPI-2 serum level and placental expression in preeclampia compared with normal pregnancy in our previous study. 15 It was suggested that the excessive expression of TFPI-2 may interfere with trophoblast invasion, participating in the pathological pregnancy related with abnormal placenta, such as preeclampsia, placental abruption, previa placenta, and intrauterine growth restriction.
Moreover, it has been reported that TFPI-2 interfered cell invasion mainly by regulating plasminogen activator inhibitor, urokinase plaminogen activator (uPA), and proteolysis essential procession and preventing ECM degradation. 8,14,30 On one hand, Sierko et al’s 8 research in leukocytes found involvement of TFPI-2 gene in defective extracellular adhesion mediated by uPA/uPAR, MT1-MMP, and MMP-9 in neo-vessel formation, construction, and stabilization in the presence of plasminogen. 14,28 On the other hand, studies in pancreatic cancer 7,27 confirming aberrant methylation of TFPI-2 gene revealed the possibility that TFPI-2 would be transcriptionally regulated partly by DNA methylation targeted on CpG island, 1,28 closely associated with repression and restoration. In particular, preeclampsia is probably caused by endothelial injury and hypercoagulability, which interfere placenta implantation. 9,10 Nevertheless, to some extent, the effects of TFPI-2 on BeWo and JEG-3 cell invasiveness offers a novel and potent pathway to explain the pathology of high-risk pregnancy and further exploration is needed.
Second, it was detected as a significant trend of decreased cell viability in CCK-8 detection, an induced apoptosis estimated by Hoechst 33258 and TUNEL assays in upregulated BeWo cell and a stable β-hCG secretion. Similarly, some cancers, including lung cancer, 31 pancreatic cancer, 27 esophagus cancer, 6 and malignant meningioma 32 underwent an abnormal TFPI-2 expression and impaired proliferation and induced apoptosis. Therefore, whether TFPI-2 acts as an antiproliferation agent in trophoblast deserves further research and our result reminded that TFPI-2 probably has little influence on trophoblast differentiation.
In addition, there have been demonstrated 2 possible mechanisms explaining the cell growth mediated by TFPI-2: regulation of ECM remodeling and aberrantly spliced variants. The former involves in angiogenesis and signaling molecules, receptors, death domains, and enzymes processes 14 ; apart from this, hypermethylation of TFPI-2 promoter correlated its silencing and contributed to tumor growth. 1,33 Hence, the changes of TFPI-2 expression may be involved in impaired growth of trophoblast in pathological pregnancy.
Additionally, our study further demonstrated little influence of TFPI-2 expression on upregulated JEG-3 biological function, indicating that TFPI-2 expression possibly underwent an effective refractory period at a relatively high level in JEG-3 cell. On the contrary, the significant changes in downregulated BeWo cell biology benefited to suggest TFPI-2 may have definite effect on its biological behavior even at a relatively low level. Therefore, these particular biological changes mentioned in BeWo and JEG-3 cells reminded of more consideration when using cell line for studying trophoblast function.
In summary, the biological changes in regulated BeWo and JEG-3 cells suggest that TFPI-2 may be a potential anti-invasive and antiproliferative agent in trophoblast. Further studies are needed to explore its detailed role in pregnancy maintenance and pathological pregnancy.
Footnotes
Declaration of Conflicting Interests
The authors declared no potential conflicts of interest with respect to the research, authorship, and/or publication of this article.
Funding
The authors disclosed receipt of the following financial support for the research, authorship, and/or publication of this article: partly supported by the grants from National Key Basic Research Plan of China (973 Plan; 2010CB529500), National Science Fund of China (30872777), National High Technology Research and Development Program (863 Program; 054119512), the Key Project of Clinical Disciplines of Chinese Ministry of Health (2007-353), and the Key Projects in the National Science and Technology Pillar Program in the Eleventh Five-year Plan Period (2006BAI05A05).