
Abstract
We studied the ability of a new instrument, the PlaCor PRT that measures shear-induced platelet aggregation in fingerstick, non-anticoagulated blood without added agonists, to detect platelet dysfunction ex vivo. Platelet reactivity time (PRT) and whole blood aggregation (WBA) were measured in 160 healthy volunteers, before and after aspirin and in 170 participants with established vascular disease or risk factors thereof treated with aspirin ± clopidogrel. Pretreatment PRT and WBA were significantly correlated (collagen r = −.63; arachidonate r = −.65; P < .0001). Following aspirin, the mean PRT increased from 82 to 142 seconds (P < .0001), and in participants treated with clopidogrel–aspirin, the mean PRT (286 seconds, n = 65) was significantly longer than with aspirin alone (166 seconds, n = 105; P < .001). Only 13% of PRTs of participants treated with clopidogrel and aspirin were within the normal range. We conclude that the PlaCor PRT is a simple, rapid, point-of-care instrument that compares favorably with published descriptions of other platelet function instruments.
Introduction
Measurement of the extent of impairment of platelet aggregation by platelet inhibitory drugs has progressed in recent years from an uncommon research assay to a clinically applicable procedure. Several methods are currently available to assess platelet responsiveness in patients with vascular disease. The observation of variable degrees of inhibition of platelet function in patients treated with the same dose of drug—the basis of the concepts of aspirin resistance and clopidogrel resistance 1 —was a strong stimulus for the development of instruments capable of rapid analysis of platelet function. Clinical studies of several of these instruments have yielded data on their utility in the recognition of suboptimal inhibition of platelet aggregation and its predictive significance for adverse cardiovascular outcomes.2–7
Instruments designed to evaluate platelet function utilize different methods of measurement that can be grouped into several categories: (1) agonist-induced platelet aggregation detected by optical or impedance methods, (2) combined agonist and shear-induced platelet aggregation, (3) shear-induced platelet adhesion/aggregation, and (4) miscellaneous biochemical and physical methods. These methods and instruments are described in recent reviews.8–11 Their performance characteristics have been studied, and several studies have compared multiple instruments.12–15 These and other studies have documented the high degree of variability in platelet responses observed in patients treated with platelet inhibitory drugs, especially aspirin and clopidogrel.16–19 Despite the rather extensive evaluation these methods and instruments have undergone, there remains considerable disagreement over their comparability and clinical utility. Reviews of this topic have in the past few years concluded that a satisfactory point-of-care instrument for clinical assessment of platelet function was not yet available.10,17 Despite recent improvements in some of the instruments and the growing body of literature describing their utility, the incorporation of platelet function analysis into clinical treatment algorithms is considered by some to be premature and impractical because of unknown cost-effectiveness, lack of agreement between laboratory methods, and deficiency of randomized clinical trial outcomes.7,11,20
Several methods of measurement of platelet function have end points that are generally related, but differ sufficiently that direct comparisons of results are not possible. Since platelets from the same donor analyzed in different instruments yield variable functional results, it is likely that the differences are related to the assay methods. One variable, dominant in the DiaMed Impact-R (DiaMed, Cressier, Switzerland) (cone and plate(let)) analyzer, prominent in the PFA-100 System, but lacking in optical and impedance aggregometry, is that of shear forces. Another important variable is the use of exogenous agonists, such as adenosine diphosphate (ADP), to activate platelets. Aggregometry utilizes only external agonists to activate platelets, whereas the PFA-100 System and the DiaMed Impact-R (cone and plate(let) analyzer) instruments study platelet aggregation stimulated by agonists in addition to shear. Shear forces are well documented to activate platelets in vitro in the absence of exogenous agonists.21,22 The importance of shear-dependent platelet aggregation in thrombus formation in vivo is well recognized and has recently been elegantly further defined. 23 Additional recent studies have demonstrated shear-related platelet–monocyte activation in human coronary arteries. 24 The development of microfluidic devices to measure shear-induced platelet activation and surface interaction is an active area of thrombosis research.25,26
In view of the potential utility of clinical assessment of platelet function and the current lack of an entirely satisfactory instrument for this purpose, we have undertaken an evaluation of the utility of a PFA, the PlaCor PRT. This instrument activates platelets in non-anticoagulated blood primarily by shear stress in an alternating flow field in the absence of exogenous agonists. The results of initial clinical evaluations of the PlaCor PRT instrument indicate that it has significant potential for being a true point-of-care instrument for assessment of inhibition of platelet function by platelet-inhibitory drugs.
Materials and Methods
Study Design and Population
The assessment of the PlaCor PRT instrument was performed in 3 phases which evaluated (1) the relationship of platelet reactivity time (PRT) to whole blood platelet aggregation, (2) the effect of aspirin on PRT, and (3) the applicability of measurement of PRT to the study of participants with established vascular disease or risk factors thereof. Phases 1 and 2 were coordinated in a study of PRT and WBA performed on 160 healthy volunteers, before and after 7 days of 325 mg aspirin. Inclusion criteria for entry into phases 1 and 2 were age older than or equal to 18 years, written informed consent, and willingness to ingest 325 mg aspirin per day for at least 7 days. Exclusion criteria were ingestion of aspirin within 10 days, clopidogrel within 18 days, ibuprofen within 48 hours, or acetaminophen within 24 hours, active infections, surgery within 30 days, or a history of excessive bleeding. In phase 3, participants were required to provide documentation of vascular disease or risk factors thereof. Inclusion criteria for phase 3 were either (a) prior myocardial infarction, transient ischemic attack, cerebrovascular accident, coronary bypass surgery, percutaneous coronary intervention, peripheral vascular disease, angina, angiographic evidence of coronary artery disease with >40% occlusion or (b) a family history of vascular disease, a sedentary lifestyle, diabetes mellitus, hypertension, morbid obesity, hyperlipidemia (total cholesterol >200 mg/dL, low-density lipoprotein >130 mg/dL, or triglycerides >500 mg/dL), postmenopausal or surgically sterilized female, or active smoker within the past 6 months. Exclusion criteria were active infection, surgery within the preceding 15 days, and a history of excessive bleeding. A total of 222 participants were studied in phase 3 with PRT and WBA measurements. The clinical characteristics of these participants are presented in Table 1. Of all, 77% of participants were treated with aspirin alone or clopidogrel plus aspirin at the time they were studied. Of 256 participants entered, 34 were excluded due to missing data (20 participants), hematocrit lower than 30% (2 participants), platelet count higher than 600 000 per μL (3 participants) or lower than 100 000 per μL (1 participant), white cell count higher than 15 000 per μL (3 participants), or a difficult venipuncture (5 participants).
Patient Characteristics in Phase 3

Abbreviations: CAD, coronary artery disease; CVD, cerebrovascular disease; PAD, peripheral artery disease; ACE, angiotensin-converting enzyme.
a Risk factors are hypertension, hypercholesterolemia, diabetes, current or recent smoking (<6 months), morbid obesity, or significant family history of coronary artery disease.
b Warfarin only (14 participants), warfarin plus aspirin (13 participants), as well as warfarin plus clopidogrel and aspirin (7 participants).
The study was approved by Institutional Review Boards and conducted at 5 sites—Veterans Affairs Medical Center, University of Minnesota Medical Center, Prism Laboratories, Minnesota Heart Clinic, Minneapolis, Minnesota, and Mayo Clinic, Rochester, Minnesota. Written informed consent was obtained from all participants in the study. The study was audited by an independent quality assurance unit (RegTech, Ltd, St. Paul, Minnesota).
Blood Sample Collection
Venous blood for WBA was collected in vacutainers containing 3.2% sodium citrate. Samples were rested 30 minutes at room temperature and studied within 3 hours of blood draw. Fingerstick blood for PRT testing was obtained with a sterile lancet from the third or fourth finger cleaned with alcohol following warming of the hand in a heating pad for 4 minutes. The first drop of blood was wiped away and the second was sampled. Tests were run no later than 90 seconds after fingerstick.
PlaCor PRT
The PRT cartridge contains a capillary tube for blood intake, a sample distribution channel, and 2 test channels. The test channels contain restriction coils constructed from 304 V stainless steel wire in the center. When filled, the cartridge is placed in the PRT instrument, and 16 µL of blood is drawn into the 2 test channels. The blood is pumped in alternating directions past the restriction coils of both channels at an average rate of 1.1 μL/s. The coil of the channels is 0.25 × 0.25 mm with the gap in the coil being 0.09 mm. The peak velocity in the central region reaches 17.1 mm/s. This generates an average shear rate of 1500 sec−1 and shear stress of 6 Pa (60 dynes/cm2), which is enough to activate platelets. As platelets aggregate (Figure 1), the pressure increases, and at 9 mm Hg the test is stopped. The test times for the channels are averaged and the mean PRT is displayed. If the test channel times exceed prescribed parameters, the test is considered invalid and repeated on a separate fingerstick blood sample. Since fibrin formation begins 5 to 6 minutes after entry of blood into the chamber, a PRT of 360 seconds is the maximum recorded. One technician at each site performed PRT measurements.
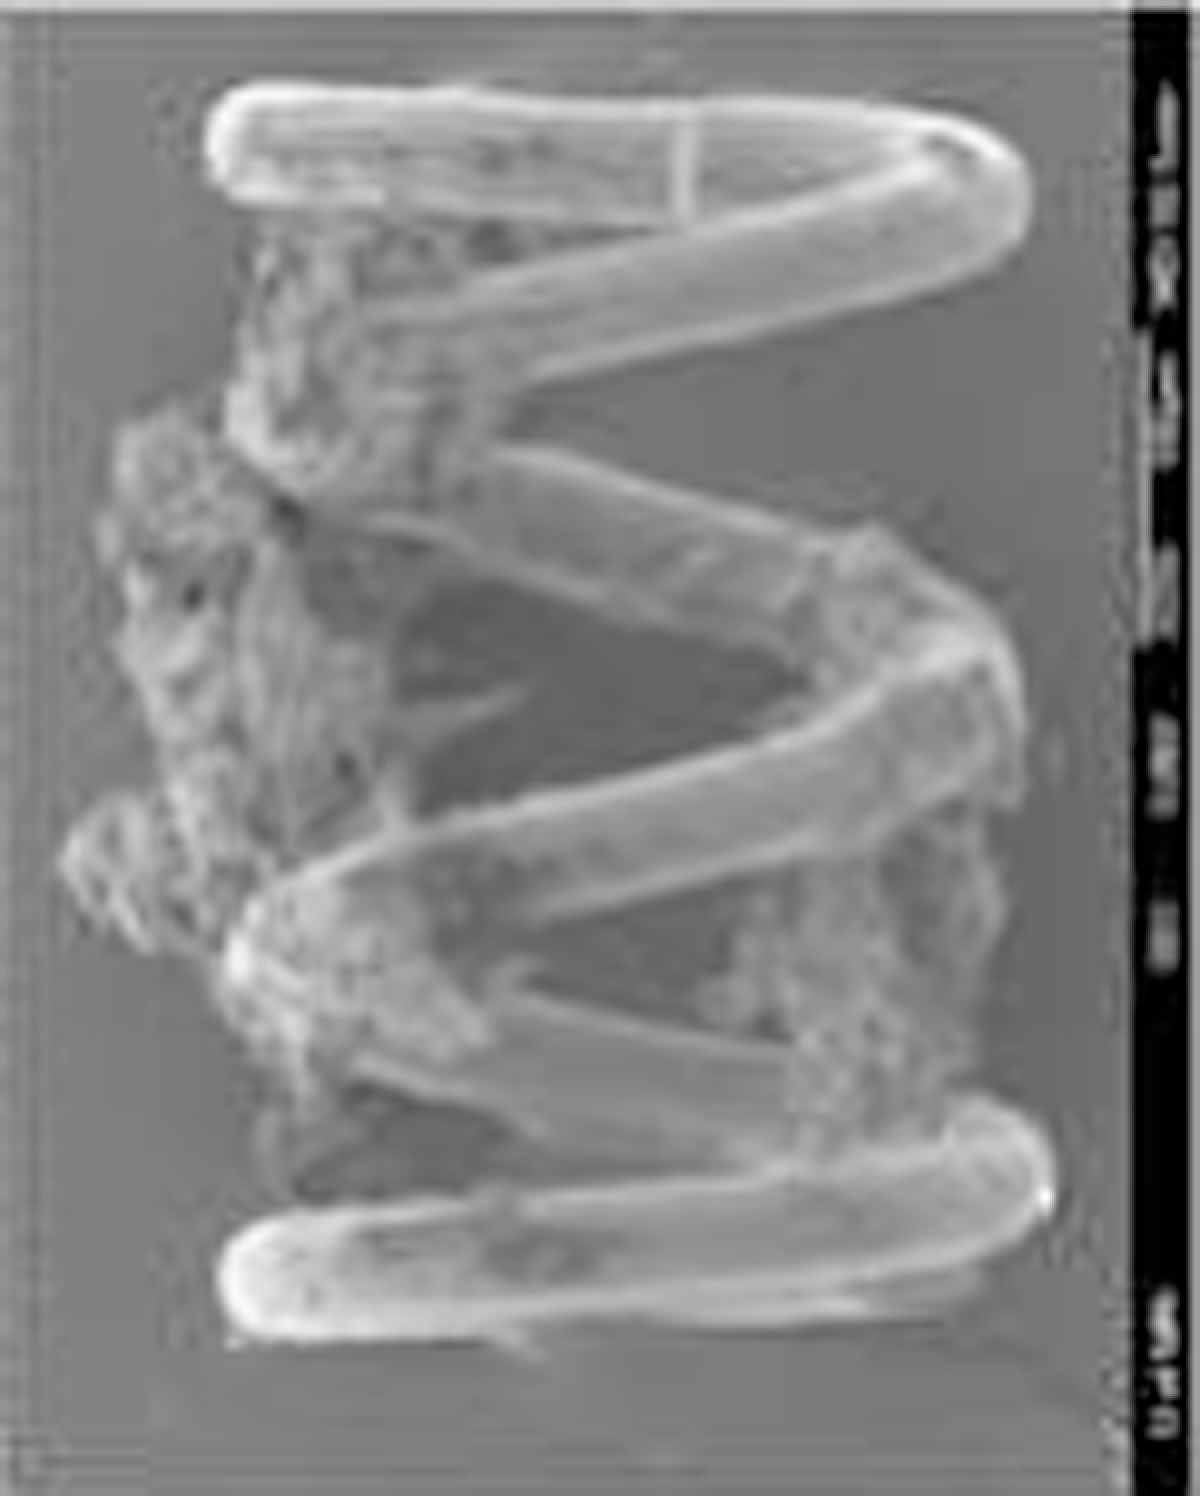
Scanning electron micrograph of platelet aggregates at the restriction coil in a test channel of the PlaCor PRT device (Courtesy of Dr James G. White, University of Minnesota, Minneapolis, Minnesota).
Chrono-Log WBA
WBA was measured in a Chrono-Log (Havertown, PA, USA) (Model #560CA) impedance aggregometer. Collagen (4 μg/mL), arachidonic acid (0.5 mmol/L), or ADP (4 μmol/L) was added to 0.5 mL whole blood diluted with 5 mL 0.9 mol/L saline, and the maximum amplitude (ohms) and the slope of the aggregation curve (ohms/min) were calculated.
Data Analysis
In phase 1, the equivalence of PRT and WBA measurements was tested using product–moment correlation. In phase 2, the difference in the means of PRT and WBA measurements, before and after aspirin treatment, was tested using paired t tests, and the product–moment correlation was used to test the equivalence of PRT and WBA. In phase 3, the following treatment groups were defined: aspirin group—all participants treated with aspirin alone, plus 2 participants treated with nonsteroidal anti-inflammatory drugs (NSAIDs) only, and 2 others treated with aspirin plus dipyridamole; clopidogrel–aspirin group—all participants treated with clopidogrel and aspirin plus 4 participants treated with clopidogrel without aspirin; warfarin group—all participants treated with warfarin (± platelet inhibitory drugs); no treatment group—participants not treated with platelet inhibitory drugs or warfarin. All but 2 of the participants in the clopidogrel–aspirin group were taking 75 mg/d of clopidogrel. The other 2 participants were treated with 150 mg/d. The data were distributed in quintiles. The mean PRTs of different drug classes were compared using the independent sample t test. Measurement error models (Demming regression and errors-in-variables correlation) were used to test the equivalence between PRT and WBA measurements. The variance and reliability estimates required for these procedures were derived from study of 24 patients in phase 2 and the coefficients of variation were calculated. To improve the linearity of its relationship with WBA slope (ohms/min), PRT (seconds) was log-transformed. SPSS (SPSS Inc, Chicago, Illinois) and GraphPad Prism (GraphPad Software, San Diego, California) were used to carry out the statistical analysis. A P < .05 was considered statistically significant.
Results
Phase 1
Figure 2 summarizes the results of phase I. Ninety-five percent of the participants had a PRT of 253 or less. There was a significant correlation between PRT and WBA slope (correlation coefficient of −.63 with collagen and −.65 with arachidonic acid; P < .0001).
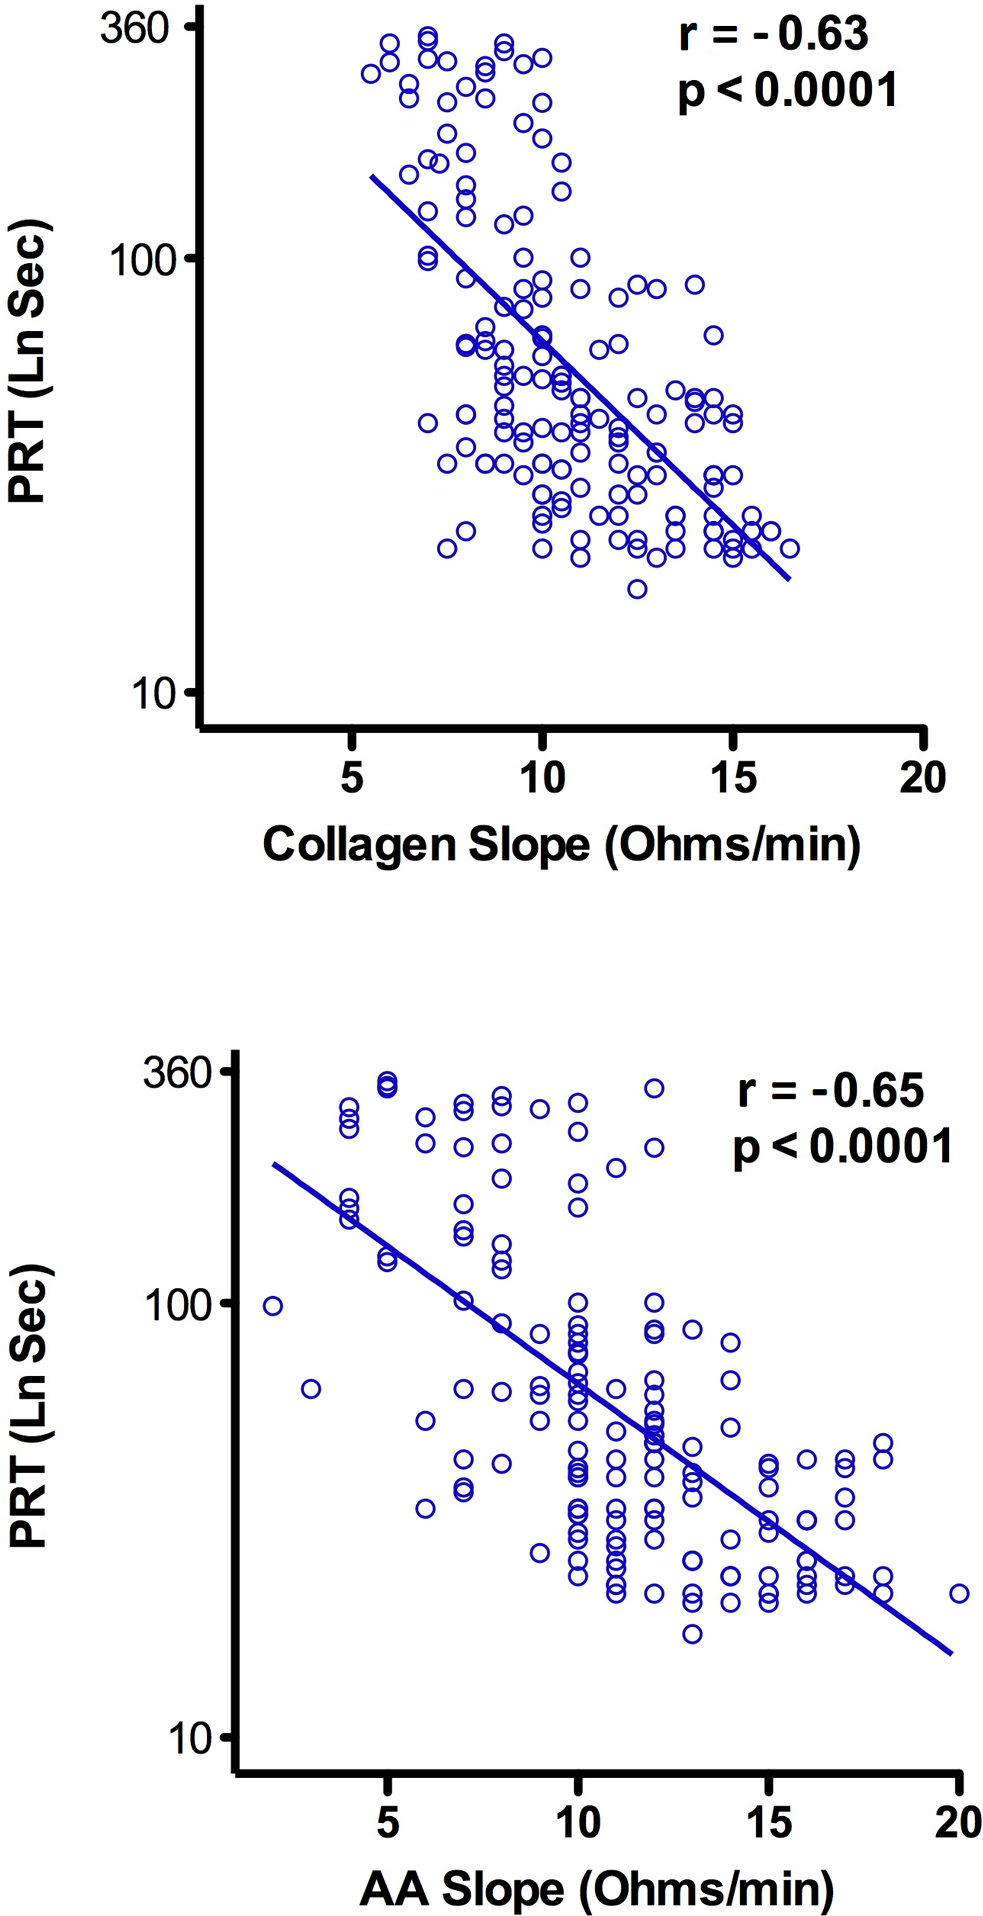
Correlation between platelet reactivity time ([PRT] LnSec) and collagen (top) as well as PRT (LnSec) and arachidonic acid (bottom) whole blood aggregation ([WBA] Ohms/min) before aspirin ingestion by normal participants (phase 1).
Phase 2
Aggregometry with arachidonic acid documented aspirin compliance in all participants. The mean PRT and collagen WBA were significantly altered in healthy volunteers following 7 days of 325 mg/d of aspirin (Figure 3). The mean PRT prior to aspirin (82 seconds; 4.41 LnSec) increased to 142 seconds (4.52 LnSec) after treatment (P < .0001). The corresponding values for WBA collagen slope were 10.7 ohms/min before and 7.9 ohms/min after aspirin exposure (P < .0001). PRT after aspirin increased in 70%, decreased in 19%, and did not change in 11% of participants. The high level of correlation of PRT with WBA collagen slope before aspirin treatment was retained after aspirin ingestion (Figure 4). The mean PRT of females participants prior to aspirin ingestion was significantly lower (48 participants) than that of males participants (115; P < .0001). PRT values of 93% of female participants fell in the lowest 3 deciles when compared with the PRT values of only 44.1% of male participants. Following aspirin, the significant sex difference in mean PRT persisted (females 91.6 vs males 190.0; P < .001), and 76.9% of females remained in the lowest 3 deciles.
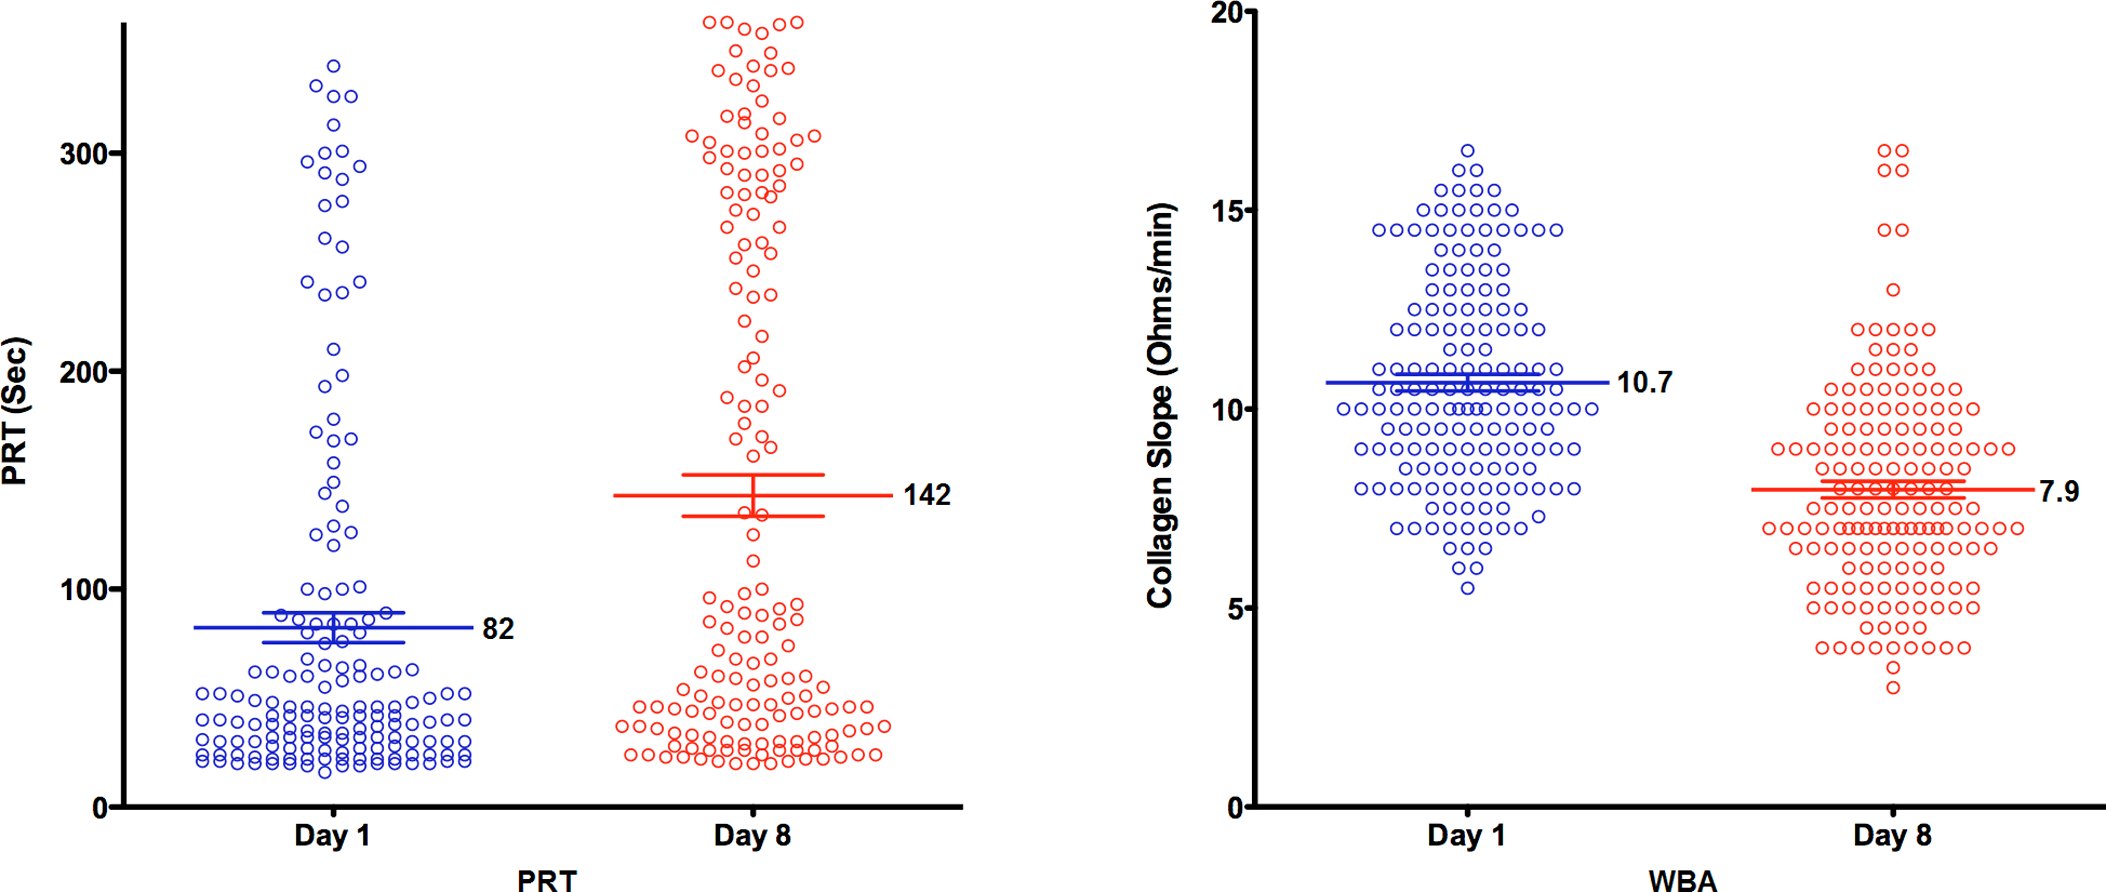
Platelet reactivity time ([PRT] LnSec; left) and collagen whole blood reactivity (WBA) slope (Ohms/min; right) before (day 1) and after (day 8) 325 mg/d aspirin ingestion by normal participants (phase 2). The mean ± standard error is designated for each distribution. The differences in means are significant (P < .0001).
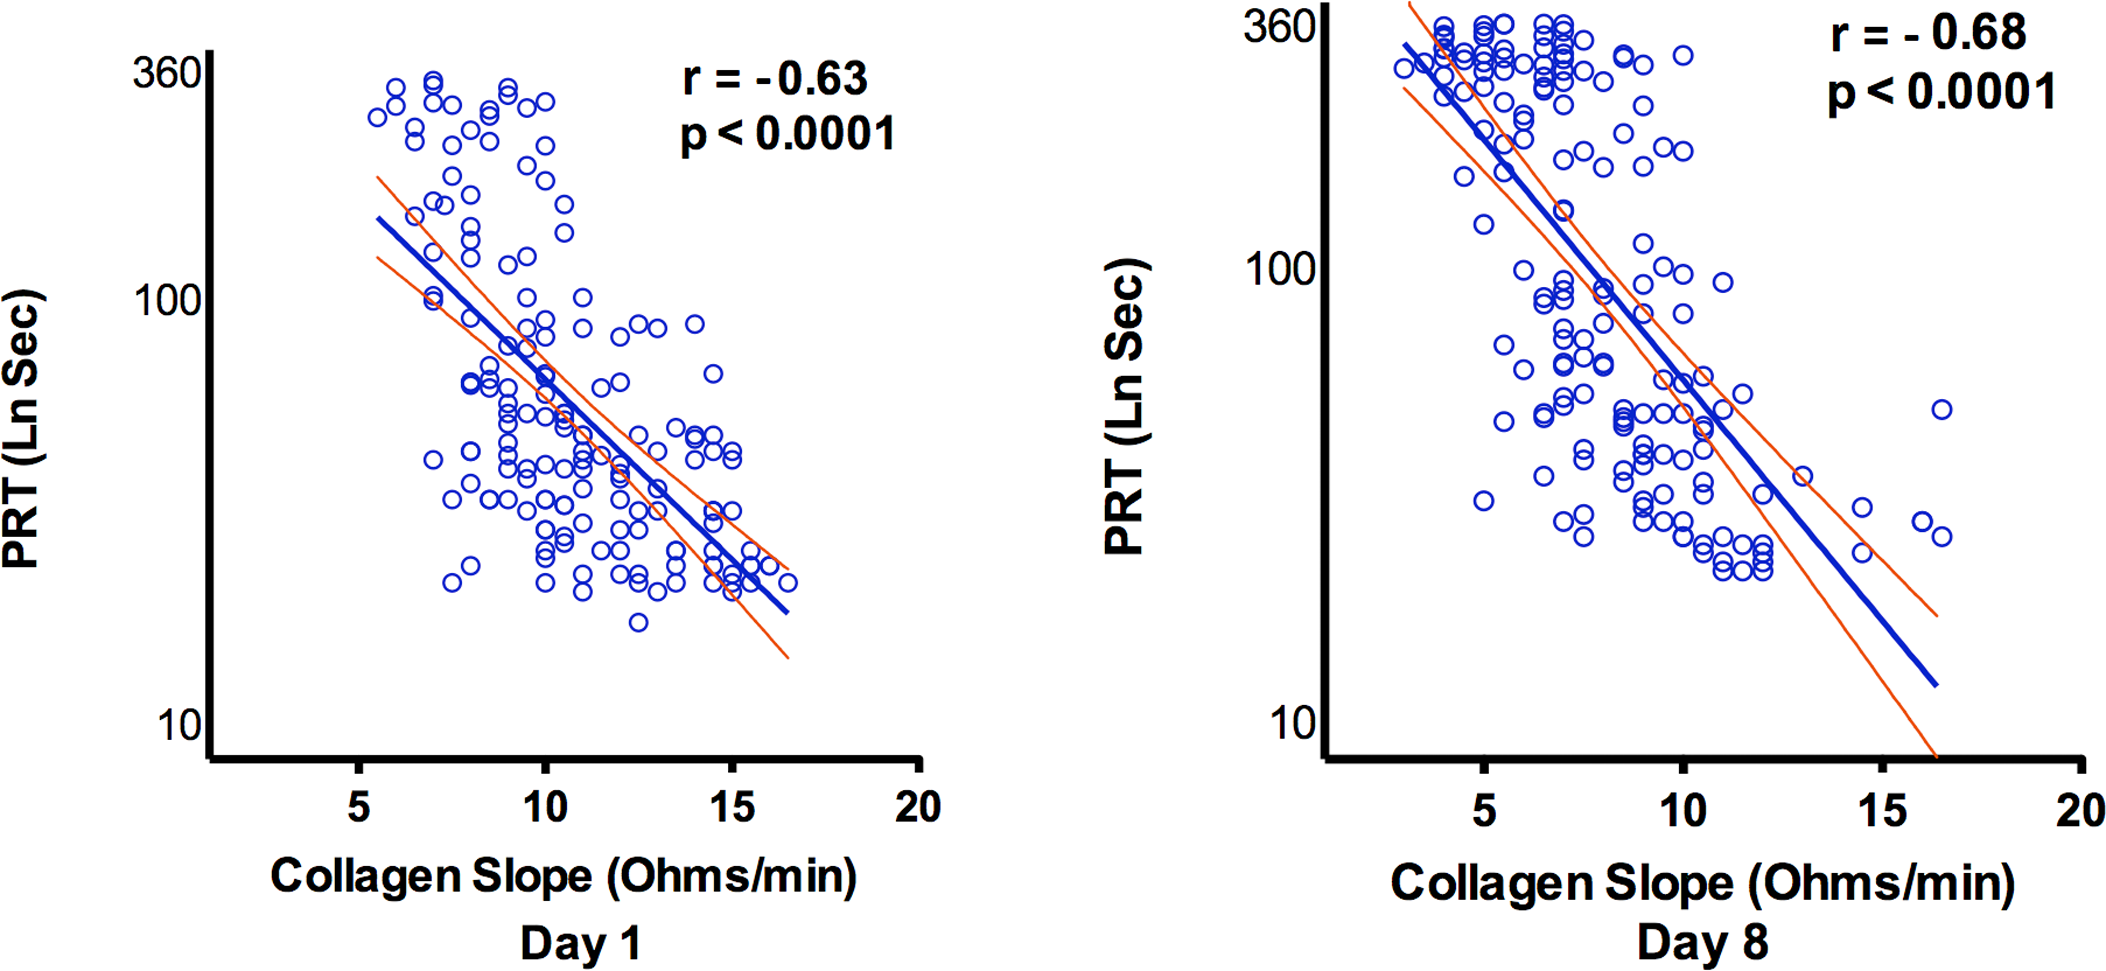
Correlation between platelet reactivity time ([PRT] LnSec) and collagen whole blood reactivity (WBA) slope (Ohms/min) before (day 1) and after (day 8) aspirin ingestion by normal participants (phase 2). The 95% confidence intervals are shown.
Phase 3
Vascular disease was present in 78.8% (72% had a history of coronary artery disease) of participants in phase 3 and the other participants had 2 or more risk factors. At the time of the study, 83% of the participants were treated with platelet inhibitory drugs or warfarin (Table 1), and the majority of participants were receiving statins and β-blockers.
The results of PRT and WBA studies are presented in Table 2. Mean PRT in the clopidogrel–aspirin group (286 seconds) was significantly higher than in the aspirin group (166 seconds; P = .005) or no treatment group (77 seconds; P < .0001), and parallel changes were observed in WBA.
Mean Platelet Reactivity Time and Whole Blood Aggregation Measurements of the 3 Treatment Groups
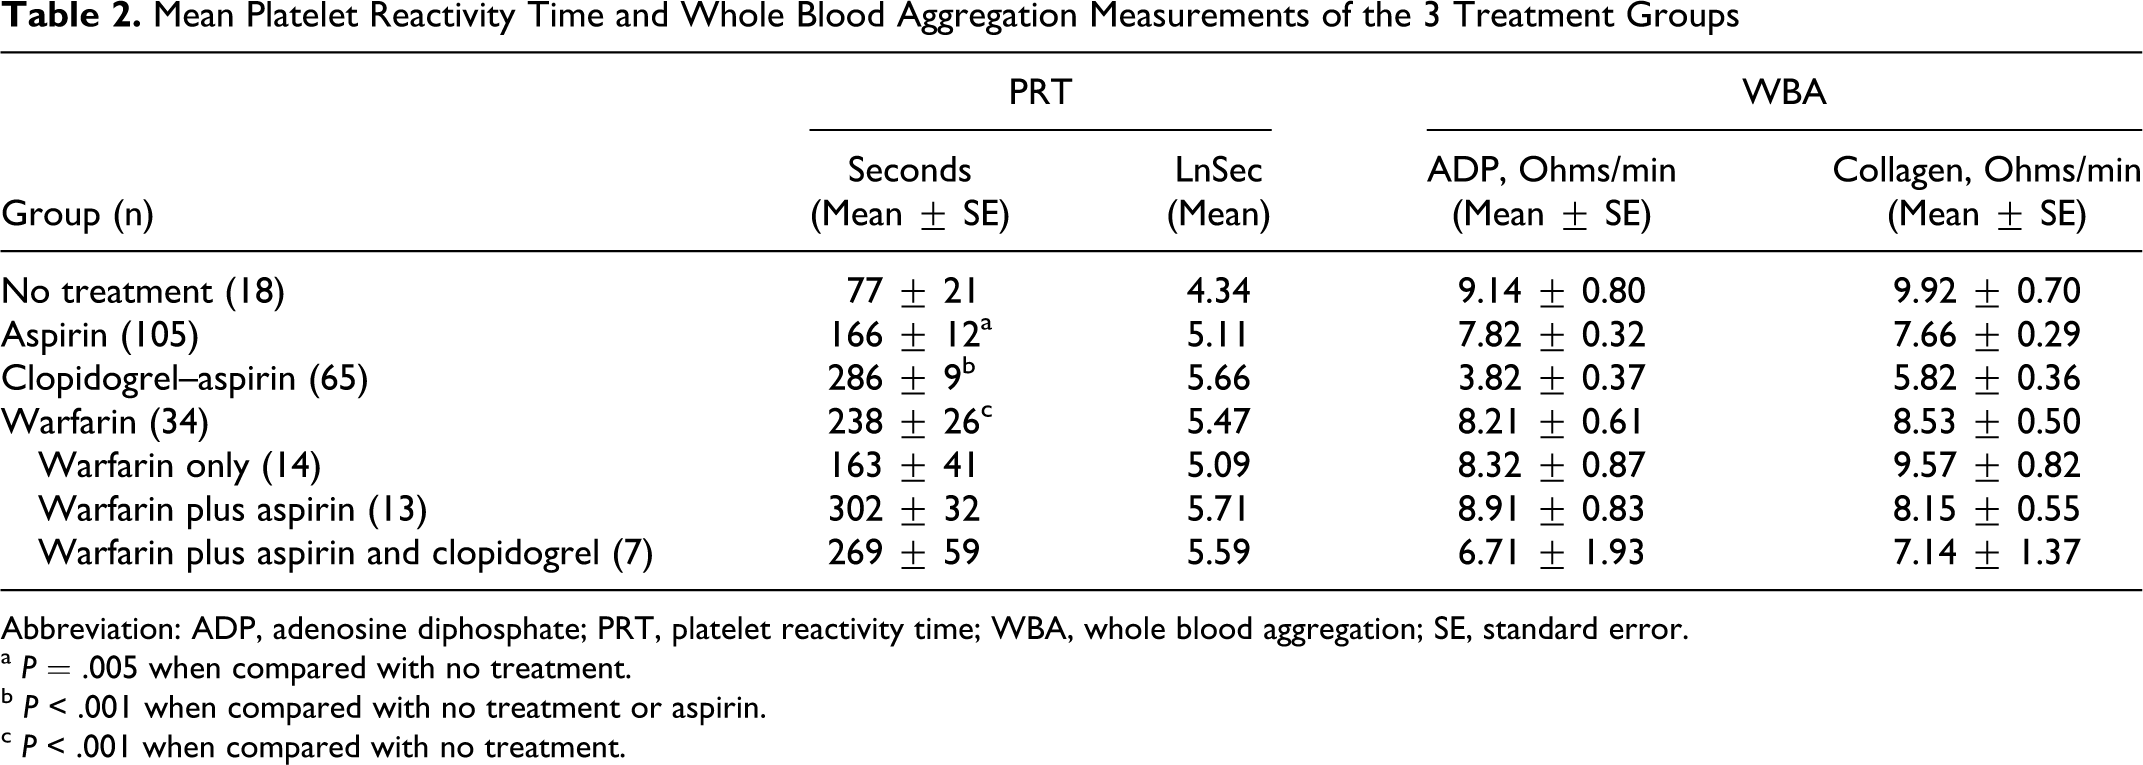
Abbreviation: ADP, adenosine diphosphate; PRT, platelet reactivity time; WBA, whole blood aggregation; SE, standard error.
a P = .005 when compared with no treatment.
b P < .001 when compared with no treatment or aspirin.
c P < .001 when compared with no treatment.
The PRT distribution of the phase 3 participants in quintiles with respect to drug class is presented in Figure 5. It clearly demonstrates the trend of PRT with drug class, with nearly all of the clopidogrel–aspirin group participants occupying the upper 3 quintiles when compared with the lower quintile distribution of those receiving no antiplatelet drugs. The PRTs of the lowest decile of the clopidogrel–aspirin group were <192 seconds. This range included 86.7% of normal participants studied in phase 1. The aspirin group had a wider distribution with no definite trend. The gender difference in PRTs was again observed (females 101 seconds vs males 185 seconds for the aspirin group and females 237 seconds vs males 295 seconds for the clopidogrel–aspirin group). Of note, the mean PRTs based on gender for the aspirin group were similar to those observed in phase 2.
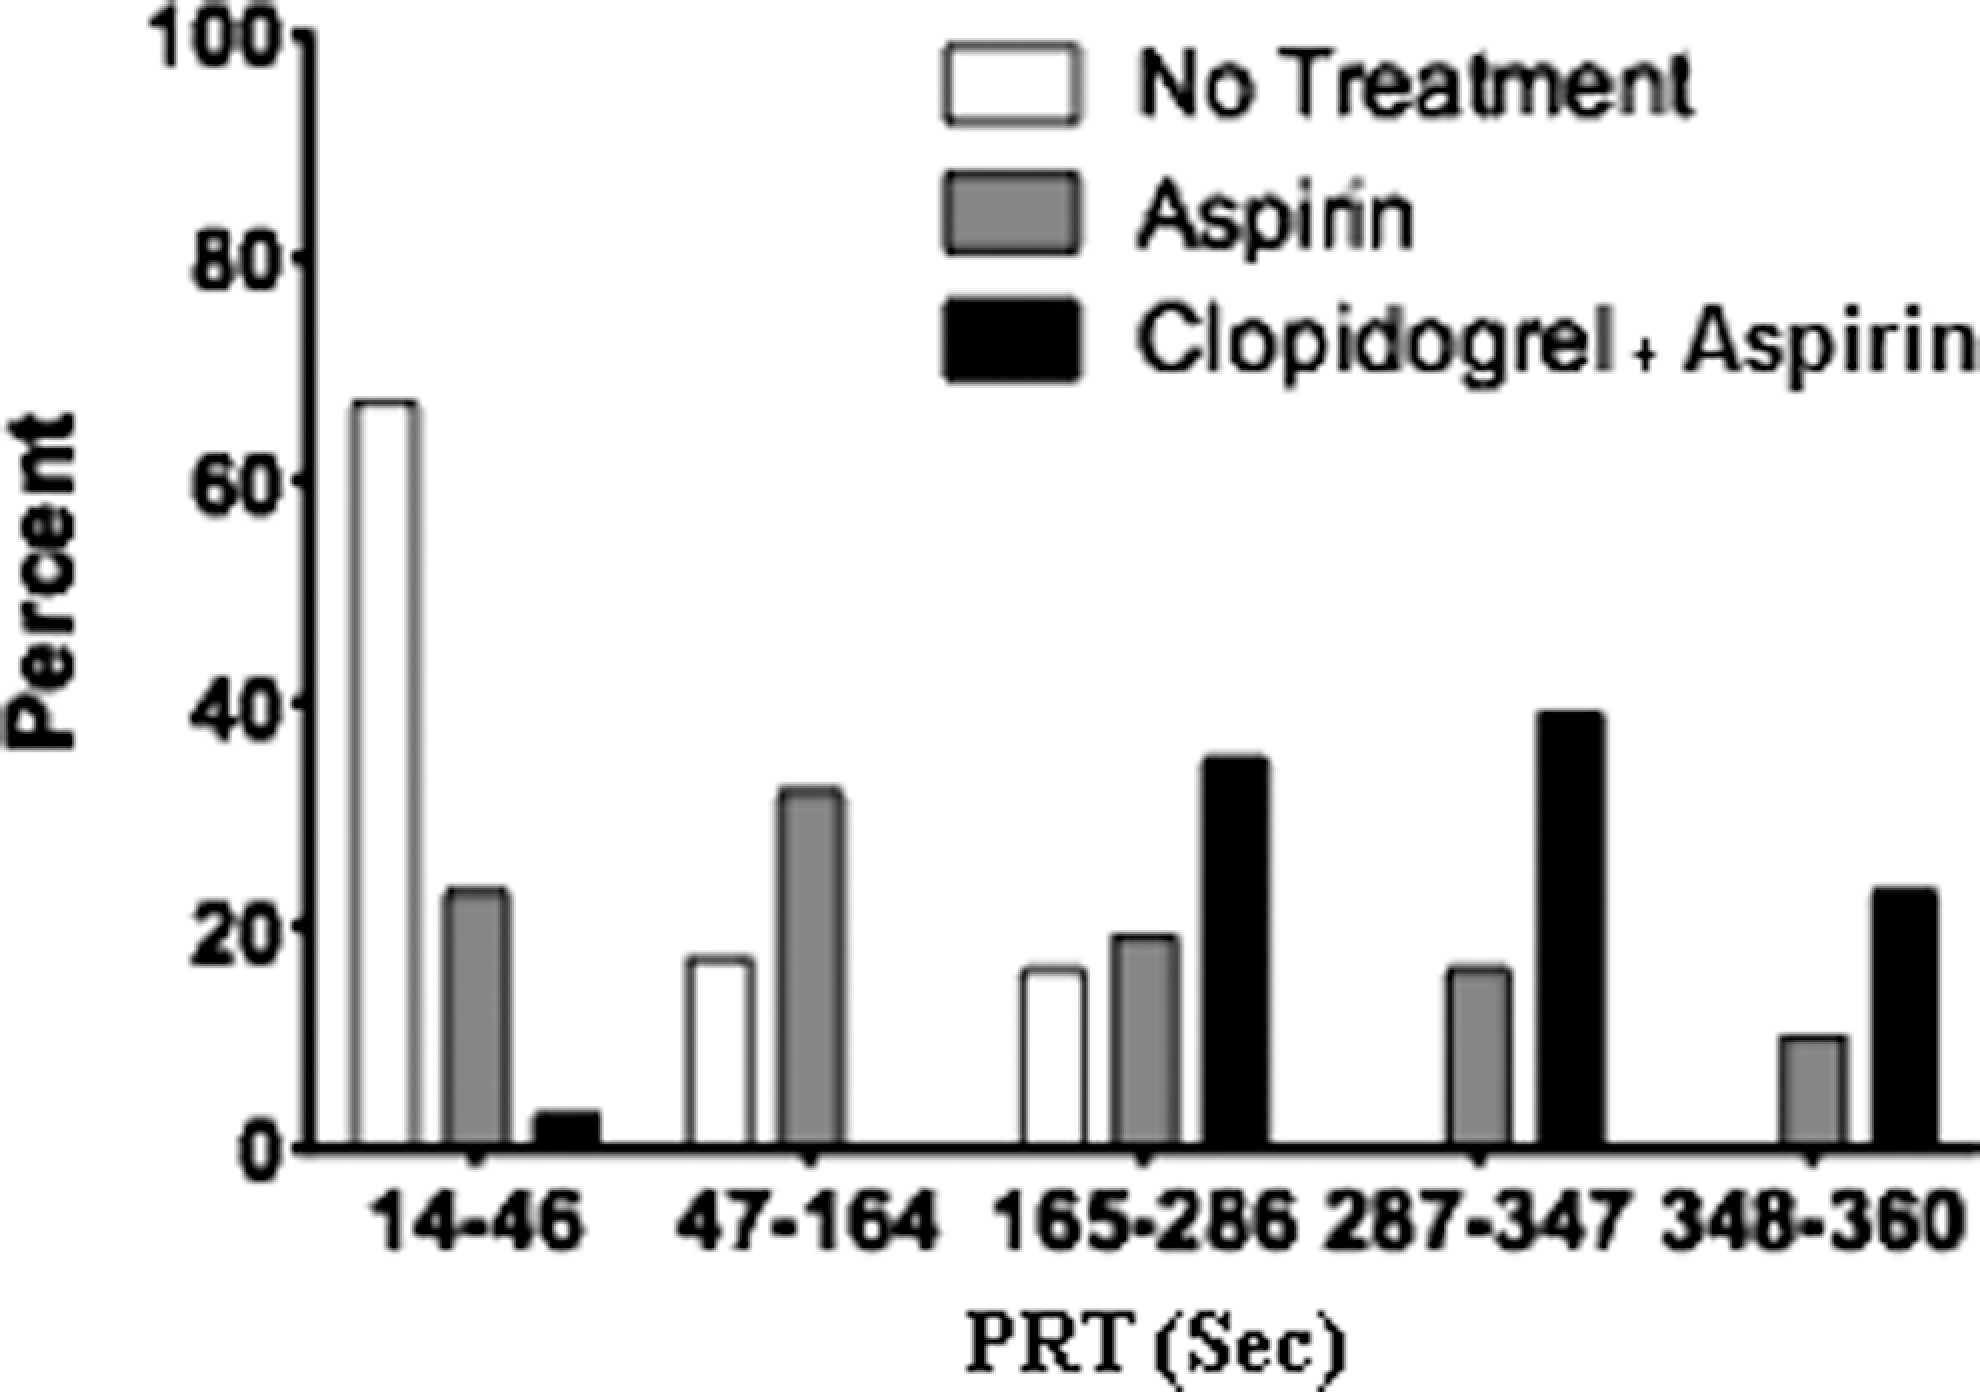
Quintile distribution of platelet reactivity time (PRT) measurements (seconds) based on drug treatment in participants with vascular disease or risk factors thereof (phase 3).
The mean PRT of the warfarin group was 238 seconds (Table 2). Subgroup analysis of the components of the warfarin group revealed longer mean PRTs for the warfarin alone and warfarin plus aspirin subgroups (compared with the no treatment group), but the mean PRT of the warfarin plus aspirin and clopidogrel subgroup was comparable to that of the clopidogrel–aspirin group (Table 2). The small numbers in each subgroup precluded further analysis.
A high degree of correlation between PRT and WBA assays was observed in phase 3 (Figure 6). The correlation of PRT with collagen WBA was −.63 and −.64 with ADP WBA (P < .0001).
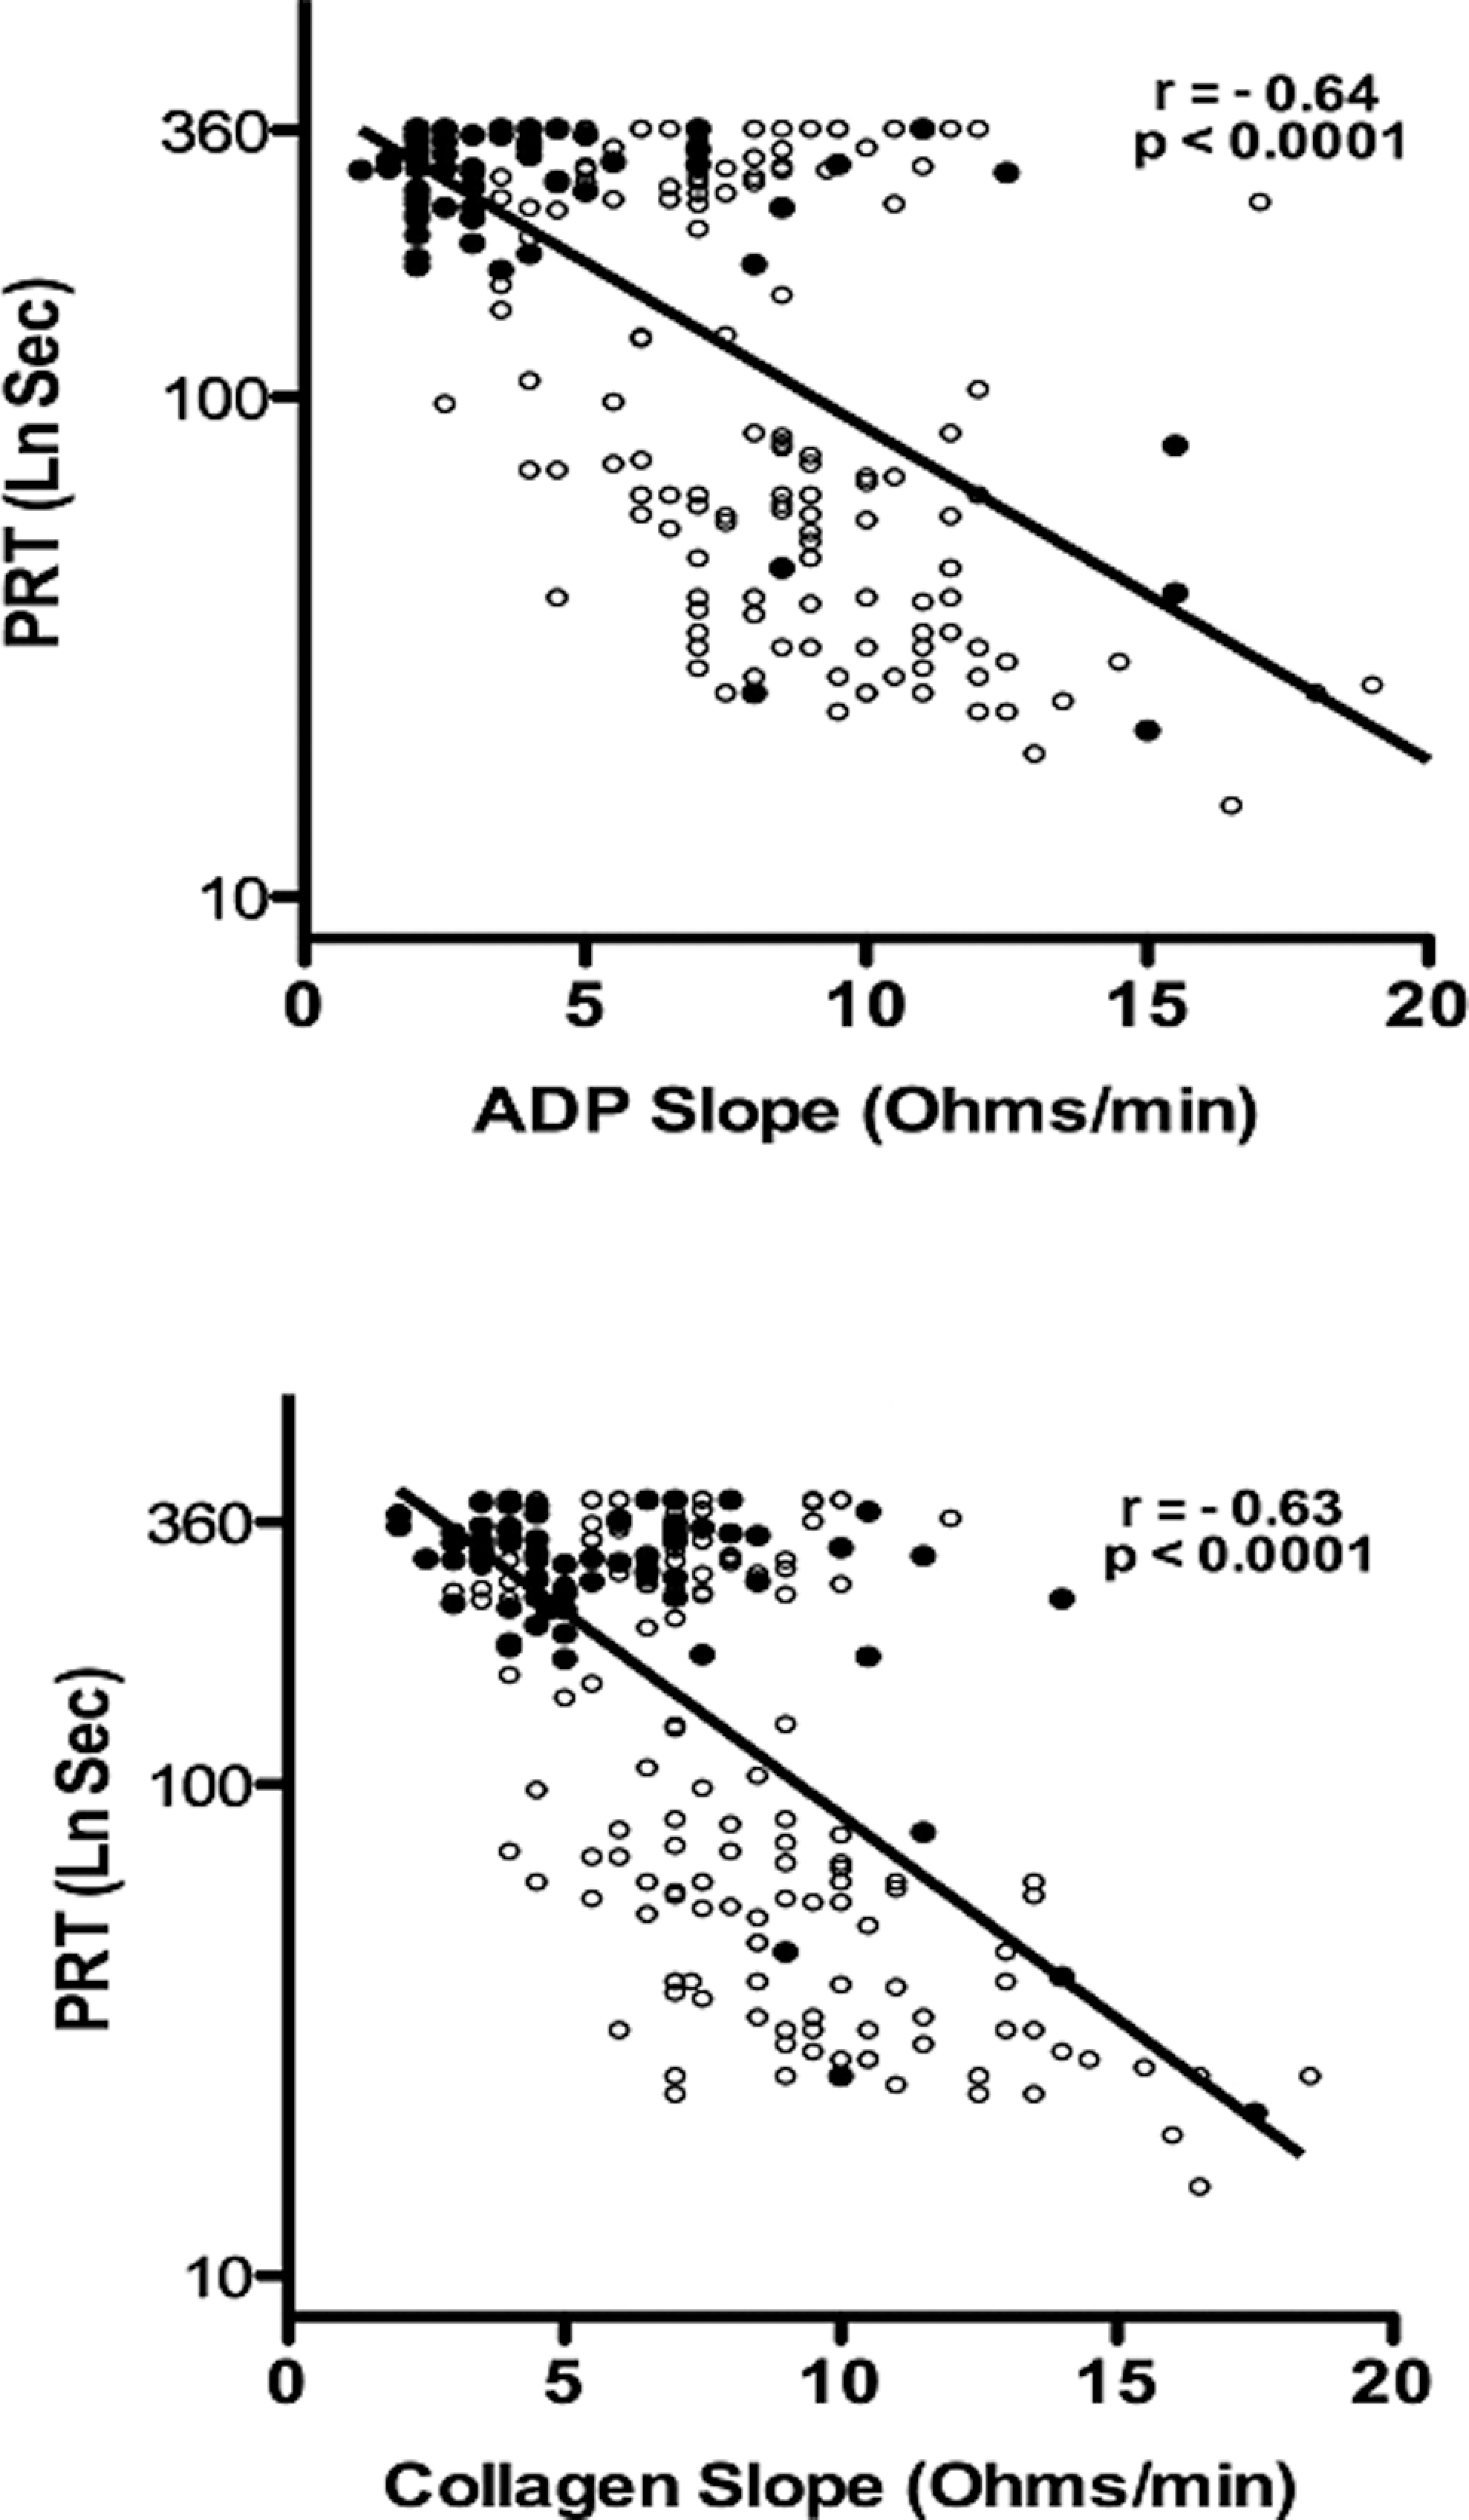
Correlation between platelet reactivity time ([PRT] LnSec) and adenosine diphosphate (top) and collagen (bottom) whole blood aggregation slope (Ohms/min) of participants in the clopidogrel–aspirin group (filled circle) and other groups (open circle) studied in phase 3.
Discussion
Analysis of the data collected in this study established a significant correlation between PRT and WBA in healthy adults as well as in a cross-sectional observation in participants with vascular disease or associated risk factors. The data also indicate that PRT is sensitive to changes in platelet reactivity caused by platelet inhibitory drugs, particularly clopidogrel plus aspirin.
The correlation between PRT and WBA was observed in all 3 phases of the study, and it was replicated with 2 different agonists. Whole blood aggregometry was chosen as the comparator for PRT because, like PRT, it utilized whole blood. Although light transmission aggregometry (LTA) is often considered the standard method for comparison,8,9 it has several limitations. 27 Whole blood aggregometry is more physiologic than LTA, and it has been utilized for platelet function testing and determination of clopidogrel resistance.4,5 When WBA has been compared with LTA comparable results have been observed.14,28,29
The correlation of PRT with WBA measurements is either comparable or superior to other assays compared with either WBA or LTA. Gremmel et al 30 compared VerifyNow P2Y12, vasodilator-stimulated phosphoprotein platelet reactivity index (VASP PRI), multiple electrode aggregometry (MEA), and Impact-R with LTA and discovered the correlation coefficients to be .61, .52, .35, and .33, respectively. These correlation coefficients are similar to those reported by others.13,14,31
The first 2 phases of our study on healthy volunteers, before and after a week of treatment with 325 mg of aspirin per day, demonstrate a significant decrease in mean platelet reactivity measured by PRT. Although PRT was variable among participants, WBA was also variable. Similar variability in aspirin-induced platelet inhibition has been observed with WBA 29 as well as other methods.19,31 Of interest was the finding that the mean PRT of females was significantly lower than that of males before and after aspirin. These data are consistent with prior observations of less inhibition of platelet aggregation by aspirin ingestion in women than men.32–35
Compared with the aspirin group, we found more consistent prolongation of the PRT in participants in the clopidogrel–aspirin group. A cutoff point for the determination of the normal PRT has not been established as yet. However, if the 95th percentile of the normal participants is chosen it would be 253 seconds. If a lower PRT cutoff point of 192 seconds (the upper limit of the lowest decile of the clopidogrel–aspirin group) is accepted as the cutoff point for the PlaCor PRT, 10% of participants with PRTs below this value compare favorably with what appears to be the true prevalence (8%-15%) of clopidogrel resistance judged by the functional responses observed following administration of high-dose clopidogrel.2,36–38 This range includes 86.7% of the healthy participants studied in phase 1.
The difference between the PRTs of the clopidogrel–aspirin and aspirin groups may be related to the mechanism of platelet activation with this device. Shear is an important component of platelet activation measured by PlaCor PRT. Although the calculated average shear force (60 dynes/cm2) is in the upper physiological range, it is likely that platelets are subjected to higher shear forces in localized areas of the coil. An additional operational characteristic of the PlaCor PRT that may contribute significantly to platelet activation at a shear force of 60 dynes/cm2 is the rapid reversal of flow that occurs in the flow chamber. Prior in vitro flow chamber studies demonstrated rapid activation of transiently adherent platelets only when they were exposed to sudden acceleration of blood flow. 39 It is also likely that platelet aggregation is potentiated within the PRT cartridge because the study is performed with whole blood. Prior studies 40 observed platelet aggregation when whole blood (but not platelet-rich plasma) was subjected to shear stress as low as 23 dynes/cm2. Since shear-induced platelet activation involves P2Y12 receptor signaling, but not cyclooxygenase activation,40,41 the shear component of platelet activation in the measurement of PRT is more likely to be inhibited by clopidogrel than aspirin.
A significant trend in recent thrombosis research is the focus on the effects of flow and shear forces. Valuable new understanding of the role of physical factors in platelet adhesion and aggregation has resulted.23,42,43 Recent research on microfluidic devices has resulted in more refined instruments to measure platelet activation.26,44 It is likely that the next generation of devices developed to measure the effects of platelet-inhibitory drugs will include assessment of the response of platelets to shear forces.
At present, 2 instruments that measure platelet activation stimulated by shear forces are available. These are the PFA-100 System and DiaMed Impact-R. The PFA-100 System activates platelets by high shear (5000 sec-1) by aspiration through a membrane aperture. Platelets contact either collagen and epinephrine or collagen and ADP coated on the cartridge membrane. The resulting platelet aggregation occludes the aperture and the closure time is recorded. 45 Studies of earlier models of the PFA-100 System that utilized a collagen–ADP cartridge resulted in the conclusion that it was unsatisfactory for the detection of clopidogrel-induced platelet inhibition. 45 However, impaired platelet activation in participants treated with aspirin and clopidogrel was recently reported in 2 studies that utilized the PFA-100 System equipped with test cartridges sensitive to P2Y12 receptor inhibition.45,46 The frequency of nonresponders to aspirin and clopidogrel (7% and 11.1%) was similar to that which we observed with the PlaCor PRT instrument. The common element of shear-induced activation in the PFA-100 System and the PlaCor PRT suggest that shear activation is an important component of optimal measurement of the effect of aspirin and clopidogrel on platelet function. Additional support for the relevance of shear activation in the measurement of platelet activation derives from the fact that nonresponders evaluated with the PFA-100 C/ADP cartridge had a significantly greater incidence of myonecrosis after percutaneous coronary intervention than responders. 46
The DiaMed Impact-R instrument is a commercial version of the cone and plate(let) analyzer developed by Spectre and associates. 47 The instrument exposes platelets in whole blood to shear of 1800 sec-1, and the adhesion of platelets and platelet aggregates to a polystyrene plate is evaluated by an image analysis system. Pretreatment of blood with a suboptimal concentration of ADP or arachidonic acid leads to microaggregate formation that decreases adhesion to the surface. This adaptation permits assessment of drug-induced impaired platelet function. The apparatus has been observed to measure inhibition of platelet activation by aspirin and clopidogrel,48,49 and the results with aspirin correlated (R 2 = .55) with those obtained by optical aggregometry. 47 However, a recent study found the Impact-R ADP test to be unsatisfactory in identifying an aspirin–clopidogrel effect. 50 This study also demonstrated a weak correlation (r = −.20) between the results obtained with the Impact-R ADP test and optical aggregometry. Direct comparison of the Impact-R aspirin test and the PFA-100 CEPI found that both tests detected aspirin-induced platelet function inhibition, but there was a high degree of discordance of results between the 2 studies applied to participants not taking aspirin. 48
Although the PFA-100 System and the Impact-R instruments utilize shear forces to facilitate platelet aggregation, it is important to recognize significant differences between these instruments and the PlaCor PRT. One important distinction is the fact that both PFA-100 System and Impact-R measure platelet respond in a low-calcium environment, since they utilize citrate anticoagulated blood. In contrast, the PlaCor PRT measures platelet activation in non-anticoagulated blood. A second important difference is the use of exogenous agonists. Evaluation of drug effects on platelet adhesion/aggregation induced by shear in the Impact-R instrument is carried out on blood preexposed to an agonist, such as ADP, for evaluation of clopidogrel-induced inhibition. 50 Exposure of platelets to agonists—collagen/ADP or collagen/epinephrine—are intrinsic components of the platelet activation process in the PFA-100 System. 45 In contrast, platelet activation in the PlaCor PRT occurs in the absence of exogenous agonists. These distinctions have both theoretical and practical advantages for the PlaCor PRT. The absence of anticoagulants and exogenous platelet agonists in the blood permits evaluation of platelet activation in conditions more closely resembling those that exist in vivo. It also avoids other variables such as the citrate concentration of the anticoagulant, an important determinant of closure time in the PFA-100. 51
The current study indicates that the PlaCor PRT has significant potential to be useful for the evaluation of pharmacological agents intended to inhibit in vivo shear-induced platelet activation and platelet–monocyte aggregation, phenomena demonstrated to occur in atheromatous human coronary arteries. 24 However, it requires additional evaluation to establish its clinical utility. Pretest variables such as effect of platelet number, hematocrit and leukocyte count, fibrinogen, von Willebrand factor, and inflammatory markers require evaluation. The results of our study of patients anticoagulated with warfarin, as well as those of a prior study, 52 indicate that vitamin K antagonists may alter the effect of clopidogrel on the PRT. The effects of other common cardiac medications also require definition. However, the most important studies to be performed are those that permit correlation of PRT with clinical outcomes.
Although the clinical utility of the PlaCor PRT remains to be established, it has undergone a critical phase of development that suggests it will be useful to measure shear-induced platelet activation and the effect of platelet-inhibitory drugs. Since an optimal method of measurement of platelet function for use in clinical studies has not been established and recognition of the importance of flow and shear forces in thrombus formation is growing, further clinical evaluation of this simple, portable, and point-of-care instrument appears warranted.
Footnotes
The study was designed by G.H.R.R. in collaboration with a representative of the sponsor. The data were collected in the participating institutions by their personnel with technical advice from the sponsor. The data were tabulated by the sponsor, but they were analyzed independently by the coauthors. The manuscript was written and the data were interpreted entirely by the coauthors who made the decision to submit the manuscript for publication.
Acknowledgments
The authors thank Dr James G. White for electron micrographs, Drs Ganesh Raveendran and Gregory A. Helmer for clinical data acquisition, Mr William S. Haworth for providing technical information on PlaCor PRT instrument design, and Ms Linda Leis and Ms Tamara Porthan for excellent technical assistance.
The author(s) declared the following potential conflicts of interest with respect to the research, authorship, and/or publication of this article: W.G.O. received honoraria for speaking on behalf of PlaCor, Inc. None of the other investigators involved in the study received honoraria or other compensation for their participation.
The author(s) disclosed receipt of the following financial support for the research, authorship, and/or publication of this article: funded by the PlaCor, Inc, Plymouth, Minnesota. None of the coauthors have any financial relationship with PlaCor, Inc.