
Abstract
The Jozi Bee Hotel Project recruited Johannesburg residents to help gather data on solitary bee abundance. They were motivated and guided by a strategic communications campaign. This study explores social media’s impact on the citizen scientists’ project involvement, particularly their interaction with visual elements of the communications campaign. Analysis of engagement metrics reveals that social media played a crucial role in sustaining volunteer participation. This demonstrates that a well-executed, ongoing social media campaign has the power to maintain participant engagement throughout the duration of a research project. It suggests that a consistent, long-term social media strategy can drive citizen science participation.
Introduction
Citizen science research initiatives strive toward generating scientific outputs while simultaneously garnering wide societal relevance and benefits, including science education, the democratization of information, and improved environmental citizenship (Bonney et al., 2016). Citizen science research should be understood to be part of a broader shift in science communication theory toward the dialogic, within a broader political project of reframing what public means to science (Dawson, 2018). To achieve these goals, a wide spectrum of potential participants must be reached (Bonney et al., 2014), and they should also be given opportunities to respond to and interact with the scientific material being communicated. This is why inclusion, in relation to participation, is a core component of citizen science and should be evaluated along several variables such as gender, ethnicity, socioeconomic and sociocultural position, location, and educational level, as well as how these factors interact to establish hierarchies and power relations (Paleco et al., 2021). However, biases have been noted in age, gender, ethnicity, and socioeconomic position in citizen science projects (Pateman et al., 2021). Davis et al. (2019) examined the values and attitudes of 482 people toward ecology and conservation and discovered that citizen scientists who actively participated were more likely to live in suburbs and have a higher socioeconomic status than people who participated less or only on social media.
According to Haklay (2012), the socioeconomic make-up of citizen scientists appears to be implicitly biased, with citizen scientists most likely residing in an advanced economy, of middle class, and thus having the educational infrastructure, technical skills, and access to resources, coupled with free time or specific leisure interests that promote their involvement. There is also a geographic bias, with most citizen science projects being in North America and Europe (Dickinson et al., 2010). As a result, most of the research investigating citizen science participation and communities comes from these regions (Crall et al., 2013; Evans et al., 2005; Mac Domhnaill et al., 2020; Overdevest et al., 2004). Johannesburg, South Africa is one of many cities in the Global South characterized by inequality and poverty, resulting in significant socioeconomic gradients, and making Johannesburg one of many places in the Global South representative of the implicit socioeconomic bias in citizen science (Nagendra et al., 2018; C. M. Shackleton et al., 2014, S. Shackleton et al., 2015).
The Jozi Bee Hotel Project enlisted the help of enthusiastic citizen scientists residing in Johannesburg, South Africa, to gather abundance data on non-Apis bee species (from here on referred to as solitary bees), with a secondary aim to establish a citizen science initiative that would aid in the development of a society of environmentally and socially conscious citizens capable of advocating for environmental justice. Scientifically engaged societies are a necessary element of delivering democratic science to be used in governance and decision making, as well as equipping individuals and communities with an awareness of science in their daily lives, and the capability to use this knowledge accordingly (Árnason, 2012; Irwin, 2014). Jozi Bee Hotel Project participants were given a free “bee hotel,” which they could place in their outdoor spaces, and were asked in return to upload photographs and other data about occupation in their bee hotel once a week, for 12 weeks. Nearly 350 volunteers signed up to the project and contributed thousands of images and records to the study, from September to November 2020. In this paper, we explore the role that the project’s social media communications campaign played in gathering these data, and in promoting dialogue between scientists and participants.
In Johannesburg, 90.8% of households have access to electricity, but a stark 50.4% do not have access to the internet, with only 14.4% with internet access in their home, 18.1% from their cellular phone, 8.6% from work and 8.5% getting internet access “elsewhere”. It is therefore not surprising that participants of the Jozi Bee Hotel Project were predominantly from the more affluent areas, that is, the northern and central suburbs of Johannesburg. Contrasting access to online resources is a consequence of the ripple effects of the unequal distribution of resources due to the apartheid regime (Christopher, 1997). Despite these challenges of access, it is possible to conduct successful citizen science projects in South Africa to contribute to the democratization of information and improved environmental citizenship (Bonney et al., 2016), though scientists should keep in mind the implicit socioeconomic bias that is embedded in the demographic of participants.
In this article, we reflect on the role that social media played in engaging the citizen scientists that signed up to participate in the Jozi Bee Hotel Project. To do so, we first offer a review of the literature covering the role of social media in citizen science projects about urban biodiversity and citizen science approaches in biodiversity research. Then, we give an account of how we kept track of social media engagement during the project. Finally, we reflect on how social media engagement supported project participation and facilitated dialogue.
Social Media in Citizen Science Research
A case study conducted by Ambrose-Oji and colleagues (2014) on environmental citizen science projects revealed that social media is frequently used in citizen science to (a) recruit volunteers; (b) retain volunteers; (c) train, support, and disseminate information; and (d) data input. Initiatives such as “Blogging Birds” and the “iTree Eco project” are good examples of the successful use of social media in recruiting and retaining followers and/or volunteers to educate the public about specific conservation issues and to train volunteers to collect data for research projects. The most prevalent technique for keeping volunteer interest in citizen science initiatives is to ensure the project’s social media platforms are constantly updated, to distribute outcomes from the citizen scientists’ involvement, their data collection milestones, and to provide graded explanations of the results in a timeous fashion (Ambrose-Oji et al., 2014; Davis et al., 2019).
Scientific institutions are increasingly relying on social media, blogs and websites to interact with their target audiences and the general public (Darling et al., 2013; Grand et al., 2016; Peters et al., 2014). Members of the public have come to prefer learning about scientific issues indirectly, through media content that describes the results or consequences of scientific research, rather than official scientific publications such as peer-reviewed journal articles (Brossard, 2013). Despite this shift in preference, there is still a lack of understanding with regard to which type of content fosters user engagement, but researchers have acknowledged the need for communication practitioners to teach scientists how to achieve this (Brownell et al., 2013; Dudo & Besley, 2016; Howell et al., 2019). There has been little research into the best practices for science communication in general, as well as the type of content that maximizes user engagement (Habibi & Salim, 2021). Infographics have been found to be of great use when promoting research on educational social media accounts as they increase outreach (Bhatia et al., 2022). Furthermore, videos that are 40 to 60 seconds in length have been found to be an effective way to deliver science-based content (Habibi & Salim, 2021).
Social media platforms are remarkable tools for raising awareness on scientific issues; with infographics, videos, and maps being the common visual media used (Brossard, 2013; Scheufele, 2014). Incorporating social media into a citizen science project can also help increase the participation of adolescents and young adults and offer opportunities for dialogue and citizen to scientist information sharing. Smartphones and apps offer a relatively easy way to access different demographics while decreasing the exclusion of some marginalized groups (Ess & Sudweeks, 2006; Newman et al., 2013). In China, where western platforms such as Facebook, Instagram, and Twitter are banned, scientists have identified that using WeChat and Weibo increases public scientific literacy. Jia et al. (2017) interviewed 25 Chinese scientists active online and they expressed that using social media as a science communication tool has allowed them to reach larger audiences, much like other scientists around the globe (Besley & Nisbet, 2013). However, science communication is not simply a unidirectional practice; it also involves hearing from and listening to citizens.
Furthermore, citizen science research projects allow for the creation of a “community of practice”: a way to engage, support and provide learning and communication opportunities among participants and scientists. A “community of practice” is a group of individuals who gather because of their interest in a specific topic, to share knowledge, ideas, and enthusiasm through ongoing interaction (Lave & Wenger, 1991; Wenger et al., 2002). Originally, “community of practice” was centered on in-person gatherings; however, social media provides opportunities for virtual communities (Gunawardena et al., 2009; Johnson, 2001). Liberatore and colleagues (2018) explored the concept of a virtual “community of practice” in the context of the New Zealand Garden Bird Survey (NZGBD), a citizen science project centered on volunteers conducting bird counts in their gardens, with the goal of capturing a snapshot of garden bird populations across New Zealand to monitor changes and better inform management strategies of various bird species. Anecdotal evidence from the NZGBD Facebook group suggested that the group included active participants as well as interested onlookers. Using the concept of “community of practice” to support citizen science programs has the potential to encourage transformative social learning, however, there have been relatively few studies of “community of practice” in both the environmental arena and on the use of social media in supporting citizen scientists’ engagement and participation (Bela et al., 2016; Triezenberg et al., 2012).
The terms “public engagement” and “public participation” are frequently used interchangeably in the literature; however, they do not mean the same thing (Martin, 2017). Public participation in scientific research refers to members of the public actively participating in the generation of scientific knowledge and thus includes citizen science. This can also be defined as research collaboration involving volunteers in the creation of tangible scientific research (Martin, 2017; Rowe & Frewer, 2005; Shirk et al., 2012; Wiggins & Crowston, 2015). Public engagement in science refers to when individuals interact with science-centered content. Their engagement can be determined by the degree to which they show interest in and pay attention to science communication, regardless of the method used to access said content; the motive behind their curiosity; the way in which they interpret and understand the information; or the degree to which they look for the information in order to use it for decision-making purposes (Reyes, 2013; Scheufele, 2013).
This article explores and reflects on the types of social media engagement that characterized citizen scientist participation in the Jozi Bee Hotel Project, that is, how social media engagement facilitated dialogic science communication. This allows us to highlight what might work for similar or comparable initiatives, as well as reflect on what this might indicate about “citizenship” for science projects and science as a public good. Alongside the scientific data-gathering that the citizen scientists contributed to the project, we were also keen to explore the role that social media plays in the recruitment and retention of volunteers. Therefore, we tracked how project participants reacted and related to the different types of content and subjects posted on the Jozi Bee Hotel Project’s social media platforms. As noted from the literature, we expected that the use of social media would support successful recruitment of interested and enthusiastic volunteers, and that participants would engage most with project-specific content. We were also interested in determining what type of media was most effective in generating dialogue. Next, we discuss the approach taken to test these expectations.
Method
Social Media Engagement in JBHP
To reflect on and analyze the efficacy of social media communications in achieving the goals of this research project, specifically in maintaining citizen science involvement, this article first reports on the social media strategy deployed, and then analyses the engagement statistics evident throughout the project. Our predictions were as follows: (a) social media would positively influence recruitment and retention of project participants throughout the duration of the citizen science initiative; and (b) project-specific posts would have higher engagement than slightly generic content (i.e., information-based content such as solitary bee facts). Although we have no specific prediction, we also wanted to determine which types of media generated higher engagement.
Project recruitment took place through established email lists and the top three social media platforms in South Africa: WhatsApp (community groups for gardening, birding, and entomology enthusiasts), Facebook, and Instagram. Nearly 95% of South African internet users are registered on WhatsApp. Facebook and Instagram have a penetration rate of around 87% and 73%, respectively (Galal, 2022), and were therefore chosen as the main platforms for creating a Jozi Bee Hotel virtual community. They were used to disseminate educational content as well as project findings. In brief, nearly 350 participants received a free “bee hotel” and volunteered for the JBHP. Participants had to submit two photos of their bee hotels on a weekly basis, logging the presence or absence of solitary bees. These data were submitted through a Google form, designed to measure how quickly the bee hotels filled up, which participants could complete using their cellular phones or computers. This participation was guided and encouraged through a strategic communications campaign using social media and weekly emails.
Jozi Bee Hotel Project researchers served as administrators for the Facebook and Instagram accounts, both of which were public. The pages were managed by one researcher from August to December 2021. The Facebook and Instagram pages were set up to display only posts produced or shared by the administrator and served as a key information dissemination tool and a way to communicate with the JBHP community. Before the official project launch, posts were primarily focused on recruiting interested parties to volunteer in the project by posting advertisements and announcements informing people how they could join the project and collect their bee hotels. After the project launch, posts were scheduled on a weekly basis, with 2 to 3 posts focusing on what participants would need to know regarding the project and data collection issues that could arise. We also featured participant-generated content, where participants had tagged JBHP pages and sent pictures and videos through direct messages. These were used as one of the primary sources of content by the administrators and are referred to as participant-generated content throughout.
From the onset, the administrators wanted to set a friendly and supportive tone to provide a welcoming environment for all solitary bee hotel owners and establish a foundation for active engagement and dialogue. Research in virtual communities has revealed that repeated exposure to a given behavior encourages the establishment of group standards, and that the administrators can shape certain member habits and attitudes through their interactions. Cultivating a sense of community was critical to achieving the level of engagement required for the success of this project. A “community of practice” is characterized by a shared domain or topic, a community of people who share and learn together, and a practice or set of common resources and tools (Liberatore et al., 2018; Wenger et al., 2002). Members should find value in a “community of practice” (Wenger et al., 2002). The JBHP social media presence enabled participants to express their own experiences and feelings about being a part of the project through photographs, video, and text testimonials, in addition to the task of submitting data. Consequently, to maintain the feeling of community, we chose to combine participant-generated content with the administrator generated content, which reinforced the project’s objectives, summarized progress made in data collection and provided solitary bee facts. Because of this collaborative approach, the number of posts on each platform differs, however there is an overlap in the content posted (see “Results: Engagement Statistics” section).
Data Extraction, Coding, and Analysis
The Jozi Bee Hotel Project’s Facebook and Instagram profiles were set up as public, with all content freely accessible online. Comments and participant-generated content was provided consensually within these public spaces by the participants. Where that content is reported on here (Table 1), it has been anonymized to protect the identities of the people posting.
Categories of Comments Left by Followers on the Jozi Bee Hotel Project’s Social Media Pages (Facebook and Instagram).
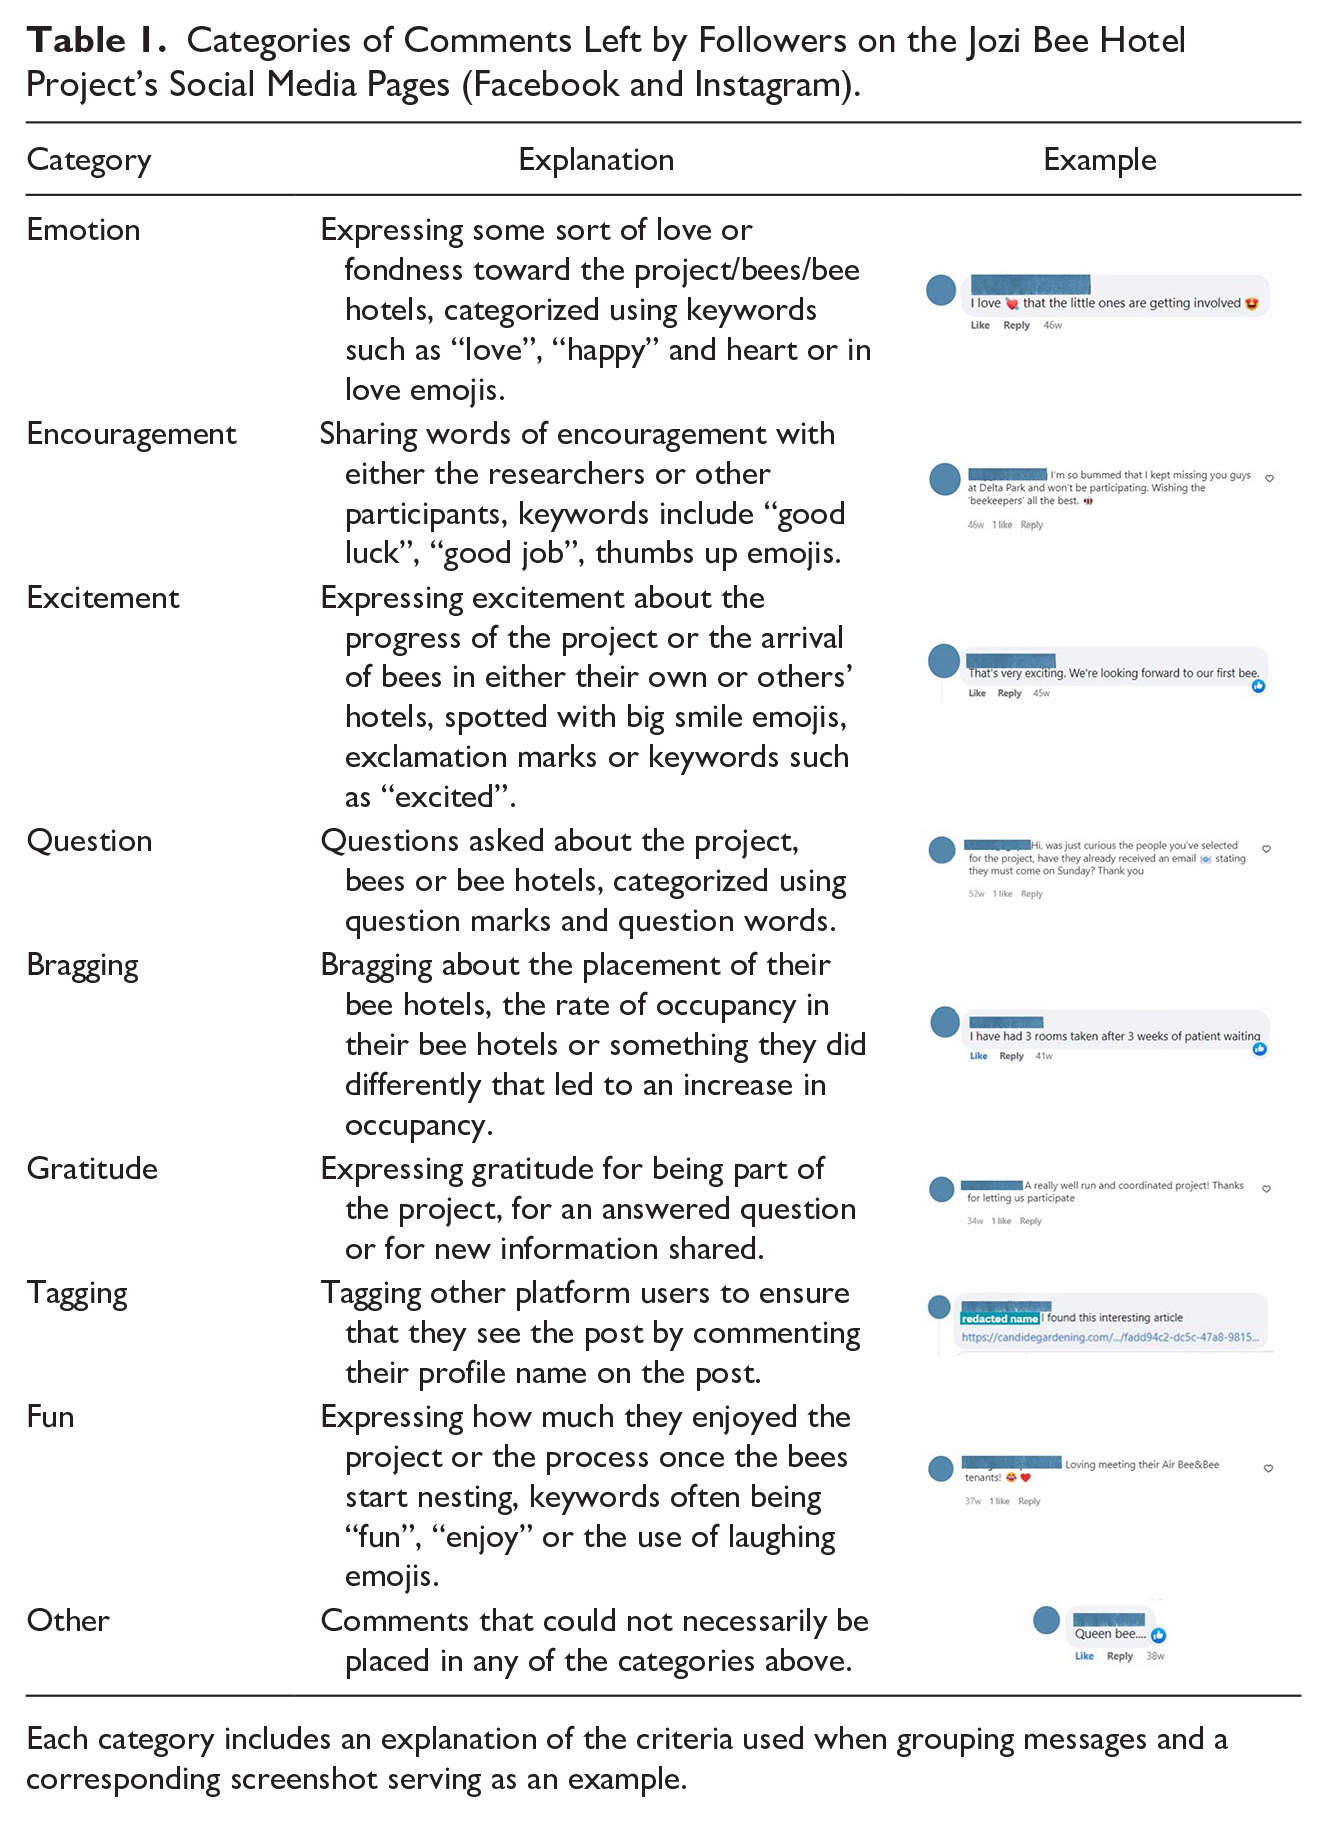
Each category includes an explanation of the criteria used when grouping messages and a corresponding screenshot serving as an example.
We recorded engagement manually by reviewing each Instagram and Facebook post and capturing the number of likes and comments to ensure the accuracy of our metrics on both social media platforms. Although this data set does not include all metrics such as shares, reach, and demographics, the trends presented here accurately represent the general pattern of activity on the pages. In 2016, Facebook developed more specific ways for users to express how much they like posts by including a drop-down menu of reactions, which were “love,” “wow,” “sad,” “haha,” and “angry.” For ease of analysis, all reactions have been compiled and recorded as likes because these are still collated and interpreted as likes by the platform.
The Jozi Bee Hotel Project’s social media data was recorded separately for Facebook and Instagram. Screenshots of each and every post were taken, which included all the comments left under each post, and were then saved as jpeg files, assigned a unique identification (ID) number, and saved in a folder named according to the post’s unique ID number and the date the post was published. With regard to posts that contained multiple pieces of media, that is, two or more media pieces in a single post, each media piece was assigned a corresponding unique ID number saved in the same folder, as stated above. The total number of likes and comments for each post were then entered into an excel spreadsheet. To calculate the total number of likes and comments for each media piece in a multiple-content piece post, we considered the total number of likes and comments for the entire post and fractioned that according to the number of media pieces in each post, for example, if a post with three media pieces (two infographics and one photograph) had seven likes, then the photograph would have 1/7th likes = 2.33 likes and the infographic would be 2/7th = 4.67 likes (totaling seven likes for the entire post). The same method was used for comments, and across both platforms. This approach was a practical method for determining proportional likes and comments as it is difficult to determine exactly which media pieces in a post are driving the responses. This summary spreadsheet of the online material and the reactions (likes and comments) contained each posts’ unique ID and details regarding the type of content posted, the comments left and the subject in the media posted. This was later used to create coding frameworks to categorize the content and comments for analysis (Table 1).
Three coding frameworks were developed to (a) group each piece of content according to multimedia type, that is, content type; (b) record the subject(s) in each multimedia piece in a post; and (c) categorize the types of comments left on each post according to the message expressed. Each multimedia piece from each post was coded as one of the four content types: photograph, infographic, video/reel, or gif (Figure 1). Photographs could encompass any photographic content of any subject; infographics are pictures and photos combined with informative text in frame; videos or reels are either recorded video content or a compilation of videos and pictures; and gifs are short, looped videos approximately 10 seconds or less, which also included map-based cumulative graphics. The subject in each multimedia piece was coded as bees, bee hotel, participant, observation, ecosystem service, map, and text only. These categories are parsimonious and carefully chosen to reflect the essential elements of our project and data set. Multiple subject codes were possible, for example, a photograph of a participant holding a bee hotel would fit into two of the categories outlined. The comments were grouped into nine categories: emotion, encouragement, excitement, question, bragging, gratitude, tagging, and fun (see Table 1 for examples of each category).
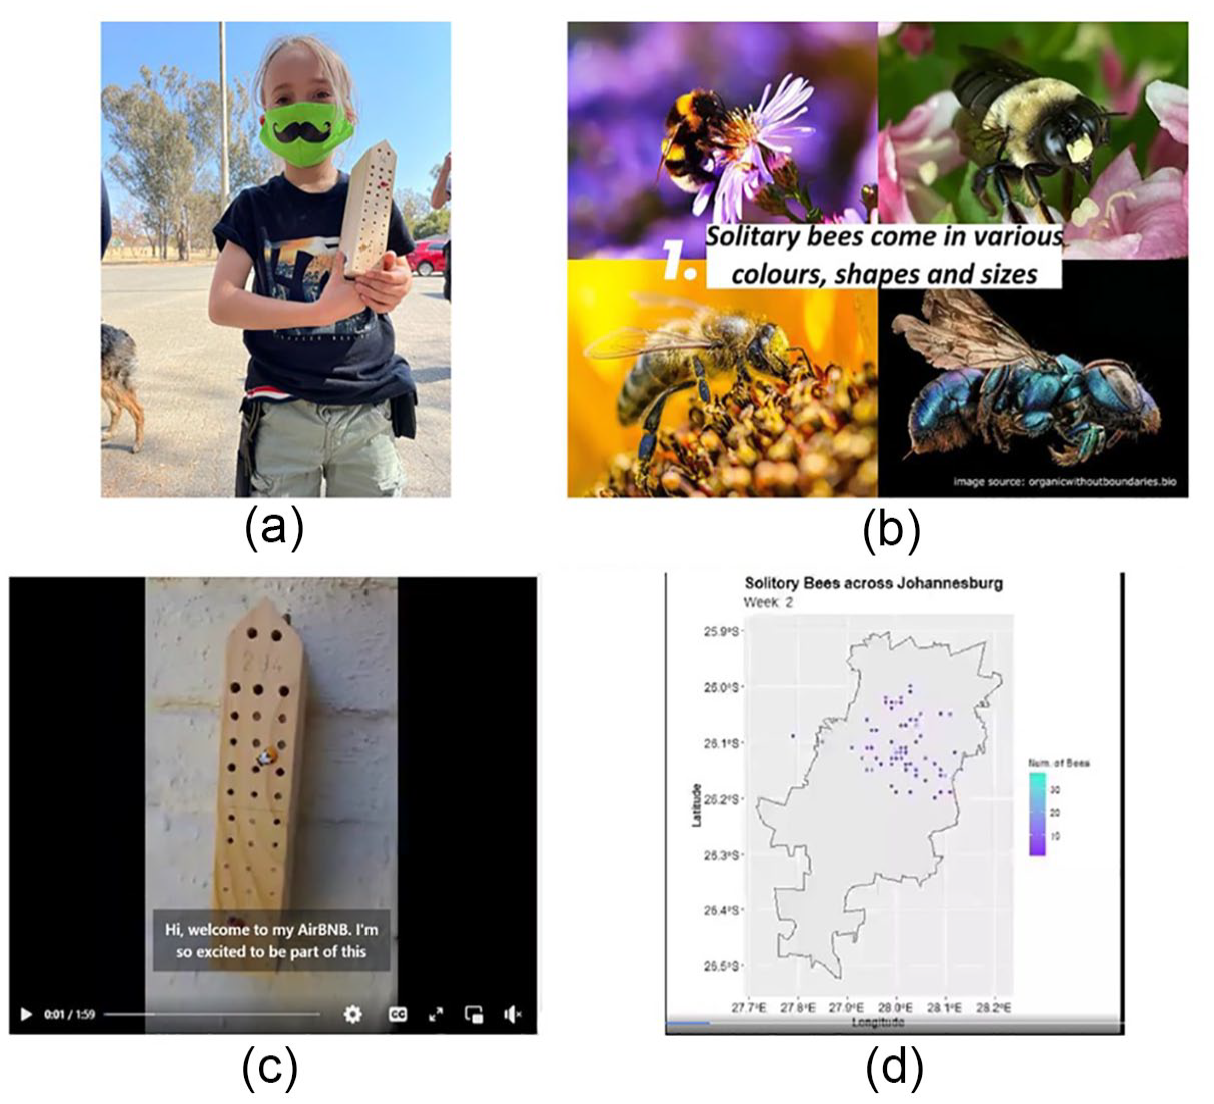
The Four Types of Content Published on the Jozi Bee Hotel Project’s Social Media Pages: (a) Photograph, (b) Infographic, (c) Video/Reel, and (d) gif.
Pivot tables were used to determine the number of posts and their respective content type(s), subject(s) and comment(s) as outlined in the various categories of the three coding frameworks described above. Summary statistics were calculated to describe the central tendency and spread of the metrics generated by each post (i.e., likes and comments) on a weekly basis, as well as over the duration of the project (Table 2). Thereafter, the top 10 liked posts from each platform were extracted to create a clearer picture of the type of content that attracted the most attention and engagement.
Summary Statistics Describing the Central Tendency and Spread of the Posts, Likes and Comments Data.
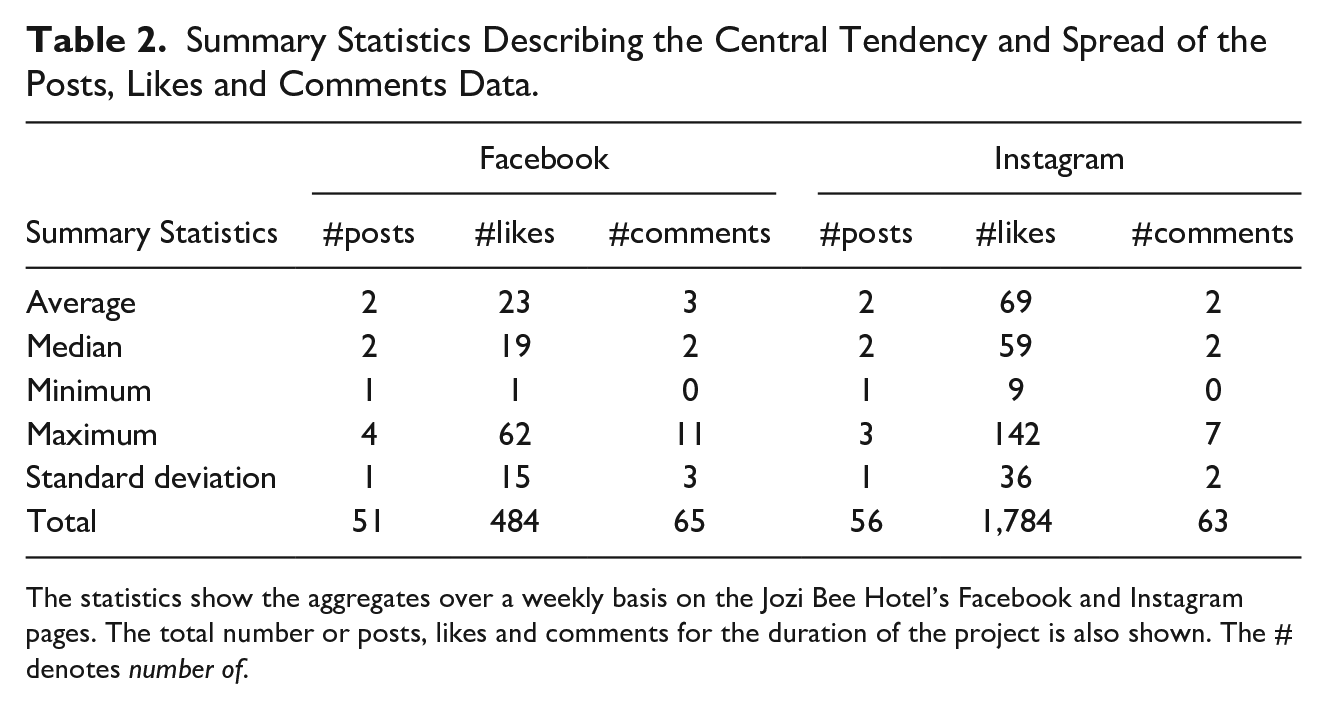
The statistics show the aggregates over a weekly basis on the Jozi Bee Hotel’s Facebook and Instagram pages. The total number or posts, likes and comments for the duration of the project is also shown. The # denotes number of.
To test for statistical differences in user engagement across the two social media platforms, chi-square tests for independence were conducted using the frequency data on likes and comments. The frequency data were also graphically depicted using bipartite chord diagrams from the circlize package (Gu et al., 2014). Chord diagrams are used to show direct relationships among a group of entities, in our case between the number of likes and comments and the two social media platforms of interest (Facebook and Instagram). The chord diagram depicts the strength of the relationships relative to the entire sample (Figures 2–4).
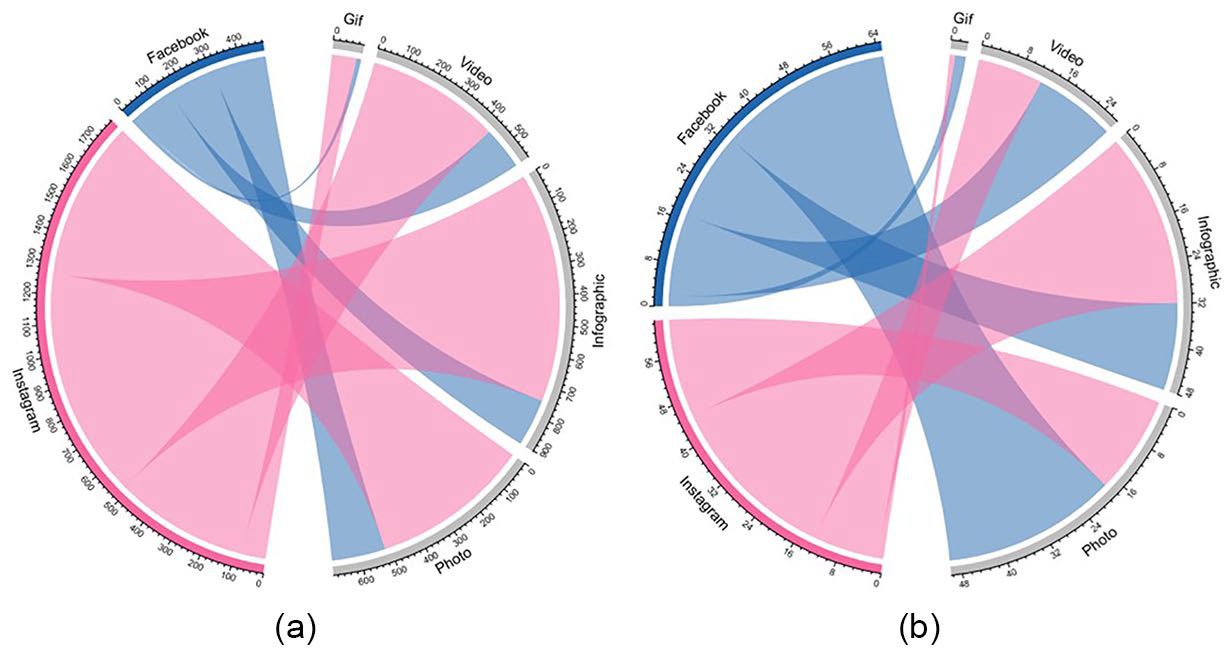
Chord Diagrams Depicting the Interrelationships Between the Jozi Bee Hotel’s Social Media Platforms, That Is, Facebook in Blue and Instagram in Pink.
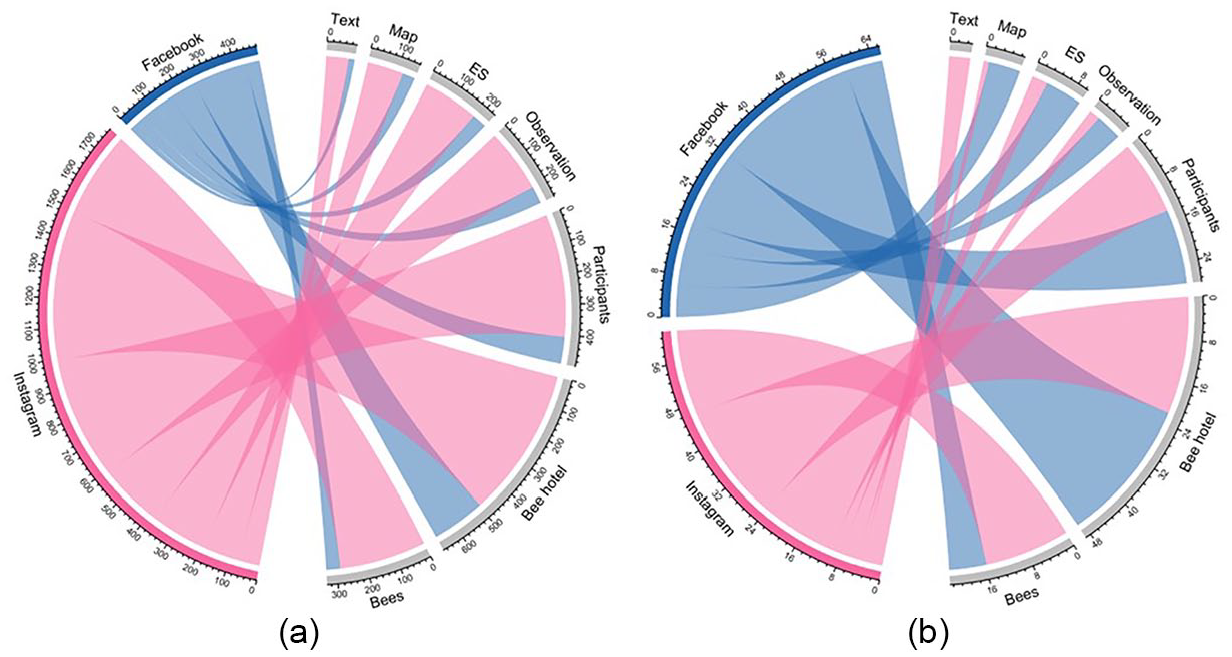
Chord Diagrams Depicting the Interrelationships Between the Jozi Bee Hotel’s Social Media Platforms, That Is, Facebook in Blue and Instagram in Pink.
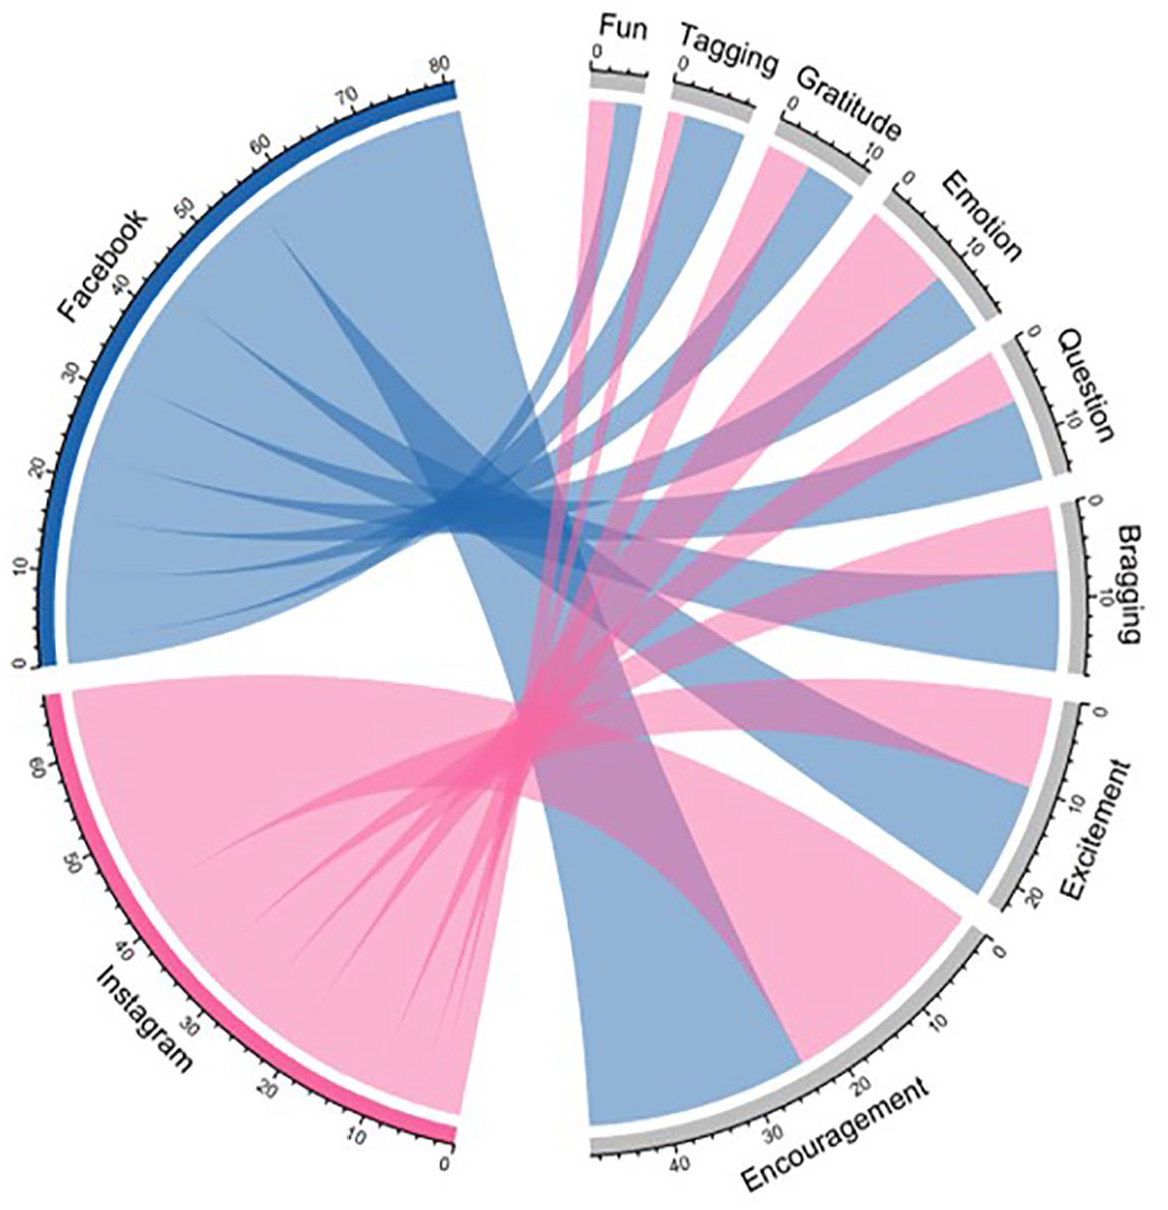
A Chord Diagram Showing the Interrelationships Between the Jozi Bee Hotel’s Social Media Platforms, That Is, Facebook in Blue and Instagram in Pink.
The ages of participants were acquired through the Insight feature on Facebook and Instagram, which provides estimates of various metrics. This feature allows account users to gain a clear understanding of how other accounts discover and interact with their page, the page audience and which content resonates with users the most. To determine our followers’ age demographics, we extracted the Top Age Range metric from Facebook and Instagram Insights, which calculates the total number of followers a page has and estimates the top ages of account followers. Thereafter we tabulated these values and created a bar graph to visualize the data.
Results: Engagement Statistics
During the Jozi Bee Hotel Project, the Facebook page gained 410 followers. We published a total of 51 posts, which varied in composition; 31 of these were single-content piece posts, while 20 contained multiple pieces of content (comprising two or more different types of content). This variability in the number of content pieces per post led to a total of 126 content pieces, exceeding the number of posts. These posts generated a total of 484 likes, with a weekly average of two posts, 23 likes, and three comments (Table 2). The Instagram page grew to 310 followers, with 56 posts published. Similar to Facebook, these posts comprised 34 single-content pieces and 22 multiple-content pieces, totaling 142 content pieces. These posts generated a total of 1784 likes and 63 comments, with a weekly average of two posts and two comments (Table 2). Notably, of the 51 posts made on Facebook, over 50% of the content was identical to that posted on Instagram, and 73% was similar in that the content type would be the same but (a) the caption on one platform differs from the other; (b) one platform had more content pieces in a post, for example, Facebook would have two photographs whereas Instagram would have five; and (c) Instagram would have a post containing a video and a photograph or infographic while Facebook would only have a video (Facebook does not allow users to post video content with other content types in a single post but Instagram does).
There was a significant difference in the types of content liked by followers between the two social media platforms (χ2 = 20.09, df = 3, p < .001). On Facebook, photographs were the most liked content type, followed by infographics, videos/reels and then gifs (Figure 2a). In contrast, on Instagram, infographics received the most likes, followed by photographs, videos/reels and finally gifs (Figure 2a). A similar significant trend was observed in the number of comments on both platforms (χ2 = 9.89, df = 3, p = .02), with photographs receiving the most comments on Facebook, followed by infographics, videos/reels and gifs. On Instagram, infographics again led in comments, followed by photographs, videos/reels, and gifs (Figure 2b).
There was a significant difference in the subjects liked by followers between the two social media platforms (χ2 = 25.90, df = 6, p < .001). On Facebook, the subject of bee hotels garnered the most likes, followed by participants, observations, ecosystem services, bees, map/city and text. On Instagram, the order differed slightly with bee hotels and participants still leading but followed by bees, observations, ecosystem services, map/city, and text (Figure 3a). The comments were also quantified to provide an indication of which subjects were most engaged with in the comments section. Again, there was a significant difference in the commenting pattern of the followers across the two social media platforms (χ2 = 14.38, df = 6, p = .03). On Facebook, the subject of bee hotels had the highest proportion of comments, followed by participants, bees, ecosystem services, map/city, and observations. Instagram comments mirrored this pattern, with bee hotels again receiving the most, followed by bees, participants, text, ecosystem services, observations, and map/city (Figure 3b).
The posts received various responses from participants and the comments left below each post conveyed a specific reaction and/or feeling. The nature of the comments varied across the two platforms, although the overall sentiment was similar (χ2 = 4.01, df = 7, p = .78). On Facebook, comments were primarily expressions of encouragement, excitement, bragging, questions, tagging, emotion, gratitude, and fun (Figure 4). Instagram comments showed a similar trend, with encouragement being most common, followed by emotion, excitement, bragging, questions, gratitude, fun, and tagging (Figure 4).
To understand the preferred content and imagery, we analyzed the top 10 liked posts on each platform. On Facebook, four of these posts were photographs, followed by infographics and videos. The most liked subjects were bee hotels (50%), bees (20%), and observations (20%). On Instagram, reels were the leading content type, followed by infographics and photographs. The subjects mirrored those on Facebook, with bee hotels (40%), bees (40%), and observations (10%) being most common. Notably, most content in these top posts originated from participants.
The participant profiles differed between the two platforms, with Facebook attracting a slightly older demographic than Instagram. The age ranges on Facebook are skewed to the right, peaking at 35 to 44 with a slight decline from ages 45 to 65+. On Instagram, age ranges are skewed to the left, peaking at 25 to 34, with an incline from 13 to 24 followed by a steep decline from 35 to 44 (Figure 5). This indicates that different social groups are reached through each platform.
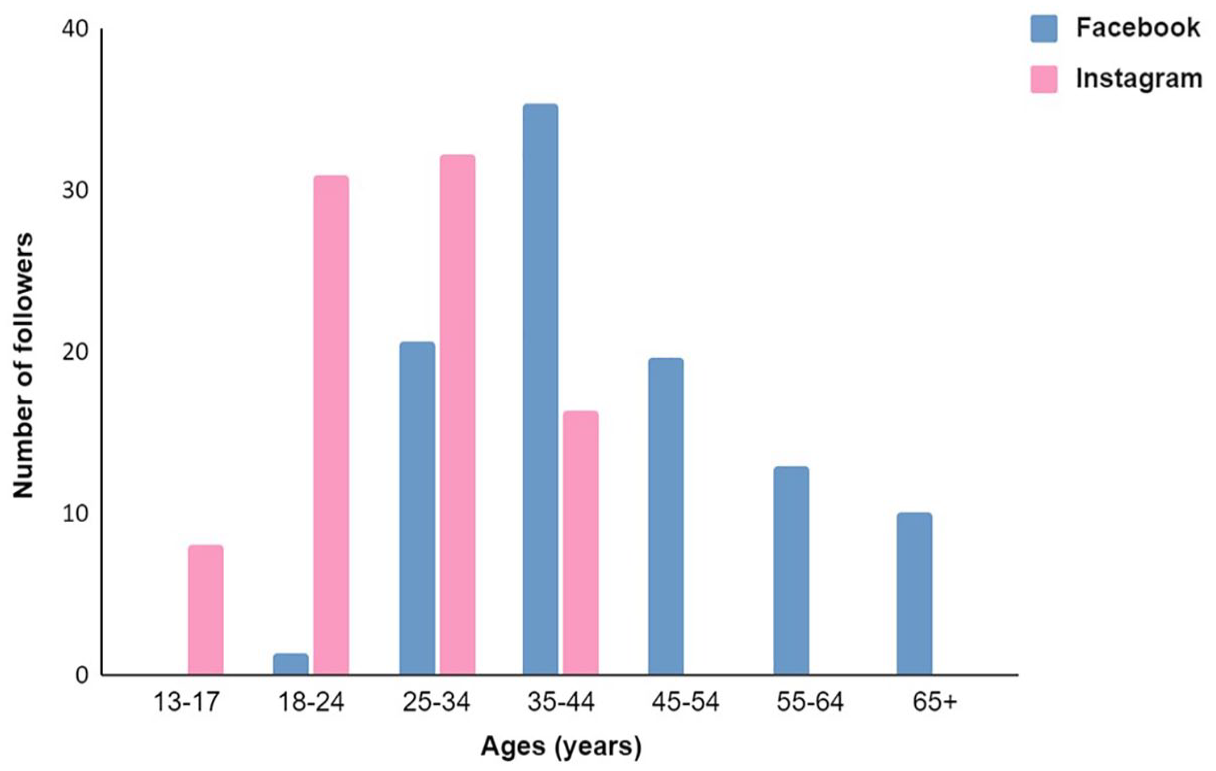
The Most Common Age Groups Accounted for by the Jozi Bee Hotel Facebook (Blue) and Instagram (Pink) Page Followers, Ranging From 13 to 65 Years Old, With Facebook Skewed to the Right and Instagram to the Left.
Discussion
The engagement statistics quantitatively show that social media played a key role in recruiting and retaining volunteers for the Jozi Bee Hotel project (JBHP). Specifically, the increase in followers, likes, and comments on both platforms is not only indicative of growing interest but also correlates with the type and nature of content shared. Popular content was interacted with a lot, and this underscores the sense of participation and inclusion. In line with our prediction that project-related content would have the highest engagement, the subjects of bee hotels and participants garnered the most attention across both platforms. In addition, photographs and infographics appear to be the most effective media, possibly because they better showcased the bee hotels and participants as subjects more frequently. Thus, carefully chosen content and media are essential for fostering engagement and facilitating dialogue, and our results suggest that a carefully crafted social media campaign should prioritize content that appeals the most to participants. Surprisingly, the theme of discussions on the two platforms were very similar, despite slight differences in the media and subjects preferred. This suggests that both platforms, although serving different communities, often reflect similar sentiments, indicating that certain themes are universally relevant and can connect diverse groups. In addition, using two different social media platforms enabled the JBHP to reach different age groups. Using multiple social media platforms can enable scientists to encourage engagement, for example, persuading audiences with low engagement in science to contribute data and/or commentary, when they otherwise might not have and while allowing scientists to transition between communities and contexts (Grand et al., 2016).
Both Facebook and Instagram profiles saw a steady increase in the number of followers throughout the project, reaching 410 and 310 followers, respectively, which indicates that the JBHP social media campaign was successful in recruiting and retaining followers. This is supported by Teague and colleagues (2018) who discovered that studies making greater use of social media had higher participant retention rates. JBHP engagement data show that social media played a role in retaining and supporting those who were already actively participating (Thomas et al., 2020). The most popular content was largely participant-generated, which was re-shared by project page administrators. This reveals the power of conversational, two-way flows of content between scientists and participants to attract and retain interest in biodiversity research. The content of the most popular material serves as a qualitative indicator of the interactive potential of dialogic science communication.
The total number of likes, 1,784 on Instagram and 484 on Facebook, serve as a quantitative indicator of user engagement and enthusiasm. On social media, “likes” are viewed as a form of social currency, indicating enthusiasm for the material posted, and are therefore an important indicator of user engagement (Habibi & Salim, 2021; Maltese et al., 2014; Rosenthal-von der Pütten et al., 2019). The fact that our Instagram profile had 1,300 more likes than our Facebook profile could be attributed to the Instagram algorithm favoring and promoting reel content over other types of content (Bhatia et al., 2022). Reels accounted for 40% of the top 10 liked Instagram posts, despite infographics having the highest proportion of aggregated likes. This indicates that the JBHP social media activity reached people not actively participating in the project, thus helping to democratize information, improve environmental citizenship and scientific education (Bonney et al., 2016).
While investigating the efficacy of delivery for science communication, Habibi and Salim (2021) discovered that 40 to 60 seconds long videos that include hands-on demonstrations and experimental steps received the most views and likes on Instagram. Ambrose-Oji and colleagues (2014) found that infographics, videos, and maps are popular visual media for citizen science social media pages. Our social media engagement metrics confirm both findings: educational posts about the subject of the project were popular, as were videos (reels on Instagram), photographs, and infographics. Habibi and Salim’s (2021) findings suggest that an overreliance on static images could be detrimental to driving participation in a science communication project. Our results support that when incorporating social media into a citizen science project, it is advisable to post more video and animated content. Furthermore, participants and participant-generated content should also be well featured.
Social media should capture people’s attention, which necessitates striking a balance between consistency and excitement (Wenger et al., 2002). The Jozi Bee Hotel Project’s social media pages accomplished this by intentionally diversifying content type and subject matter in the posts, so that it ranged from the familiar and/or expected (i.e., informative/educational posts about solitary bees and bee hotels in the form of infographics and pictures) to the exciting (i.e., participants sharing their progress and animated gifs showing solitary bee abundance after certain weather or environmental changes). We found that posts containing bee hotels, bees, and participants received significantly more likes and comments, which we believe is due to the content being project specific. When more human-centered content was published, it sparked a lot of interest; for example, participants shared their perspectives on the emotional rollercoaster of being a part of such a project (which we discuss elsewhere), and their experience of parasitic wasps raiding their bee hotels. Social media content also played a reassuring role in that participants knew that they could look to the social media pages for information that could help them navigate their participation in the project. According to Wenger et al. (2002), exciting content initially attracts new members and is critical in keeping a community of practice active. Unfamiliar content can pique interest, for example, when new “occupants” find their way to a bee hotel, everyone could share in the delight and enthusiasm. Whereas familiar content is important for newcomers because it provides an easy entry point into conversations. The familiar-to-exciting contrast enables a continuous cycle of recruitment and retention, which is invaluable in a citizen science project.
The discourse in the social media comment sections show that the Jozi Bee Hotel Project appealed to the core motivations of environmental volunteers (Bruyere & Rappe, 2007). The first motivation is the need to help conserve the environment, with one comment stating, “Nature is always the Sweetest Beespiration.” The second motivation is the desire to learn, evident in followers explicitly asking us to “Please provide some info on the different types of bees that use the different materials to seal the holes . . .” and commenting, “I’m learning more and more every day about these fabulous little chaps. I had no idea there were so many different types, shapes and sizes.” Learning is an important advantage of volunteering, those who learn are more inclined to continue volunteering. Learning outcomes should therefore be actively incorporated into citizen science initiatives (Bela et al., 2016; Bruyere & Rappe, 2007). Another motivator is the desire for social interaction, allowing participants to meet others who share their ideas and values, and thus leaving comments like “. . . I’m glad I’m not the only one . . .” Volunteers seek out programs that make the best use of their time, with “project organisation” identified as the fifth motivation in Bruyere and Rappe’s (2007) findings. Individuals are motivated to be a part of a well-organized program, as comments stated: “Wow you organised and put everything together so well—very excited to start on 1 Sep” and “It’s a privilege to be part of this project . . .” Masters’ et al. (2016) discovered that online citizen science programs with strong communication from the researchers and a well thought out public engagement strategy have higher levels of active participation and learning outcomes than projects that do not.
According to Lee and VanDyke (2015), dialogic communication strategies are a necessity when practising science communication. The sharing of thoughts and views results in shared meaning between the communicating parties (Kent & Taylor, 1998). Dialogue has positive outcomes for organizations by facilitating conversation and thus inviting feedback; and providing scientific institutions with the opportunity to listen to the public and identify points of conflict or miscommunication and/or misunderstanding. These pinch points can then be clarified and should ultimately aid in the public’s comprehension of science (Lee and VanDyke, 2015; Yang et al., 2010). For example, JBHP participants shared their opinions regarding the placement of the bee hotels, which went against the researchers’ recommendations but resulted in almost immediate occupancy of their bee hotels. This dialogue resulted in the researchers adjusting their recommendations on bee hotel placement and relaying that message through the established social media platforms. Furthermore, social media offer an opportunity to create forms of dialogue and exchange which bring benefit to both citizen-scientists and scientists.
Conclusion
In this article, we discussed the steps taken to establish active and supportive Jozi Bee Hotel Facebook and Instagram pages, as well as the content used to recruit volunteers and retain the participants’ interest. We have analyzed engagement metrics to illuminate which types of content were most effective in recruiting and retaining citizen scientist participation and creating a sense of exchange and dialogue. This article has addressed the short-term outcomes of a 7-month long social media campaign; thus, limiting our ability to comment on longer-term social media engagement and longitudinal effects on study participation. Nevertheless, our findings point to the value that can be added by strategic science communication using social media to the scientific goals of a research project. We argue that citizen science research benefits when scientists integrate communication strategies and social media tools into the design of the project at the outset, rather than see communication as “add-ons” to serve dissemination and public engagement. Future evaluations of social media as a recruitment and retention tool in citizen science projects would be strengthened by identifying target audiences and better understanding the audiences’ interests and practices on different platforms, and strategically considering the content type that will foster the preferred engagement beforehand. This will allow for more dialogic and interactive forms of communication to emerge, rather than a privileging of information flows from scientist to citizen. Researchers should let their project’s goals and target audience guide them to the platform that will be most useful to them and should approach content creation purposely to invite engagement and interaction. Our analysis of social media engagement for the Jozi Bee Hotel project makes it clear that social media can be used to recruit volunteers for a citizen science initiative and to retain those recruits throughout the project’s duration. It could be concluded that a long-term social media campaign has the potential to drive citizen science participation granted that it is run strategically and consistently.
Footnotes
Declaration of Conflicting Interests
The author(s) declared no potential conflicts of interest with respect to the research, authorship, and/or publication of this article.
Funding
The author(s) disclosed receipt of the following financial support for the research, authorship, and/or publication of this article: This work was funded by the Friedel Sellschop Research Award, granted to CR from the Univeristy of the Witwatersrand.